Embed Size (px)
Citation preview
PGI Debugger User's Guide
Version 2016
PGI Compilers and Tools
PGI Debugger User's Guide ii
TABLE OF CONTENTS
Preface.................................................................................................................................................................................. xiiIntended Audience.............................................................................................................................................................xiiDocumentation................................................................................................................................................................... xiiCompatibility and Conformance to Standards.................................................................................................................. xiiOrganization...................................................................................................................................................................... xiiiConventions...................................................................................................................................................................... xivTerminology........................................................................................................................................................................xvRelated Publications..........................................................................................................................................................xv
Chapter 1. Getting Started....................................................................................................................................................11.1. Definition of Terms...................................................................................................................................................... 11.2. Building Applications for Debug.................................................................................................................................. 2
1.2.1. Debugging Optimized Code.................................................................................................................................21.2.2. Building for Debug on Windows..........................................................................................................................2
1.3. User Interfaces............................................................................................................................................................ 21.3.1. Command Line Interface (CLI)............................................................................................................................ 21.3.2. Graphical User Interface......................................................................................................................................2
1.4. Co-installation Requirements.......................................................................................................................................31.4.1. Java Virtual Machine........................................................................................................................................... 3
1.5. Start Debugging...........................................................................................................................................................31.6. Program Load..............................................................................................................................................................41.7. Initialization Files......................................................................................................................................................... 41.8. Program Architecture...................................................................................................................................................4
Chapter 2. The Graphical User Interface............................................................................................................................ 52.1. Main Components........................................................................................................................................................52.2. Source Window........................................................................................................................................................... 6
2.2.1. Source and Assembly Displays...........................................................................................................................72.2.2. Source Window Context Menu............................................................................................................................7
2.3. Main Toolbar................................................................................................................................................................ 82.3.1. Buttons................................................................................................................................................................. 82.3.2. Drop-Down Lists.................................................................................................................................................. 9
2.4. Program I/O Window...................................................................................................................................................92.5. Debug Information Tabs............................................................................................................................................ 10
2.5.1. Command Tab....................................................................................................................................................102.5.2. Events Tab......................................................................................................................................................... 112.5.3. Groups Tab........................................................................................................................................................ 112.5.4. Connections Tab................................................................................................................................................ 122.5.5. Call Stack Tab....................................................................................................................................................132.5.6. Locals Tab..........................................................................................................................................................132.5.7. Memory Tab....................................................................................................................................................... 142.5.8. MPI Messages Tab............................................................................................................................................ 15
PGI Debugger User's Guide iii
2.5.9. Procs & Threads Tab.........................................................................................................................................152.5.10. Registers Tab................................................................................................................................................... 162.5.11. Status Tab........................................................................................................................................................ 17
2.6. Menu Bar................................................................................................................................................................... 182.6.1. File Menu........................................................................................................................................................... 182.6.2. Edit Menu...........................................................................................................................................................182.6.3. View Menu......................................................................................................................................................... 192.6.4. Connections Menu............................................................................................................................................. 202.6.5. Debug Menu...................................................................................................................................................... 202.6.6. Help Menu..........................................................................................................................................................21
Chapter 3. Command Line Options...................................................................................................................................223.1. Command-Line Options Syntax................................................................................................................................ 223.2. Command-Line Options.............................................................................................................................................223.3. Command-Line Options for MPI Debugging............................................................................................................. 233.4. I/O Redirection...........................................................................................................................................................23
Chapter 4. Command Language........................................................................................................................................ 244.1. Command Overview.................................................................................................................................................. 24
4.1.1. Command Syntax.............................................................................................................................................. 244.1.2. Command Modes...............................................................................................................................................24
4.2. Constants...................................................................................................................................................................254.3. Symbols..................................................................................................................................................................... 254.4. Scope Rules.............................................................................................................................................................. 254.5. Register Symbols.......................................................................................................................................................254.6. Source Code Locations............................................................................................................................................. 264.7. Lexical Blocks............................................................................................................................................................264.8. Statements.................................................................................................................................................................274.9. Events........................................................................................................................................................................ 28
4.9.1. Event Commands.............................................................................................................................................. 284.9.2. Event Command Action.....................................................................................................................................29
4.10. Expressions..............................................................................................................................................................304.11. Ctrl+C....................................................................................................................................................................... 31
4.11.1. Command-Line Debugging.............................................................................................................................. 314.11.2. GUI Debugging................................................................................................................................................ 324.11.3. MPI Debugging................................................................................................................................................ 32
Chapter 5. Command Summary.........................................................................................................................................335.1. Notation Used in Command Sections.......................................................................................................................335.2. Command Summary..................................................................................................................................................33
Chapter 6. Assembly-Level Debugging.............................................................................................................................456.1. Assembly-Level Debugging Overview.......................................................................................................................45
6.1.1. Assembly-Level Debugging on Windows.......................................................................................................... 456.1.2. Assembly-Level Debugging with Fortran...........................................................................................................466.1.3. Assembly-Level Debugging with C++................................................................................................................466.1.4. Assembly-Level Debugging Using the PGDBG GUI......................................................................................... 46
PGI Debugger User's Guide iv
6.1.5. Assembly-Level Debugging Using the PGDBG CLI..........................................................................................466.2. SSE Register Symbols.............................................................................................................................................. 47
Chapter 7. Source-Level Debugging................................................................................................................................. 497.1. Debugging Fortran.....................................................................................................................................................49
7.1.1. Fortran Types.....................................................................................................................................................497.1.2. Arrays................................................................................................................................................................. 497.1.3. Operators........................................................................................................................................................... 497.1.4. Name of the Main Routine................................................................................................................................ 507.1.5. Common Blocks.................................................................................................................................................507.1.6. Internal Procedures............................................................................................................................................507.1.7. Modules..............................................................................................................................................................517.1.8. Module Procedures............................................................................................................................................51
7.2. Debugging C++......................................................................................................................................................... 527.2.1. Calling C++ Instance Methods.......................................................................................................................... 52
Chapter 8. Platform-Specific Features.............................................................................................................................. 538.1. Pathname Conventions............................................................................................................................................. 538.2. Debugging with Core Files........................................................................................................................................538.3. Signals....................................................................................................................................................................... 55
8.3.1. Signals Used Internally by PGDBG...................................................................................................................558.3.2. Signals Used by Linux Libraries........................................................................................................................55
Chapter 9. Parallel Debugging Overview..........................................................................................................................569.1. Overview of Parallel Debugging Capability...............................................................................................................56
9.1.1. Graphical Presentation of Threads and Processes...........................................................................................569.2. Basic Process and Thread Naming.......................................................................................................................... 569.3. Thread and Process Grouping and Naming............................................................................................................. 57
9.3.1. PGDBG Debug Modes...................................................................................................................................... 579.3.2. Threads-only Debugging....................................................................................................................................589.3.3. Process-only Debugging....................................................................................................................................589.3.4. Multilevel Debugging..........................................................................................................................................58
9.4. Process/Thread Sets................................................................................................................................................. 599.4.1. Named p/t-sets...................................................................................................................................................599.4.2. p/t-set Notation...................................................................................................................................................599.4.3. Dynamic vs. Static p/t-sets................................................................................................................................ 609.4.4. Current vs. Prefix p/t-set....................................................................................................................................619.4.5. p/t-set Commands..............................................................................................................................................619.4.6. Using Process/Thread Sets in the GUI............................................................................................................. 62
9.4.6.1. Create a p/t-set.......................................................................................................................................... 639.4.6.2. Select a p/t-set...........................................................................................................................................649.4.6.3. Modify a p/t-set.......................................................................................................................................... 649.4.6.4. Remove a p/t-set....................................................................................................................................... 64
9.4.7. p/t-set Usage......................................................................................................................................................649.5. Command Set............................................................................................................................................................65
9.5.1. Process Level Commands.................................................................................................................................65
PGI Debugger User's Guide v
9.5.2. Thread Level Commands.................................................................................................................................. 659.5.3. Global Commands............................................................................................................................................. 66
9.6. Process and Thread Control..................................................................................................................................... 679.7. Configurable Stop Mode............................................................................................................................................679.8. Configurable Wait Mode............................................................................................................................................689.9. Status Messages....................................................................................................................................................... 709.10. The PGDBG Command Prompt..............................................................................................................................719.11. Parallel Events......................................................................................................................................................... 719.12. Parallel Statements..................................................................................................................................................72
9.12.1. Parallel Compound/Block Statements............................................................................................................. 729.12.2. Parallel If, Else Statements............................................................................................................................. 739.12.3. Parallel While Statements................................................................................................................................739.12.4. Return Statements........................................................................................................................................... 73
Chapter 10. Parallel Debugging with OpenMP.................................................................................................................7410.1. OpenMP and Multi-thread Support......................................................................................................................... 7410.2. Multi-thread and OpenMP Debugging.....................................................................................................................7410.3. Debugging OpenMP Private Data...........................................................................................................................75
Chapter 11. Parallel Debugging with MPI......................................................................................................................... 7711.1. MPI and Multi-Process Support...............................................................................................................................7711.2. MPI on Linux........................................................................................................................................................... 7711.3. MPI on macOS........................................................................................................................................................ 7711.4. MPI on Windows......................................................................................................................................................7811.5. Deprecated Support for MPICH1, MPICH2, MVAPICH1.........................................................................................7811.6. Building an MPI Application for Debugging.............................................................................................................7811.7. The MPI Launch Program....................................................................................................................................... 78
11.7.1. Launch Debugging Using the Connection Tab................................................................................................ 7811.7.2. Launch Debugging From the Command Line................................................................................................. 7911.7.3. MPICH.............................................................................................................................................................. 7911.7.4. MS-MPI.............................................................................................................................................................7911.7.5. MVAPICH2........................................................................................................................................................7911.7.6. Open MPI......................................................................................................................................................... 8011.7.7. SGI MPI............................................................................................................................................................80
11.8. Process Control....................................................................................................................................................... 8111.9. Process Synchronization......................................................................................................................................... 8211.10. MPI Message Queues........................................................................................................................................... 8211.11. MPI Groups............................................................................................................................................................ 8211.12. Use halt instead of Ctrl+C.....................................................................................................................................8211.13. SSH and RSH........................................................................................................................................................8311.14. Using the CLI.........................................................................................................................................................84
11.14.1. Setting DISPLAY............................................................................................................................................ 8411.14.2. Using Continue...............................................................................................................................................84
Chapter 12. Parallel Debugging of Hybrid Applications................................................................................................. 8512.1. PGDBG Multilevel Debug Mode..............................................................................................................................85
PGI Debugger User's Guide vi
12.2. Multilevel Debugging............................................................................................................................................... 85Chapter 13. Command Reference......................................................................................................................................87
13.1. Notation Used in Command Sections.....................................................................................................................8713.2. Process Control....................................................................................................................................................... 88
13.2.1. attach................................................................................................................................................................8813.2.2. cont...................................................................................................................................................................8813.2.3. debug............................................................................................................................................................... 8913.2.4. detach...............................................................................................................................................................8913.2.5. halt....................................................................................................................................................................8913.2.6. load...................................................................................................................................................................8913.2.7. next...................................................................................................................................................................8913.2.8. nexti..................................................................................................................................................................8913.2.9. proc.................................................................................................................................................................. 8913.2.10. procs...............................................................................................................................................................8913.2.11. quit..................................................................................................................................................................9013.2.12. rerun............................................................................................................................................................... 9013.2.13. run.................................................................................................................................................................. 9013.2.14. setargs............................................................................................................................................................9013.2.15. step.................................................................................................................................................................9013.2.16. stepi................................................................................................................................................................9013.2.17. stepout............................................................................................................................................................9013.2.18. sync................................................................................................................................................................ 9113.2.19. synci............................................................................................................................................................... 9113.2.20. thread............................................................................................................................................................. 9113.2.21. threads........................................................................................................................................................... 9113.2.22. wait................................................................................................................................................................. 91
13.3. Process-Thread Sets............................................................................................................................................... 9113.3.1. defset................................................................................................................................................................9113.3.2. focus.................................................................................................................................................................9113.3.3. undefset............................................................................................................................................................9213.3.4. viewset............................................................................................................................................................. 9213.3.5. whichsets..........................................................................................................................................................92
13.4. Events...................................................................................................................................................................... 9213.4.1. break................................................................................................................................................................ 9213.4.2. breaki................................................................................................................................................................9313.4.3. breaks...............................................................................................................................................................9413.4.4. catch.................................................................................................................................................................9413.4.5. clear..................................................................................................................................................................9413.4.6. delete................................................................................................................................................................9413.4.7. disable.............................................................................................................................................................. 9413.4.8. do..................................................................................................................................................................... 9413.4.9. doi.....................................................................................................................................................................9513.4.10. enable.............................................................................................................................................................95
PGI Debugger User's Guide vii
13.4.11. hwatch............................................................................................................................................................ 9513.4.12. hwatchboth..................................................................................................................................................... 9513.4.13. hwatchread.....................................................................................................................................................9613.4.14. ignore............................................................................................................................................................. 9613.4.15. status..............................................................................................................................................................9613.4.16. stop.................................................................................................................................................................9613.4.17. stopi................................................................................................................................................................9613.4.18. trace............................................................................................................................................................... 9713.4.19. tracei...............................................................................................................................................................9713.4.20. track................................................................................................................................................................9713.4.21. tracki...............................................................................................................................................................9713.4.22. unbreak.......................................................................................................................................................... 9713.4.23. unbreaki..........................................................................................................................................................9813.4.24. watch.............................................................................................................................................................. 9813.4.25. watchi............................................................................................................................................................. 9813.4.26. when...............................................................................................................................................................9813.4.27. wheni.............................................................................................................................................................. 99
13.5. Program Locations...................................................................................................................................................9913.5.1. arrive................................................................................................................................................................ 9913.5.2. cd......................................................................................................................................................................9913.5.3. disasm.............................................................................................................................................................. 9913.5.4. edit....................................................................................................................................................................9913.5.5. file...................................................................................................................................................................10013.5.6. lines................................................................................................................................................................ 10013.5.7. list...................................................................................................................................................................10013.5.8. pwd.................................................................................................................................................................10013.5.9. stackdump...................................................................................................................................................... 10013.5.10. stacktrace..................................................................................................................................................... 10113.5.11. where............................................................................................................................................................10113.5.12. /.................................................................................................................................................................... 10113.5.13. ?................................................................................................................................................................... 101
13.6. Printing Variables and Expressions.......................................................................................................................10113.6.1. print................................................................................................................................................................ 10113.6.2. printf............................................................................................................................................................... 10213.6.3. ascii................................................................................................................................................................ 10313.6.4. bin...................................................................................................................................................................10313.6.5. dec..................................................................................................................................................................10313.6.6. display............................................................................................................................................................ 10313.6.7. hex..................................................................................................................................................................10313.6.8. oct...................................................................................................................................................................10313.6.9. string...............................................................................................................................................................10313.6.10. undisplay...................................................................................................................................................... 104
13.7. Symbols and Expressions..................................................................................................................................... 104
PGI Debugger User's Guide viii
13.7.1. assign............................................................................................................................................................. 10413.7.2. call..................................................................................................................................................................10413.7.3. declaration......................................................................................................................................................10513.7.4. entry............................................................................................................................................................... 10513.7.5. lval..................................................................................................................................................................10513.7.6. rval..................................................................................................................................................................10513.7.7. set...................................................................................................................................................................10513.7.8. sizeof.............................................................................................................................................................. 10613.7.9. type.................................................................................................................................................................106
13.8. Scope.....................................................................................................................................................................10613.8.1. class............................................................................................................................................................... 10613.8.2. classes........................................................................................................................................................... 10713.8.3. decls............................................................................................................................................................... 10713.8.4. down...............................................................................................................................................................10713.8.5. enter............................................................................................................................................................... 10713.8.6. files.................................................................................................................................................................10713.8.7. global..............................................................................................................................................................10713.8.8. names.............................................................................................................................................................10713.8.9. scope..............................................................................................................................................................10713.8.10. up................................................................................................................................................................. 10813.8.11. whereis......................................................................................................................................................... 10813.8.12. which............................................................................................................................................................ 108
13.9. Register Access.....................................................................................................................................................10813.9.1. fp.................................................................................................................................................................... 10813.9.2. pc....................................................................................................................................................................10813.9.3. regs................................................................................................................................................................ 10813.9.4. retaddr............................................................................................................................................................ 10813.9.5. sp....................................................................................................................................................................109
13.10. Memory Access................................................................................................................................................... 10913.10.1. cread............................................................................................................................................................ 10913.10.2. dread............................................................................................................................................................ 10913.10.3. dump............................................................................................................................................................ 10913.10.4. fread............................................................................................................................................................. 11013.10.5. iread............................................................................................................................................................. 11013.10.6. lread............................................................................................................................................................. 11013.10.7. mqdump....................................................................................................................................................... 11013.10.8. sread............................................................................................................................................................ 110
13.11. Conversions......................................................................................................................................................... 11013.11.1. addr.............................................................................................................................................................. 11113.11.2. function......................................................................................................................................................... 11113.11.3. line................................................................................................................................................................ 111
13.12. Target................................................................................................................................................................... 11113.12.1. connect.........................................................................................................................................................111
PGI Debugger User's Guide ix
13.12.2. disconnect.................................................................................................................................................... 11213.12.3. native............................................................................................................................................................112
13.13. Miscellaneous...................................................................................................................................................... 11213.13.1. alias.............................................................................................................................................................. 11213.13.2. directory........................................................................................................................................................11213.13.3. help...............................................................................................................................................................11313.13.4. history...........................................................................................................................................................11313.13.5. language.......................................................................................................................................................11313.13.6. log.................................................................................................................................................................11313.13.7. noprint.......................................................................................................................................................... 11313.13.8. pgienv...........................................................................................................................................................11413.13.9. repeat........................................................................................................................................................... 11513.13.10. script...........................................................................................................................................................11613.13.11. setenv......................................................................................................................................................... 11613.13.12. shell............................................................................................................................................................ 11613.13.13. sleep...........................................................................................................................................................11613.13.14. source.........................................................................................................................................................11613.13.15. unalias........................................................................................................................................................ 11613.13.16. use..............................................................................................................................................................116
Chapter 14. Contact Information......................................................................................................................................117
PGI Debugger User's Guide x
LIST OF FIGURES
Figure 1 Default Appearance of PGDBG GUI ..................................................................................................................... 5
Figure 2 Source Window ...................................................................................................................................................... 6
Figure 3 Context Menu .........................................................................................................................................................8
Figure 4 Buttons on Toolbar .................................................................................................................................................8
Figure 5 Drop-Down Lists on Toolbar .................................................................................................................................. 9
Figure 6 Program I/O Window ............................................................................................................................................10
Figure 7 Command Tab ......................................................................................................................................................11
Figure 8 Events Tab ........................................................................................................................................................... 11
Figure 9 Groups Tab ...........................................................................................................................................................12
Figure 10 Connections Tab .................................................................................................................................................12
Figure 11 Call Stack Tab .................................................................................................................................................... 13
Figure 12 Call Stack Outside Current Frame .....................................................................................................................13
Figure 13 Locals Tab .......................................................................................................................................................... 14
Figure 14 Memory Tab ........................................................................................................................................................14
Figure 15 Memory Tab in Decimal Format ........................................................................................................................ 15
Figure 16 MPI Messages Tab ............................................................................................................................................ 15
Figure 17 Process (Thread) Grid Tab ................................................................................................................................ 16
Figure 18 General Purpose Registers ................................................................................................................................17
Figure 19 Status Tab .......................................................................................................................................................... 18
Figure 20 Groups Tab .........................................................................................................................................................63
Figure 21 Process/Thread Group Dialog Box .................................................................................................................... 64
Figure 22 OpenMP Private Data in PGDBG GUI .............................................................................................................. 76
PGI Debugger User's Guide xi
LIST OF TABLES
Table 1 Colors Describing Thread State ............................................................................................................................ 16
Table 2 PGDBG Operators .................................................................................................................................................31
Table 3 PGDBG Commands ...............................................................................................................................................33
Table 4 PGDBG Debug Modes .......................................................................................................................................... 57
Table 5 Thread IDs in Threads-only Debug Mode .............................................................................................................58
Table 6 Process IDs in Process-only Debug Mode ........................................................................................................... 58
Table 7 Thread IDs in Multilevel Debug Mode ...................................................................................................................59
Table 8 p/t-set Commands ..................................................................................................................................................61
Table 9 PGDBG Parallel Commands ................................................................................................................................. 65
Table 10 PGDBG Stop Modes ........................................................................................................................................... 67
Table 11 PGDBG Wait Modes ............................................................................................................................................ 68
Table 12 PGDBG Wait Behavior ........................................................................................................................................ 69
Table 13 PGDBG Status Messages ................................................................................................................................... 70
Table 14 Thread State Is Described Using Color .............................................................................................................. 75
Table 15 pgienv Commands .............................................................................................................................................114
PGI Debugger User's Guide xii
PREFACE
This guide describes how to use the PGDBG debugger to debug serial and parallel applicationsbuilt with The Portland Group (PGI) Fortran, C, and C++ compilers for X86, AMD64 and Intel 64processor-based systems. It contains information about how to use PGDBG, as well as detailedreference information on commands and its graphical interface.
Intended AudienceThis guide is intended for application programmers, scientists and engineers proficient inprogramming with the Fortran, C, and/or C++ languages. The PGI tools are available on a varietyof operating systems for the X86, AMD64, and Intel 64 hardware platforms. This guide assumesfamiliarity with basic operating system usage.
DocumentationAll documentation for PGI compilers and tools is available online at http://www.pgroup.com/resources/docs.htm
Compatibility and Conformance to StandardsYour system needs to be running a properly installed and configured version of this PGI product.For information on installing PGI compilers and tools, refer to the Release Notes and InstallationGuide included with your software.
For further information, refer to the following:
‣ American National Standard Programming Language FORTRAN, ANSI X3. -1978 (1978).‣ ISO/IEC 1539-1 : 1991, Information technology – Programming Languages – Fortran,
Geneva, 1991 (Fortran 90).‣ ISO/IEC 1539-1 : 1997, Information technology – Programming Languages – Fortran,
Geneva, 1997 (Fortran 95).‣ ISO/IEC 1539-1 : 2004, Information technology – Programming Languages – Fortran,
Geneva, 2004 (Fortran 2003).‣ ISO/IEC 1539-1 : 2010, Information technology – Programming Languages – Fortran,
Geneva, 2010 (Fortran 2008).
Preface
PGI Debugger User's Guide xiii
‣ Fortran 95 Handbook Complete ISO/ANSI Reference, Adams et al, The MIT Press,Cambridge, Mass, 1997.
‣ The Fortran 2003 Handbook, Adams et al, Springer, 2009.‣ OpenMP Application Program Interface, Version 3.1, July 2011, http://www.openmp.org.‣ Programming in VAX Fortran, Version 4.0, Digital Equipment Corporation (September,
1984).‣ IBM VS Fortran, IBM Corporation, Rev. GC26-4119.‣ Military Standard, Fortran, DOD Supplement to American National Standard Programming
Language Fortran, ANSI x.3-1978, MIL-STD-1753 (November 9, 1978).‣ American National Standard Programming Language C, ANSI X3.159-1989.‣ ISO/IEC 9899:1999, Information technology – Programming Languages – C, Geneva, 1999
(C99).‣ ISO/IEC 9899:2011, Information Technology – Programming Languages – C, Geneva, 2011
(C11).‣ ISO/IEC 14882:2011, Information Technology – Programming Languages – C++, Geneva,
2011 (C++11).
OrganizationThe PGI Debugger User's Guide contains these thirteen sections that describe PGDBG, asymbolic debugger for Fortran, C, C++ and assembly language programs.
Getting Startedcontains information on how to start using the debugger, including a description of how tobuild a program for debug and how to invoke PGDBG.
The Graphical User Interfacedescribes how to use the PGDBG graphical user interface (GUI).
Command Line Optionsdescribes the PGDBG command-line options.
Command Languageprovides detailed information about the PGDBG command language, which can be used fromthe command-line user interface or from the Command tab of the graphical user interface.
Command Summaryprovides a brief summary table of the PGDBG debugger commands with a brief description ofthe command as well as information about the category of command use.
Assembly-Level Debuggingcontains information on assembly-level debugging; basic debugger operations, commands,and features that are useful for debugging assembly code; and how to access registers.
Sourec-Level Debuggingcontains information on language-specific issues related to source debugging.
Platform-Specific Featurescontains platform-specific information as it relates to debugging.
Parallel Debugging Overviewcontains an overview of the parallel debugging capabilities of PGDBG.
Parallel Debugging with OpenMPdescribes the parallel debugging capabilities of PGDBG and how to use them with OpenMP.
Preface
PGI Debugger User's Guide xiv
Parallel Debugging with MPIdescribes the parallel debugging capabilities of PGDBG and how to use them with MPI.
Parallel Debugging of Hybred Applicationsdescribes the parallel debugging capabilities of PGDBG and how to use them with hybridapplications.
Command Referenceprovides reference information about each of the PGDBG commands, organized by area ofuse.
ConventionsThis guide uses the following conventions:
italicis used for emphasis.
Constant Widthis used for filenames, directories, arguments, options, examples, and for language statementsin the text, including assembly language statements.
Boldis used for commands.
[ item1 ]in general, square brackets indicate optional items. In this case item1 is optional. In thecontext of p/t-sets, square brackets are required to specify a p/t-set.
{ item2 | item 3 }braces indicate that a selection is required. In this case, you must select either item2 or item3.
filename ...ellipsis indicate a repetition. Zero or more of the preceding item may occur. In this example,multiple filenames are allowed.
FORTRANFortran language statements are shown in the text of this guide using a reduced fixed pointsize.
C/C++C/C++ language statements are shown in the test of this guide using a reduced fixed pointsize.
The PGI compilers and tools are supported on wide variety of Linux, macOS and Windowsoperating systems running on x86-compatible processors, and on Linux running on OpenPOWERprocessors. (Currently, the PGDBG debugger is supported on x86 only.) See the Compatibilityand Installation section on the PGI website for a comprehensive listing of supported platforms.
Support for 32-bit development is deprecated in PGI 2016 and will no longer be available as of the PGI2017 release. PGI 2017 will only be available for 64-bit operating systems and will not include the ability tocompile 32-bit applications for execution on either 32- or 64-bit operating systems.
Preface
PGI Debugger User's Guide xv
TerminologyIf there are terms in this guide with which you are unfamiliar, PGI provides a glossary of termswhich you can access at www.pgroup.com/support/definitions.htm
Related PublicationsThe following documents contain additional information related to the X86 architecture and thecompilers and tools available from The Portland Group.
‣ PGI Fortran Reference Manual describes the FORTRAN 77, Fortran 90/95, Fortran 2003,and HPF statements, data types, input/output format specifiers, and additional referencematerial related to the use of PGI Fortran compilers.
‣ System V Application Binary Interface Processor Supplement by AT&T UNIX SystemLaboratories, Inc. (Prentice Hall, Inc.).
‣ FORTRAN 95 HANDBOOK, Complete ANSI/ISO Reference (The MIT Press, 1997).‣ Programming in VAX Fortran, Version 4.0, Digital Equipment Corporation (September,
1984).‣ IBM VS Fortran, IBM Corporation, Rev. GC26-4119.‣ The C Programming Language by Kernighan and Ritchie (Prentice Hall).‣ C: A Reference Manual by Samuel P. Harbison and Guy L. Steele Jr. (Prentice Hall, 1987).‣ The Annotated C++ Reference Manual by Margaret Ellis and Bjarne Stroustrup, AT&T Bell
Laboratories, Inc. (Addison-Wesley Publishing Co., 1990)‣ PGI Compiler User’s Guide, PGI Reference Manual, PGI Release Notes, FAQ, Tutorials,
http://www.pgroup.com/‣ MPI-CH http://www.unix.mcs.anl.gov/MPI/mpich/‣ OpenMP http://www.openmp.org

Preface
PGI Debugger User's Guide xvi
PGI Debugger User's Guide 1
Chapter 1.GETTING STARTED
PGDBG is a symbolic debugger for Fortran, C, C++ and assembly language programs. It providesdebugger features, such as execution control using breakpoints, single-stepping, and examinationand modification of application variables, memory locations, and registers.
PGDBG supports debugging of certain types of parallel applications:
‣ Multi-threaded and OpenMP applications.‣ MPI applications.‣ Hybrid applications, which use multiple threads or OpenMP as well as multiple MPI
processes.
Multi-threaded and OpenMP applications may be run using more threads than the availablenumber of CPUs, and MPI applications may allocate more than one process to a cluster node.PGDBG supports debugging the listed types of applications regardless of how well the numberof threads match the number of CPUs or how well the number of processes match the number ofcluster nodes.
1.1. Definition of TermsThroughout this manual we use several debugging-specific terms. The program is the executablebeing debugged. The platform is the combination of the operating system and processors(s) onwhich the program runs. The program architecture is the platform for which the program wasbuilt, which may be different from the platform on which the program runs, such as a 32-bitprogram running on a 64-bit platform
Remote debugging introduces a few more terms. Remote debugging is the process of runningthe debugger on one system (the client) and using it to debug a program running on a differentsystem (the server). Local debugging, by contrast, occurs when the debugger and programare running on the same system. A connection is the set of information the debugger needs tobegin debugging a program. This information always includes the program name and whetherdebugging will be local or remote.
Additional terms are defined as needed. Terminology specific to parallel debugging is introducedin Parallel Debugging Overview.
Getting Started
PGI Debugger User's Guide 2
1.2. Building Applications for DebugTo build a program for debug, compile with the –g option. With this option, the compilergenerates information about the symbols and source files in the program and includes it in theexecutable file. The option –g also sets the compiler optimization to level zero (no optimization)unless you specify optimization options such as –O, –fast, or –fastsse on the command line.Optimization options take effect whether they are listed before or after –g on the command line.
1.2.1. Debugging Optimized CodePrograms built with –g and optimization levels higher than –O0 can be debugged, but due totransformations made to the program during optimization, source-level debugging may notbe reliable. Assembly-level debugging (e.g., accessing registers, viewing assembly code, etc.)is reliable, even with optimized code. Programs built without –g can be debugged; however,information about types, local variables, arguments and source file line numbers are not available.For more information on assembly-level debugging, refer to Assembly-Level Debugging.
In programs built with both –g and optimization levels higher than –O0, some optimizationsmay be disabled or otherwise affected by the –g option, possibly changing the program behavior.An alternative option, –gopt, can be used to build programs with full debugging information,but without modifying program optimizations. Unlike –g, the –gopt option does not set theoptimization to level zero.
1.2.2. Building for Debug on WindowsTo build an application for debug on Windows platforms, applications must be linked with the –g option as well as compiled with –g. This process results in the generation of debug informationstored in a ‘.dwf’ file and a ‘.pdb’ file. The PGI compiler driver should always be used to linkapplications; except for special circumstances, the linker should not be invoked directly.
1.3. User InterfacesPGDBG includes both a command-line interface (CLI) and a graphical user interface (GUI).
1.3.1. Command Line Interface (CLI)Text commands are entered one line at a time through the command-line interface. A number ofcommand-line options can be used when launching PGDBG.
For information on these options and how they are interpreted, refer to Command Line Options,Command Language, and Command Reference.
1.3.2. Graphical User InterfaceThe GUI, the default user interface, supports command entry through a point-and-click interface,a view of source and assembly code, a full command-line interface panel, and several othergraphical elements and features. There may be minor variations in the appearance of the PGDBG
Getting Started
PGI Debugger User's Guide 3
GUI from system to system, depending on the type of display hardware available, the settings forvarious defaults and the window manager used. Except for differences caused by those factors,the basic interface remains the same across all systems.
For more information on the PGDBG GUI, refer to The Graphical User Interface.
1.4. Co-installation RequirementsThere are co-installation requirements for PGDBG.
1.4.1. Java Virtual MachineThe PGDBG GUI depends on the Java Virtual Machine (JVM) which is part of the Java RuntimeEnvironment (JRE). PGDBG requires that the JRE be a specific minimum version or above.
Command-line mode debugging does not require the JRE.
Linux and macOS
When PGI software is installed on Linux or macOS, the version of Java required by the debuggeris also installed. PGDBG uses this version of Java by default. You can override this behaviorin two ways: set your PATH to include a different version of Java; or, set the PGI_JAVAenvironment variable to the full path of the Java executable. The following example uses a bashcommand to set PGI_JAVA:$ export PGI_JAVA=/home/myuser/myjava/bin/java
Windows
If an appropriately-versioned JRE is not already on your Windows system, the PGI softwareinstallation process installs it for you. The PGI command shell and Start menu links areautomatically configured to use the JRE. If you choose to skip the JRE-installation step or wantto use a different version of Java to run the debugger, then set your PATH to include the Javabin directory or use the PGI_JAVA environment variable to specify the full path to the javaexecutable.
The command-line mode debugger does not require the JRE.
1.5. Start DebuggingYou can start debugging a program right away by launching PGDBG and giving it the programname. For example, to load your_program into the debugger, launch PGDBG in this way.$ pgdbg your_program
Now you are ready to set breakpoints and start debugging.
You can also launch PGDBG without a program. Once the debugger is up, use the Connectionstab to specify the program to debug. To load the specified program into the debugger, use theConnections tab's Open button.
Getting Started
PGI Debugger User's Guide 4
1.6. Program LoadWhen PGDBG loads a program, it reads symbol information from the executable file and thenloads the application into memory. For large applications this process can take a few moments.
1.7. Initialization FilesAn initialization file can be useful for defining common aliases, setting breakpoints, and for otherstartup commands. If an initialization file named .pgdbgrc exists in the current directory orin your home directory, as defined by the environment variable HOME, PGDBG opens this filewhen it starts up and executes the commands in it.
If an initialization file is found in the current directory, then the initialization file in the homedirectory, if there is one, is ignored. However, a script command placed in the initializationfile can be used to execute the initialization file in the home directory or any other file.
1.8. Program ArchitecturePGDBG supports debugging both 32-bit and 64-bit programs. PGDBG automatically determinesthe architecture of the program and configures itself accordingly.
PGI Debugger User's Guide 5
Chapter 2.THE GRAPHICAL USER INTERFACE
The default user interface used by PGDBG is a graphical user interface or GUI. There may beminor variations in the appearance of the PGDBG GUI from host to host, depending on the typeof display hardware available, the settings for various defaults and the window manager used.Except for differences caused by those factors, the basic interface remains the same across allsystems.
2.1. Main Components
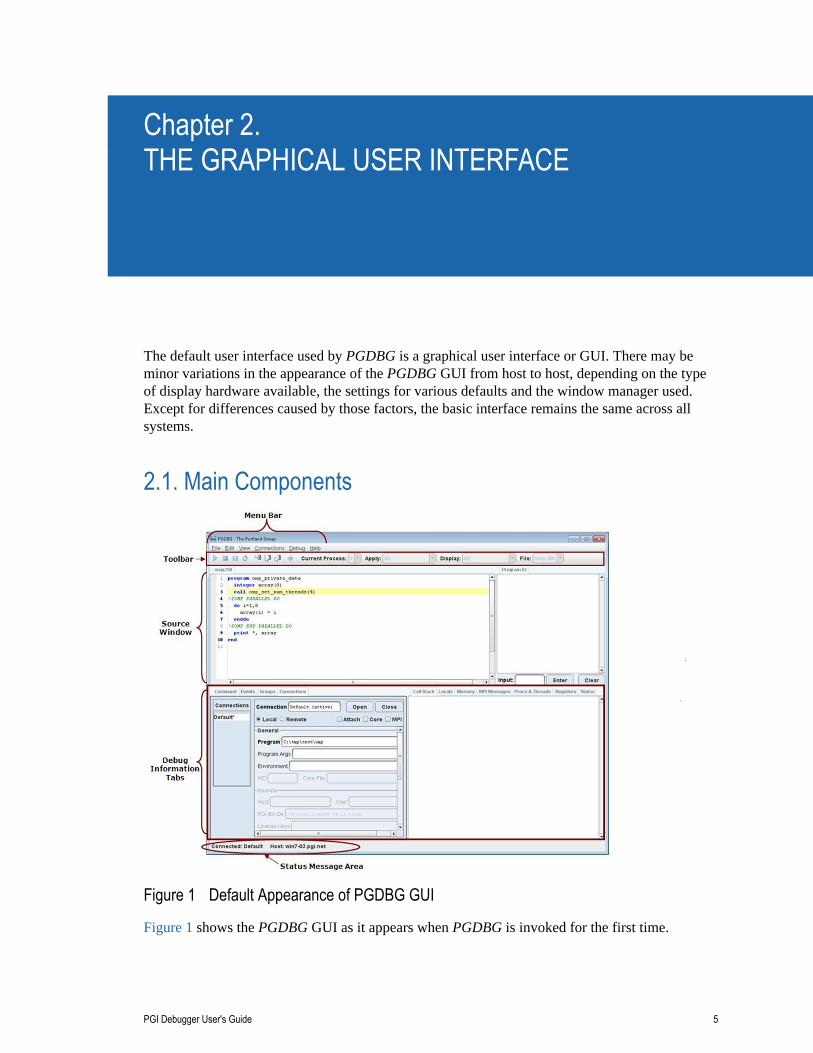
Figure 1 Default Appearance of PGDBG GUI
Figure 1 shows the PGDBG GUI as it appears when PGDBG is invoked for the first time.
The Graphical User Interface
PGI Debugger User's Guide 6
The GUI can be resized according to the conventions of the underlying window manager.Changes in window size and other settings are saved and used in subsequent invocations ofPGDBG. To prevent changes to the default settings from being saved, uncheck the Save Settingson Exit item on the Edit menu.
As the illustration shows, the GUI is divided into several areas: the menu bar, main toolbar,source window, program I/O window, and debug information tabs.
The source window and all of the debug information tabs are dockable tabs. A dockable tab canbe separated from the main window by either double-clicking the tab or dragging the tab off themain window. To return the tab to the main window, double-click it again or drag it back ontothe main window. You can change the placement of any dockable tab by dragging it from onelocation to another. Right-click on a dockable tab to bring up a context menu with additionaloptions, including and option to close the tab. To reopen a closed tab, use the View menu. Toreturn the GUI to its original state, use the Edit menu's Restore Default Settings... option.
The following sections explain the parts of the GUI and how they are used in a debug session.
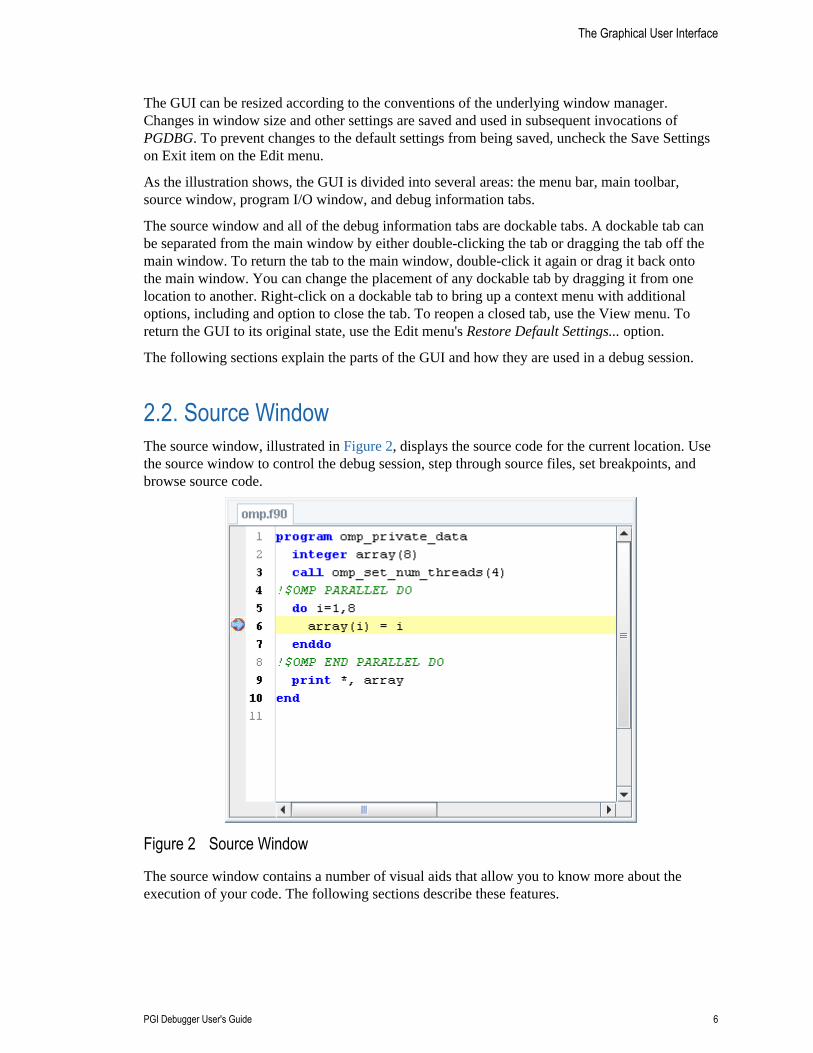
2.2. Source WindowThe source window, illustrated in Figure 2, displays the source code for the current location. Usethe source window to control the debug session, step through source files, set breakpoints, andbrowse source code.
Figure 2 Source Window
The source window contains a number of visual aids that allow you to know more about theexecution of your code. The following sections describe these features.
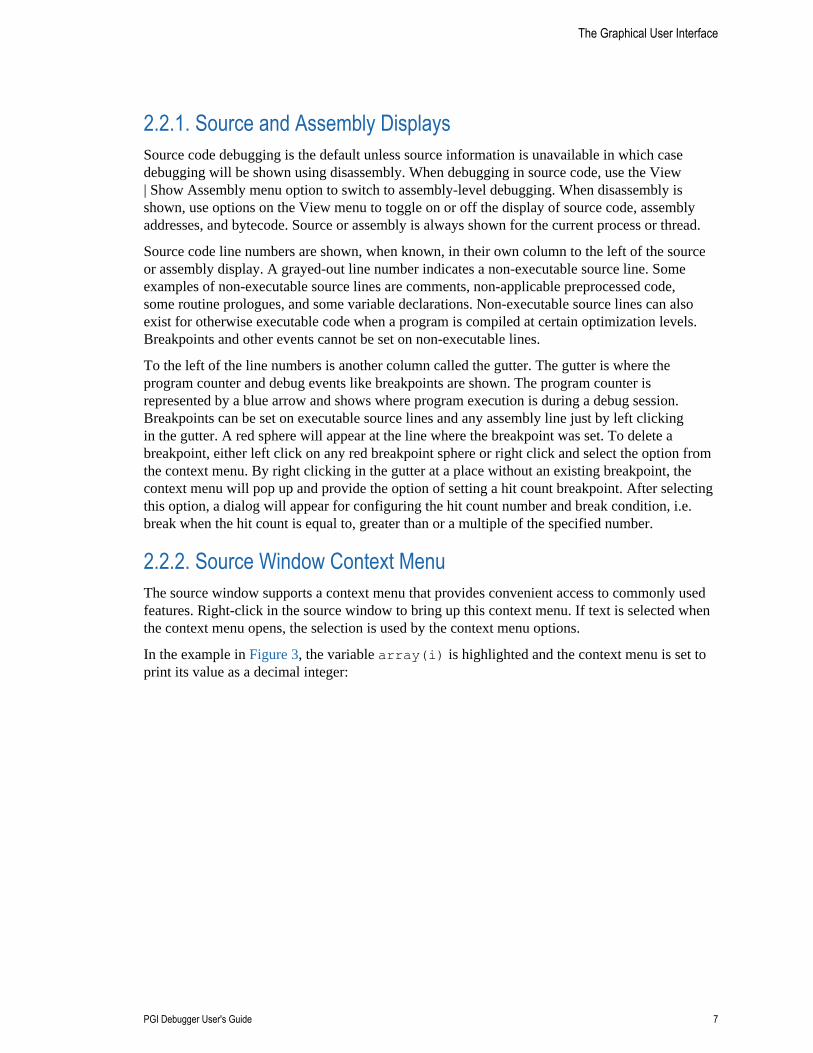
The Graphical User Interface
PGI Debugger User's Guide 7
2.2.1. Source and Assembly DisplaysSource code debugging is the default unless source information is unavailable in which casedebugging will be shown using disassembly. When debugging in source code, use the View| Show Assembly menu option to switch to assembly-level debugging. When disassembly isshown, use options on the View menu to toggle on or off the display of source code, assemblyaddresses, and bytecode. Source or assembly is always shown for the current process or thread.
Source code line numbers are shown, when known, in their own column to the left of the sourceor assembly display. A grayed-out line number indicates a non-executable source line. Someexamples of non-executable source lines are comments, non-applicable preprocessed code,some routine prologues, and some variable declarations. Non-executable source lines can alsoexist for otherwise executable code when a program is compiled at certain optimization levels.Breakpoints and other events cannot be set on non-executable lines.
To the left of the line numbers is another column called the gutter. The gutter is where theprogram counter and debug events like breakpoints are shown. The program counter isrepresented by a blue arrow and shows where program execution is during a debug session.Breakpoints can be set on executable source lines and any assembly line just by left clickingin the gutter. A red sphere will appear at the line where the breakpoint was set. To delete abreakpoint, either left click on any red breakpoint sphere or right click and select the option fromthe context menu. By right clicking in the gutter at a place without an existing breakpoint, thecontext menu will pop up and provide the option of setting a hit count breakpoint. After selectingthis option, a dialog will appear for configuring the hit count number and break condition, i.e.break when the hit count is equal to, greater than or a multiple of the specified number.
2.2.2. Source Window Context MenuThe source window supports a context menu that provides convenient access to commonly usedfeatures. Right-click in the source window to bring up this context menu. If text is selected whenthe context menu opens, the selection is used by the context menu options.
In the example in Figure 3, the variable array(i) is highlighted and the context menu is set toprint its value as a decimal integer:
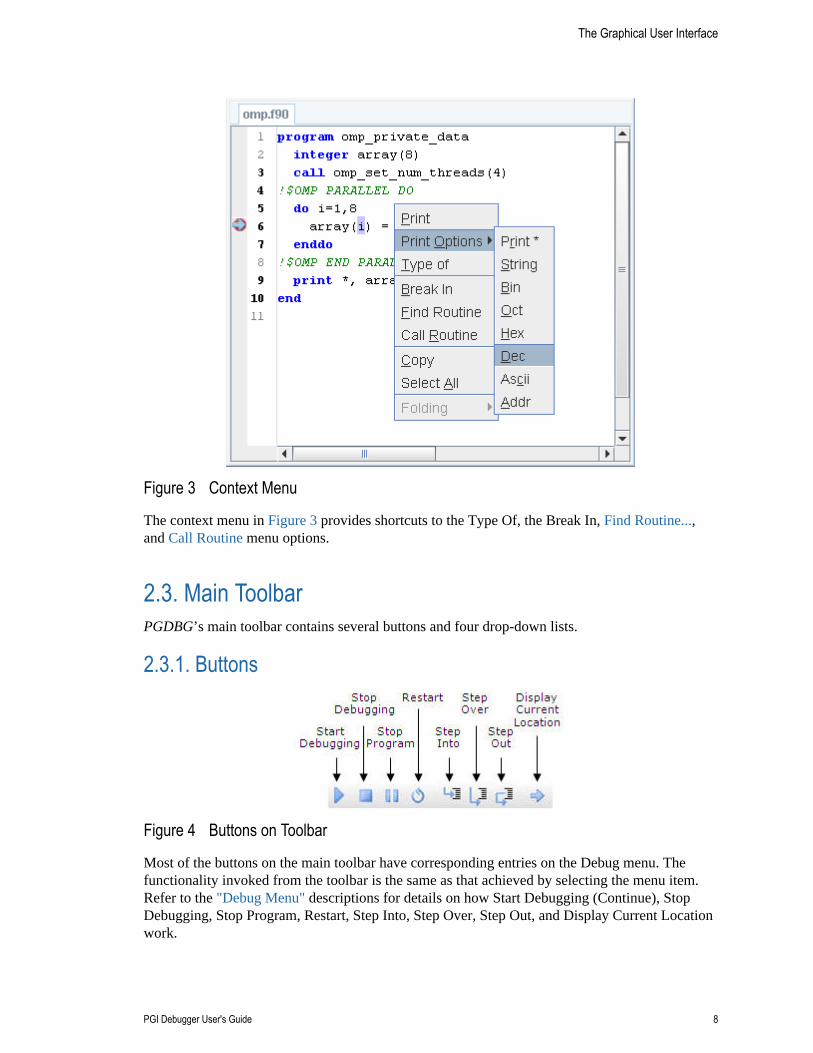
The Graphical User Interface
PGI Debugger User's Guide 8
Figure 3 Context Menu
The context menu in Figure 3 provides shortcuts to the Type Of, the Break In, Find Routine...,and Call Routine menu options.
2.3. Main ToolbarPGDBG’s main toolbar contains several buttons and four drop-down lists.
2.3.1. Buttons
Figure 4 Buttons on Toolbar
Most of the buttons on the main toolbar have corresponding entries on the Debug menu. Thefunctionality invoked from the toolbar is the same as that achieved by selecting the menu item.Refer to the "Debug Menu" descriptions for details on how Start Debugging (Continue), StopDebugging, Stop Program, Restart, Step Into, Step Over, Step Out, and Display Current Locationwork.
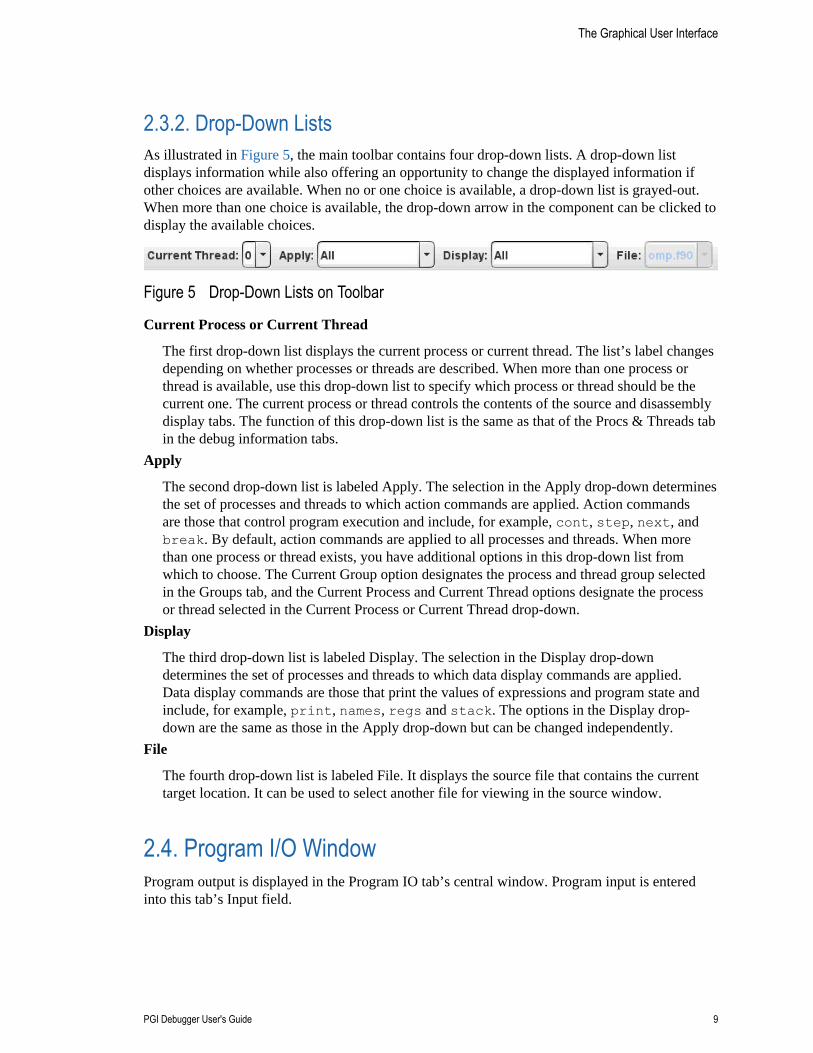
The Graphical User Interface
PGI Debugger User's Guide 9
2.3.2. Drop-Down ListsAs illustrated in Figure 5, the main toolbar contains four drop-down lists. A drop-down listdisplays information while also offering an opportunity to change the displayed information ifother choices are available. When no or one choice is available, a drop-down list is grayed-out.When more than one choice is available, the drop-down arrow in the component can be clicked todisplay the available choices.
Figure 5 Drop-Down Lists on Toolbar
Current Process or Current Thread
The first drop-down list displays the current process or current thread. The list’s label changesdepending on whether processes or threads are described. When more than one process orthread is available, use this drop-down list to specify which process or thread should be thecurrent one. The current process or thread controls the contents of the source and disassemblydisplay tabs. The function of this drop-down list is the same as that of the Procs & Threads tabin the debug information tabs.
Apply
The second drop-down list is labeled Apply. The selection in the Apply drop-down determinesthe set of processes and threads to which action commands are applied. Action commandsare those that control program execution and include, for example, cont, step, next, andbreak. By default, action commands are applied to all processes and threads. When morethan one process or thread exists, you have additional options in this drop-down list fromwhich to choose. The Current Group option designates the process and thread group selectedin the Groups tab, and the Current Process and Current Thread options designate the processor thread selected in the Current Process or Current Thread drop-down.
Display
The third drop-down list is labeled Display. The selection in the Display drop-downdetermines the set of processes and threads to which data display commands are applied.Data display commands are those that print the values of expressions and program state andinclude, for example, print, names, regs and stack. The options in the Display drop-down are the same as those in the Apply drop-down but can be changed independently.
File
The fourth drop-down list is labeled File. It displays the source file that contains the currenttarget location. It can be used to select another file for viewing in the source window.
2.4. Program I/O WindowProgram output is displayed in the Program IO tab’s central window. Program input is enteredinto this tab’s Input field.
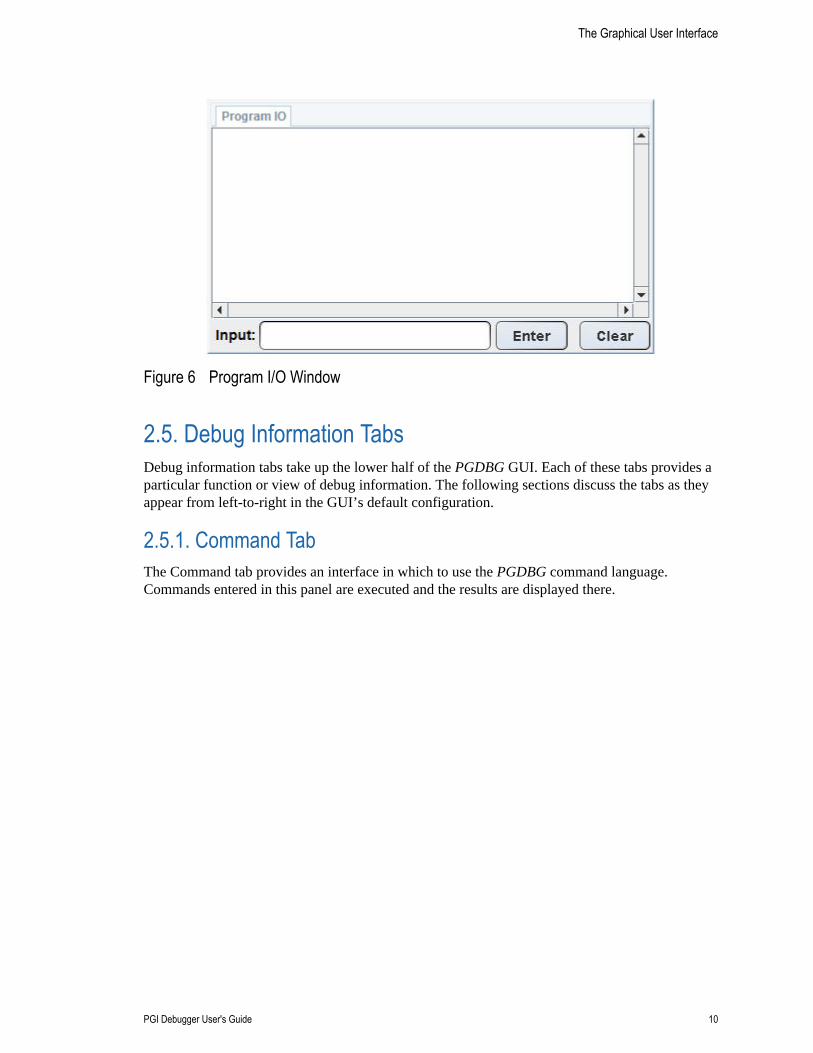
The Graphical User Interface
PGI Debugger User's Guide 10
Figure 6 Program I/O Window
2.5. Debug Information TabsDebug information tabs take up the lower half of the PGDBG GUI. Each of these tabs provides aparticular function or view of debug information. The following sections discuss the tabs as theyappear from left-to-right in the GUI’s default configuration.
2.5.1. Command TabThe Command tab provides an interface in which to use the PGDBG command language.Commands entered in this panel are executed and the results are displayed there.
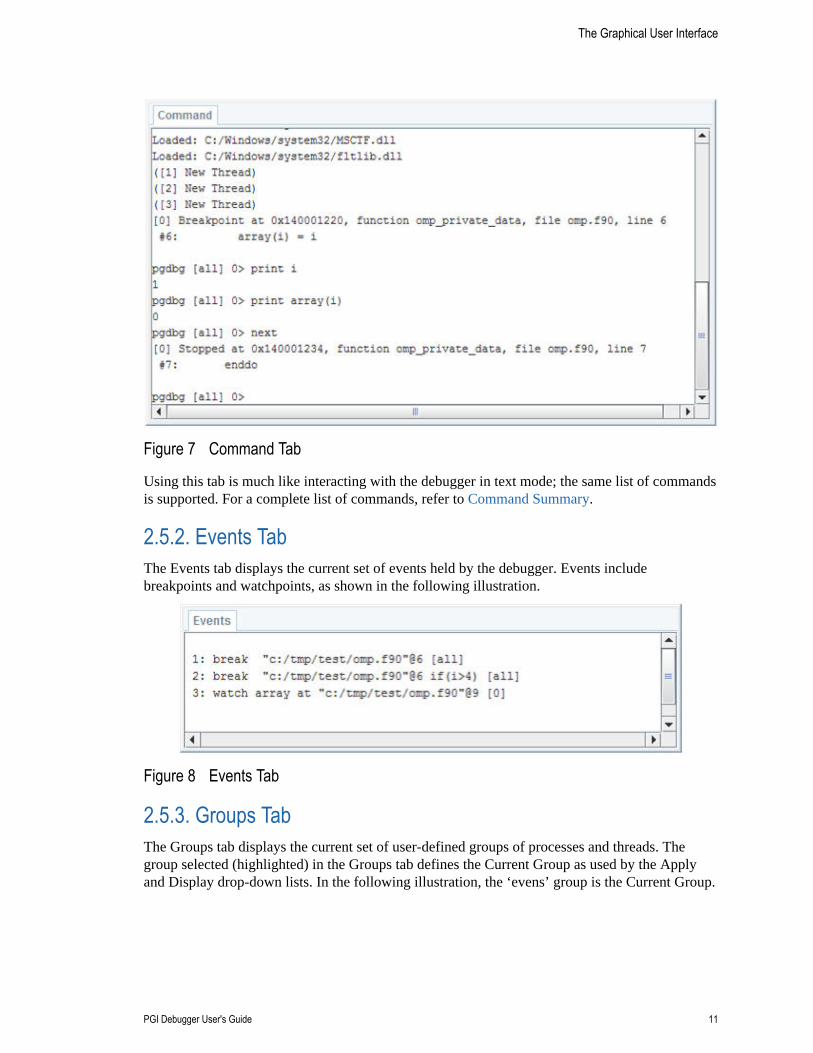
The Graphical User Interface
PGI Debugger User's Guide 11
Figure 7 Command Tab
Using this tab is much like interacting with the debugger in text mode; the same list of commandsis supported. For a complete list of commands, refer to Command Summary.
2.5.2. Events TabThe Events tab displays the current set of events held by the debugger. Events includebreakpoints and watchpoints, as shown in the following illustration.
Figure 8 Events Tab
2.5.3. Groups TabThe Groups tab displays the current set of user-defined groups of processes and threads. Thegroup selected (highlighted) in the Groups tab defines the Current Group as used by the Applyand Display drop-down lists. In the following illustration, the ‘evens’ group is the Current Group.
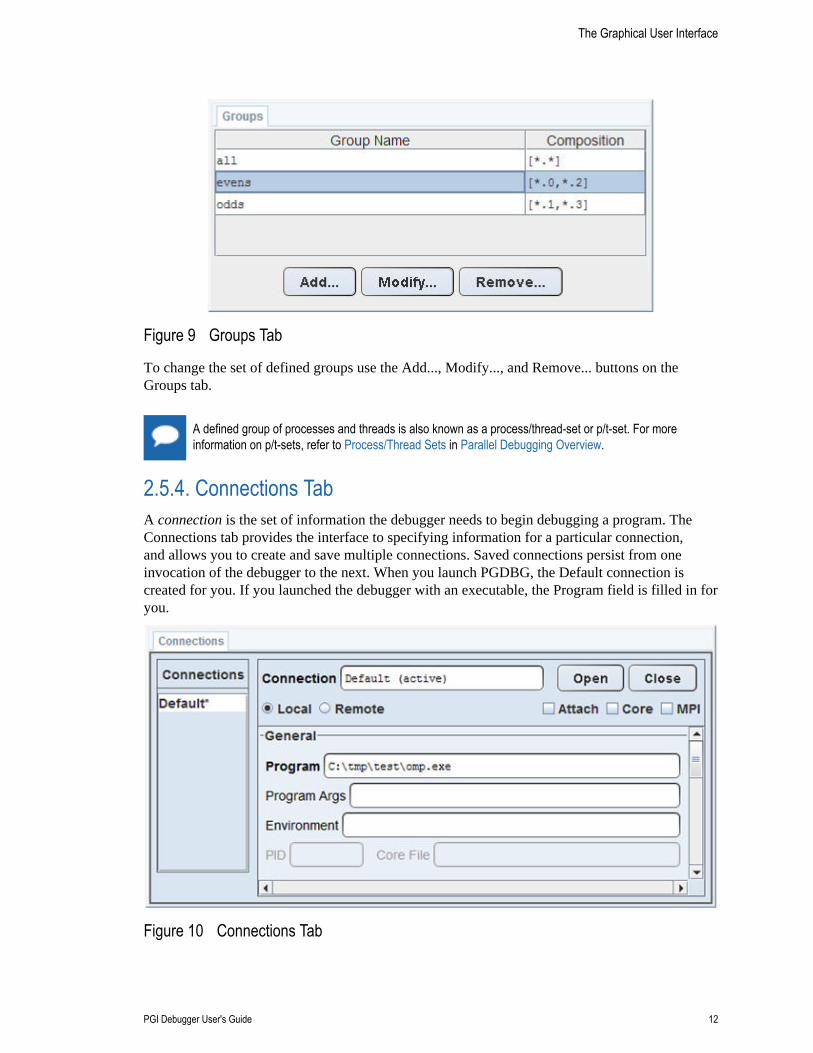
The Graphical User Interface
PGI Debugger User's Guide 12
Figure 9 Groups Tab
To change the set of defined groups use the Add..., Modify..., and Remove... buttons on theGroups tab.
A defined group of processes and threads is also known as a process/thread-set or p/t-set. For moreinformation on p/t-sets, refer to Process/Thread Sets in Parallel Debugging Overview.
2.5.4. Connections TabA connection is the set of information the debugger needs to begin debugging a program. TheConnections tab provides the interface to specifying information for a particular connection,and allows you to create and save multiple connections. Saved connections persist from oneinvocation of the debugger to the next. When you launch PGDBG, the Default connection iscreated for you. If you launched the debugger with an executable, the Program field is filled in foryou.
Figure 10 Connections Tab
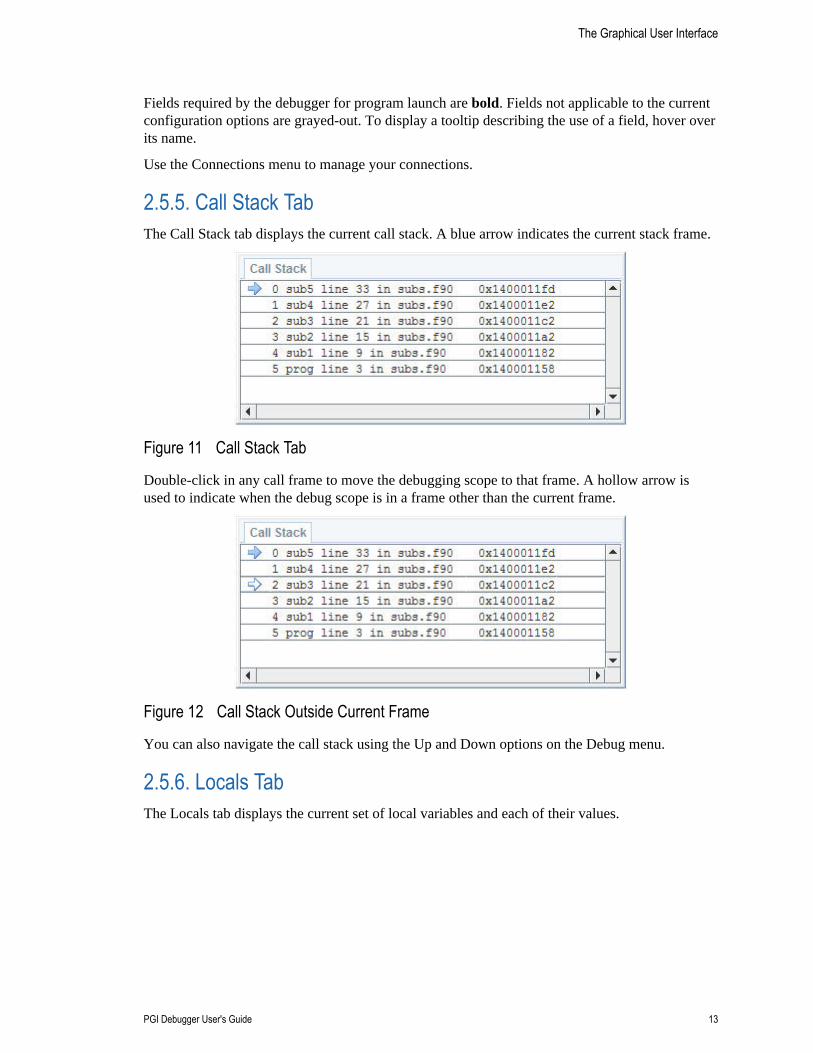
The Graphical User Interface
PGI Debugger User's Guide 13
Fields required by the debugger for program launch are bold. Fields not applicable to the currentconfiguration options are grayed-out. To display a tooltip describing the use of a field, hover overits name.
Use the Connections menu to manage your connections.
2.5.5. Call Stack TabThe Call Stack tab displays the current call stack. A blue arrow indicates the current stack frame.
Figure 11 Call Stack Tab
Double-click in any call frame to move the debugging scope to that frame. A hollow arrow isused to indicate when the debug scope is in a frame other than the current frame.
Figure 12 Call Stack Outside Current Frame
You can also navigate the call stack using the Up and Down options on the Debug menu.
2.5.6. Locals TabThe Locals tab displays the current set of local variables and each of their values.
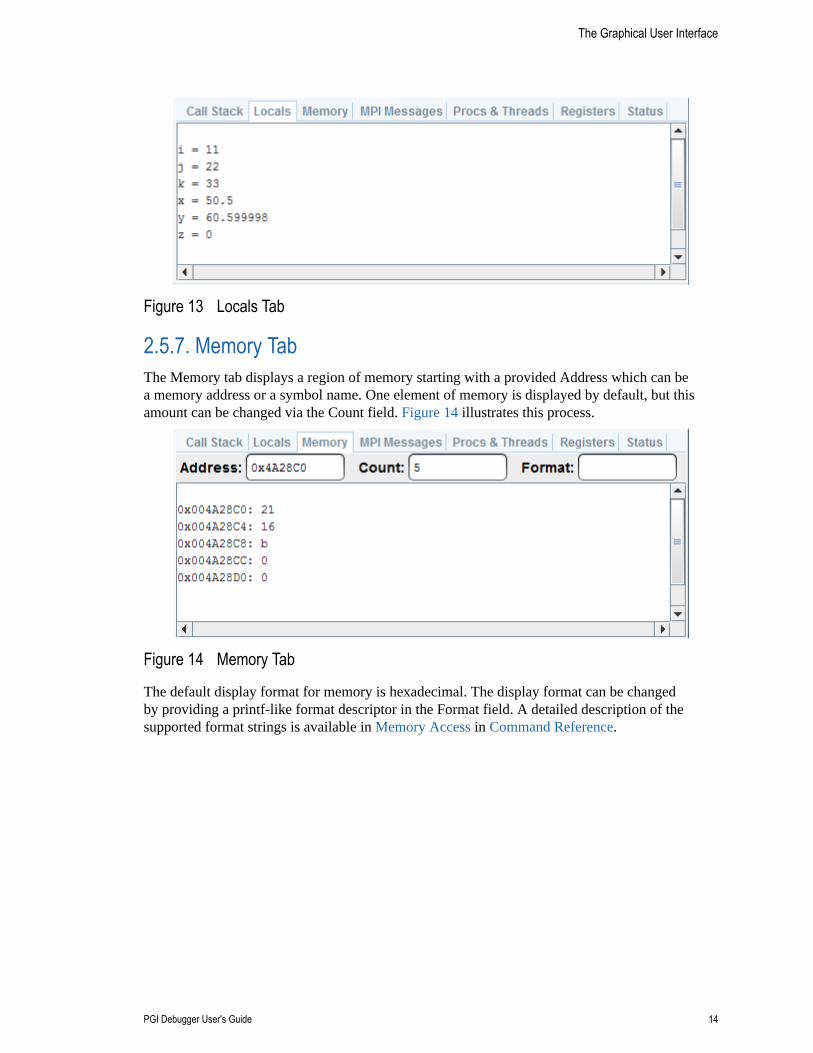
The Graphical User Interface
PGI Debugger User's Guide 14
Figure 13 Locals Tab
2.5.7. Memory TabThe Memory tab displays a region of memory starting with a provided Address which can bea memory address or a symbol name. One element of memory is displayed by default, but thisamount can be changed via the Count field. Figure 14 illustrates this process.
Figure 14 Memory Tab
The default display format for memory is hexadecimal. The display format can be changedby providing a printf-like format descriptor in the Format field. A detailed description of thesupported format strings is available in Memory Access in Command Reference.
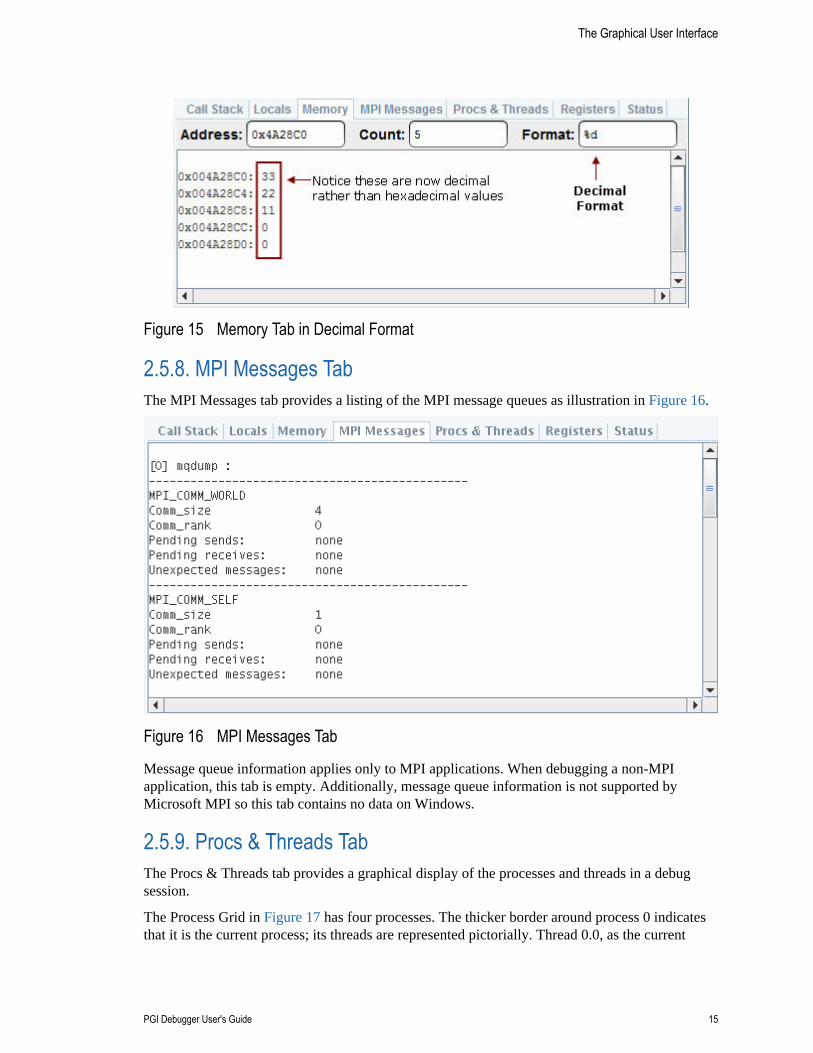
The Graphical User Interface
PGI Debugger User's Guide 15
Figure 15 Memory Tab in Decimal Format
2.5.8. MPI Messages TabThe MPI Messages tab provides a listing of the MPI message queues as illustration in Figure 16.
Figure 16 MPI Messages Tab
Message queue information applies only to MPI applications. When debugging a non-MPIapplication, this tab is empty. Additionally, message queue information is not supported byMicrosoft MPI so this tab contains no data on Windows.
2.5.9. Procs & Threads TabThe Procs & Threads tab provides a graphical display of the processes and threads in a debugsession.
The Process Grid in Figure 17 has four processes. The thicker border around process 0 indicatesthat it is the current process; its threads are represented pictorially. Thread 0.0, as the current
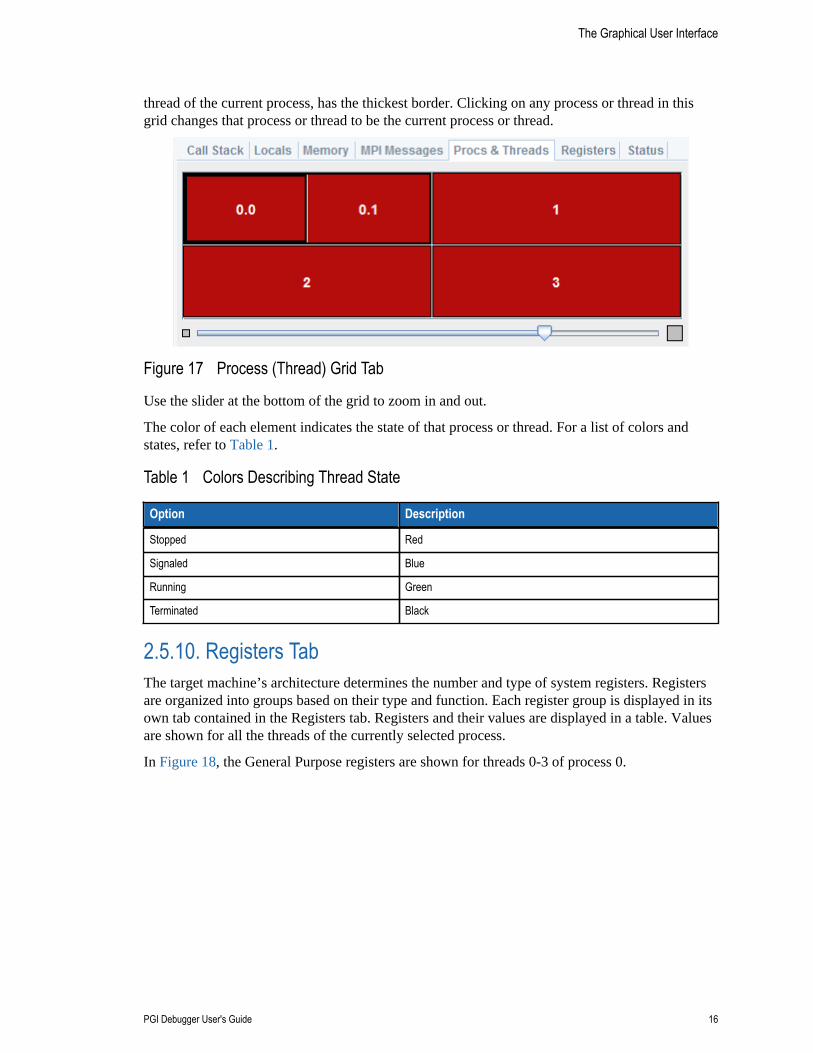
The Graphical User Interface
PGI Debugger User's Guide 16
thread of the current process, has the thickest border. Clicking on any process or thread in thisgrid changes that process or thread to be the current process or thread.
Figure 17 Process (Thread) Grid Tab
Use the slider at the bottom of the grid to zoom in and out.
The color of each element indicates the state of that process or thread. For a list of colors andstates, refer to Table 1.
Table 1 Colors Describing Thread State
Option Description
Stopped Red
Signaled Blue
Running Green
Terminated Black
2.5.10. Registers TabThe target machine’s architecture determines the number and type of system registers. Registersare organized into groups based on their type and function. Each register group is displayed in itsown tab contained in the Registers tab. Registers and their values are displayed in a table. Valuesare shown for all the threads of the currently selected process.
In Figure 18, the General Purpose registers are shown for threads 0-3 of process 0.
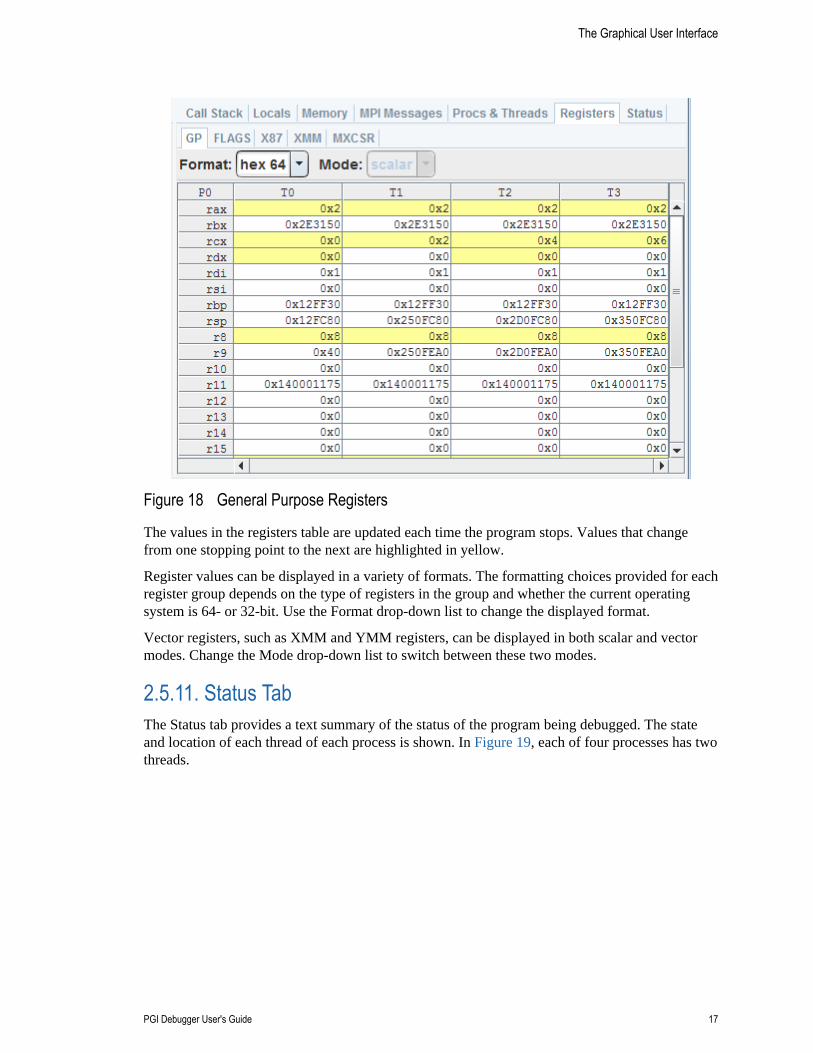
The Graphical User Interface
PGI Debugger User's Guide 17
Figure 18 General Purpose Registers
The values in the registers table are updated each time the program stops. Values that changefrom one stopping point to the next are highlighted in yellow.
Register values can be displayed in a variety of formats. The formatting choices provided for eachregister group depends on the type of registers in the group and whether the current operatingsystem is 64- or 32-bit. Use the Format drop-down list to change the displayed format.
Vector registers, such as XMM and YMM registers, can be displayed in both scalar and vectormodes. Change the Mode drop-down list to switch between these two modes.
2.5.11. Status TabThe Status tab provides a text summary of the status of the program being debugged. The stateand location of each thread of each process is shown. In Figure 19, each of four processes has twothreads.
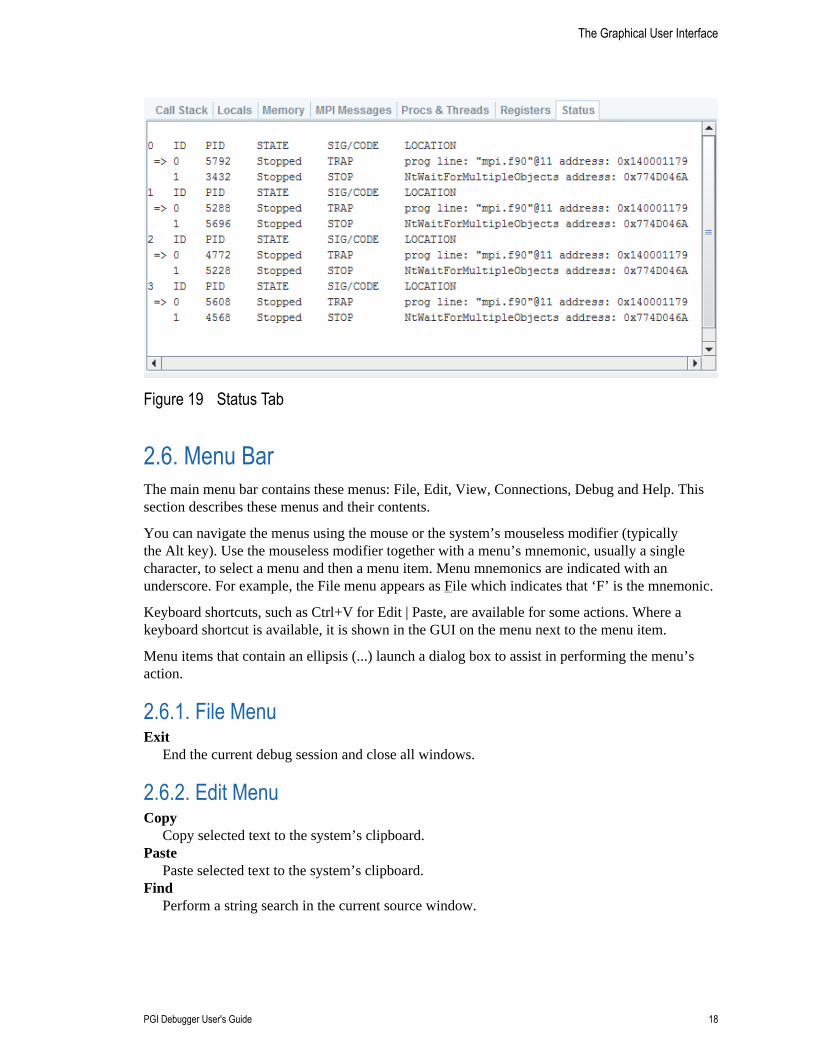
The Graphical User Interface
PGI Debugger User's Guide 18
Figure 19 Status Tab
2.6. Menu BarThe main menu bar contains these menus: File, Edit, View, Connections, Debug and Help. Thissection describes these menus and their contents.
You can navigate the menus using the mouse or the system’s mouseless modifier (typicallythe Alt key). Use the mouseless modifier together with a menu’s mnemonic, usually a singlecharacter, to select a menu and then a menu item. Menu mnemonics are indicated with anunderscore. For example, the File menu appears as File which indicates that ‘F’ is the mnemonic.
Keyboard shortcuts, such as Ctrl+V for Edit | Paste, are available for some actions. Where akeyboard shortcut is available, it is shown in the GUI on the menu next to the menu item.
Menu items that contain an ellipsis (...) launch a dialog box to assist in performing the menu’saction.
2.6.1. File MenuExit
End the current debug session and close all windows.
2.6.2. Edit MenuCopy
Copy selected text to the system’s clipboard.Paste
Paste selected text to the system’s clipboard.Find
Perform a string search in the current source window.
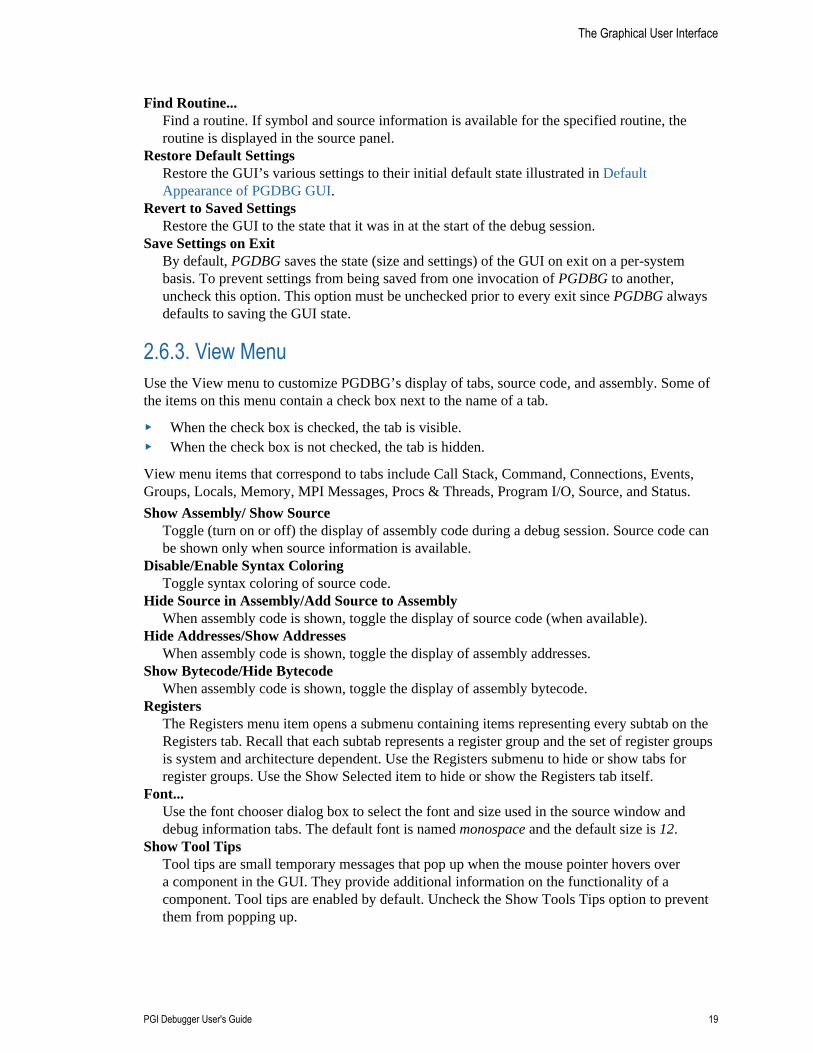
The Graphical User Interface
PGI Debugger User's Guide 19
Find Routine...Find a routine. If symbol and source information is available for the specified routine, theroutine is displayed in the source panel.
Restore Default SettingsRestore the GUI’s various settings to their initial default state illustrated in DefaultAppearance of PGDBG GUI.
Revert to Saved SettingsRestore the GUI to the state that it was in at the start of the debug session.
Save Settings on ExitBy default, PGDBG saves the state (size and settings) of the GUI on exit on a per-systembasis. To prevent settings from being saved from one invocation of PGDBG to another,uncheck this option. This option must be unchecked prior to every exit since PGDBG alwaysdefaults to saving the GUI state.
2.6.3. View MenuUse the View menu to customize PGDBG’s display of tabs, source code, and assembly. Some ofthe items on this menu contain a check box next to the name of a tab.
‣ When the check box is checked, the tab is visible.‣ When the check box is not checked, the tab is hidden.
View menu items that correspond to tabs include Call Stack, Command, Connections, Events,Groups, Locals, Memory, MPI Messages, Procs & Threads, Program I/O, Source, and Status.
Show Assembly/ Show SourceToggle (turn on or off) the display of assembly code during a debug session. Source code canbe shown only when source information is available.
Disable/Enable Syntax ColoringToggle syntax coloring of source code.
Hide Source in Assembly/Add Source to AssemblyWhen assembly code is shown, toggle the display of source code (when available).
Hide Addresses/Show AddressesWhen assembly code is shown, toggle the display of assembly addresses.
Show Bytecode/Hide BytecodeWhen assembly code is shown, toggle the display of assembly bytecode.
RegistersThe Registers menu item opens a submenu containing items representing every subtab on theRegisters tab. Recall that each subtab represents a register group and the set of register groupsis system and architecture dependent. Use the Registers submenu to hide or show tabs forregister groups. Use the Show Selected item to hide or show the Registers tab itself.
Font...Use the font chooser dialog box to select the font and size used in the source window anddebug information tabs. The default font is named monospace and the default size is 12.
Show Tool TipsTool tips are small temporary messages that pop up when the mouse pointer hovers overa component in the GUI. They provide additional information on the functionality of acomponent. Tool tips are enabled by default. Uncheck the Show Tools Tips option to preventthem from popping up.
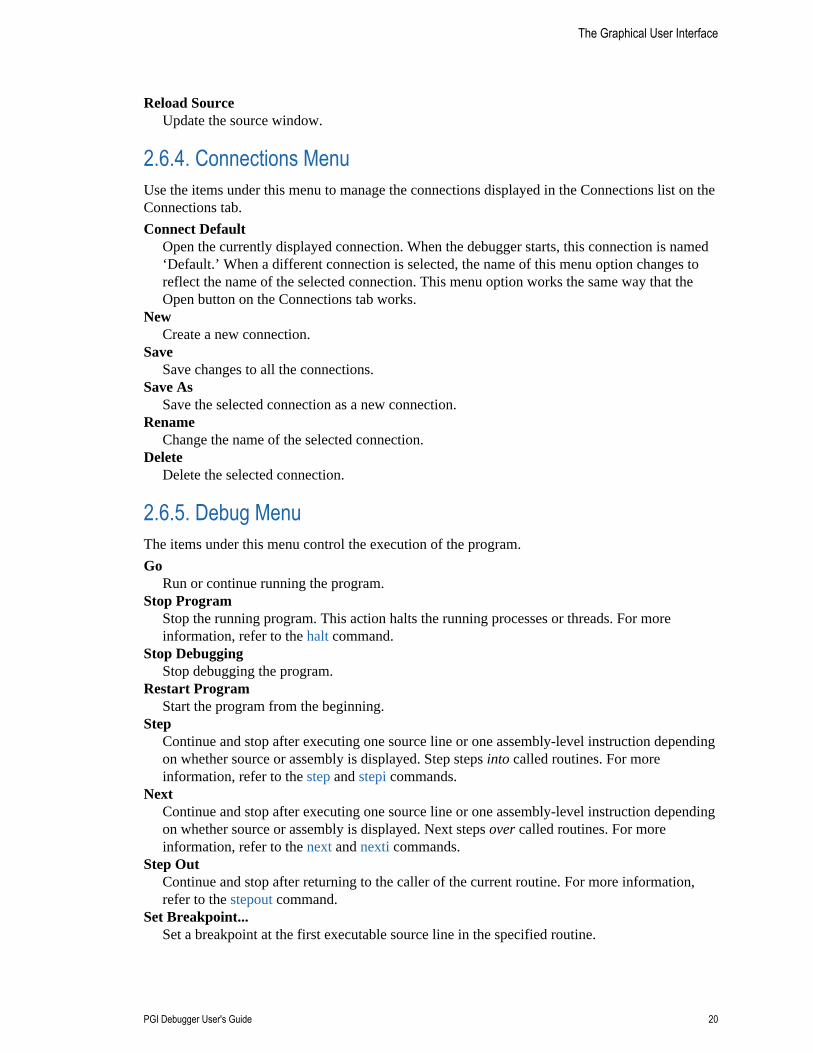
The Graphical User Interface
PGI Debugger User's Guide 20
Reload SourceUpdate the source window.
2.6.4. Connections MenuUse the items under this menu to manage the connections displayed in the Connections list on theConnections tab.
Connect DefaultOpen the currently displayed connection. When the debugger starts, this connection is named‘Default.’ When a different connection is selected, the name of this menu option changes toreflect the name of the selected connection. This menu option works the same way that theOpen button on the Connections tab works.
NewCreate a new connection.
SaveSave changes to all the connections.
Save AsSave the selected connection as a new connection.
RenameChange the name of the selected connection.
DeleteDelete the selected connection.
2.6.5. Debug MenuThe items under this menu control the execution of the program.
GoRun or continue running the program.
Stop ProgramStop the running program. This action halts the running processes or threads. For moreinformation, refer to the halt command.
Stop DebuggingStop debugging the program.
Restart ProgramStart the program from the beginning.
StepContinue and stop after executing one source line or one assembly-level instruction dependingon whether source or assembly is displayed. Step steps into called routines. For moreinformation, refer to the step and stepi commands.
NextContinue and stop after executing one source line or one assembly-level instruction dependingon whether source or assembly is displayed. Next steps over called routines. For moreinformation, refer to the next and nexti commands.
Step OutContinue and stop after returning to the caller of the current routine. For more information,refer to the stepout command.
Set Breakpoint...Set a breakpoint at the first executable source line in the specified routine.
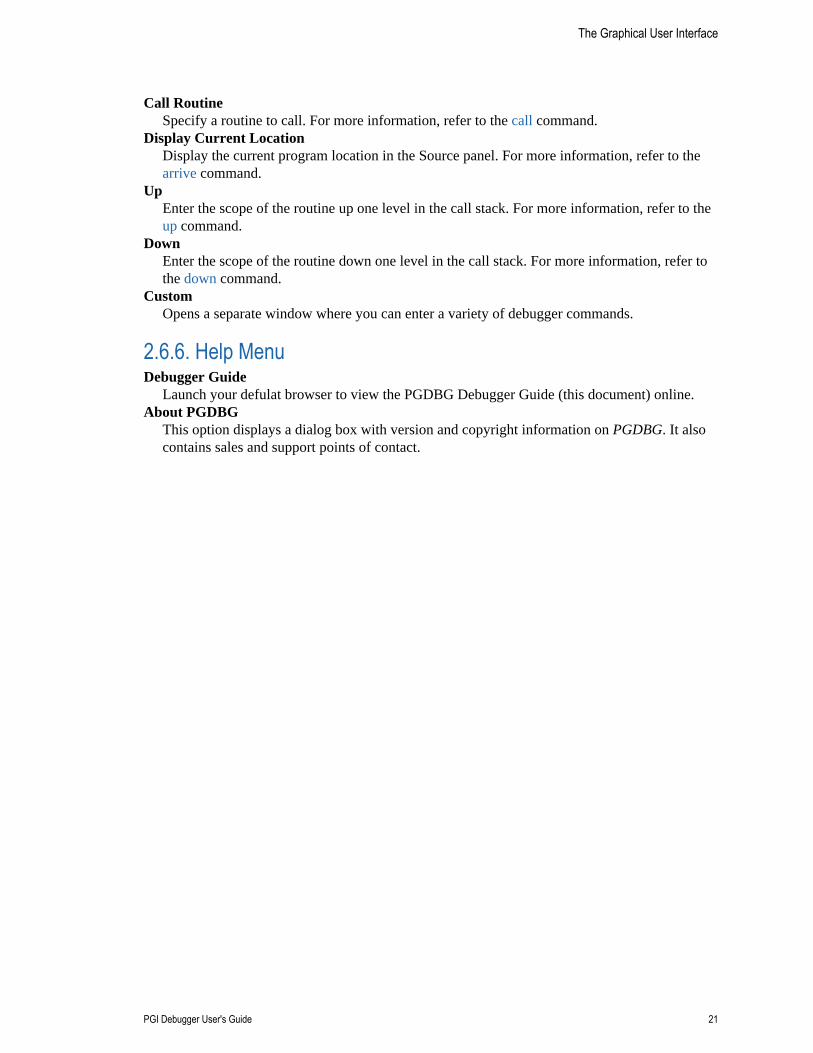
The Graphical User Interface
PGI Debugger User's Guide 21
Call RoutineSpecify a routine to call. For more information, refer to the call command.
Display Current LocationDisplay the current program location in the Source panel. For more information, refer to thearrive command.
UpEnter the scope of the routine up one level in the call stack. For more information, refer to theup command.
DownEnter the scope of the routine down one level in the call stack. For more information, refer tothe down command.
CustomOpens a separate window where you can enter a variety of debugger commands.
2.6.6. Help MenuDebugger Guide
Launch your defulat browser to view the PGDBG Debugger Guide (this document) online.About PGDBG
This option displays a dialog box with version and copyright information on PGDBG. It alsocontains sales and support points of contact.
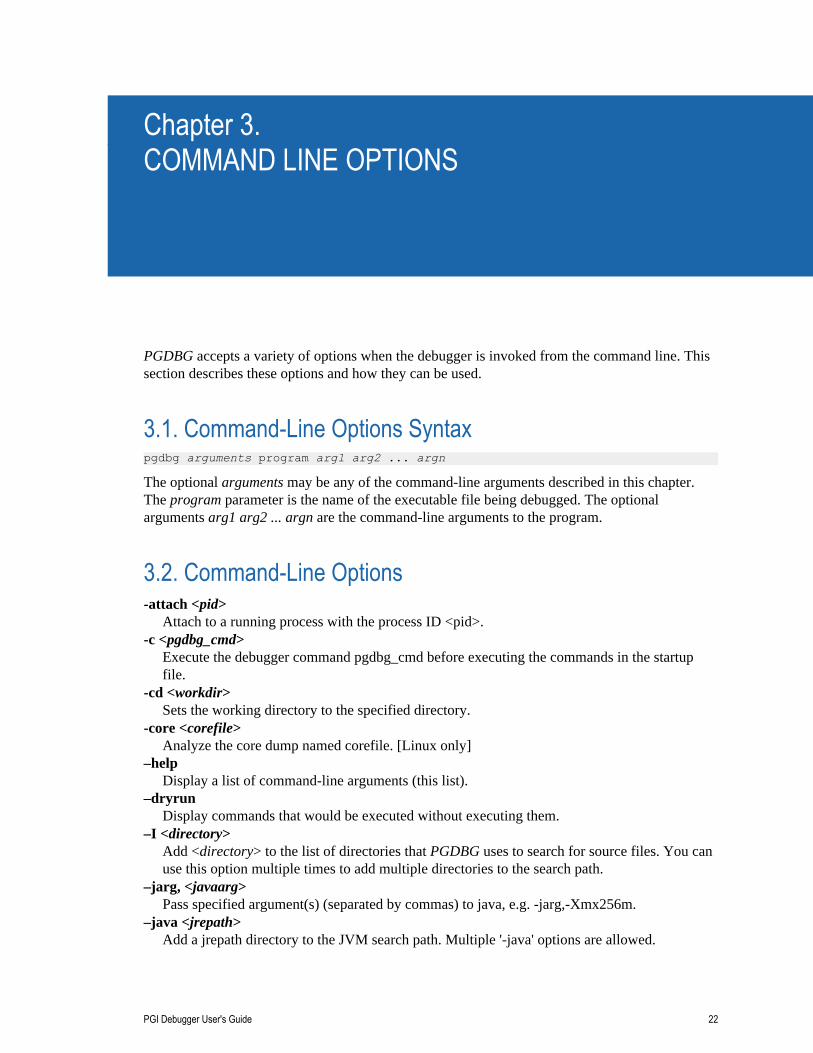
PGI Debugger User's Guide 22
Chapter 3.COMMAND LINE OPTIONS
PGDBG accepts a variety of options when the debugger is invoked from the command line. Thissection describes these options and how they can be used.
3.1. Command-Line Options Syntaxpgdbg arguments program arg1 arg2 ... argn
The optional arguments may be any of the command-line arguments described in this chapter.The program parameter is the name of the executable file being debugged. The optionalarguments arg1 arg2 ... argn are the command-line arguments to the program.
3.2. Command-Line Options-attach <pid>
Attach to a running process with the process ID <pid>.-c <pgdbg_cmd>
Execute the debugger command pgdbg_cmd before executing the commands in the startupfile.
-cd <workdir>Sets the working directory to the specified directory.
-core <corefile>Analyze the core dump named corefile. [Linux only]
–helpDisplay a list of command-line arguments (this list).
–dryrunDisplay commands that would be executed without executing them.
–I <directory>Add <directory> to the list of directories that PGDBG uses to search for source files. You canuse this option multiple times to add multiple directories to the search path.
–jarg, <javaarg>Pass specified argument(s) (separated by commas) to java, e.g. -jarg,-Xmx256m.
–java <jrepath>Add a jrepath directory to the JVM search path. Multiple '-java' options are allowed.
Command Line Options
PGI Debugger User's Guide 23
–nominDo not minimize the PGDBG console shell on startup. [Windows only]
–s <pgdbg_script>Runs the provided debugger command script instead of the configuration file: pgdbgrc[Linux,macOS] or pgdbg_rc [Windows].
–showPrint debugger configuration information.
–textRun the debugger using a command-line interface (CLI). The default is for the debugger tolaunch in graphical user interface (GUI) mode.
–VDisplay the version of PGDBG being run.
–vEnable verbose output; display commands as they are run.
3.3. Command-Line Options for MPI Debugging–mpi[=<launcher_path>
Debug an MPI program. Here the term launcher means the MPI launch program. Thedebugger uses mpiexec as the default launcher. If the location of the launcher in your MPIdistribution is not in your PATH environment variable, you must provide the debugger withthe full path to the launcher, including the name of the launch tool itself. If the location of thelauncher is in your PATH, then you just need to provide the name of the launcher, and thenonly if the launcher is not mpiexec.
–sgimpi[=<launcher_path>]Debug an SGI MPI (MPT) program. The debugger uses mpirun as the default launcher forSGI MPI debugging. If the location of mpirun in your installation of SGI MPI is not in yourPATH environment variable, you must provide the debugger with the full path to mpirun,including the name mpirun itself. If the location of mpirun is in your PATH, then you canuse –sgimpi without a sub-option.
–program_argsPass subsequent arguments to the program under debug; required when passing programarguments to an MPI program.
–pgserv[=<pgserv_path>][Optional] Specify path for pgserv, the per-node debug agent.
3.4. I/O RedirectionThe command shell interprets any I/O redirection specified on the PGDBG command line. For adescription of how to redirect I/O using the run command, refer to Process Control.
PGI Debugger User's Guide 24
Chapter 4.COMMAND LANGUAGE
PGDBG supports a command language that is capable of evaluating complex expressions. Thecommand language is composed of commands, constants, symbols, locations, expressions, andstatements.
You can use the command language by invoking the PGDBG command-line interface with the –text option, or in the Command tab of the PGDBG graphical user interface, as described in TheGraphical User Interface.
4.1. Command OverviewCommands are named operations, which take zero or more arguments and perform some action.Commands may also return values that may be used in expressions or as arguments to othercommands.
4.1.1. Command SyntaxCommands are entered one line at a time.
‣ Lines are delimited by a carriage return.‣ Each line must consist of a command and its arguments, if any.‣ You can place multiple commands on a single line by using the semi-colon (;) as a delimiter.
4.1.2. Command ModesThere are two command modes: pgi and dbx.
‣ The pgi command mode maintains the original PGDBG command interface.‣ In dbx mode, the debugger uses commands compatible with the Unix-based dbx debugger.
PGI and dbx commands are available in both command modes, but some command behavior maybe slightly different depending on the mode. The mode can be set while the debugger is runningby using the pgienv command.
Command Language
PGI Debugger User's Guide 25
4.2. ConstantsPGDBG supports C language style integer (hex, octal and decimal), floating point, character, andstring constants.
4.3. SymbolsPGDBG uses the symbolic information contained in the executable object file to create a symboltable for the target program. The symbol table contains symbols to represent source files,subroutines, types (including structure, union, pointer, array, and enumeration types), variables,and arguments. The PGDBG command-line interface is case-sensitive with respect to symbolnames; a symbol name on the command line must match the name as it appears in the object file.
4.4. Scope RulesSince several symbols in a single application may have the same name, scope rules are used tobind program identifiers to symbols in the symbol table. PGDBG uses the concept of a searchscope for looking up identifiers. The search scope represents a subroutine, a source file, or globalscope. When the user enters a name, PGDBG first tries to find the symbol in the search scope.If the symbol is not found, the containing scope (source file or global) is searched, and so forth,until either the symbol is located or the global scope is searched and the symbol is not found.
Normally, the search scope is the same as the current scope, which is the subroutine whereexecution is currently stopped. The current scope and the search scope are both set to the currentsubroutine each time execution of the program stops. However, you can use the enter commandto change the search scope.
A scope qualifier operator @ allows selection of out-of-scope identifiers. For example, if f is aroutine with a local variable i, then:f@i
represents the variable i local to f. Identifiers at file scope can be specified using the quoted filename with this operator. The following example represents the variable i defined in file xyz.c."xyz.c"@i
4.5. Register SymbolsTo provide access to the system registers, PGDBG maintains symbols for them. Register namesgenerally begin with $ to avoid conflicts with program identifiers. Each register symbol has adefault type associated with it, and registers are treated like global variables of that type, exceptthat their address may not be taken. For more information on register symbols, refer to SSERegister Symbols.
Command Language
PGI Debugger User's Guide 26
4.6. Source Code LocationsSome commands must refer to source code locations. Source file names must be enclosed indouble quotes. Source lines are indicated by number, and may be qualified by a quoted filenameusing the scope qualifier operator. Further, a range of lines is indicated using the range operator":".
Here are some examples:
break 37 sets a breakpoint at line 37 of the current source file.
break "xyz.c"@37 sets a breakpoint at line 37 of the source file xyz.c.
list 3:13 lists lines 3 through 13 of the current file.
list "xyz.c"@3:13 lists lines 3 through 13 of the source file xyz.c.
Some commands accept both line numbers and addresses as arguments. In these commands,it is not always obvious whether a numeric constant should be interpreted as a line number oran address. The description for these commands says which interpretation is used. However,PGDBG provides commands to convert from source line to address and vice versa. The linecommand converts an address to a line, and the addr command converts a line number to anaddress.
Here are some examples:
line 37 means “line 37”
addr 0x1000 means "address 0x1000"
addr {line 37} means "the address associated with line 37"
line {addr 0x1000} means "the line associated with address 0x1000"
4.7. Lexical BlocksLine numbers are used to name lexical blocks. The line number of the first instruction containedby a lexical block is used to indicate the start scope of the lexical block.
In the following example, there are two variables named var. One is declared in function main,and the other is declared in the lexical block starting at line 5. The lexical block has the uniquename "lex.c"@main@5. The variable var declared in "lex.c"@main@5 has the unique name"lex.c"@main@5@var. The output of the whereis command that follows shows how theseidentifiers can be distinguished.
lex.c:1 main()2 {3 int var = 0;4 {5 int var = 1;6 printf("var %d/n",var);
Command Language
PGI Debugger User's Guide 27
7 }8 printf("var %d/n",var)9 }
pgdbg> nStopped at 0x8048b10, function main, file/home/demo/pgdbg/ctest/lex.c,line 6#6: printf("var %d/n",var);
pgdbg> print var1
pgdbg> which var"lex.c"@main@5@var
pgdbg> whereis varvariable: "lex.c"@main@varvariable: "lex.c"@main@5@var
pgdbg> names "lex.c"@main@5 var = 1
4.8. StatementsAlthough PGDBG command-line input is processed one line at a time, statement constructsallow multiple commands per line, as well as conditional and iterative execution. The statementconstructs roughly correspond to the analogous C language constructs. Statements may be of thefollowing forms.
‣ Simple Statement: A command and its arguments. For example:print i
‣ Block Statement: One or more statements separated by semicolons and enclosed in curlybraces. Note: these may only be used as arguments to commands or as part of if or whilestatements. For example:if(i>1) {print i; step }
‣ If Statement: The keyword if, followed by a parenthesized expression, followed by a blockstatement, followed by zero or more else if clauses, and at most one else clause. Forexample:if(i>j) {print i} else if(i<j) {print j} else {print "i==j"}
‣ While Statement: The keyword while, followed by a parenthesized expression, followed by ablock statement. For example:while(i==0) {next}
Multiple statements may appear on a line separated by a semicolon. The following example setsbreakpoints in routines main and xyz, continues, and prints the new current location.break main; break xyz; cont; where
However, since the where command does not wait until the program has halted, this statementdisplays the call stack at some arbitrary execution point in the program. To control when the callstack is printed, insert a wait command, as shown in this example:break main; break xyz; cont; wait; where
Any value returned by the last statement on a line is printed.
Command Language
PGI Debugger User's Guide 28
Statements can be parallelized across multiple threads of execution. For more information, referto Parallel Statements.
4.9. EventsBreakpoints, watchpoints, and other mechanisms used to define the response to certain conditionsare collectively called events.
‣ An event is defined by the conditions under which the event occurs and by the action takenwhen the event occurs.
‣ A breakpoint occurs when execution reaches a particular address.
The default action for a breakpoint is simply to halt execution and prompt the user forcommands.
‣ A watchpoint occurs when the value of an expression changes.‣ A hardware watchpoint occurs when the specified memory location is accessed or modified.
4.9.1. Event CommandsPGDBG supports six basic commands for defining events. Each command takes a requiredargument and may also take one or more optional arguments. The basic commands are break,watch, hwatch, trace, track, and do.
Event Command Descriptions
‣ The break command takes an argument specifying a breakpoint location. Execution stopswhen that location is reached.
‣ The watch command takes an expression argument. Execution stops and the new value isprinted when the value of the expression changes.
‣ The hwatch command takes a data address argument, which can be either an identifier or avariable name. Execution stops when memory at that address is written.
‣ The trace command activates source line tracing, as specified by the arguments yousupply.
‣ The track command is like watch except that execution continues after the new value isprinted.
‣ The do command takes a list of commands as an argument. The commands are executedwhenever the event occurs.
Event Command Arguments
The six event commands share a common set of optional arguments. The optional argumentsprovide the ability to make the event definition more specific. They are:
at lineEvent occurs at indicated line.
at addrEvent occurs at indicated address.
Command Language
PGI Debugger User's Guide 29
in routineEvent occurs throughout indicated routine.
if (condition)Event occurs only when condition is true.
do {commands}When event occurs, execute commands.
The optional arguments may appear in any order after the required argument and should not bedelimited by commas.
Event Command Examples
Here are some event definition examples:
watch i at 37 if(y>1) This event definition says to stop and print the value of i whenever line 37 isexecuted and the value of y is greater than 1.
do {print xyz} in f This event definition says that at each line in the routine f print the value ofxyz.
break func1 if (i==37) do {print a[37]; stack} This event definition says to print the value of a[37] and do a stack trace
when i is equal to 37 in routine func1.
4.9.2. Event Command ActionIt is useful to know when events take place.
‣ Event commands that do not explicitly define a location occur at each source line in theprogram. Here are some examples:
do {where} prints the current location at the start of each source line.
trace a.b prints the value of a.b each time the value has changed.
track a.b prints the value of a.b at the start of each source line if the value haschanged.
Events that occur at every line can be useful, but they can make program execution very slow.Restricting an event to a particular address minimizes the impact on program execution speed, andrestricting an event that occurs at every line to a single routine causes execution to be slowed onlywhen that routine is executed.
‣ PGDBG supports instruction-level versions of several commands, such as breaki, watchi,tracei, tracki, and doi. The basic difference in the instruction-level version is that thesecommands interpret integers as addresses rather than line numbers, and events occur at eachinstruction rather than at each line.
‣ When multiple events occur at the same location, all event actions are taken before theprompt for input. Defining event actions that resume execution is allowed but discouraged,since continuing execution may prevent or defer other event actions.
For example, the following syntax creates an ambiguous situation:
Command Language
PGI Debugger User's Guide 30
break 37 do {continue}
break 37 do {print i}
With this sequence, it is not clear whether i will ever be printed.‣ Events only occur after the continue and run commands. They are ignored by step,
next, call, and other commands.‣ Identifiers and line numbers in events are bound to the current scope when the event is
defined.
For example, the following command sets a breakpoint at line 37 in the current file.break 37
The following command tracks the value of whatever variable i is currently in scope.track i
If i is a local variable, then it is wise to add a location modifier (at or in) to restrict the eventto a scope where i is defined. Scope qualifiers can also specify lines or variables that arenot currently in scope. Events can be parallelized across multiple threads of execution. SeeParallel Events for details.
4.10. ExpressionsThe debugger supports evaluation of expressions composed of constants, identifiers, commandsthat return values, and operators.
The following rules apply:
‣ To use a value returned by a command in an expression, the command and arguments mustbe enclosed in curly braces.
For example, the following command invokes the pc command to compute the currentaddress, adds 8 to it, and sets a breakpoint at that address.breaki {pc}+8
Similarly, the following command compares the start address of the current routine with thestart address of routine xyz. It prints the value 1 if they are equal and 0 if they are not.print {addr {func}}=={addr xyz}
‣ The @ operator, introduced previously, may be used as a scope qualifier. Its precedence isthe same as the C language field selection operators "." and "->" .
‣ PGDBG recognizes a range operator ":" which indicates array sub-ranges or source lineranges. The precedence of ':' is between '||' and '='.
Here are a few examples that use the range operator:
print a[1:10] prints elements 1 through 10 of the array a.
list 5:10 lists source lines 5 through 10.
list "xyz.c"@5:10 lists lines 5 through 10 in file xyz.c.
The general format for the range operator is [ lo : hi : step] where:
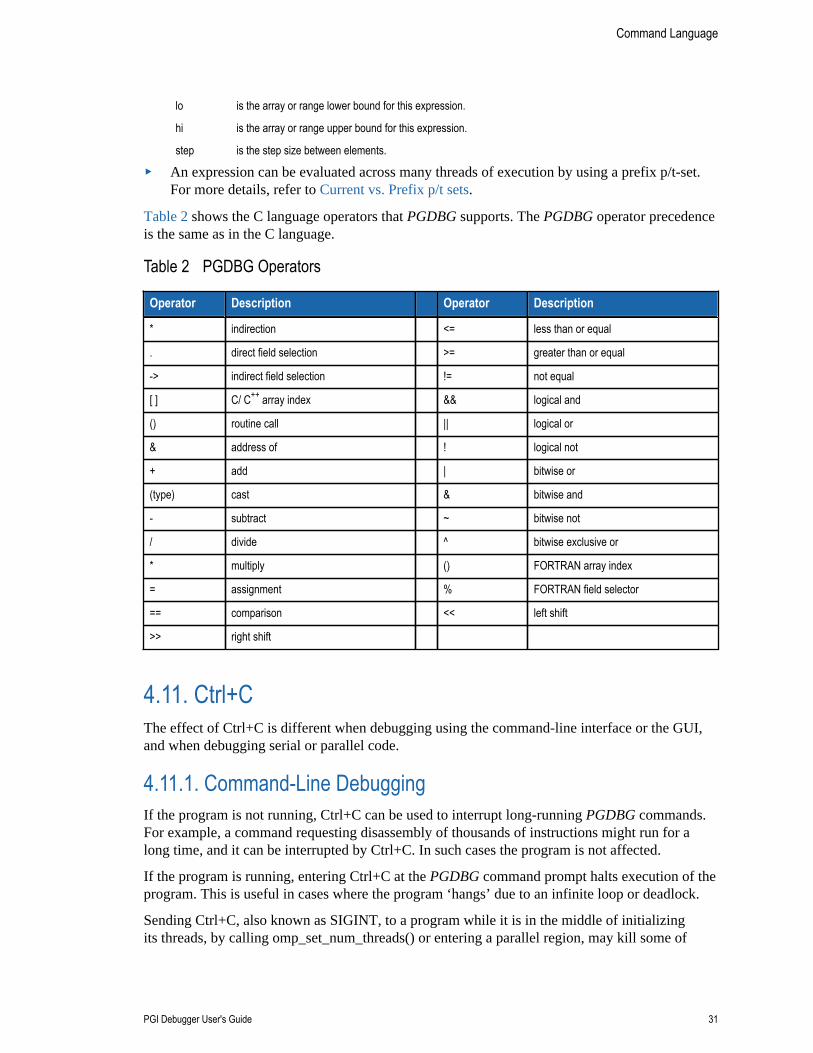
Command Language
PGI Debugger User's Guide 31
lo is the array or range lower bound for this expression.
hi is the array or range upper bound for this expression.
step is the step size between elements.
‣ An expression can be evaluated across many threads of execution by using a prefix p/t-set.For more details, refer to Current vs. Prefix p/t sets.
Table 2 shows the C language operators that PGDBG supports. The PGDBG operator precedenceis the same as in the C language.
Table 2 PGDBG Operators
Operator Description Operator Description
* indirection <= less than or equal
. direct field selection >= greater than or equal
-> indirect field selection != not equal
[ ] C/ C++ array index && logical and
() routine call || logical or
& address of ! logical not
+ add | bitwise or
(type) cast & bitwise and
- subtract ~ bitwise not
/ divide ^ bitwise exclusive or
* multiply () FORTRAN array index
= assignment % FORTRAN field selector
== comparison << left shift
>> right shift
4.11. Ctrl+CThe effect of Ctrl+C is different when debugging using the command-line interface or the GUI,and when debugging serial or parallel code.
4.11.1. Command-Line DebuggingIf the program is not running, Ctrl+C can be used to interrupt long-running PGDBG commands.For example, a command requesting disassembly of thousands of instructions might run for along time, and it can be interrupted by Ctrl+C. In such cases the program is not affected.
If the program is running, entering Ctrl+C at the PGDBG command prompt halts execution of theprogram. This is useful in cases where the program ‘hangs’ due to an infinite loop or deadlock.
Sending Ctrl+C, also known as SIGINT, to a program while it is in the middle of initializingits threads, by calling omp_set_num_threads() or entering a parallel region, may kill some of
Command Language
PGI Debugger User's Guide 32
the threads if the signal is sent before each thread is fully initialized. Avoid sending SIGINT inthese situations. Note that when the number of threads employed by a program is large, threadinitialization may take a while.
4.11.2. GUI DebuggingIf the program is running, entering Ctrl+C in the Input field of the Program IO tab sends SIGINTto the program.
4.11.3. MPI DebuggingSending Ctrl+C to a running MPICH1 program, support for which is now deprecated, is notrecommended. For details, refer to Use halt instead of Ctrl+C. Use the PGDBG halt commandas an alternative to sending Ctrl+C to a running program. The PGDBG command prompt must beavailable in order to issue a halt command. The PGDBG command prompt is available whilethreads are running if pgienv threadwait none is set.
As described in Using Continue, when debugging an MPI job via the following command,PGDBG spawns the job in a manner that prevents console-generated interrupts from directlyreaching the MPI launcher or any of the MPI processes.$ pgdbg -mpi ...
In this case, typing Ctrl+C only interrupts PGDBG, leaving the MPI processes running. WhenPGDBG’s thread wait mode is not set to none, you can halt the MPI job after using Ctrl+C byentering PGDBG’s halt command, even if no PGDBG prompt is generated.
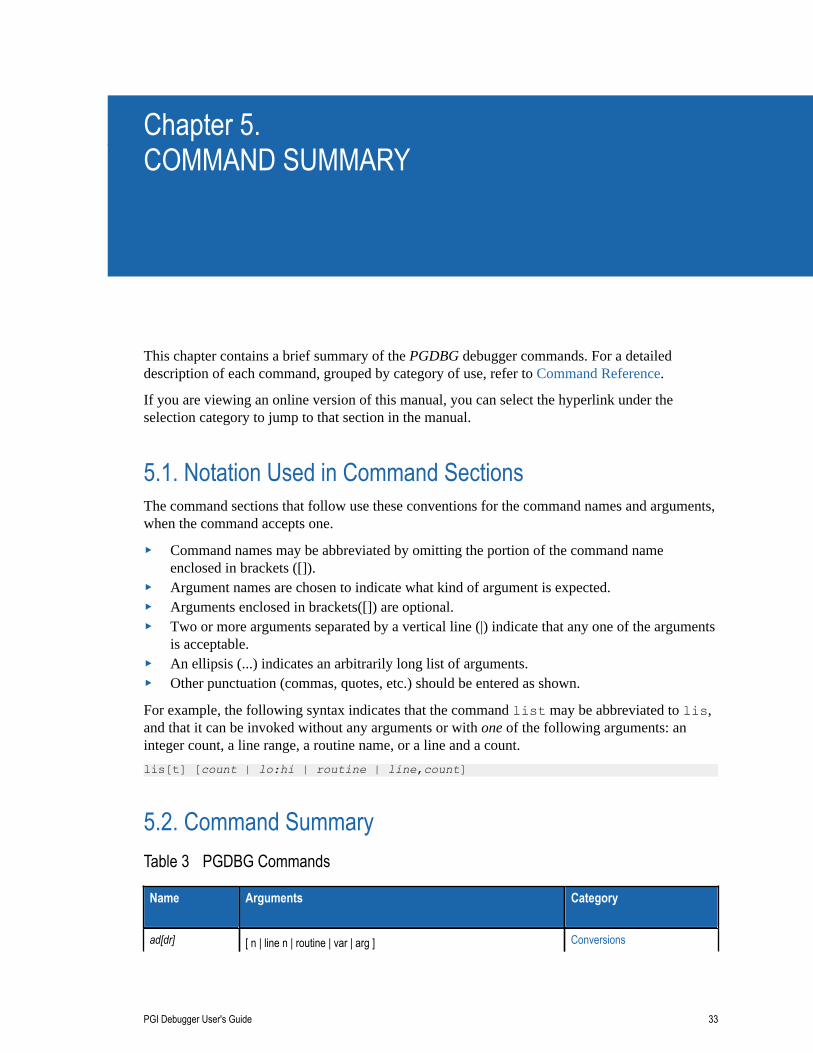
PGI Debugger User's Guide 33
Chapter 5.COMMAND SUMMARY
This chapter contains a brief summary of the PGDBG debugger commands. For a detaileddescription of each command, grouped by category of use, refer to Command Reference.
If you are viewing an online version of this manual, you can select the hyperlink under theselection category to jump to that section in the manual.
5.1. Notation Used in Command SectionsThe command sections that follow use these conventions for the command names and arguments,when the command accepts one.
‣ Command names may be abbreviated by omitting the portion of the command nameenclosed in brackets ([]).
‣ Argument names are chosen to indicate what kind of argument is expected.‣ Arguments enclosed in brackets([]) are optional.‣ Two or more arguments separated by a vertical line (|) indicate that any one of the arguments
is acceptable.‣ An ellipsis (...) indicates an arbitrarily long list of arguments.‣ Other punctuation (commas, quotes, etc.) should be entered as shown.
For example, the following syntax indicates that the command list may be abbreviated to lis,and that it can be invoked without any arguments or with one of the following arguments: aninteger count, a line range, a routine name, or a line and a count.
lis[t] [count | lo:hi | routine | line,count]
5.2. Command SummaryTable 3 PGDBG Commands
Name
Arguments
Category
ad[dr] [ n | line n | routine | var | arg ] Conversions
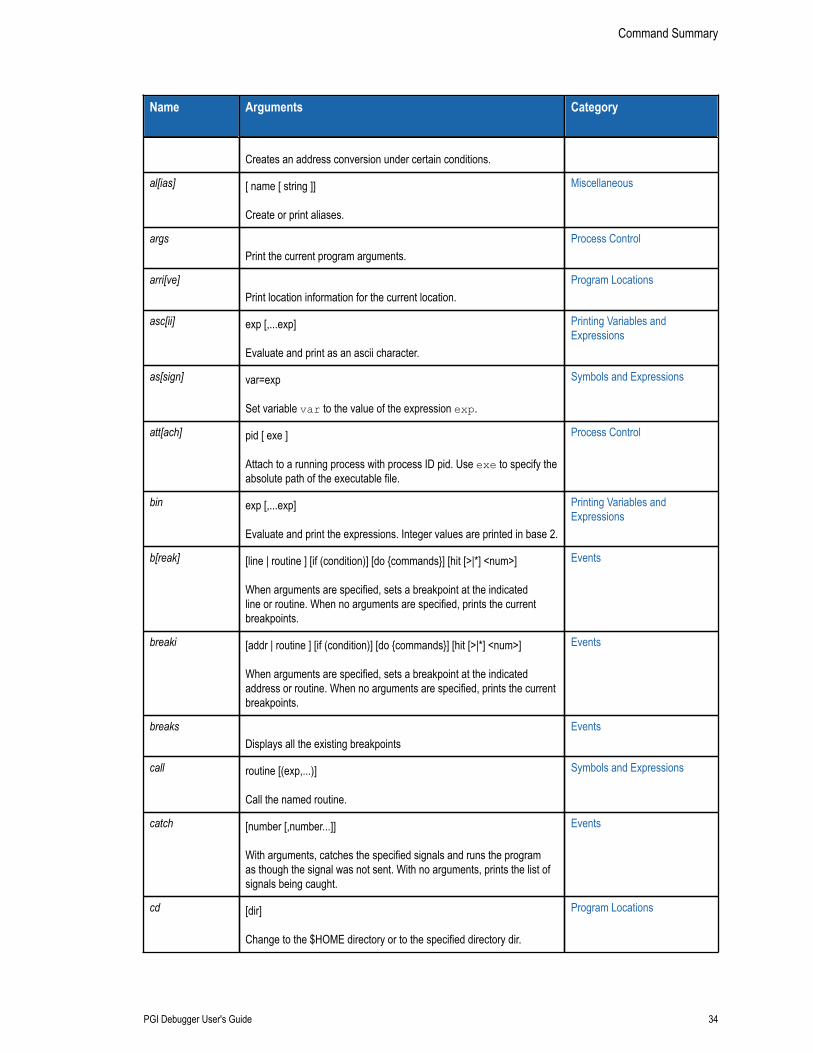
Command Summary
PGI Debugger User's Guide 34
Name
Arguments
Category
Creates an address conversion under certain conditions.
al[ias] [ name [ string ]] Create or print aliases.
Miscellaneous
args Print the current program arguments.
Process Control
arri[ve] Print location information for the current location.
Program Locations
asc[ii] exp [,...exp] Evaluate and print as an ascii character.
Printing Variables andExpressions
as[sign] var=exp Set variable var to the value of the expression exp.
Symbols and Expressions
att[ach] pid [ exe ] Attach to a running process with process ID pid. Use exe to specify theabsolute path of the executable file.
Process Control
bin exp [,...exp] Evaluate and print the expressions. Integer values are printed in base 2.
Printing Variables andExpressions
b[reak] [line | routine ] [if (condition)] [do {commands}] [hit [>|*] <num>] When arguments are specified, sets a breakpoint at the indicatedline or routine. When no arguments are specified, prints the currentbreakpoints.
Events
breaki [addr | routine ] [if (condition)] [do {commands}] [hit [>|*] <num>] When arguments are specified, sets a breakpoint at the indicatedaddress or routine. When no arguments are specified, prints the currentbreakpoints.
Events
breaks Displays all the existing breakpoints
Events
call routine [(exp,...)] Call the named routine.
Symbols and Expressions
catch [number [,number...]] With arguments, catches the specified signals and runs the programas though the signal was not sent. With no arguments, prints the list ofsignals being caught.
Events
cd [dir] Change to the $HOME directory or to the specified directory dir.
Program Locations
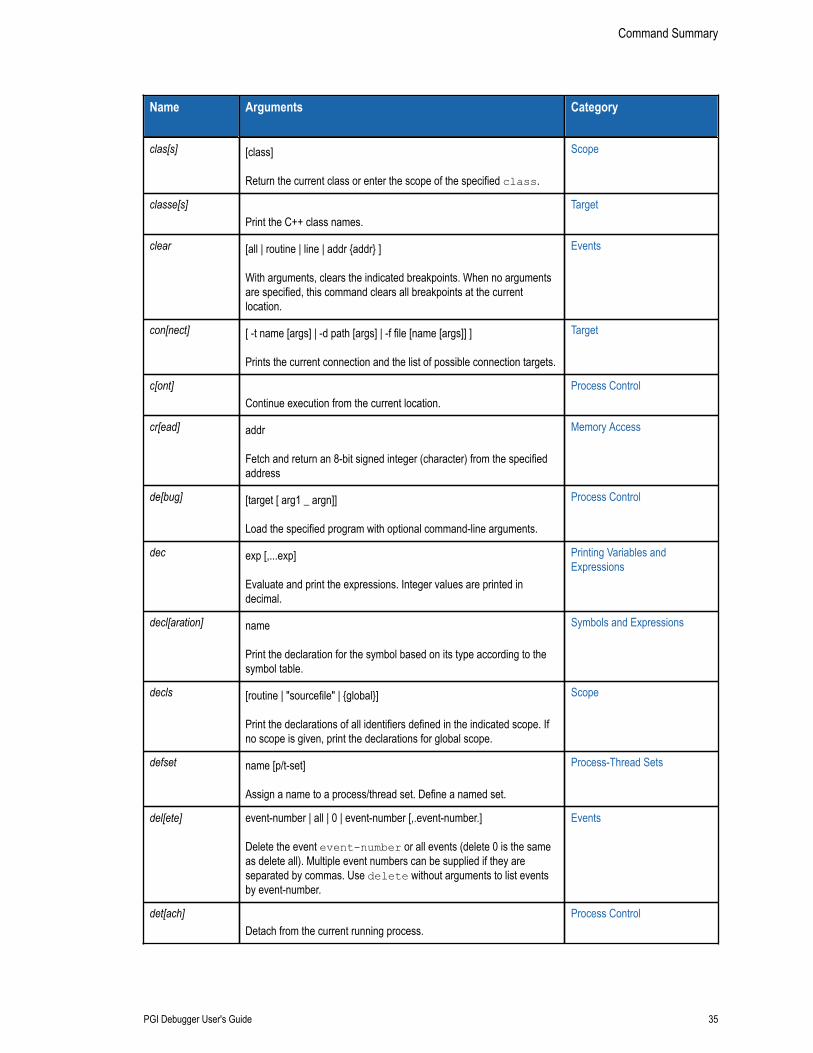
Command Summary
PGI Debugger User's Guide 35
Name
Arguments
Category
clas[s] [class] Return the current class or enter the scope of the specified class.
Scope
classe[s] Print the C++ class names.
Target
clear [all | routine | line | addr {addr} ] With arguments, clears the indicated breakpoints. When no argumentsare specified, this command clears all breakpoints at the currentlocation.
Events
con[nect] [ -t name [args] | -d path [args] | -f file [name [args]] ] Prints the current connection and the list of possible connection targets.
Target
c[ont] Continue execution from the current location.
Process Control
cr[ead] addr Fetch and return an 8-bit signed integer (character) from the specifiedaddress
Memory Access
de[bug] [target [ arg1 _ argn]] Load the specified program with optional command-line arguments.
Process Control
dec exp [,...exp] Evaluate and print the expressions. Integer values are printed indecimal.
Printing Variables andExpressions
decl[aration] name Print the declaration for the symbol based on its type according to thesymbol table.
Symbols and Expressions
decls [routine | "sourcefile" | {global}] Print the declarations of all identifiers defined in the indicated scope. Ifno scope is given, print the declarations for global scope.
Scope
defset name [p/t-set] Assign a name to a process/thread set. Define a named set.
Process-Thread Sets
del[ete] event-number | all | 0 | event-number [,.event-number.] Delete the event event-number or all events (delete 0 is the sameas delete all). Multiple event numbers can be supplied if they areseparated by commas. Use delete without arguments to list eventsby event-number.
Events
det[ach] Detach from the current running process.
Process Control
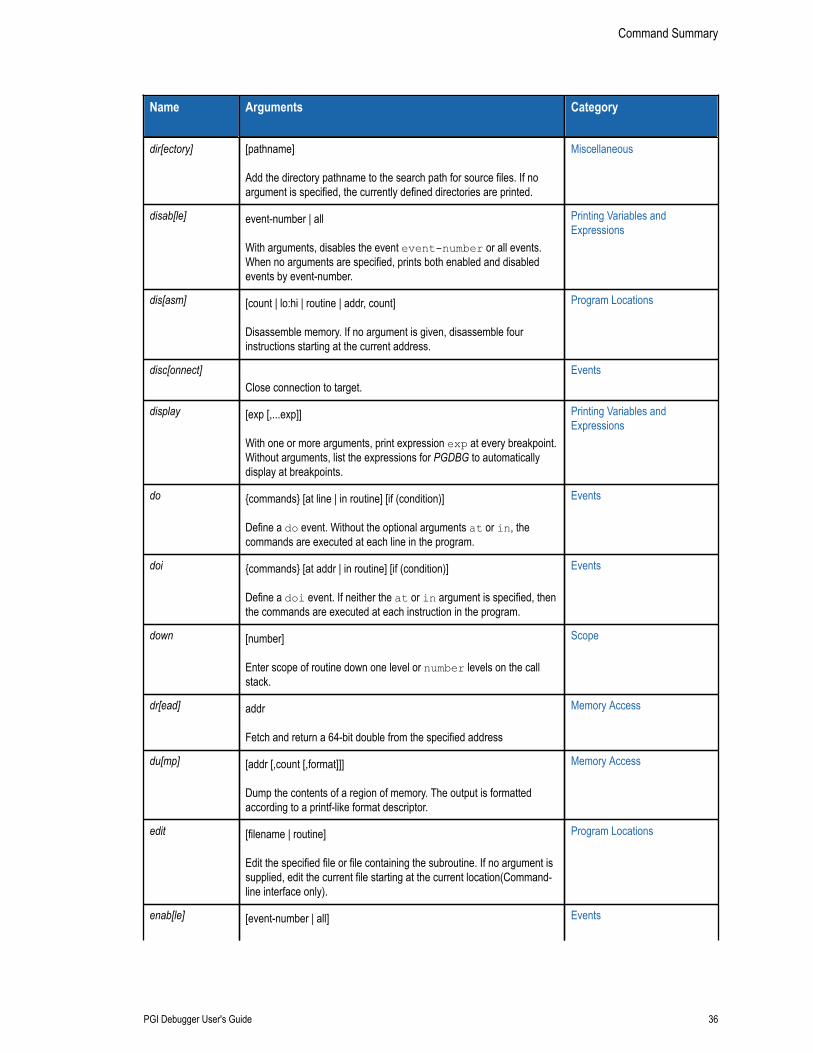
Command Summary
PGI Debugger User's Guide 36
Name
Arguments
Category
dir[ectory] [pathname] Add the directory pathname to the search path for source files. If noargument is specified, the currently defined directories are printed.
Miscellaneous
disab[le] event-number | all With arguments, disables the event event-number or all events.When no arguments are specified, prints both enabled and disabledevents by event-number.
Printing Variables andExpressions
dis[asm] [count | lo:hi | routine | addr, count] Disassemble memory. If no argument is given, disassemble fourinstructions starting at the current address.
Program Locations
disc[onnect] Close connection to target.
Events
display [exp [,...exp]] With one or more arguments, print expression exp at every breakpoint.Without arguments, list the expressions for PGDBG to automaticallydisplay at breakpoints.
Printing Variables andExpressions
do {commands} [at line | in routine] [if (condition)] Define a do event. Without the optional arguments at or in, thecommands are executed at each line in the program.
Events
doi {commands} [at addr | in routine] [if (condition)] Define a doi event. If neither the at or in argument is specified, thenthe commands are executed at each instruction in the program.
Events
down [number] Enter scope of routine down one level or number levels on the callstack.
Scope
dr[ead] addr Fetch and return a 64-bit double from the specified address
Memory Access
du[mp] [addr [,count [,format]]] Dump the contents of a region of memory. The output is formattedaccording to a printf-like format descriptor.
Memory Access
edit [filename | routine] Edit the specified file or file containing the subroutine. If no argument issupplied, edit the current file starting at the current location(Command-line interface only).
Program Locations
enab[le] [event-number | all]
Events
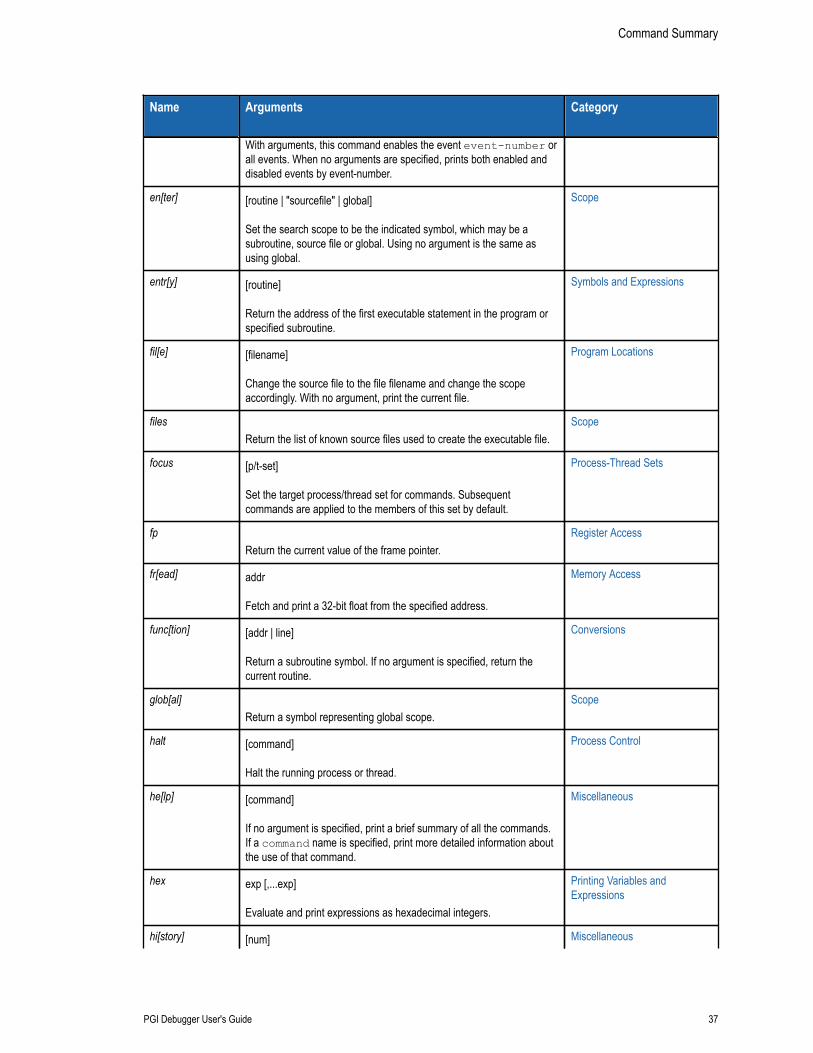
Command Summary
PGI Debugger User's Guide 37
Name
Arguments
Category
With arguments, this command enables the event event-number orall events. When no arguments are specified, prints both enabled anddisabled events by event-number.
en[ter] [routine | "sourcefile" | global] Set the search scope to be the indicated symbol, which may be asubroutine, source file or global. Using no argument is the same asusing global.
Scope
entr[y] [routine] Return the address of the first executable statement in the program orspecified subroutine.
Symbols and Expressions
fil[e] [filename] Change the source file to the file filename and change the scopeaccordingly. With no argument, print the current file.
Program Locations
files Return the list of known source files used to create the executable file.
Scope
focus [p/t-set] Set the target process/thread set for commands. Subsequentcommands are applied to the members of this set by default.
Process-Thread Sets
fp Return the current value of the frame pointer.
Register Access
fr[ead] addr Fetch and print a 32-bit float from the specified address.
Memory Access
func[tion] [addr | line] Return a subroutine symbol. If no argument is specified, return thecurrent routine.
Conversions
glob[al] Return a symbol representing global scope.
Scope
halt [command] Halt the running process or thread.
Process Control
he[lp] [command] If no argument is specified, print a brief summary of all the commands.If a command name is specified, print more detailed information aboutthe use of that command.
Miscellaneous
hex exp [,...exp] Evaluate and print expressions as hexadecimal integers.
Printing Variables andExpressions
hi[story] [num] Miscellaneous
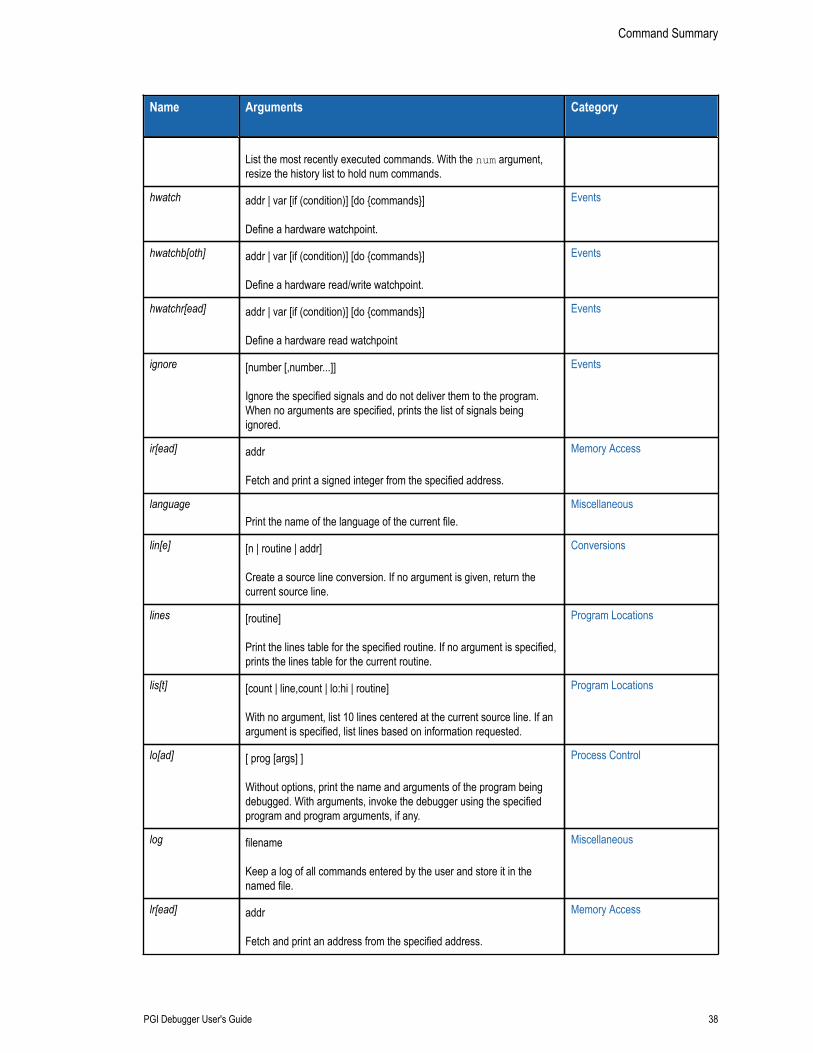
Command Summary
PGI Debugger User's Guide 38
Name
Arguments
Category
List the most recently executed commands. With the num argument,resize the history list to hold num commands.
hwatch addr | var [if (condition)] [do {commands}] Define a hardware watchpoint.
Events
hwatchb[oth] addr | var [if (condition)] [do {commands}] Define a hardware read/write watchpoint.
Events
hwatchr[ead] addr | var [if (condition)] [do {commands}] Define a hardware read watchpoint
Events
ignore [number [,number...]] Ignore the specified signals and do not deliver them to the program.When no arguments are specified, prints the list of signals beingignored.
Events
ir[ead] addr Fetch and print a signed integer from the specified address.
Memory Access
language Print the name of the language of the current file.
Miscellaneous
lin[e] [n | routine | addr] Create a source line conversion. If no argument is given, return thecurrent source line.
Conversions
lines [routine] Print the lines table for the specified routine. If no argument is specified,prints the lines table for the current routine.
Program Locations
lis[t] [count | line,count | lo:hi | routine] With no argument, list 10 lines centered at the current source line. If anargument is specified, list lines based on information requested.
Program Locations
lo[ad] [ prog [args] ] Without options, print the name and arguments of the program beingdebugged. With arguments, invoke the debugger using the specifiedprogram and program arguments, if any.
Process Control
log filename Keep a log of all commands entered by the user and store it in thenamed file.
Miscellaneous
lr[ead] addr Fetch and print an address from the specified address.
Memory Access
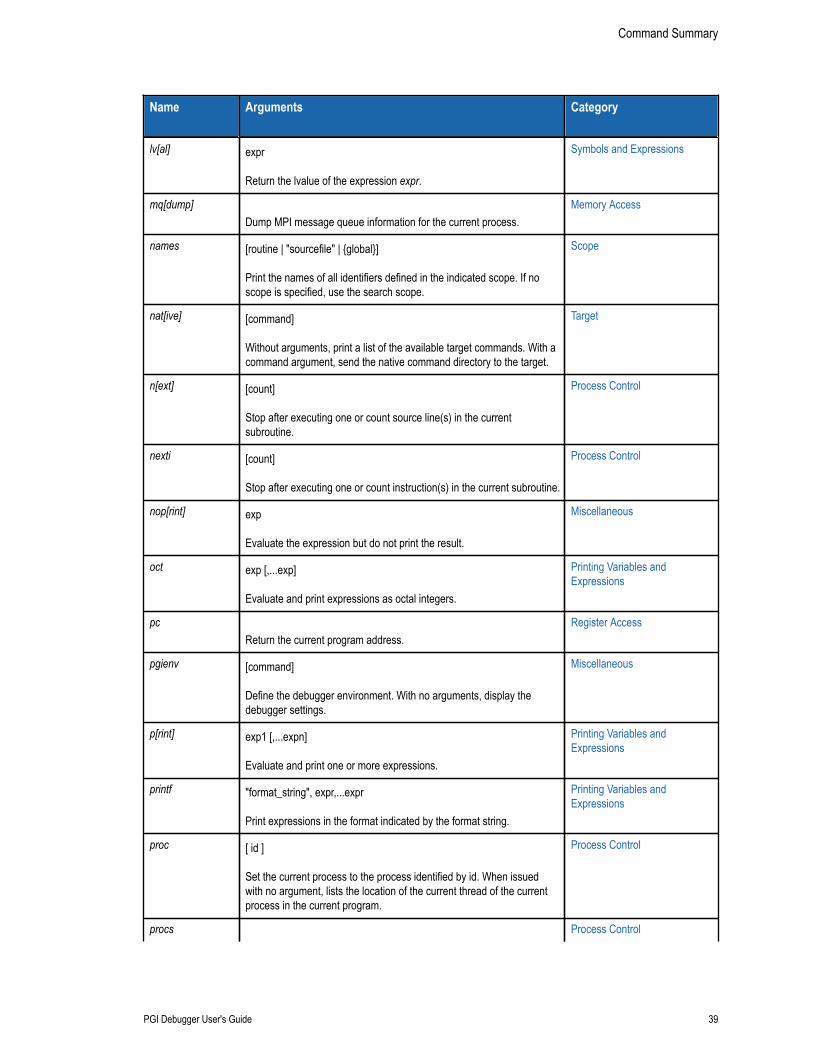
Command Summary
PGI Debugger User's Guide 39
Name
Arguments
Category
lv[al] expr Return the lvalue of the expression expr.
Symbols and Expressions
mq[dump] Dump MPI message queue information for the current process.
Memory Access
names [routine | "sourcefile" | {global}] Print the names of all identifiers defined in the indicated scope. If noscope is specified, use the search scope.
Scope
nat[ive] [command] Without arguments, print a list of the available target commands. With acommand argument, send the native command directory to the target.
Target
n[ext] [count] Stop after executing one or count source line(s) in the currentsubroutine.
Process Control
nexti [count] Stop after executing one or count instruction(s) in the current subroutine.
Process Control
nop[rint] exp Evaluate the expression but do not print the result.
Miscellaneous
oct exp [,...exp] Evaluate and print expressions as octal integers.
Printing Variables andExpressions
pc Return the current program address.
Register Access
pgienv [command] Define the debugger environment. With no arguments, display thedebugger settings.
Miscellaneous
p[rint] exp1 [,...expn] Evaluate and print one or more expressions.
Printing Variables andExpressions
printf "format_string", expr,...expr Print expressions in the format indicated by the format string.
Printing Variables andExpressions
proc [ id ] Set the current process to the process identified by id. When issuedwith no argument, lists the location of the current thread of the currentprocess in the current program.
Process Control
procs Process Control
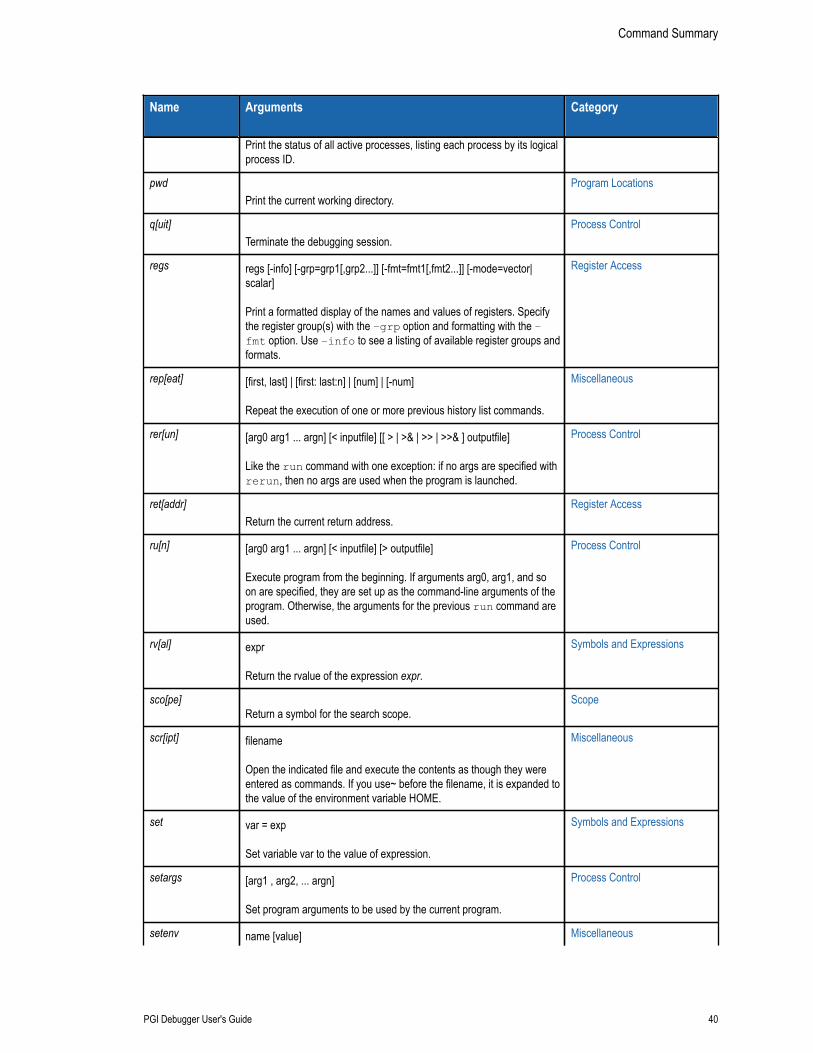
Command Summary
PGI Debugger User's Guide 40
Name
Arguments
Category
Print the status of all active processes, listing each process by its logicalprocess ID.
pwd Print the current working directory.
Program Locations
q[uit] Terminate the debugging session.
Process Control
regs regs [-info] [-grp=grp1[,grp2...]] [-fmt=fmt1[,fmt2...]] [-mode=vector|scalar] Print a formatted display of the names and values of registers. Specifythe register group(s) with the –grp option and formatting with the –fmt option. Use –info to see a listing of available register groups andformats.
Register Access
rep[eat] [first, last] | [first: last:n] | [num] | [-num] Repeat the execution of one or more previous history list commands.
Miscellaneous
rer[un] [arg0 arg1 ... argn] [< inputfile] [[ > | >& | >> | >>& ] outputfile] Like the run command with one exception: if no args are specified withrerun, then no args are used when the program is launched.
Process Control
ret[addr] Return the current return address.
Register Access
ru[n] [arg0 arg1 ... argn] [< inputfile] [> outputfile] Execute program from the beginning. If arguments arg0, arg1, and soon are specified, they are set up as the command-line arguments of theprogram. Otherwise, the arguments for the previous run command areused.
Process Control
rv[al] expr Return the rvalue of the expression expr.
Symbols and Expressions
sco[pe] Return a symbol for the search scope.
Scope
scr[ipt] filename Open the indicated file and execute the contents as though they wereentered as commands. If you use~ before the filename, it is expanded tothe value of the environment variable HOME.
Miscellaneous
set var = exp Set variable var to the value of expression.
Symbols and Expressions
setargs [arg1 , arg2, ... argn] Set program arguments to be used by the current program.
Process Control
setenv name [value] Miscellaneous
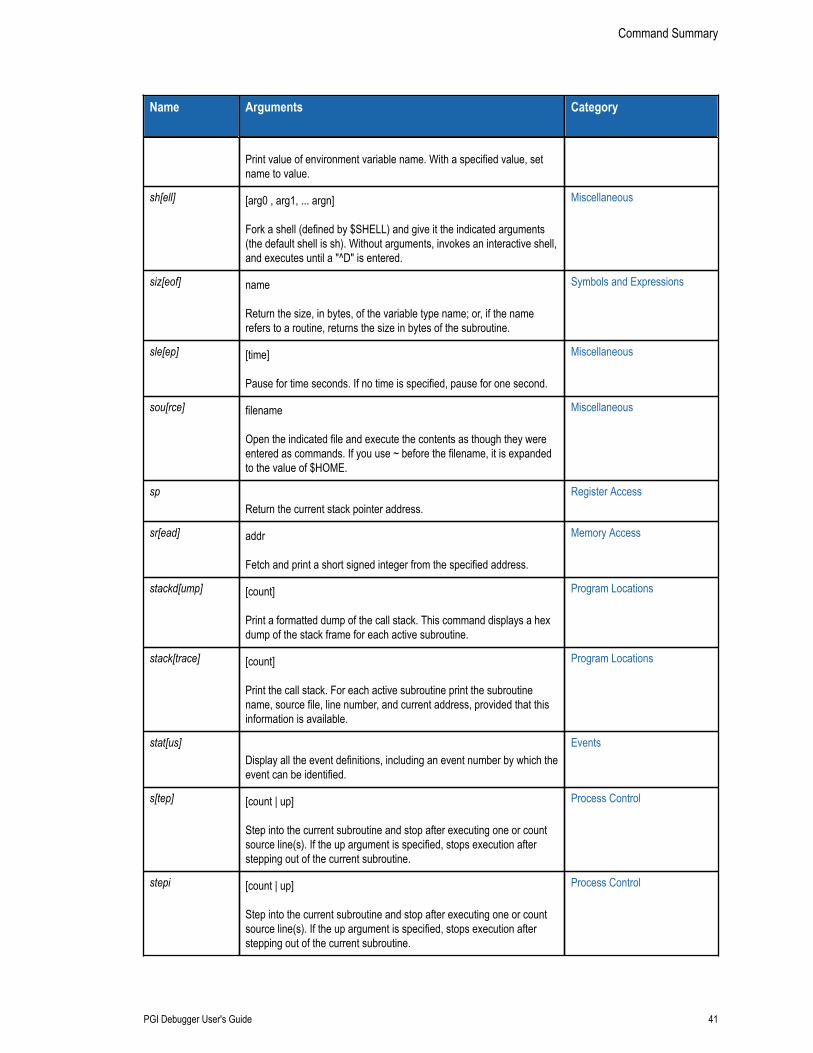
Command Summary
PGI Debugger User's Guide 41
Name
Arguments
Category
Print value of environment variable name. With a specified value, setname to value.
sh[ell] [arg0 , arg1, ... argn] Fork a shell (defined by $SHELL) and give it the indicated arguments(the default shell is sh). Without arguments, invokes an interactive shell,and executes until a "^D" is entered.
Miscellaneous
siz[eof] name Return the size, in bytes, of the variable type name; or, if the namerefers to a routine, returns the size in bytes of the subroutine.
Symbols and Expressions
sle[ep] [time] Pause for time seconds. If no time is specified, pause for one second.
Miscellaneous
sou[rce] filename Open the indicated file and execute the contents as though they wereentered as commands. If you use ~ before the filename, it is expandedto the value of $HOME.
Miscellaneous
sp Return the current stack pointer address.
Register Access
sr[ead] addr Fetch and print a short signed integer from the specified address.
Memory Access
stackd[ump] [count] Print a formatted dump of the call stack. This command displays a hexdump of the stack frame for each active subroutine.
Program Locations
stack[trace] [count] Print the call stack. For each active subroutine print the subroutinename, source file, line number, and current address, provided that thisinformation is available.
Program Locations
stat[us] Display all the event definitions, including an event number by which theevent can be identified.
Events
s[tep] [count | up] Step into the current subroutine and stop after executing one or countsource line(s). If the up argument is specified, stops execution afterstepping out of the current subroutine.
Process Control
stepi [count | up] Step into the current subroutine and stop after executing one or countsource line(s). If the up argument is specified, stops execution afterstepping out of the current subroutine.
Process Control
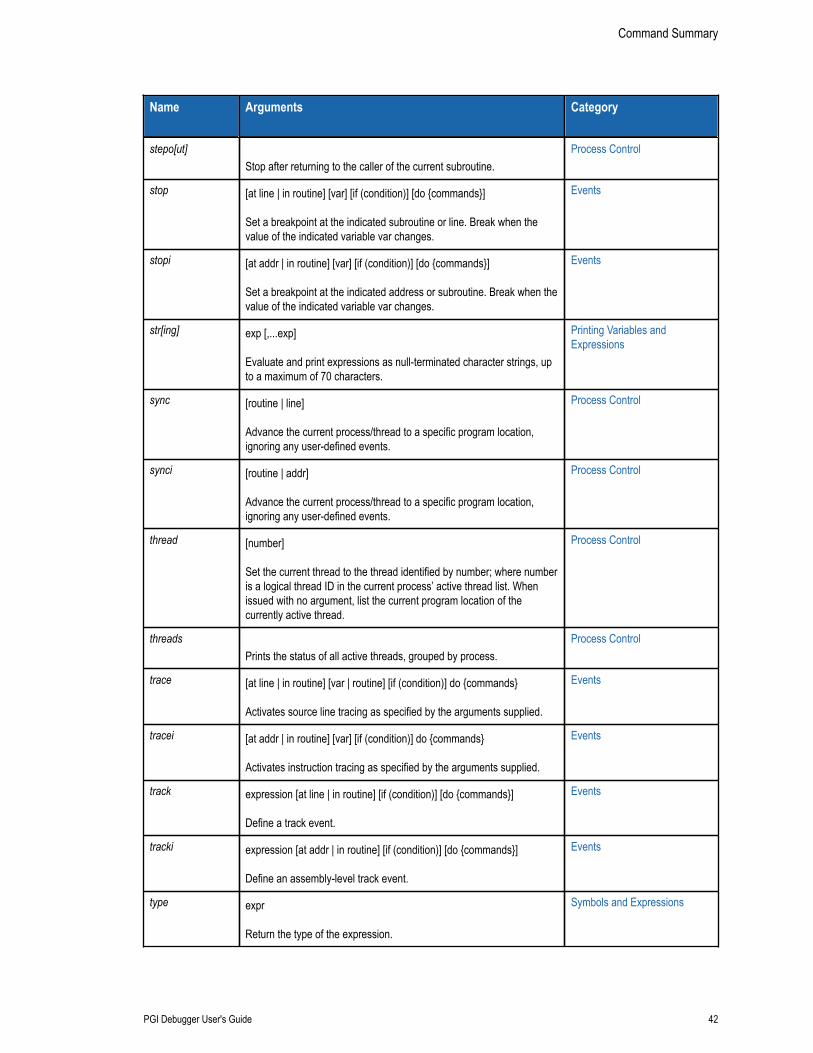
Command Summary
PGI Debugger User's Guide 42
Name
Arguments
Category
stepo[ut] Stop after returning to the caller of the current subroutine.
Process Control
stop [at line | in routine] [var] [if (condition)] [do {commands}] Set a breakpoint at the indicated subroutine or line. Break when thevalue of the indicated variable var changes.
Events
stopi [at addr | in routine] [var] [if (condition)] [do {commands}] Set a breakpoint at the indicated address or subroutine. Break when thevalue of the indicated variable var changes.
Events
str[ing] exp [,...exp] Evaluate and print expressions as null-terminated character strings, upto a maximum of 70 characters.
Printing Variables andExpressions
sync [routine | line] Advance the current process/thread to a specific program location,ignoring any user-defined events.
Process Control
synci [routine | addr] Advance the current process/thread to a specific program location,ignoring any user-defined events.
Process Control
thread [number] Set the current thread to the thread identified by number; where numberis a logical thread ID in the current process’ active thread list. Whenissued with no argument, list the current program location of thecurrently active thread.
Process Control
threads Prints the status of all active threads, grouped by process.
Process Control
trace [at line | in routine] [var | routine] [if (condition)] do {commands} Activates source line tracing as specified by the arguments supplied.
Events
tracei [at addr | in routine] [var] [if (condition)] do {commands} Activates instruction tracing as specified by the arguments supplied.
Events
track expression [at line | in routine] [if (condition)] [do {commands}] Define a track event.
Events
tracki expression [at addr | in routine] [if (condition)] [do {commands}] Define an assembly-level track event.
Events
type expr Return the type of the expression.
Symbols and Expressions
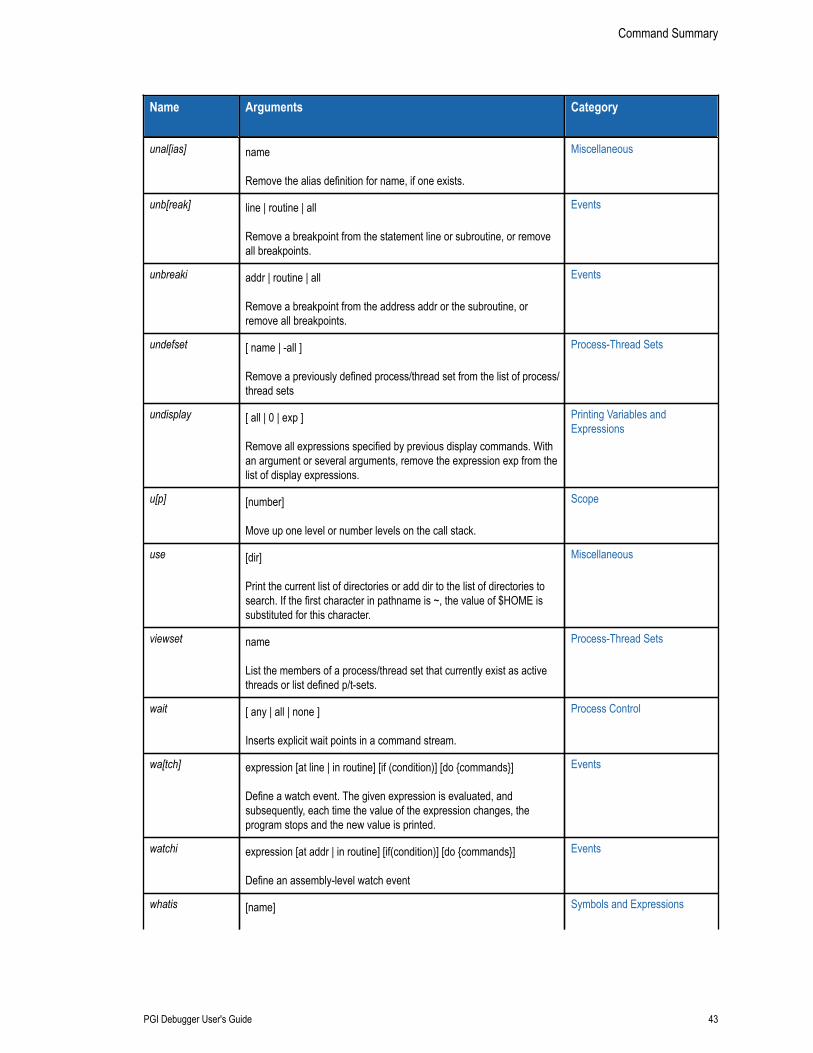
Command Summary
PGI Debugger User's Guide 43
Name
Arguments
Category
unal[ias] name Remove the alias definition for name, if one exists.
Miscellaneous
unb[reak] line | routine | all Remove a breakpoint from the statement line or subroutine, or removeall breakpoints.
Events
unbreaki addr | routine | all Remove a breakpoint from the address addr or the subroutine, orremove all breakpoints.
Events
undefset [ name | -all ] Remove a previously defined process/thread set from the list of process/thread sets
Process-Thread Sets
undisplay [ all | 0 | exp ] Remove all expressions specified by previous display commands. Withan argument or several arguments, remove the expression exp from thelist of display expressions.
Printing Variables andExpressions
u[p] [number] Move up one level or number levels on the call stack.
Scope
use [dir] Print the current list of directories or add dir to the list of directories tosearch. If the first character in pathname is ~, the value of $HOME issubstituted for this character.
Miscellaneous
viewset name List the members of a process/thread set that currently exist as activethreads or list defined p/t-sets.
Process-Thread Sets
wait [ any | all | none ] Inserts explicit wait points in a command stream.
Process Control
wa[tch] expression [at line | in routine] [if (condition)] [do {commands}] Define a watch event. The given expression is evaluated, andsubsequently, each time the value of the expression changes, theprogram stops and the new value is printed.
Events
watchi expression [at addr | in routine] [if(condition)] [do {commands}] Define an assembly-level watch event
Events
whatis [name]
Symbols and Expressions
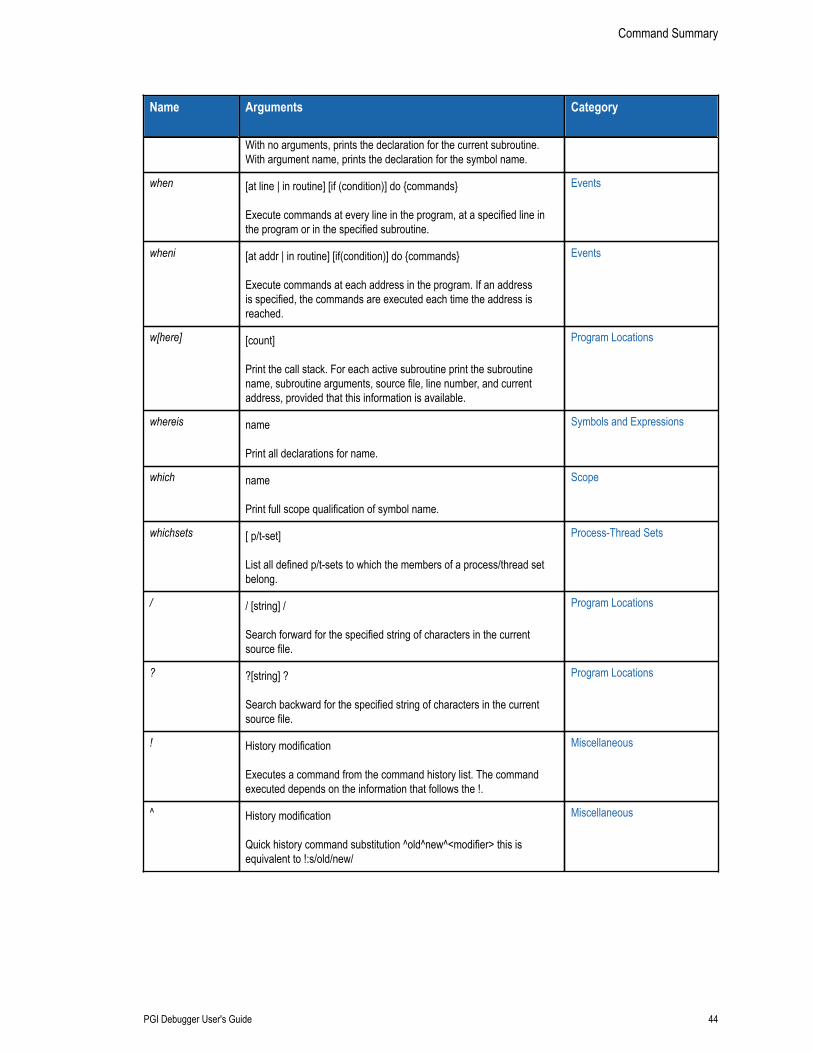
Command Summary
PGI Debugger User's Guide 44
Name
Arguments
Category
With no arguments, prints the declaration for the current subroutine.With argument name, prints the declaration for the symbol name.
when [at line | in routine] [if (condition)] do {commands} Execute commands at every line in the program, at a specified line inthe program or in the specified subroutine.
Events
wheni [at addr | in routine] [if(condition)] do {commands} Execute commands at each address in the program. If an addressis specified, the commands are executed each time the address isreached.
Events
w[here] [count] Print the call stack. For each active subroutine print the subroutinename, subroutine arguments, source file, line number, and currentaddress, provided that this information is available.
Program Locations
whereis name Print all declarations for name.
Symbols and Expressions
which name Print full scope qualification of symbol name.
Scope
whichsets [ p/t-set] List all defined p/t-sets to which the members of a process/thread setbelong.
Process-Thread Sets
/ / [string] / Search forward for the specified string of characters in the currentsource file.
Program Locations
? ?[string] ? Search backward for the specified string of characters in the currentsource file.
Program Locations
! History modification Executes a command from the command history list. The commandexecuted depends on the information that follows the !.
Miscellaneous
^ History modification Quick history command substitution ^old^new^<modifier> this isequivalent to !:s/old/new/
Miscellaneous
PGI Debugger User's Guide 45
Chapter 6.ASSEMBLY-LEVEL DEBUGGING
This chapter provides information about PGDBG assembly-level debugging, including anoverview about what to expect if you are using assembly-level debugging or if you did notcompile your program for debugging.
6.1. Assembly-Level Debugging OverviewPGDBG supports debugging regardless of how a program was compiled. In other words, PGDBGdoes not require that the program under debug be compiled with debugging information, suchas using —g. It can debug code that is lacking debug information, but because it is missinginformation about symbols and line numbers, it can only access the program at the assemblylevel. PGDBG also supports debugging at the assembly level if debug symbols are available.
As described in Building Applications for Debug, the richest debugging experience is availablewhen the program is compiled using —g or -gopt with no optimization. When a program iscompiled at higher levels of optimization, less information about source-level symbols and linenumbers is available, even if the program was compiled with —g or —gopt. In such cases, if youwant to find the source of a problem without rebuilding the program, you may need to debug atthe assembly level.
If a program has been "stripped" of all symbols, either by the linker or a separate utility, thendebugging will be at the assembly level. PGDBG is only able to examine or control the programin terms of memory addresses and registers.
6.1.1. Assembly-Level Debugging on WindowsWhen applications are built without —g on Windows systems, the resulting binary, the .exefile, does not contain any symbol information. The Microsoft linker stores symbol informationin a program database, a .pdb file. To generate a .pdb file using the PGI compiler drivers, youmust use —g during the link step. You can do this even if you did not use —g during the compilestep. Having this .pdb file available provides PGDBG with enough symbol information to mapaddresses to routine names.
Assembly-Level Debugging
PGI Debugger User's Guide 46
6.1.2. Assembly-Level Debugging with FortranTo refer to Fortran symbol names when debugging at the assembly level, you must translatenames so these match the calling convention in use by the compiler. For code compiled by thePGI compilers, in most cases this means translating Fortran names to lower case and appendingan underscore. For example, a routine that appears in the source code as "VADD" would bereferred to in the debugger as "vadd_".
On 32-bit Windows systems there are alternative calling conventions. The one described abovematches the convention used when the compiler is invoked with -Miface=unix (previously-Munix). For details of other 32-bit Windows calling conventions, refer to the PGI CompilerUser's Guide.
Name translation is only necessary for assembly-level debugging. When debugging at the source level, youmay refer to symbol names as they appear in the source.
A special symbol, MAIN_, is created by PGFORTRAN to refer to the main program.PGFORTRAN generates this special symbol whether or not there is a PROGRAM statement.One way to run to the beginning of a Fortran program is to set a breakpoint on MAIN_, then run.
6.1.3. Assembly-Level Debugging with C++C++ symbol names are "mangled" names. For the names of C++ methods, the names are modifiedto include not only the name as it appears in the source code, but information about the enclosingclass hierarchy, argument and return types, and other information. The names are long andarcane. At the source level these names are translated by PGDBG to the names as they appear inthe source. At the assembly level, these names are in the mangled form. Translation is not easyand not recommended. If you have no other alternative, you can find information about namemangling in the PGI Compiler User's Guide.
6.1.4. Assembly-Level Debugging Using the PGDBG GUIThis section describes some basic operations for assembly-level debugging using the PGDBGGUI. If you encounter the message “;Can’t find main function compiled -g” onstartup, assembly-level debugging is required.
To get into a program in this situation, you can select the Debug | Set Breakpoint... menu option.For example, to stop at program entry, in Fortran you could enter MAIN_ in response to the dialogquery, while in C or C++ you could enter main.
PGDBG debug information tabs that are useful in assembly-level debugging include the CallStack, Memory, and Register tabs. Disassembly is automatically shown in the source pane whensource files are available. You can also switch from source to disassembly debugging by selectingthe View | Show Assembly menu option.
6.1.5. Assembly-Level Debugging Using the PGDBG CLIThis section describes some basic operations for assembly-level debugging using the PGDBGcommand-line interface. When you invoke the PGDBG CLI and are presented with a message
Assembly-Level Debugging
PGI Debugger User's Guide 47
telling you that PGDBG "Can't find main function compiled -g", assembly-leveldebugging is required.
To get into the program, you can set a breakpoint at a named routine. To stop at program entry,for example, in Fortran you could use pgdbg> break MAIN_
and in C/ C++ you could use pgdbg> break main
Some useful commands for assembly-level debugging using the PGDBG command-line interfaceinclude:
run
run the program from the beginning
cont
continue program execution from the current point
nexti
single-step one instruction, stepping over calls
stepi
single-step one instruction, stepping into calls
breaki
set a breakpoint at a given address
regs
display the registers
print $<regname>
display the value of the specified register
For more information on register names, refer to SSE Register Symbols.
dump
dump memory locations
stacktrace
display the current call stack.
stackdump
display the current call stack.
6.2. SSE Register SymbolsX64 processors and x86 processors starting with Pentium III provide SSE (Streaming SIMDEnhancements) registers and a SIMD floating-point control/status register.
Each SSE register may contain four 32-bit single-precision or two 64-bit floating-point values.The PGDBG regs command reports these values individually in both hexadecimal and floating-
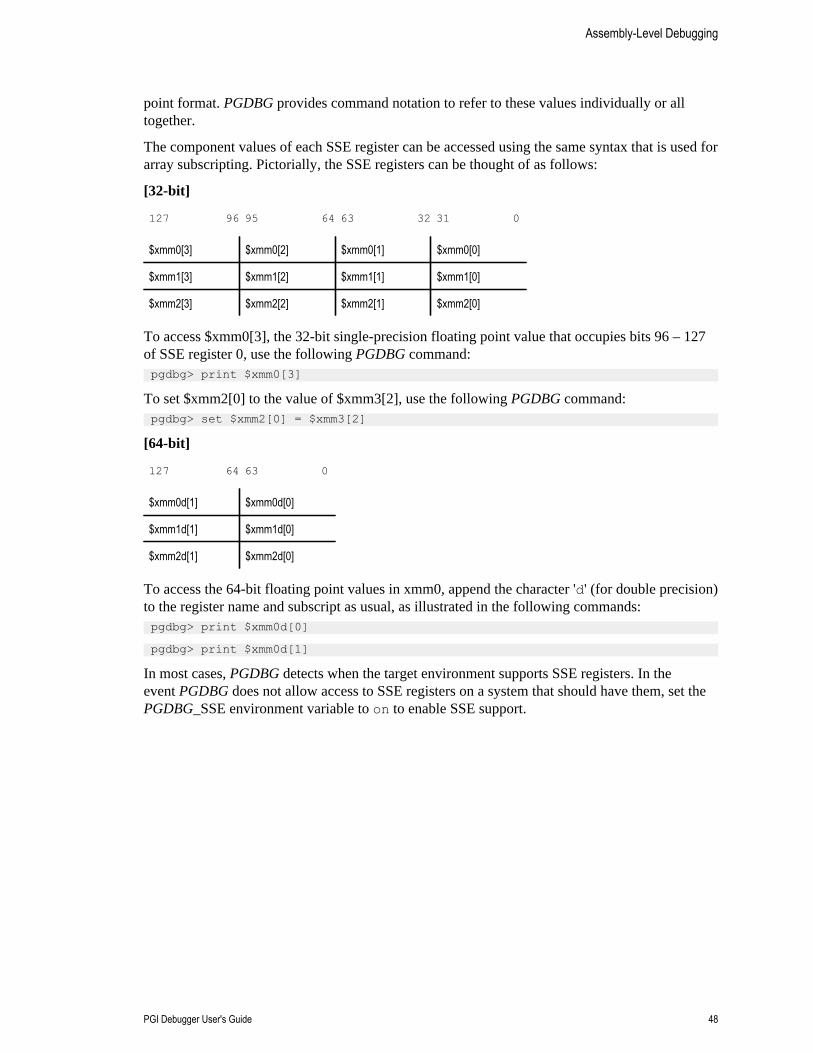
Assembly-Level Debugging
PGI Debugger User's Guide 48
point format. PGDBG provides command notation to refer to these values individually or alltogether.
The component values of each SSE register can be accessed using the same syntax that is used forarray subscripting. Pictorially, the SSE registers can be thought of as follows:
[32-bit]
127 96 95 64 63 32 31 0
$xmm0[3] $xmm0[2] $xmm0[1] $xmm0[0]
$xmm1[3] $xmm1[2] $xmm1[1] $xmm1[0]
$xmm2[3] $xmm2[2] $xmm2[1] $xmm2[0]
To access $xmm0[3], the 32-bit single-precision floating point value that occupies bits 96 – 127of SSE register 0, use the following PGDBG command: pgdbg> print $xmm0[3]
To set $xmm2[0] to the value of $xmm3[2], use the following PGDBG command: pgdbg> set $xmm2[0] = $xmm3[2]
[64-bit]
127 64 63 0
$xmm0d[1] $xmm0d[0]
$xmm1d[1] $xmm1d[0]
$xmm2d[1] $xmm2d[0]
To access the 64-bit floating point values in xmm0, append the character 'd' (for double precision)to the register name and subscript as usual, as illustrated in the following commands: pgdbg> print $xmm0d[0]
pgdbg> print $xmm0d[1]
In most cases, PGDBG detects when the target environment supports SSE registers. In theevent PGDBG does not allow access to SSE registers on a system that should have them, set thePGDBG_SSE environment variable to on to enable SSE support.
PGI Debugger User's Guide 49
Chapter 7.SOURCE-LEVEL DEBUGGING
This section describes source-level debugging, including debugging Fortran and C++.
7.1. Debugging Fortran
7.1.1. Fortran TypesPGDBG displays Fortran type declarations using Fortran type names. The only exception isFortran character types, which are treated as arrays of the C type char.
7.1.2. ArraysFortran array subscripts and ranges are accessed using the Fortran language syntax convention,denoting subscripts with parentheses and ranges with colons.
PGI compilers for the linux86-64 platform (Intel 64 or AMD64) support large arrays (arrays withan aggregate size greater than 2GB). You can enable large array support by compiling using theseoptions:–mcmodel=medium –Mlarge_arrays. PGDBG provides full support for large arraysand large subscripts.
PGDBG supports arrays with non-default lower bounds. Access to such arrays uses the samesubscripts that are used in the program.
PGDBG also supports adjustable arrays. Access to adjustable arrays may use the samesubscripting that is used in the program.
7.1.3. OperatorsIn general, PGDBG uses C language style operators in expressions and supports the Fortranarray index selector “()” and the Fortran field selector “%” for derived types. However, .eq.,
Source-Level Debugging
PGI Debugger User's Guide 50
.ne., and so forth are not supported. You must use the analogous C operators ==, !=, and so on,instead.
The precedence of operators matches the C language, which may in some cases be different than thatused in Fortran.
See PGDBG Commands for a complete list of operators and their definition.
7.1.4. Name of the Main RoutineIf a PROGRAM statement is used, the name of the main routine is the name in the programstatement. You can always use the following command to set a breakpoint at the start of the mainroutine.break MAIN
7.1.5. Common BlocksEach subprogram that defines a common block has a local static variable symbol to definethe common. The address of the variable is the address of the common block. The type of thevariable is a locally-defined structure type with fields defined for each element of the commonblock. The name of the variable is the common block name, if the common block has a name, or_BLNK_ otherwise.
For each member of the common block, a local static variable is declared which represents thecommon block variable. Thus given declarations:common /xyz/ a, binteger ainteger b
then the entire common block can be printed out using,print xyz
Individual elements can be accessed by name. For example:,print a, b
7.1.6. Internal ProceduresTo unambiguously reference an internal procedure, qualify its name with the name of its hostusing the scoping operator @.
For example:subroutine sub1 () call internal_proc () contains subroutine internal_proc () print *, "internal_proc in sub1" end subroutine internal_procend subroutine
subroutine sub2 () call internal_proc () contains subroutine internal_proc () print *, "internal_proc in sub2" end subroutine internal_proc
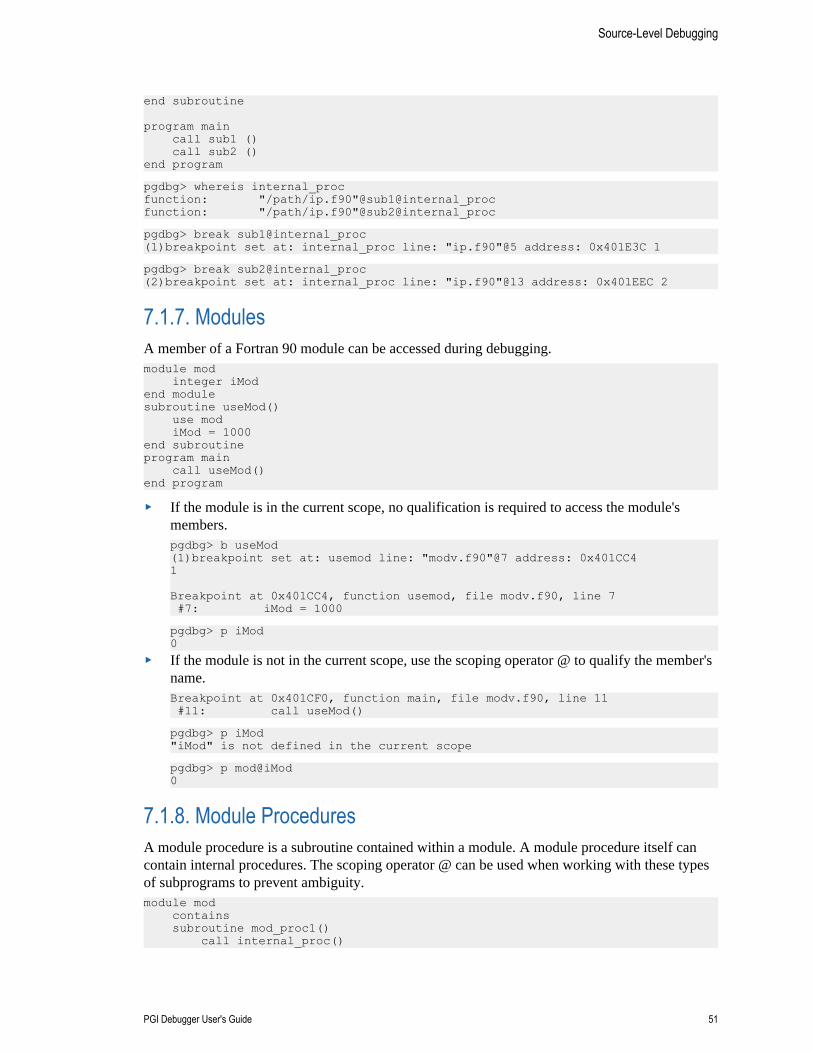
Source-Level Debugging
PGI Debugger User's Guide 51
end subroutine
program main call sub1 () call sub2 ()end program
pgdbg> whereis internal_procfunction: "/path/ip.f90"@sub1@internal_procfunction: "/path/ip.f90"@sub2@internal_proc
pgdbg> break sub1@internal_proc(1)breakpoint set at: internal_proc line: "ip.f90"@5 address: 0x401E3C 1
pgdbg> break sub2@internal_proc(2)breakpoint set at: internal_proc line: "ip.f90"@13 address: 0x401EEC 2
7.1.7. ModulesA member of a Fortran 90 module can be accessed during debugging.module mod integer iModend modulesubroutine useMod() use mod iMod = 1000end subroutineprogram main call useMod()end program
‣ If the module is in the current scope, no qualification is required to access the module'smembers.pgdbg> b useMod(1)breakpoint set at: usemod line: "modv.f90"@7 address: 0x401CC4 1
Breakpoint at 0x401CC4, function usemod, file modv.f90, line 7 #7: iMod = 1000
pgdbg> p iMod0
‣ If the module is not in the current scope, use the scoping operator @ to qualify the member'sname.Breakpoint at 0x401CF0, function main, file modv.f90, line 11 #11: call useMod()
pgdbg> p iMod"iMod" is not defined in the current scope
pgdbg> p mod@iMod0
7.1.8. Module ProceduresA module procedure is a subroutine contained within a module. A module procedure itself cancontain internal procedures. The scoping operator @ can be used when working with these typesof subprograms to prevent ambiguity.module mod contains subroutine mod_proc1() call internal_proc()
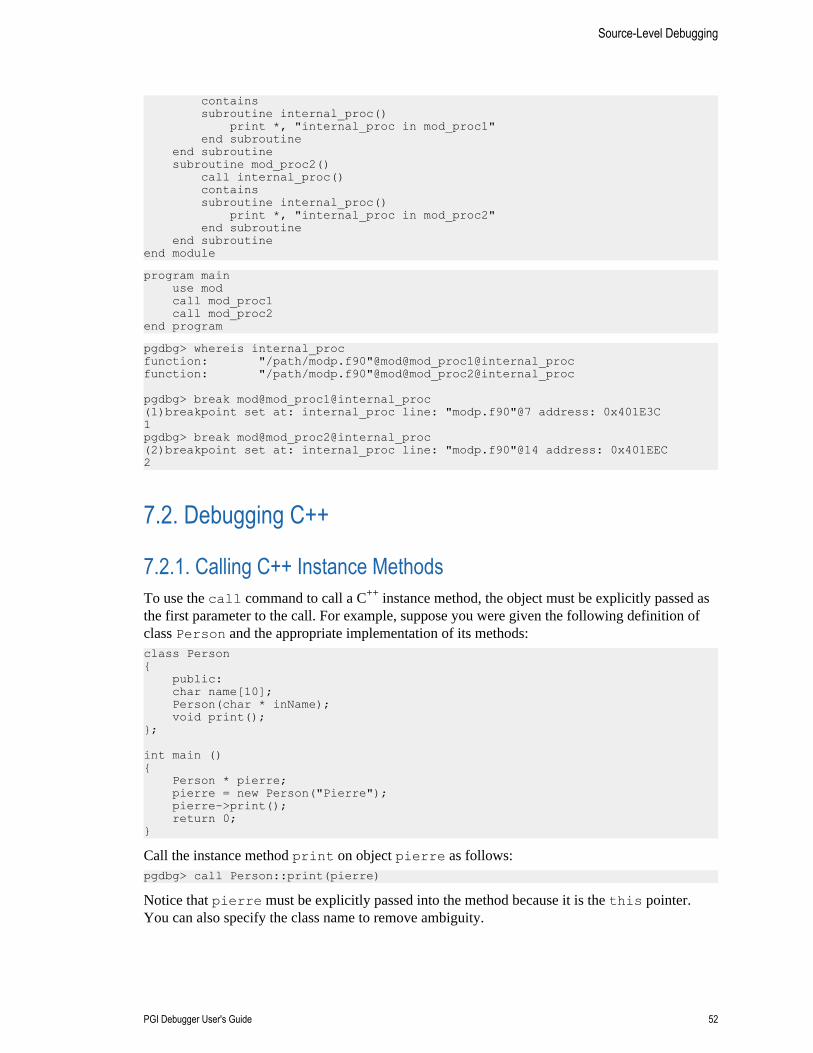
Source-Level Debugging
PGI Debugger User's Guide 52
contains subroutine internal_proc() print *, "internal_proc in mod_proc1" end subroutine end subroutine subroutine mod_proc2() call internal_proc() contains subroutine internal_proc() print *, "internal_proc in mod_proc2" end subroutine end subroutineend module
program main use mod call mod_proc1 call mod_proc2end program
pgdbg> whereis internal_procfunction: "/path/modp.f90"@mod@mod_proc1@internal_procfunction: "/path/modp.f90"@mod@mod_proc2@internal_proc
pgdbg> break mod@mod_proc1@internal_proc(1)breakpoint set at: internal_proc line: "modp.f90"@7 address: 0x401E3C 1pgdbg> break mod@mod_proc2@internal_proc(2)breakpoint set at: internal_proc line: "modp.f90"@14 address: 0x401EEC 2
7.2. Debugging C++
7.2.1. Calling C++ Instance MethodsTo use the call command to call a C++ instance method, the object must be explicitly passed asthe first parameter to the call. For example, suppose you were given the following definition ofclass Person and the appropriate implementation of its methods:class Person{ public: char name[10]; Person(char * inName); void print();};
int main (){ Person * pierre; pierre = new Person("Pierre"); pierre->print(); return 0;}
Call the instance method print on object pierre as follows:pgdbg> call Person::print(pierre)
Notice that pierre must be explicitly passed into the method because it is the this pointer.You can also specify the class name to remove ambiguity.
PGI Debugger User's Guide 53
Chapter 8.PLATFORM-SPECIFIC FEATURES
This section describes the PGDBG features that are specific to particular platforms, such aspathname conventions, debugging with core files, and signals.
8.1. Pathname ConventionsPGDBG uses the forward slash character (/) internally as the path component separator on allplatforms. The backslash (\) is used as the escape character in the PGDBG command language.
On Windows systems, use backslash as the path component separator in the fields of theConnections tab. Use the forward slash as the path component separator when using a debuggercommand in the Command tab or in the CLI. The forward slash separator convention is still ineffect when using a drive letter to specify a full path. For example, to add the Windows pathnameC:/Temp/src to the list of searched source directories, use the command:pgdbg> dir C:/Temp/src
To set a breakpoint at line 10 of the source file specified by the relative path sub1\main.c, usethis command:pgdbg> break "sub1/main.c":10
8.2. Debugging with Core FilesPGDBG supports debugging of core files on Linux platforms. In the GUI, select the Core optionon the Connections tab to enable core file debugging. Fill in the Program and Core File fields andopen the connection to load the core file.
You can also launch PGDBG for core file debugging from the command line. To do this, use thefollowing options:$ pgdbg –core coreFileName programName
Core files (or core dumps) are generated when a program encounters an exception or fault.For example, one common exception is the segmentation violation, which can be caused byreferencing an invalid memory address. The memory and register states of the program arewritten into a core file so that they can be examined by a debugger.
Platform-Specific Features
PGI Debugger User's Guide 54
The shell environment in which the application runs must be set up to allow core file creation. Onmany systems, the default user setting ulimit does not allow core file creation.
Check the ulimit as follows:
For sh/bash users:$ ulimit -c
For csh/tcsh users:% limit coredumpsize
If the core file size limit is zero or something too small for the application, it can be set tounlimited as follows:
For sh/bash users:$ ulimit -c unlimited
For csh/tcsh users:% limit coredumpsize unlimited
See the Linux shell documentation for more details. Some versions of Linux provide system-widelimits on core file creation.
The core file is normally written into the current directory of the faulting application. It isusually named core or core.pid where pid is the process ID of the faulting thread. If the shellenvironment is set correctly and a core file is not generated in the expected location, the systemcore dump policy may require configuration by a system administrator.
Different versions of Linux handle core dumping slightly differently. The state of all processthreads are written to the core file in most modern implementations of Linux. In some newversions of Linux, if more than one thread faults, then each thread’s state is written to separatecore files using the core.pid file naming convention previously described. In older versions ofLinux, only one faulting thread is written to the core file.
If a program uses dynamically shared objects (i.e., shared libraries named lib*.so), as mostprograms on Linux do, then accurate core file debugging requires that the program be debuggedon the system where the core file was created. Otherwise, slight differences in the version ofa shared library or the dynamic linker can cause erroneous information to be presented by thedebugger. Sometimes a core file can be debugged successfully on a different system, particularlyon more modern Linux systems, but you should take care when attempting this.
When debugging core files, PGDBG:
‣ Supports all non-control commands.‣ Performs any command that does not cause the program to run.‣ Generates an error message in PGDBG for any command that causes the program to run.‣ May provide the status of multiple threads, depending on the type of core file created.
PGDBG does not support multi-process core file debugging.
Platform-Specific Features
PGI Debugger User's Guide 55
8.3. SignalsPGDBG intercepts all signals sent to any of the threads in a multi-threaded program and passesthem on according to that signal's disposition as maintained by PGDBG (see the catch andignore commands), except for signals that cannot be intercepted or signals used internally byPGDBG.
8.3.1. Signals Used Internally by PGDBGSIGTRAP and SIGSTOP are used by Linux for communication of application events to PGDBG.Management of these signals is internal to PGDBG. Changing the disposition of these signals inPGDBG (via catch and ignore) results in undefined behavior.
8.3.2. Signals Used by Linux LibrariesSome Linux thread libraries use SIGRT1 and SIGRT3 to communicate among threads internally.Other Linux thread libraries, on systems that do not have support for real-time signals in thekernel, use SIGUSR1 and SIGUSR2. Changing the disposition of these signals in PGDBG (viacatch and ignore) results in undefined behavior.
Target applications compiled with the options –pg or profiled with pgprof generate numerousSIGPROF signals. Although SIGPROF can be handled by PGDBG via the ignore command,debugging of applications built for sample-based profiling is not recommended.
PGI Debugger User's Guide 56
Chapter 9.PARALLEL DEBUGGING OVERVIEW
This section provides an overview of how to use PGDBG to debug parallel applications. Itincludes important definitions and background information on how PGDBG represents processesand threads.
9.1. Overview of Parallel Debugging CapabilityPGDBG is a parallel application debugger capable of debugging multi-process MPI applications,multi-thread and OpenMP applications, and hybrid multi-thread/multi-process applications thatuse MPI to communicate between multi-threaded or OpenMP processes.
For specific information on multi-thread and OpenMP debugging, refer to Parallel Debuggingwith OpenMP.
For specific information on multi-process MPI debugging, refer to Parallel Debugging with MPI.
9.1.1. Graphical Presentation of Threads and ProcessesPGDBG graphical user interface components that provide support for parallelism are described indetail in The Graphical User Interface.
9.2. Basic Process and Thread NamingBecause PGDBG can debug multi-threaded, multi-process, and hybrid multi-threaded/multi-process applications, it provides a convention for uniquely identifying each thread in eachprocess. This section gives a brief overview of this naming convention and how it is used toprovide adequate background for the subsequent sections. A more detailed discussion of thisconvention, including advanced techniques for applying it, is provided in Thread and ProcessGrouping and Naming.
PGDBG identifies threads in an OpenMP application using the OpenMP thread IDs. Otherwise,PGDBG assigns arbitrary IDs to threads, starting at zero and incrementing in order of threadcreation.
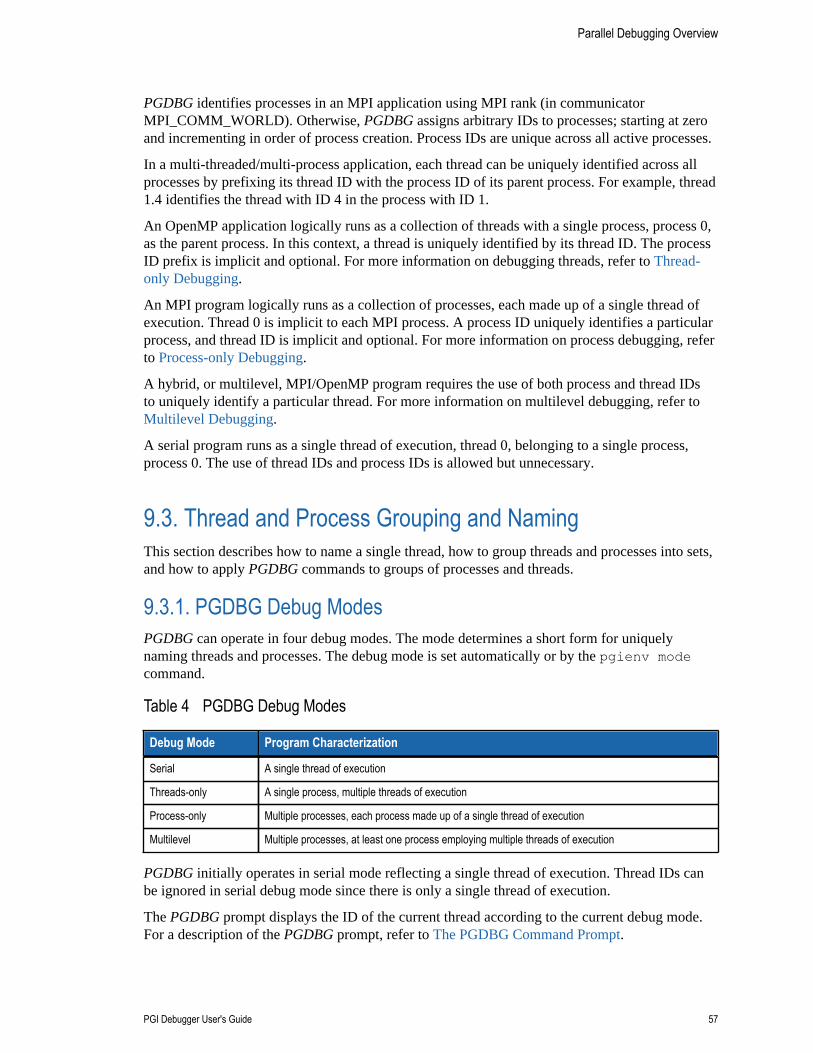
Parallel Debugging Overview
PGI Debugger User's Guide 57
PGDBG identifies processes in an MPI application using MPI rank (in communicatorMPI_COMM_WORLD). Otherwise, PGDBG assigns arbitrary IDs to processes; starting at zeroand incrementing in order of process creation. Process IDs are unique across all active processes.
In a multi-threaded/multi-process application, each thread can be uniquely identified across allprocesses by prefixing its thread ID with the process ID of its parent process. For example, thread1.4 identifies the thread with ID 4 in the process with ID 1.
An OpenMP application logically runs as a collection of threads with a single process, process 0,as the parent process. In this context, a thread is uniquely identified by its thread ID. The processID prefix is implicit and optional. For more information on debugging threads, refer to Thread-only Debugging.
An MPI program logically runs as a collection of processes, each made up of a single thread ofexecution. Thread 0 is implicit to each MPI process. A process ID uniquely identifies a particularprocess, and thread ID is implicit and optional. For more information on process debugging, referto Process-only Debugging.
A hybrid, or multilevel, MPI/OpenMP program requires the use of both process and thread IDsto uniquely identify a particular thread. For more information on multilevel debugging, refer toMultilevel Debugging.
A serial program runs as a single thread of execution, thread 0, belonging to a single process,process 0. The use of thread IDs and process IDs is allowed but unnecessary.
9.3. Thread and Process Grouping and NamingThis section describes how to name a single thread, how to group threads and processes into sets,and how to apply PGDBG commands to groups of processes and threads.
9.3.1. PGDBG Debug ModesPGDBG can operate in four debug modes. The mode determines a short form for uniquelynaming threads and processes. The debug mode is set automatically or by the pgienv modecommand.
Table 4 PGDBG Debug Modes
Debug Mode Program Characterization
Serial A single thread of execution
Threads-only A single process, multiple threads of execution
Process-only Multiple processes, each process made up of a single thread of execution
Multilevel Multiple processes, at least one process employing multiple threads of execution
PGDBG initially operates in serial mode reflecting a single thread of execution. Thread IDs canbe ignored in serial debug mode since there is only a single thread of execution.
The PGDBG prompt displays the ID of the current thread according to the current debug mode.For a description of the PGDBG prompt, refer to The PGDBG Command Prompt.
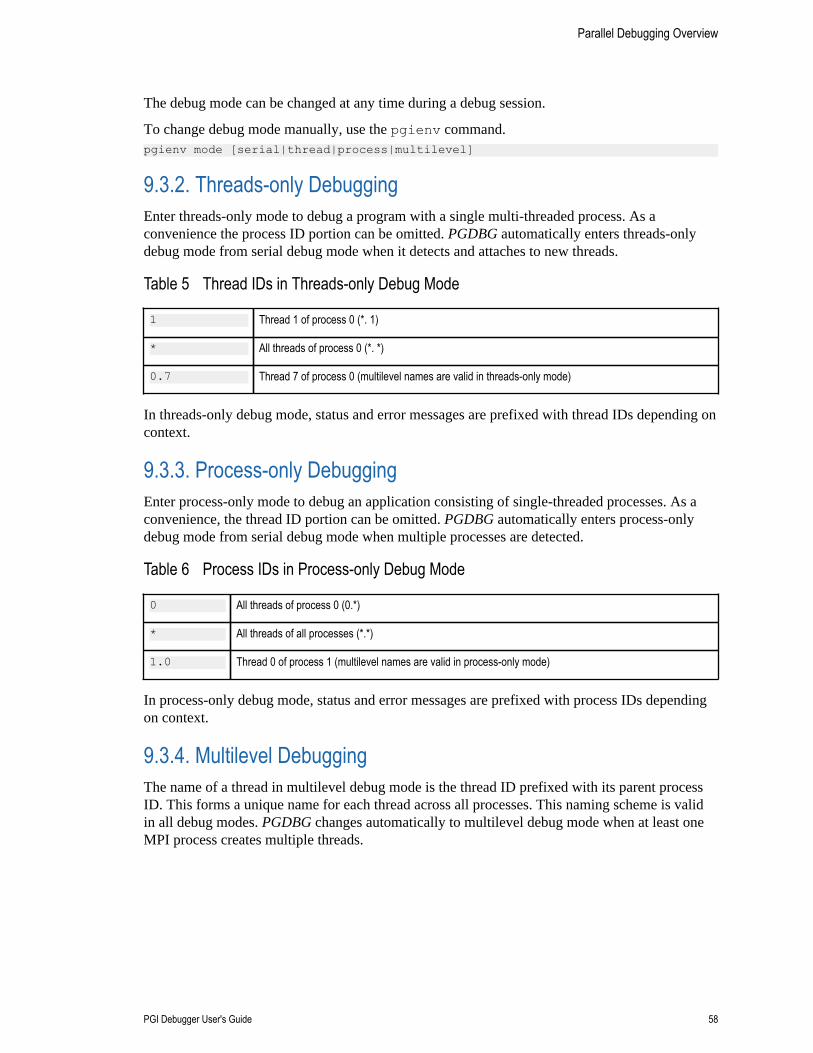
Parallel Debugging Overview
PGI Debugger User's Guide 58
The debug mode can be changed at any time during a debug session.
To change debug mode manually, use the pgienv command.pgienv mode [serial|thread|process|multilevel]
9.3.2. Threads-only DebuggingEnter threads-only mode to debug a program with a single multi-threaded process. As aconvenience the process ID portion can be omitted. PGDBG automatically enters threads-onlydebug mode from serial debug mode when it detects and attaches to new threads.
Table 5 Thread IDs in Threads-only Debug Mode
1 Thread 1 of process 0 (*. 1)
* All threads of process 0 (*. *)
0.7 Thread 7 of process 0 (multilevel names are valid in threads-only mode)
In threads-only debug mode, status and error messages are prefixed with thread IDs depending oncontext.
9.3.3. Process-only DebuggingEnter process-only mode to debug an application consisting of single-threaded processes. As aconvenience, the thread ID portion can be omitted. PGDBG automatically enters process-onlydebug mode from serial debug mode when multiple processes are detected.
Table 6 Process IDs in Process-only Debug Mode
0 All threads of process 0 (0.*)
* All threads of all processes (*.*)
1.0 Thread 0 of process 1 (multilevel names are valid in process-only mode)
In process-only debug mode, status and error messages are prefixed with process IDs dependingon context.
9.3.4. Multilevel DebuggingThe name of a thread in multilevel debug mode is the thread ID prefixed with its parent processID. This forms a unique name for each thread across all processes. This naming scheme is validin all debug modes. PGDBG changes automatically to multilevel debug mode when at least oneMPI process creates multiple threads.
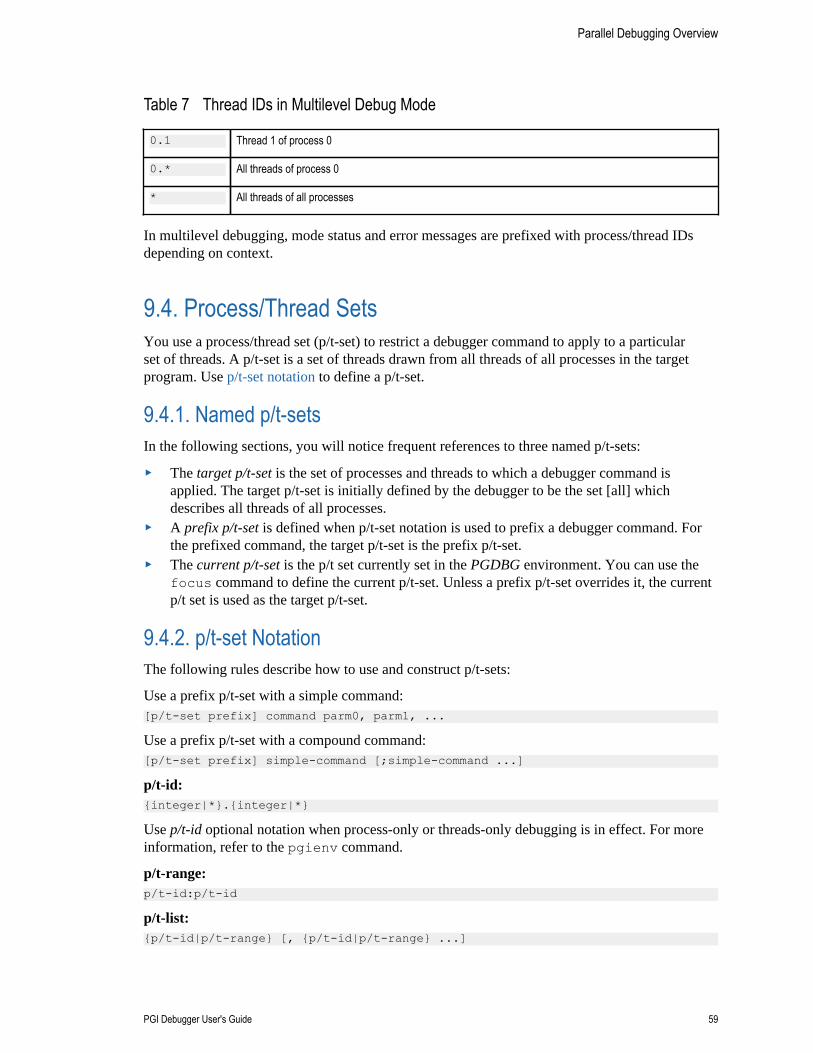
Parallel Debugging Overview
PGI Debugger User's Guide 59
Table 7 Thread IDs in Multilevel Debug Mode
0.1 Thread 1 of process 0
0.* All threads of process 0
* All threads of all processes
In multilevel debugging, mode status and error messages are prefixed with process/thread IDsdepending on context.
9.4. Process/Thread SetsYou use a process/thread set (p/t-set) to restrict a debugger command to apply to a particularset of threads. A p/t-set is a set of threads drawn from all threads of all processes in the targetprogram. Use p/t-set notation to define a p/t-set.
9.4.1. Named p/t-setsIn the following sections, you will notice frequent references to three named p/t-sets:
‣ The target p/t-set is the set of processes and threads to which a debugger command isapplied. The target p/t-set is initially defined by the debugger to be the set [all] whichdescribes all threads of all processes.
‣ A prefix p/t-set is defined when p/t-set notation is used to prefix a debugger command. Forthe prefixed command, the target p/t-set is the prefix p/t-set.
‣ The current p/t-set is the p/t set currently set in the PGDBG environment. You can use thefocus command to define the current p/t-set. Unless a prefix p/t-set overrides it, the currentp/t set is used as the target p/t-set.
9.4.2. p/t-set NotationThe following rules describe how to use and construct p/t-sets:
Use a prefix p/t-set with a simple command:[p/t-set prefix] command parm0, parm1, ...
Use a prefix p/t-set with a compound command:[p/t-set prefix] simple-command [;simple-command ...]
p/t-id:{integer|*}.{integer|*}
Use p/t-id optional notation when process-only or threads-only debugging is in effect. For moreinformation, refer to the pgienv command.
p/t-range:p/t-id:p/t-id
p/t-list:{p/t-id|p/t-range} [, {p/t-id|p/t-range} ...]
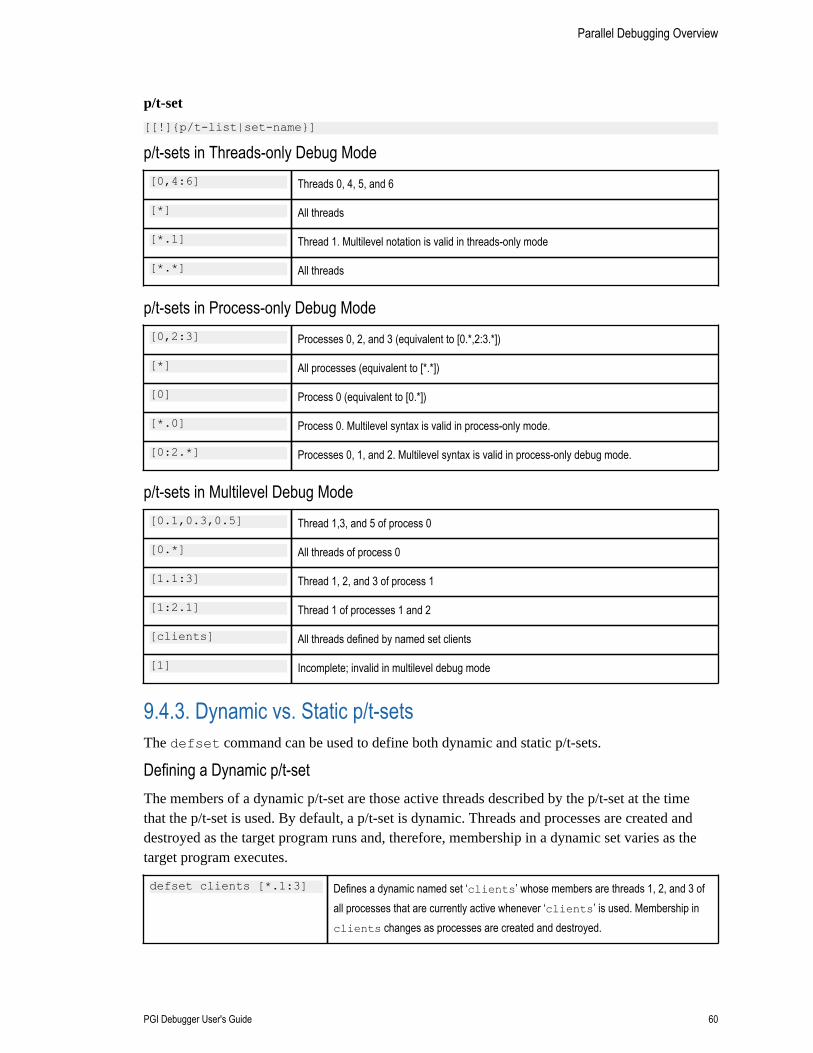
Parallel Debugging Overview
PGI Debugger User's Guide 60
p/t-set
[[!]{p/t-list|set-name}]
p/t-sets in Threads-only Debug Mode[0,4:6] Threads 0, 4, 5, and 6
[*] All threads
[*.1] Thread 1. Multilevel notation is valid in threads-only mode
[*.*] All threads
p/t-sets in Process-only Debug Mode[0,2:3] Processes 0, 2, and 3 (equivalent to [0.*,2:3.*])
[*] All processes (equivalent to [*.*])
[0] Process 0 (equivalent to [0.*])
[*.0] Process 0. Multilevel syntax is valid in process-only mode.
[0:2.*] Processes 0, 1, and 2. Multilevel syntax is valid in process-only debug mode.
p/t-sets in Multilevel Debug Mode[0.1,0.3,0.5] Thread 1,3, and 5 of process 0
[0.*] All threads of process 0
[1.1:3] Thread 1, 2, and 3 of process 1
[1:2.1] Thread 1 of processes 1 and 2
[clients] All threads defined by named set clients
[1] Incomplete; invalid in multilevel debug mode
9.4.3. Dynamic vs. Static p/t-setsThe defset command can be used to define both dynamic and static p/t-sets.
Defining a Dynamic p/t-setThe members of a dynamic p/t-set are those active threads described by the p/t-set at the timethat the p/t-set is used. By default, a p/t-set is dynamic. Threads and processes are created anddestroyed as the target program runs and, therefore, membership in a dynamic set varies as thetarget program executes.
defset clients [*.1:3] Defines a dynamic named set ‘clients’ whose members are threads 1, 2, and 3 ofall processes that are currently active whenever ‘clients’ is used. Membership inclients changes as processes are created and destroyed.
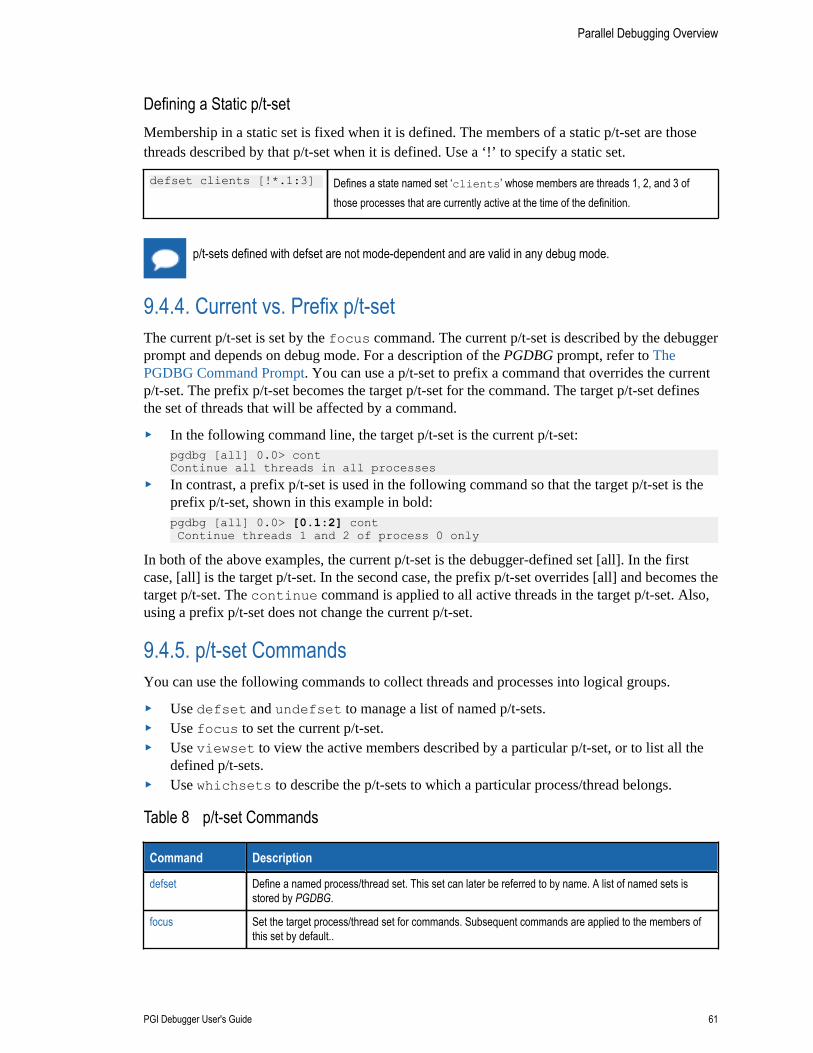
Parallel Debugging Overview
PGI Debugger User's Guide 61
Defining a Static p/t-setMembership in a static set is fixed when it is defined. The members of a static p/t-set are thosethreads described by that p/t-set when it is defined. Use a ‘!’ to specify a static set.
defset clients [!*.1:3] Defines a state named set ‘clients’ whose members are threads 1, 2, and 3 ofthose processes that are currently active at the time of the definition.
p/t-sets defined with defset are not mode-dependent and are valid in any debug mode.
9.4.4. Current vs. Prefix p/t-setThe current p/t-set is set by the focus command. The current p/t-set is described by the debuggerprompt and depends on debug mode. For a description of the PGDBG prompt, refer to ThePGDBG Command Prompt. You can use a p/t-set to prefix a command that overrides the currentp/t-set. The prefix p/t-set becomes the target p/t-set for the command. The target p/t-set definesthe set of threads that will be affected by a command.
‣ In the following command line, the target p/t-set is the current p/t-set:pgdbg [all] 0.0> contContinue all threads in all processes
‣ In contrast, a prefix p/t-set is used in the following command so that the target p/t-set is theprefix p/t-set, shown in this example in bold:pgdbg [all] 0.0> [0.1:2] cont Continue threads 1 and 2 of process 0 only
In both of the above examples, the current p/t-set is the debugger-defined set [all]. In the firstcase, [all] is the target p/t-set. In the second case, the prefix p/t-set overrides [all] and becomes thetarget p/t-set. The continue command is applied to all active threads in the target p/t-set. Also,using a prefix p/t-set does not change the current p/t-set.
9.4.5. p/t-set CommandsYou can use the following commands to collect threads and processes into logical groups.
‣ Use defset and undefset to manage a list of named p/t-sets.‣ Use focus to set the current p/t-set.‣ Use viewset to view the active members described by a particular p/t-set, or to list all the
defined p/t-sets.‣ Use whichsets to describe the p/t-sets to which a particular process/thread belongs.
Table 8 p/t-set Commands
Command Description
defset Define a named process/thread set. This set can later be referred to by name. A list of named sets isstored by PGDBG.
focus Set the target process/thread set for commands. Subsequent commands are applied to the members ofthis set by default..
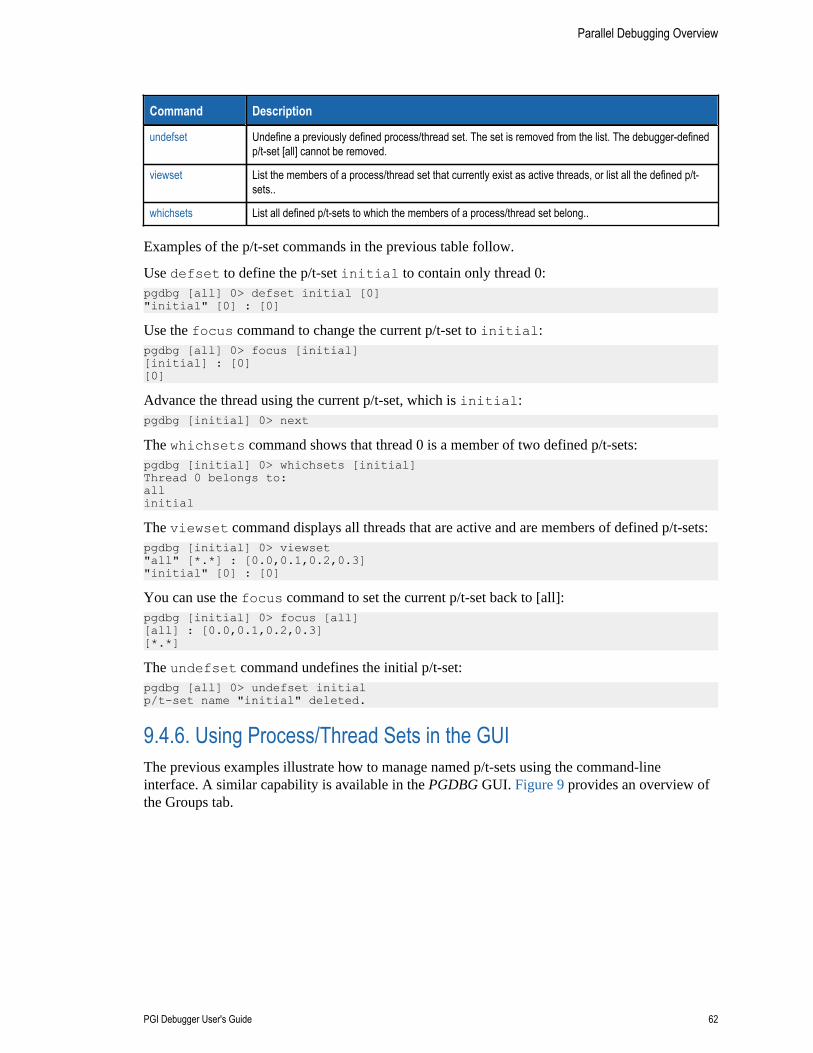
Parallel Debugging Overview
PGI Debugger User's Guide 62
Command Description
undefset Undefine a previously defined process/thread set. The set is removed from the list. The debugger-definedp/t-set [all] cannot be removed.
viewset List the members of a process/thread set that currently exist as active threads, or list all the defined p/t-sets..
whichsets List all defined p/t-sets to which the members of a process/thread set belong..
Examples of the p/t-set commands in the previous table follow.
Use defset to define the p/t-set initial to contain only thread 0:pgdbg [all] 0> defset initial [0]"initial" [0] : [0]
Use the focus command to change the current p/t-set to initial:pgdbg [all] 0> focus [initial][initial] : [0][0]
Advance the thread using the current p/t-set, which is initial:pgdbg [initial] 0> next
The whichsets command shows that thread 0 is a member of two defined p/t-sets:pgdbg [initial] 0> whichsets [initial]Thread 0 belongs to:allinitial
The viewset command displays all threads that are active and are members of defined p/t-sets:pgdbg [initial] 0> viewset"all" [*.*] : [0.0,0.1,0.2,0.3]"initial" [0] : [0]
You can use the focus command to set the current p/t-set back to [all]:pgdbg [initial] 0> focus [all][all] : [0.0,0.1,0.2,0.3][*.*]
The undefset command undefines the initial p/t-set:pgdbg [all] 0> undefset initialp/t-set name "initial" deleted.
9.4.6. Using Process/Thread Sets in the GUIThe previous examples illustrate how to manage named p/t-sets using the command-lineinterface. A similar capability is available in the PGDBG GUI. Figure 9 provides an overview ofthe Groups tab.
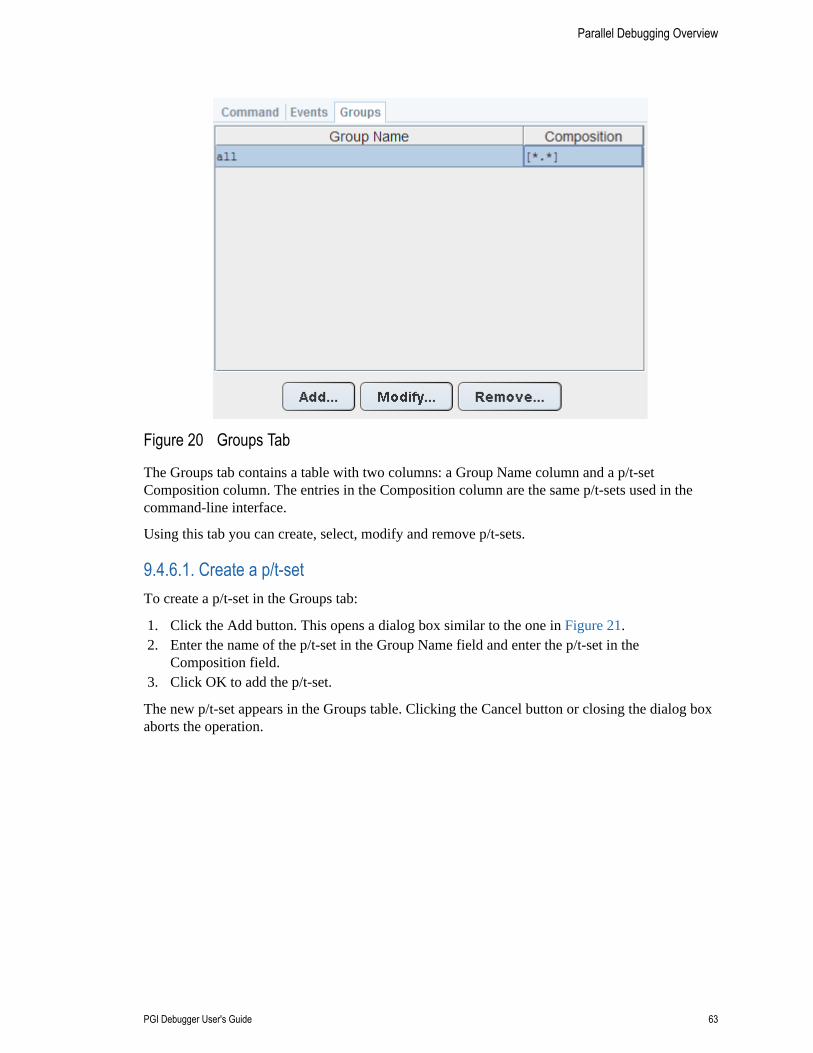
Parallel Debugging Overview
PGI Debugger User's Guide 63
Figure 20 Groups Tab
The Groups tab contains a table with two columns: a Group Name column and a p/t-setComposition column. The entries in the Composition column are the same p/t-sets used in thecommand-line interface.
Using this tab you can create, select, modify and remove p/t-sets.
9.4.6.1. Create a p/t-setTo create a p/t-set in the Groups tab:
1. Click the Add button. This opens a dialog box similar to the one in Figure 21. 2. Enter the name of the p/t-set in the Group Name field and enter the p/t-set in the
Composition field. 3. Click OK to add the p/t-set.
The new p/t-set appears in the Groups table. Clicking the Cancel button or closing the dialog boxaborts the operation.
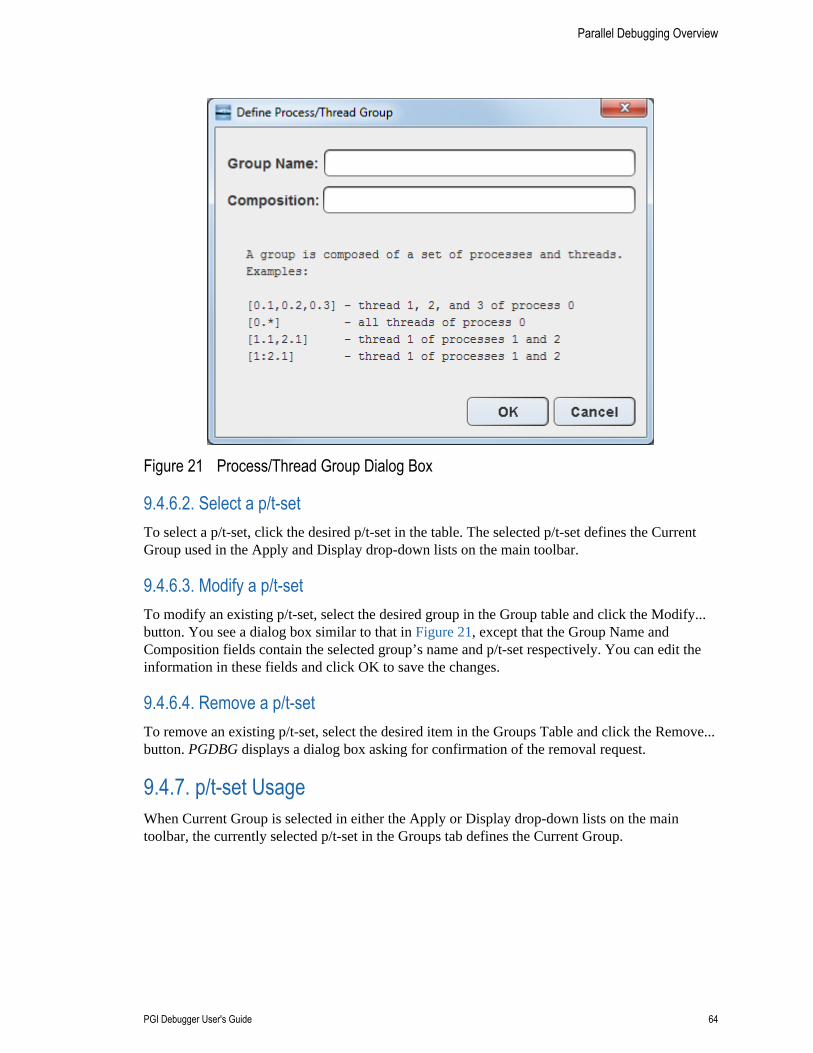
Parallel Debugging Overview
PGI Debugger User's Guide 64
Figure 21 Process/Thread Group Dialog Box
9.4.6.2. Select a p/t-setTo select a p/t-set, click the desired p/t-set in the table. The selected p/t-set defines the CurrentGroup used in the Apply and Display drop-down lists on the main toolbar.
9.4.6.3. Modify a p/t-setTo modify an existing p/t-set, select the desired group in the Group table and click the Modify...button. You see a dialog box similar to that in Figure 21, except that the Group Name andComposition fields contain the selected group’s name and p/t-set respectively. You can edit theinformation in these fields and click OK to save the changes.
9.4.6.4. Remove a p/t-setTo remove an existing p/t-set, select the desired item in the Groups Table and click the Remove...button. PGDBG displays a dialog box asking for confirmation of the removal request.
9.4.7. p/t-set UsageWhen Current Group is selected in either the Apply or Display drop-down lists on the maintoolbar, the currently selected p/t-set in the Groups tab defines the Current Group.
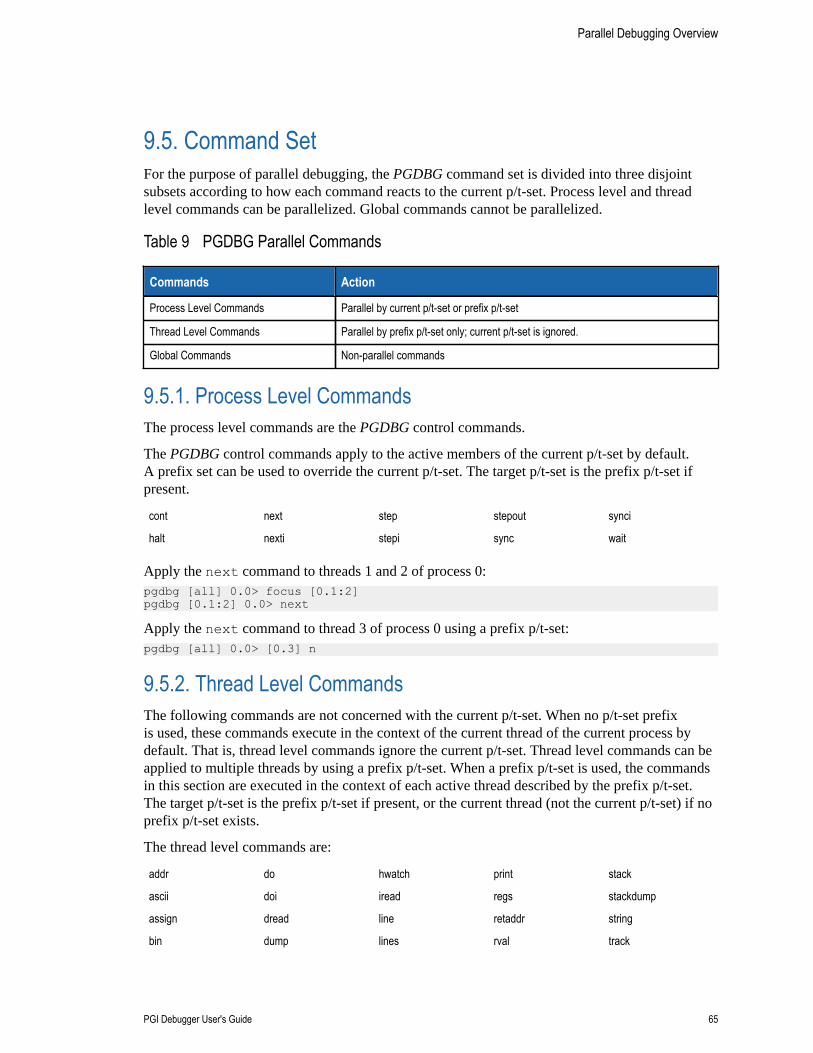
Parallel Debugging Overview
PGI Debugger User's Guide 65
9.5. Command SetFor the purpose of parallel debugging, the PGDBG command set is divided into three disjointsubsets according to how each command reacts to the current p/t-set. Process level and threadlevel commands can be parallelized. Global commands cannot be parallelized.
Table 9 PGDBG Parallel Commands
Commands Action
Process Level Commands Parallel by current p/t-set or prefix p/t-set
Thread Level Commands Parallel by prefix p/t-set only; current p/t-set is ignored.
Global Commands Non-parallel commands
9.5.1. Process Level CommandsThe process level commands are the PGDBG control commands.
The PGDBG control commands apply to the active members of the current p/t-set by default.A prefix set can be used to override the current p/t-set. The target p/t-set is the prefix p/t-set ifpresent.
cont next step stepout synci
halt nexti stepi sync wait
Apply the next command to threads 1 and 2 of process 0:pgdbg [all] 0.0> focus [0.1:2]pgdbg [0.1:2] 0.0> next
Apply the next command to thread 3 of process 0 using a prefix p/t-set:pgdbg [all] 0.0> [0.3] n
9.5.2. Thread Level CommandsThe following commands are not concerned with the current p/t-set. When no p/t-set prefixis used, these commands execute in the context of the current thread of the current process bydefault. That is, thread level commands ignore the current p/t-set. Thread level commands can beapplied to multiple threads by using a prefix p/t-set. When a prefix p/t-set is used, the commandsin this section are executed in the context of each active thread described by the prefix p/t-set.The target p/t-set is the prefix p/t-set if present, or the current thread (not the current p/t-set) if noprefix p/t-set exists.
The thread level commands are:
addr do hwatch print stack
ascii doi iread regs stackdump
assign dread line retaddr string
bin dump lines rval track
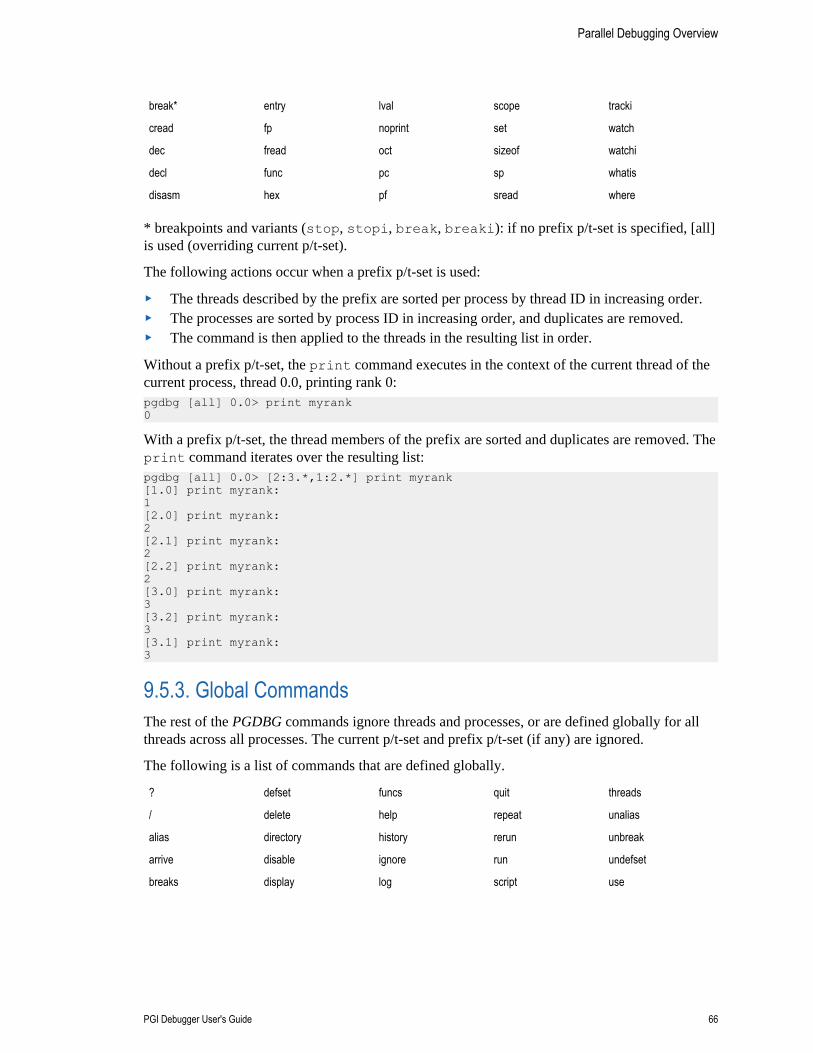
Parallel Debugging Overview
PGI Debugger User's Guide 66
break* entry lval scope tracki
cread fp noprint set watch
dec fread oct sizeof watchi
decl func pc sp whatis
disasm hex pf sread where
* breakpoints and variants (stop, stopi, break, breaki): if no prefix p/t-set is specified, [all]is used (overriding current p/t-set).
The following actions occur when a prefix p/t-set is used:
‣ The threads described by the prefix are sorted per process by thread ID in increasing order.‣ The processes are sorted by process ID in increasing order, and duplicates are removed.‣ The command is then applied to the threads in the resulting list in order.
Without a prefix p/t-set, the print command executes in the context of the current thread of thecurrent process, thread 0.0, printing rank 0:pgdbg [all] 0.0> print myrank0
With a prefix p/t-set, the thread members of the prefix are sorted and duplicates are removed. Theprint command iterates over the resulting list:pgdbg [all] 0.0> [2:3.*,1:2.*] print myrank[1.0] print myrank: 1 [2.0] print myrank: 2 [2.1] print myrank: 2 [2.2] print myrank: 2 [3.0] print myrank: 3 [3.2] print myrank: 3 [3.1] print myrank: 3
9.5.3. Global CommandsThe rest of the PGDBG commands ignore threads and processes, or are defined globally for allthreads across all processes. The current p/t-set and prefix p/t-set (if any) are ignored.
The following is a list of commands that are defined globally.
? defset funcs quit threads
/ delete help repeat unalias
alias directory history rerun unbreak
arrive disable ignore run undefset
breaks display log script use
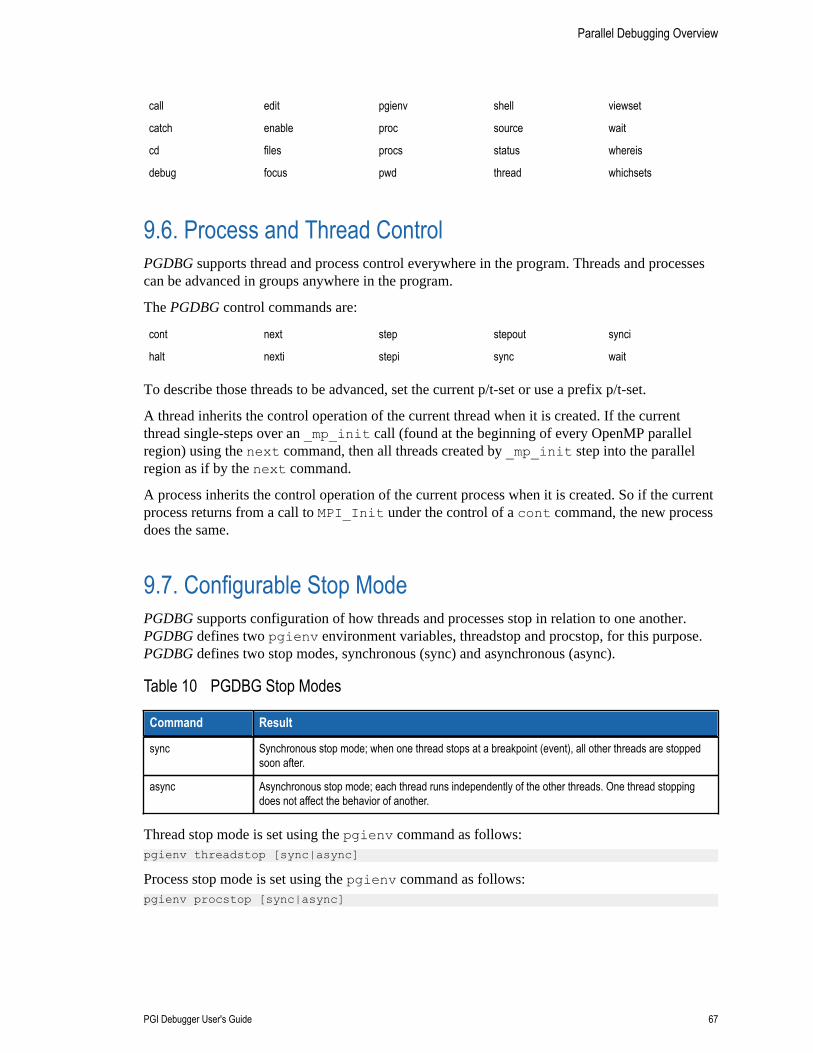
Parallel Debugging Overview
PGI Debugger User's Guide 67
call edit pgienv shell viewset
catch enable proc source wait
cd files procs status whereis
debug focus pwd thread whichsets
9.6. Process and Thread ControlPGDBG supports thread and process control everywhere in the program. Threads and processescan be advanced in groups anywhere in the program.
The PGDBG control commands are:
cont next step stepout synci
halt nexti stepi sync wait
To describe those threads to be advanced, set the current p/t-set or use a prefix p/t-set.
A thread inherits the control operation of the current thread when it is created. If the currentthread single-steps over an _mp_init call (found at the beginning of every OpenMP parallelregion) using the next command, then all threads created by _mp_init step into the parallelregion as if by the next command.
A process inherits the control operation of the current process when it is created. So if the currentprocess returns from a call to MPI_Init under the control of a cont command, the new processdoes the same.
9.7. Configurable Stop ModePGDBG supports configuration of how threads and processes stop in relation to one another.PGDBG defines two pgienv environment variables, threadstop and procstop, for this purpose.PGDBG defines two stop modes, synchronous (sync) and asynchronous (async).
Table 10 PGDBG Stop Modes
Command Result
sync Synchronous stop mode; when one thread stops at a breakpoint (event), all other threads are stoppedsoon after.
async Asynchronous stop mode; each thread runs independently of the other threads. One thread stoppingdoes not affect the behavior of another.
Thread stop mode is set using the pgienv command as follows:pgienv threadstop [sync|async]
Process stop mode is set using the pgienv command as follows:pgienv procstop [sync|async]
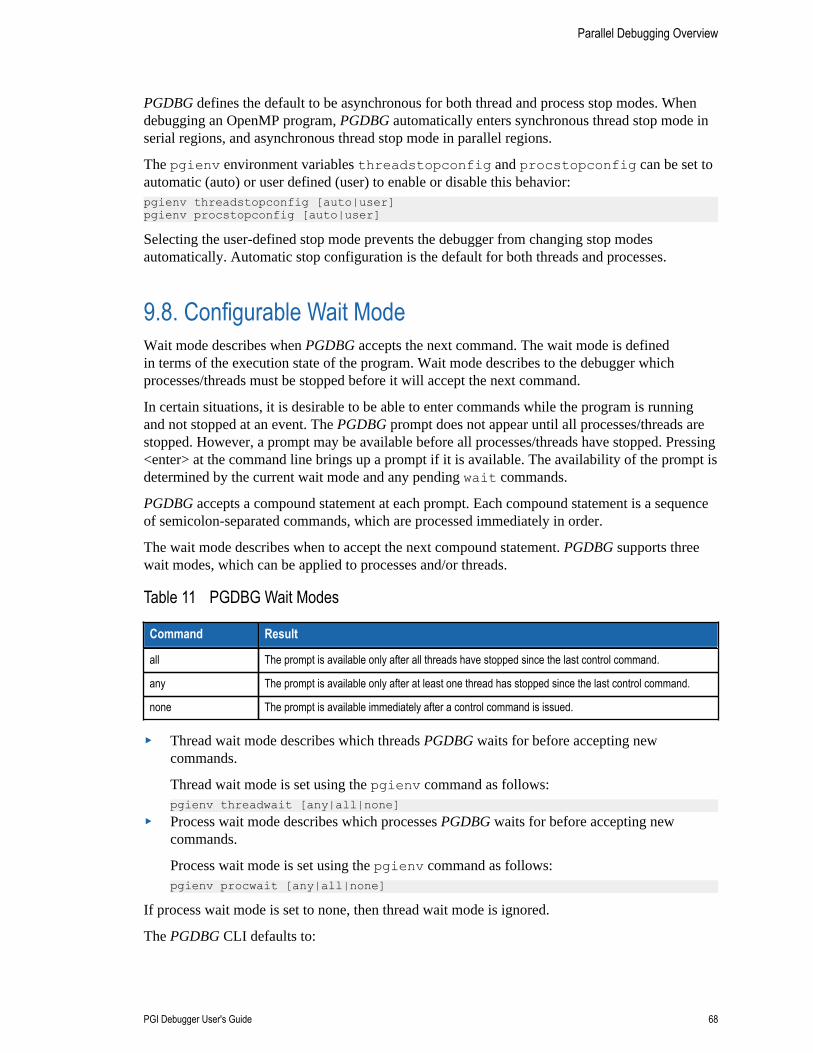
Parallel Debugging Overview
PGI Debugger User's Guide 68
PGDBG defines the default to be asynchronous for both thread and process stop modes. Whendebugging an OpenMP program, PGDBG automatically enters synchronous thread stop mode inserial regions, and asynchronous thread stop mode in parallel regions.
The pgienv environment variables threadstopconfig and procstopconfig can be set toautomatic (auto) or user defined (user) to enable or disable this behavior:pgienv threadstopconfig [auto|user]pgienv procstopconfig [auto|user]
Selecting the user-defined stop mode prevents the debugger from changing stop modesautomatically. Automatic stop configuration is the default for both threads and processes.
9.8. Configurable Wait ModeWait mode describes when PGDBG accepts the next command. The wait mode is definedin terms of the execution state of the program. Wait mode describes to the debugger whichprocesses/threads must be stopped before it will accept the next command.
In certain situations, it is desirable to be able to enter commands while the program is runningand not stopped at an event. The PGDBG prompt does not appear until all processes/threads arestopped. However, a prompt may be available before all processes/threads have stopped. Pressing<enter> at the command line brings up a prompt if it is available. The availability of the prompt isdetermined by the current wait mode and any pending wait commands.
PGDBG accepts a compound statement at each prompt. Each compound statement is a sequenceof semicolon-separated commands, which are processed immediately in order.
The wait mode describes when to accept the next compound statement. PGDBG supports threewait modes, which can be applied to processes and/or threads.
Table 11 PGDBG Wait Modes
Command Result
all The prompt is available only after all threads have stopped since the last control command.
any The prompt is available only after at least one thread has stopped since the last control command.
none The prompt is available immediately after a control command is issued.
‣ Thread wait mode describes which threads PGDBG waits for before accepting newcommands.
Thread wait mode is set using the pgienv command as follows:pgienv threadwait [any|all|none]
‣ Process wait mode describes which processes PGDBG waits for before accepting newcommands.
Process wait mode is set using the pgienv command as follows:pgienv procwait [any|all|none]
If process wait mode is set to none, then thread wait mode is ignored.
The PGDBG CLI defaults to:
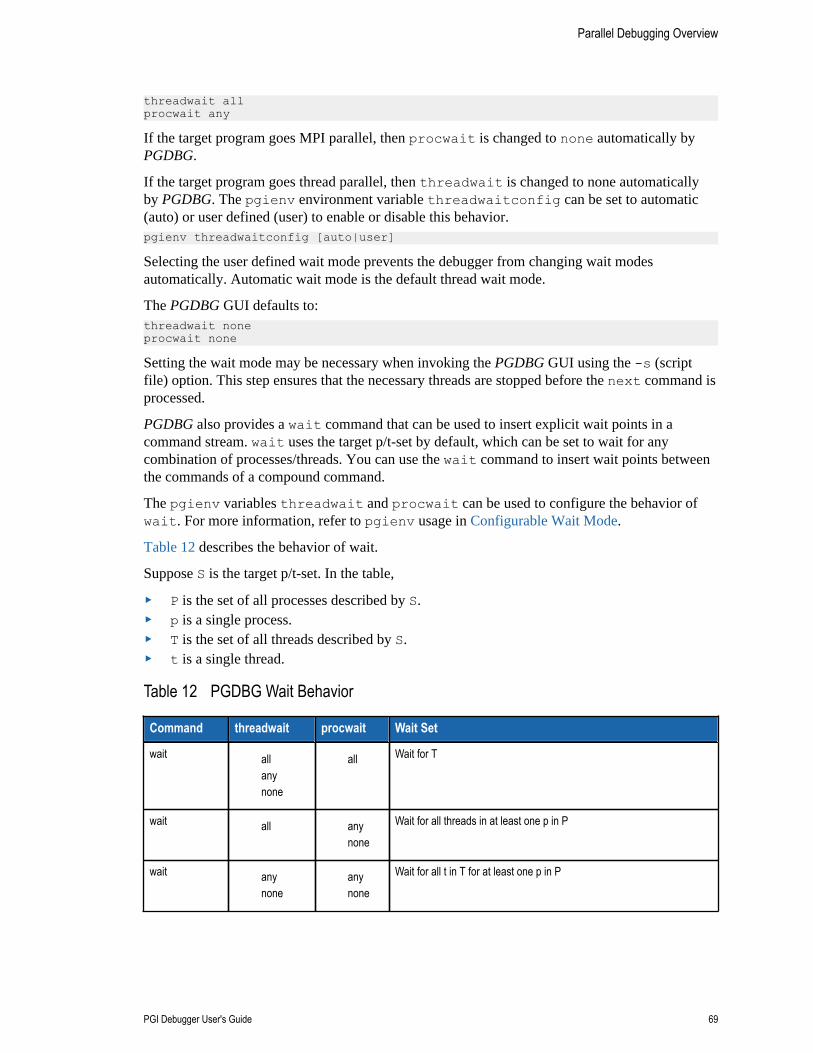
Parallel Debugging Overview
PGI Debugger User's Guide 69
threadwait allprocwait any
If the target program goes MPI parallel, then procwait is changed to none automatically byPGDBG.
If the target program goes thread parallel, then threadwait is changed to none automaticallyby PGDBG. The pgienv environment variable threadwaitconfig can be set to automatic(auto) or user defined (user) to enable or disable this behavior.pgienv threadwaitconfig [auto|user]
Selecting the user defined wait mode prevents the debugger from changing wait modesautomatically. Automatic wait mode is the default thread wait mode.
The PGDBG GUI defaults to:threadwait noneprocwait none
Setting the wait mode may be necessary when invoking the PGDBG GUI using the -s (scriptfile) option. This step ensures that the necessary threads are stopped before the next command isprocessed.
PGDBG also provides a wait command that can be used to insert explicit wait points in acommand stream. wait uses the target p/t-set by default, which can be set to wait for anycombination of processes/threads. You can use the wait command to insert wait points betweenthe commands of a compound command.
The pgienv variables threadwait and procwait can be used to configure the behavior ofwait. For more information, refer to pgienv usage in Configurable Wait Mode.
Table 12 describes the behavior of wait.
Suppose S is the target p/t-set. In the table,
‣ P is the set of all processes described by S.‣ p is a single process.‣ T is the set of all threads described by S.‣ t is a single thread.
Table 12 PGDBG Wait Behavior
Command threadwait procwait Wait Set
wait allanynone
all Wait for T
wait all anynone
Wait for all threads in at least one p in P
wait anynone
anynone
Wait for all t in T for at least one p in P
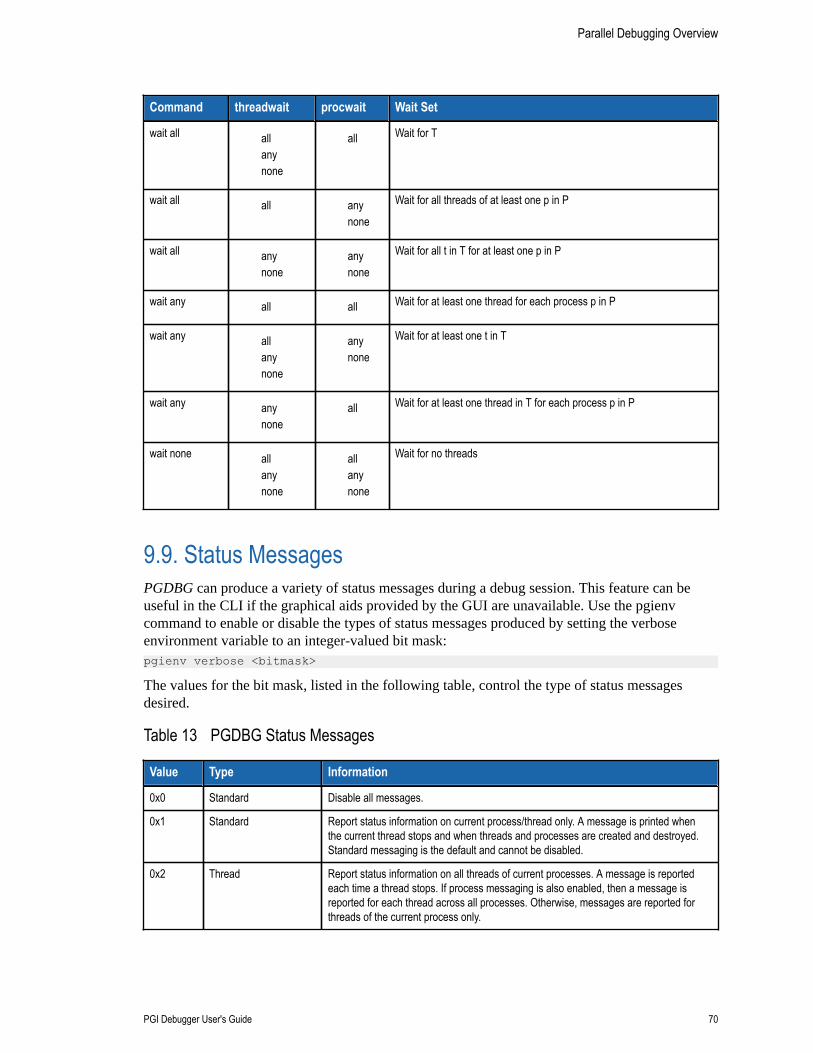
Parallel Debugging Overview
PGI Debugger User's Guide 70
Command threadwait procwait Wait Set
wait all allanynone
all Wait for T
wait all all anynone
Wait for all threads of at least one p in P
wait all anynone
anynone
Wait for all t in T for at least one p in P
wait any all all Wait for at least one thread for each process p in P
wait any allanynone
anynone
Wait for at least one t in T
wait any anynone
all Wait for at least one thread in T for each process p in P
wait none allanynone
allanynone
Wait for no threads
9.9. Status MessagesPGDBG can produce a variety of status messages during a debug session. This feature can beuseful in the CLI if the graphical aids provided by the GUI are unavailable. Use the pgienvcommand to enable or disable the types of status messages produced by setting the verboseenvironment variable to an integer-valued bit mask:pgienv verbose <bitmask>
The values for the bit mask, listed in the following table, control the type of status messagesdesired.
Table 13 PGDBG Status Messages
Value Type Information
0x0 Standard Disable all messages.
0x1 Standard Report status information on current process/thread only. A message is printed whenthe current thread stops and when threads and processes are created and destroyed.Standard messaging is the default and cannot be disabled.
0x2 Thread Report status information on all threads of current processes. A message is reportedeach time a thread stops. If process messaging is also enabled, then a message isreported for each thread across all processes. Otherwise, messages are reported forthreads of the current process only.
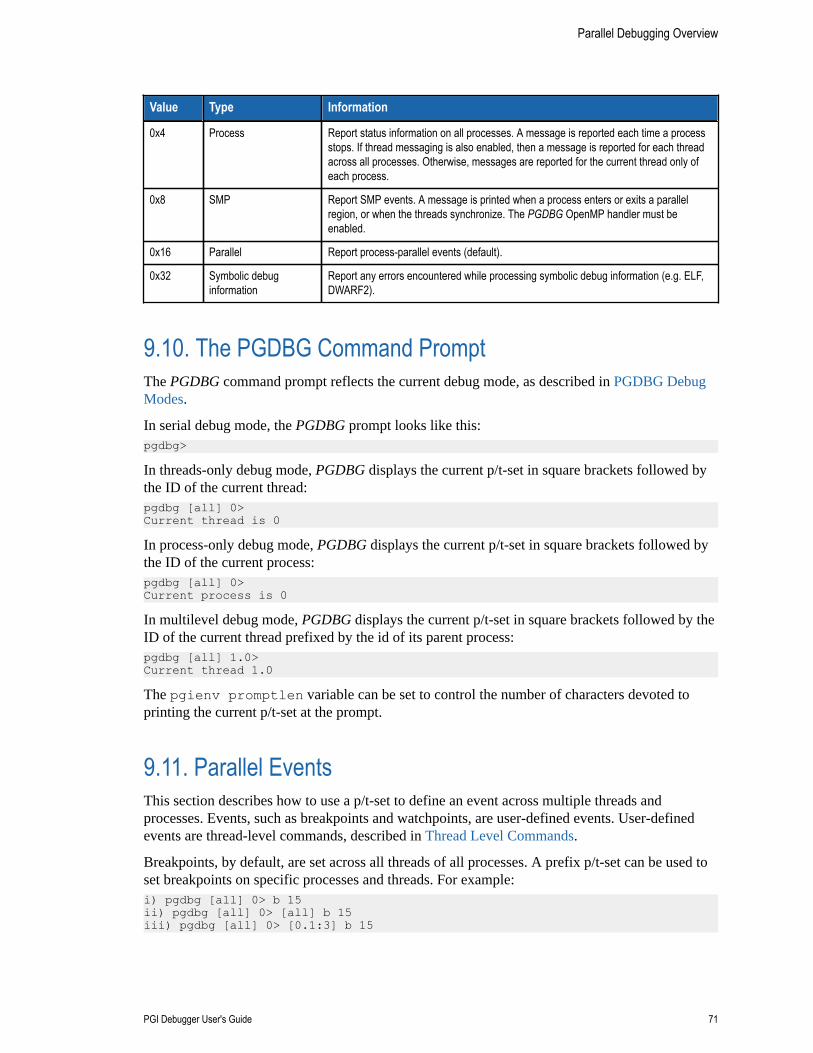
Parallel Debugging Overview
PGI Debugger User's Guide 71
Value Type Information
0x4 Process Report status information on all processes. A message is reported each time a processstops. If thread messaging is also enabled, then a message is reported for each threadacross all processes. Otherwise, messages are reported for the current thread only ofeach process.
0x8 SMP Report SMP events. A message is printed when a process enters or exits a parallelregion, or when the threads synchronize. The PGDBG OpenMP handler must beenabled.
0x16 Parallel Report process-parallel events (default).
0x32 Symbolic debuginformation
Report any errors encountered while processing symbolic debug information (e.g. ELF,DWARF2).
9.10. The PGDBG Command PromptThe PGDBG command prompt reflects the current debug mode, as described in PGDBG DebugModes.
In serial debug mode, the PGDBG prompt looks like this:pgdbg>
In threads-only debug mode, PGDBG displays the current p/t-set in square brackets followed bythe ID of the current thread:pgdbg [all] 0>Current thread is 0
In process-only debug mode, PGDBG displays the current p/t-set in square brackets followed bythe ID of the current process:pgdbg [all] 0>Current process is 0
In multilevel debug mode, PGDBG displays the current p/t-set in square brackets followed by theID of the current thread prefixed by the id of its parent process:pgdbg [all] 1.0>Current thread 1.0
The pgienv promptlen variable can be set to control the number of characters devoted toprinting the current p/t-set at the prompt.
9.11. Parallel EventsThis section describes how to use a p/t-set to define an event across multiple threads andprocesses. Events, such as breakpoints and watchpoints, are user-defined events. User-definedevents are thread-level commands, described in Thread Level Commands.
Breakpoints, by default, are set across all threads of all processes. A prefix p/t-set can be used toset breakpoints on specific processes and threads. For example:i) pgdbg [all] 0> b 15ii) pgdbg [all] 0> [all] b 15iii) pgdbg [all] 0> [0.1:3] b 15
Parallel Debugging Overview
PGI Debugger User's Guide 72
(i) and (ii) are equivalent. (iii) sets a breakpoint only in threads 1,2,3 of process 0.
By default, all other user events are set for the current thread only. A prefix p/t-set can be used toset user events on specific processes and threads. For example:i) pgdbg [all] 0> watch globii) pgdbg [all] 0> [*] watch glob
(i) sets a watchpoint for glob on thread 0 only. (ii) sets a watchpoint for glob on all threads thatare currently active.
When a process or thread is created, it inherits all of the breakpoints defined for the parentprocess or thread. All other events must be defined explicitly after the process or thread iscreated. All processes must be stopped to add, enable, or disable a user event.
Events may contain if and do clauses. For example:pgdbg [all] 0> [*] break func if (glob!=0) do {set f = 0}
The breakpoint fires only if glob is non-zero. The do clause is executed if the breakpoint fires.The if and do clauses execute in the context of a single thread. The conditional in the if clause andthe body of the do execute in the context of a single thread, the thread that triggered the event.The conditional definition as above can be restated as follows:[0] if (glob!=0) {[0] set f = 0}[1] if (glob!=0) {[1] set f = 0}...
When thread 1 hits func, glob is evaluated in the context of thread 1. If glob evaluates to non-zero, f is bound in the context of thread 1 and its value is set to 0.
Control commands can be used in do clauses, however they only apply to the current thread andare only well defined as the last command in the do clause. For example:pgdbg [all] 0> [*] break func if (glob!=0) do {set f = 0; c}
If the wait command appears in a do clause, the current thread is added to the wait set of thecurrent process. For example:pgdbg [all] 0> [*] break func if (glob!=0) do {set f = 0; c; wait}
If conditionals and do bodies cannot be parallelized with prefix p/t-sets. For example, thefollowing command is illegal:pgdbg [all] 0> break func if (glob!=0) do {[*] set f = 0} ILLEGAL
The body of a do statement cannot be parallelized.
9.12. Parallel StatementsThis section describes how to use a p/t-set to define a statement that executes for multiple threadsand processes.
9.12.1. Parallel Compound/Block StatementsEach command in a compound statement is executed in order. The target p/t-set is applied to allstatements in a compound statement. The following two examples (i) and (ii) are equivalent:i) pgdbg [all] 0>[*] break main; cont; wait; print f@11@;iii) pgdbg [all] 0>[*] break main; [*]cont; [*]wait; [*]print f@11@;i
Parallel Debugging Overview
PGI Debugger User's Guide 73
Use the wait command if subsequent commands require threads to be stopped, as the printcommand in the example does.
The threadwait and procwait environment variables do not affect how commands within acompound statement are processed. These pgienv environment variables describe to PGDBGunder what conditions (state of program) it should accept the next (compound) statement.
9.12.2. Parallel If, Else StatementsA prefix p/t-set can be used to parallelize an if statement. An if statement executes in the contextof the current thread by default. The following example:pgdbg [all] 0> [*] if (i==1) {break func; c; wait} else {sync func2}
is equivalent to the following pseudo-code: for the subset of [*] where (i==1) break func; c; wait; for the subset of [*] where (i!=1) sync func2
9.12.3. Parallel While StatementsA prefix p/t-set can be used to parallelize a while statement. A while statement executes in thecontext of the current thread by default. The following example:pgdbg [all] 0> [*] while (i<10) {n; wait; print i}
is equivalent to the following pseudo-code: loop: if the subset of [*] is the empty set goto done endif for the subset [s] of [*] where (i<10) [s]n; [s]wait; [s]print i; endfor goto loop
The while statement terminates when either the subset of the target p/t-set matching the whilecondition is the empty set, or a return statement is executed in the body of the while.
9.12.4. Return StatementsThe return statement is defined only in serial context since it cannot return multiple values. Whenreturn is used in a parallel statement, it returns the last value evaluated.
PGI Debugger User's Guide 74
Chapter 10.PARALLEL DEBUGGING WITH OPENMP
This section provides information on how to debug OpenMP applications. Before reading thissection, review the information in Parallel Debugging Overview.
10.1. OpenMP and Multi-thread SupportPGDBG provides full control of threads in parallel regions. Commands can be applied toall threads, a single thread, or a group of threads. Thread identification in PGDBG uses thenative thread numbering scheme for OpenMP applications; for other types of multi-threadedapplications thread numbering is arbitrary. OpenMP private data can be accessed accuratelyfor each thread. PGDBG provides understandable status displays regarding per-thread state andlocation.
Advanced features provide for configurable thread stop modes and wait modes, allowingdebugger operation that is concurrent with application execution.
10.2. Multi-thread and OpenMP DebuggingPGDBG automatically attaches to new threads as they are created during program execution.PGDBG reports when a new thread is created and the thread ID of the new thread is printed.([1] New Thread)
The system ID of the freshly created thread is available through the threads command. You canuse the procs command to display information about the parent process.
PGDBG maintains a conceptual current thread. When using the PGDBG CLI, the current threadis chosen by using the thread command.pgdbg [all] 2> thread 3pgdbg [all] 3>
When using the PGDBG GUI, the current thread can be selected using the Current Thread drop-down list or by clicking in the Thread Grid. A subset of PGDBG commands known as thread-level commands apply only to the current thread. For more information, refer to Thread LevelCommands.
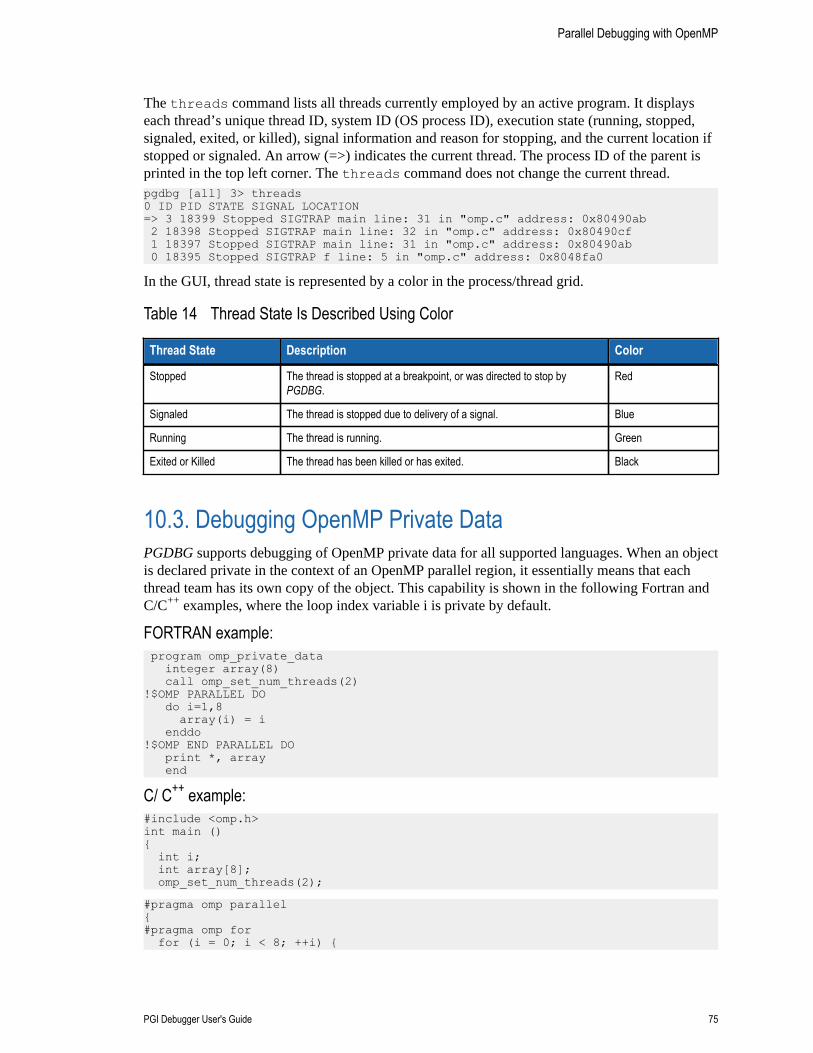
Parallel Debugging with OpenMP
PGI Debugger User's Guide 75
The threads command lists all threads currently employed by an active program. It displayseach thread’s unique thread ID, system ID (OS process ID), execution state (running, stopped,signaled, exited, or killed), signal information and reason for stopping, and the current location ifstopped or signaled. An arrow (=>) indicates the current thread. The process ID of the parent isprinted in the top left corner. The threads command does not change the current thread.pgdbg [all] 3> threads0 ID PID STATE SIGNAL LOCATION=> 3 18399 Stopped SIGTRAP main line: 31 in "omp.c" address: 0x80490ab 2 18398 Stopped SIGTRAP main line: 32 in "omp.c" address: 0x80490cf 1 18397 Stopped SIGTRAP main line: 31 in "omp.c" address: 0x80490ab 0 18395 Stopped SIGTRAP f line: 5 in "omp.c" address: 0x8048fa0
In the GUI, thread state is represented by a color in the process/thread grid.
Table 14 Thread State Is Described Using Color
Thread State Description Color
Stopped The thread is stopped at a breakpoint, or was directed to stop byPGDBG.
Red
Signaled The thread is stopped due to delivery of a signal. Blue
Running The thread is running. Green
Exited or Killed The thread has been killed or has exited. Black
10.3. Debugging OpenMP Private DataPGDBG supports debugging of OpenMP private data for all supported languages. When an objectis declared private in the context of an OpenMP parallel region, it essentially means that eachthread team has its own copy of the object. This capability is shown in the following Fortran andC/C++ examples, where the loop index variable i is private by default.
FORTRAN example: program omp_private_data integer array(8) call omp_set_num_threads(2)!$OMP PARALLEL DO do i=1,8 array(i) = i enddo!$OMP END PARALLEL DO print *, array end
C/ C++ example:#include <omp.h>int main (){ int i; int array[8]; omp_set_num_threads(2);
#pragma omp parallel{#pragma omp for for (i = 0; i < 8; ++i) {
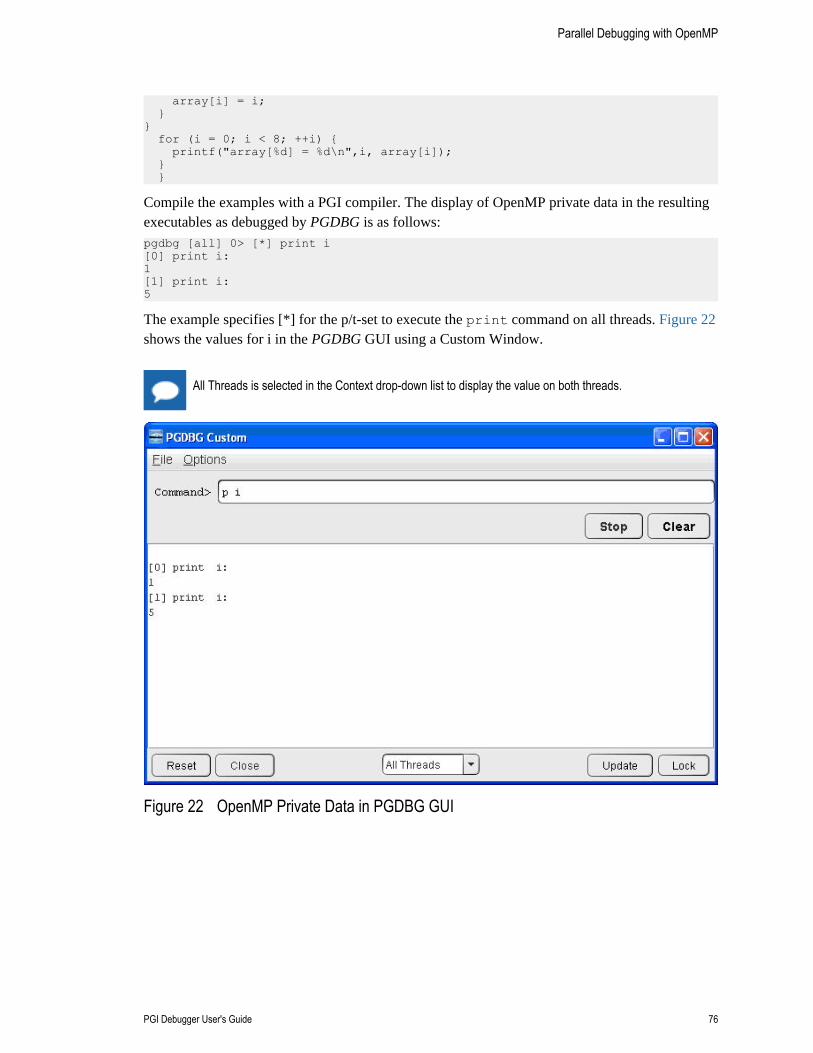
Parallel Debugging with OpenMP
PGI Debugger User's Guide 76
array[i] = i; }} for (i = 0; i < 8; ++i) { printf("array[%d] = %d\n",i, array[i]); } }
Compile the examples with a PGI compiler. The display of OpenMP private data in the resultingexecutables as debugged by PGDBG is as follows:pgdbg [all] 0> [*] print i[0] print i: 1[1] print i: 5
The example specifies [*] for the p/t-set to execute the print command on all threads. Figure 22shows the values for i in the PGDBG GUI using a Custom Window.
All Threads is selected in the Context drop-down list to display the value on both threads.
Figure 22 OpenMP Private Data in PGDBG GUI
PGI Debugger User's Guide 77
Chapter 11.PARALLEL DEBUGGING WITH MPI
PGDBG is capable of debugging multi-process MPI and hybrid multi-thread/multi-processapplications. Hybrid applications use MPI to communicate between multi-threaded or OpenMPprocesses. This section begins with a general overview of how to use PGDBG to debug parallelMPI applications before detailing how to launch MPI applications under debug using the varioussupported platforms and versions of MPI.
For information on compiling a program using MPI, refer to ‘Using MPI’ in the PGI CompilerUser’s Guide available at www.pgroup.com/resources/docs.htm.
11.1. MPI and Multi-Process SupportPGDBG can debug MPI applications running on the local system and, on Linux, applicationsdistributed across a cluster. MPI applications must be started under debugger control. Processidentification uses the MPI rank within MPI_COMM_WORLD.
MPI debugging is supported on Linux, macOS, and Windows. Application debugging issupported up to a maximum of 256 processes and 64 threads per process, but may be limitedby your PGI license keys. A PGI floating license is required to enable PGDBG's distributeddebugging capabilities.
11.2. MPI on LinuxPGI products for Linux ship with a PGI-built version of Open MPI. In addition, users withpermanent license can download PGI-built versions of MVAPICH2 and MPICH v3.
PGI products for Linux support SGI MPI. Any SGI MPI program configured to build with PGIcompilers can be debugged with PGDBG without any additional configuration considerations.
11.3. MPI on macOSPGI products for macOS ship with a PGI-built version of MPICH v3.
Parallel Debugging with MPI
PGI Debugger User's Guide 78
11.4. MPI on WindowsPGI products on Windows ship with Microsoft’s HPC Pack 2012 SP1 MS-MPI redistributablepackage; MS-MPI is installed by default. PGDBG can debug MS-MPI programs running locally;cluster debugging is not supported.
11.5. Deprecated Support for MPICH1, MPICH2, MVAPICH1PGI has deprecated support for MPICH1, MPICH2 and MVAPICH1. For instructionson debugging an application using one of these distributions of MPI, please refer to thedocumentation for release 13.10 (or prior).
11.6. Building an MPI Application for DebuggingIn general, simply add –g to the compilation and linking of an MPI application to enable thegeneration of debug information. Instead of invoking a compiler directly, most versions of MPIinclude wrapper files (i.e., mpicc, mpif90). That said, the PGI compilers have direct support forsome MPI distributions via the –Mmpi option. For example, sub-options to –Mmpi are availablefor MPICH, SGI, and MS-MPI.
11.7. The MPI Launch ProgramIn the following sections, the term launcher indicates the MPI launch program. The debuggeruses mpiexec as the default launcher. If the location of the launcher in your MPI distributionis not in your PATH environment variable, you must provide the debugger with the full path tothe launcher, including the name of the launch tool itself. If the location of the launcher is in yourPATH, then you just need to provide the name of the launcher and then only if the launcher is notmpiexec.
11.7.1. Launch Debugging Using the Connection TabYou can use PGDBG’s Connections tab to start debug sessions of programs that were built usingMPICH, MS-MPI, MVAPICH2 and Open MPI. Programs built with SGI MPI can be debuggedwith the PGDBG GUI but the session must be started when the debugger is launched.
To configure an MPI debug session, first select the MPI check box near the top of theConnections tab to enable its MPI-specific fields. Use the Command field to specify the MPIlaunch program and the Arguments field to pass arguments (if any) to the MPI launch program.The same rules discussed earlier about specifying the MPI launch program apply here as well.The examples in the following table use eight processes and a file named ‘hosts’ to illustrate howyou might go about filling in the Command and Argument fields for different MPI distributions:
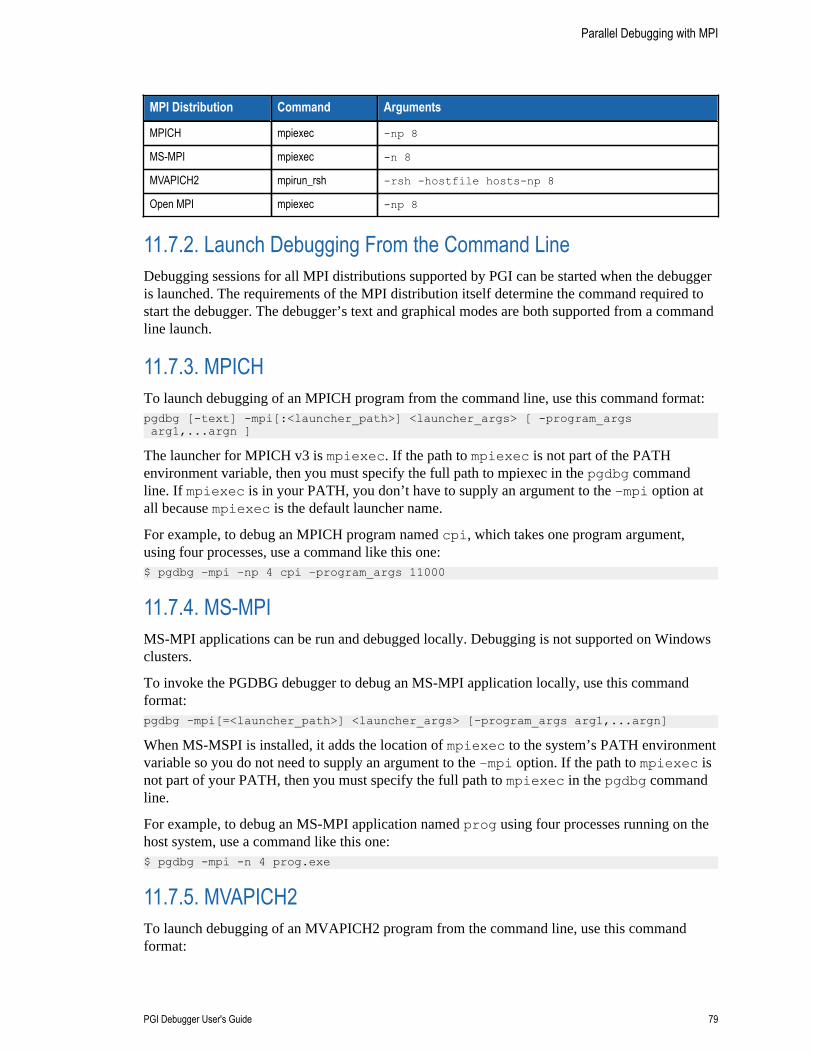
Parallel Debugging with MPI
PGI Debugger User's Guide 79
MPI Distribution Command Arguments
MPICH mpiexec -np 8
MS-MPI mpiexec -n 8
MVAPICH2 mpirun_rsh -rsh -hostfile hosts-np 8
Open MPI mpiexec -np 8
11.7.2. Launch Debugging From the Command LineDebugging sessions for all MPI distributions supported by PGI can be started when the debuggeris launched. The requirements of the MPI distribution itself determine the command required tostart the debugger. The debugger’s text and graphical modes are both supported from a commandline launch.
11.7.3. MPICHTo launch debugging of an MPICH program from the command line, use this command format:pgdbg [-text] -mpi[:<launcher_path>] <launcher_args> [ -program_args arg1,...argn ]
The launcher for MPICH v3 is mpiexec. If the path to mpiexec is not part of the PATHenvironment variable, then you must specify the full path to mpiexec in the pgdbg commandline. If mpiexec is in your PATH, you don’t have to supply an argument to the –mpi option atall because mpiexec is the default launcher name.
For example, to debug an MPICH program named cpi, which takes one program argument,using four processes, use a command like this one:$ pgdbg –mpi –np 4 cpi –program_args 11000
11.7.4. MS-MPIMS-MPI applications can be run and debugged locally. Debugging is not supported on Windowsclusters.
To invoke the PGDBG debugger to debug an MS-MPI application locally, use this commandformat:pgdbg -mpi[=<launcher_path>] <launcher_args> [-program_args arg1,...argn]
When MS-MSPI is installed, it adds the location of mpiexec to the system’s PATH environmentvariable so you do not need to supply an argument to the –mpi option. If the path to mpiexec isnot part of your PATH, then you must specify the full path to mpiexec in the pgdbg commandline.
For example, to debug an MS-MPI application named prog using four processes running on thehost system, use a command like this one:$ pgdbg -mpi -n 4 prog.exe
11.7.5. MVAPICH2To launch debugging of an MVAPICH2 program from the command line, use this commandformat:
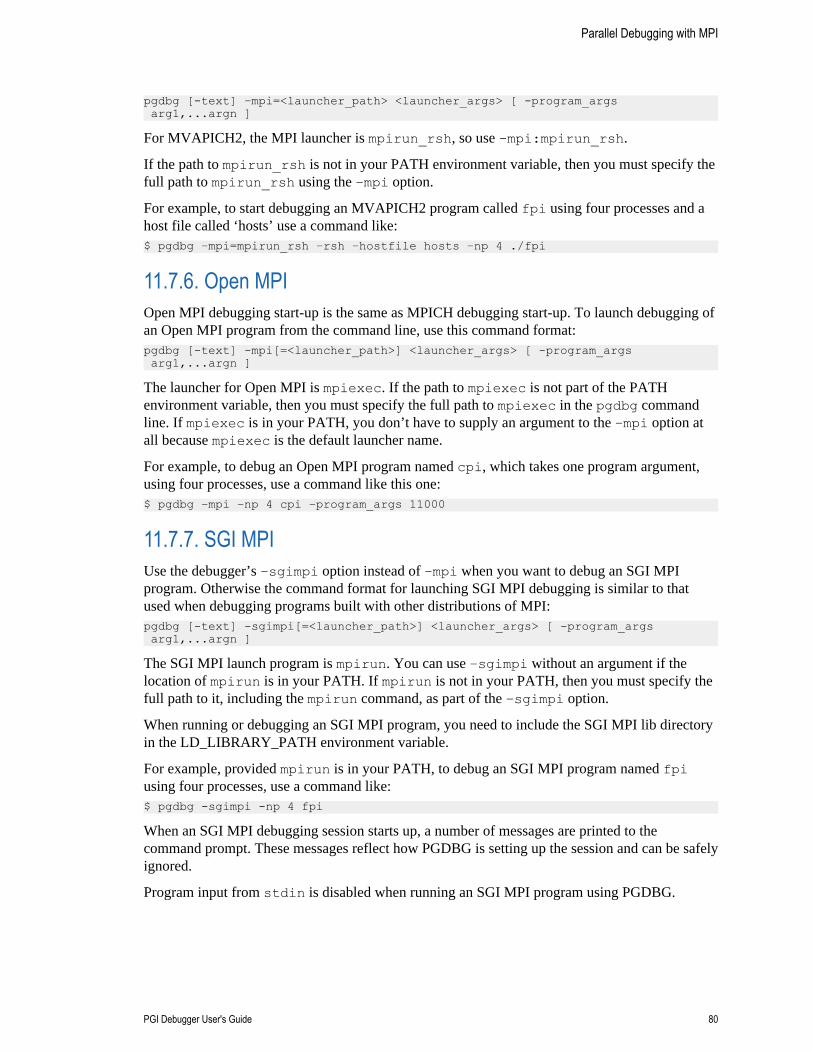
Parallel Debugging with MPI
PGI Debugger User's Guide 80
pgdbg [-text] –mpi=<launcher_path> <launcher_args> [ -program_args arg1,...argn ]
For MVAPICH2, the MPI launcher is mpirun_rsh, so use -mpi:mpirun_rsh.
If the path to mpirun_rsh is not in your PATH environment variable, then you must specify thefull path to mpirun_rsh using the –mpi option.
For example, to start debugging an MVAPICH2 program called fpi using four processes and ahost file called ‘hosts’ use a command like:$ pgdbg –mpi=mpirun_rsh –rsh –hostfile hosts –np 4 ./fpi
11.7.6. Open MPIOpen MPI debugging start-up is the same as MPICH debugging start-up. To launch debugging ofan Open MPI program from the command line, use this command format:pgdbg [-text] -mpi[=<launcher_path>] <launcher_args> [ -program_args arg1,...argn ]
The launcher for Open MPI is mpiexec. If the path to mpiexec is not part of the PATHenvironment variable, then you must specify the full path to mpiexec in the pgdbg commandline. If mpiexec is in your PATH, you don’t have to supply an argument to the –mpi option atall because mpiexec is the default launcher name.
For example, to debug an Open MPI program named cpi, which takes one program argument,using four processes, use a command like this one:$ pgdbg –mpi –np 4 cpi –program_args 11000
11.7.7. SGI MPIUse the debugger’s –sgimpi option instead of –mpi when you want to debug an SGI MPIprogram. Otherwise the command format for launching SGI MPI debugging is similar to thatused when debugging programs built with other distributions of MPI:pgdbg [-text] -sgimpi[=<launcher_path>] <launcher_args> [ -program_args arg1,...argn ]
The SGI MPI launch program is mpirun. You can use –sgimpi without an argument if thelocation of mpirun is in your PATH. If mpirun is not in your PATH, then you must specify thefull path to it, including the mpirun command, as part of the –sgimpi option.
When running or debugging an SGI MPI program, you need to include the SGI MPI lib directoryin the LD_LIBRARY_PATH environment variable.
For example, provided mpirun is in your PATH, to debug an SGI MPI program named fpiusing four processes, use a command like:$ pgdbg -sgimpi -np 4 fpi
When an SGI MPI debugging session starts up, a number of messages are printed to thecommand prompt. These messages reflect how PGDBG is setting up the session and can be safelyignored.
Program input from stdin is disabled when running an SGI MPI program using PGDBG.
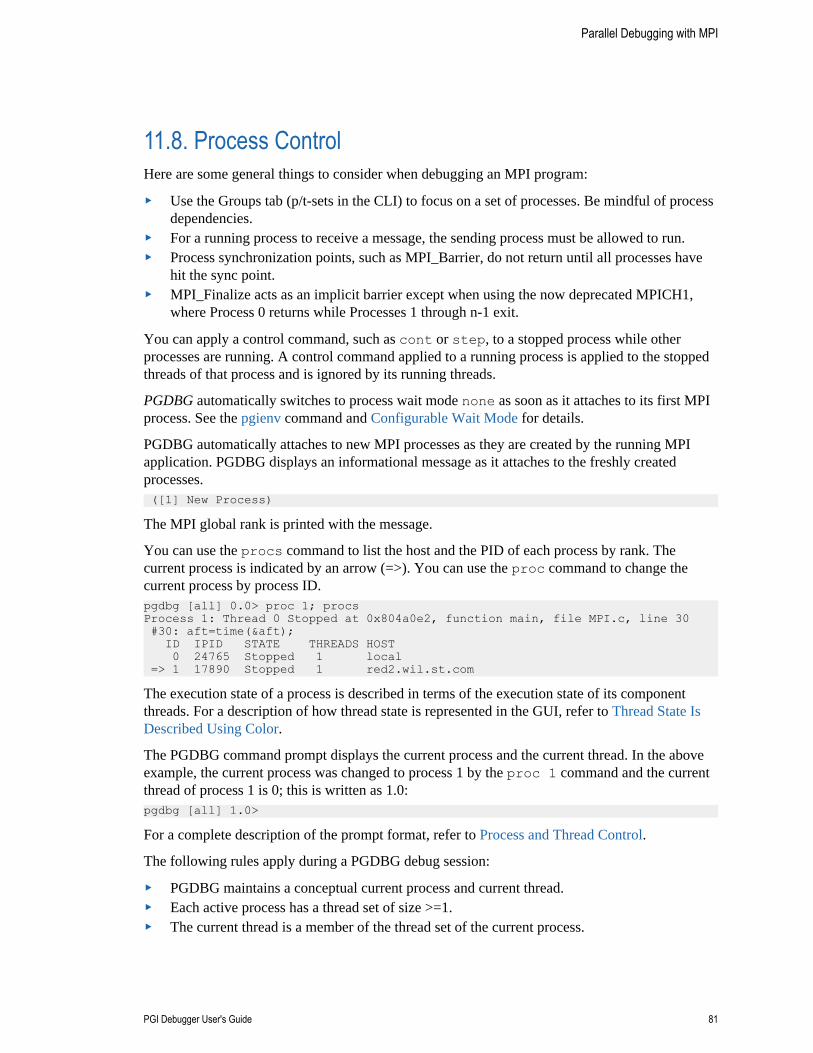
Parallel Debugging with MPI
PGI Debugger User's Guide 81
11.8. Process ControlHere are some general things to consider when debugging an MPI program:
‣ Use the Groups tab (p/t-sets in the CLI) to focus on a set of processes. Be mindful of processdependencies.
‣ For a running process to receive a message, the sending process must be allowed to run.‣ Process synchronization points, such as MPI_Barrier, do not return until all processes have
hit the sync point.‣ MPI_Finalize acts as an implicit barrier except when using the now deprecated MPICH1,
where Process 0 returns while Processes 1 through n-1 exit.
You can apply a control command, such as cont or step, to a stopped process while otherprocesses are running. A control command applied to a running process is applied to the stoppedthreads of that process and is ignored by its running threads.
PGDBG automatically switches to process wait mode none as soon as it attaches to its first MPIprocess. See the pgienv command and Configurable Wait Mode for details.
PGDBG automatically attaches to new MPI processes as they are created by the running MPIapplication. PGDBG displays an informational message as it attaches to the freshly createdprocesses. ([1] New Process)
The MPI global rank is printed with the message.
You can use the procs command to list the host and the PID of each process by rank. Thecurrent process is indicated by an arrow (=>). You can use the proc command to change thecurrent process by process ID.pgdbg [all] 0.0> proc 1; procsProcess 1: Thread 0 Stopped at 0x804a0e2, function main, file MPI.c, line 30 #30: aft=time(&aft); ID IPID STATE THREADS HOST 0 24765 Stopped 1 local => 1 17890 Stopped 1 red2.wil.st.com
The execution state of a process is described in terms of the execution state of its componentthreads. For a description of how thread state is represented in the GUI, refer to Thread State IsDescribed Using Color.
The PGDBG command prompt displays the current process and the current thread. In the aboveexample, the current process was changed to process 1 by the proc 1 command and the currentthread of process 1 is 0; this is written as 1.0:pgdbg [all] 1.0>
For a complete description of the prompt format, refer to Process and Thread Control.
The following rules apply during a PGDBG debug session:
‣ PGDBG maintains a conceptual current process and current thread.‣ Each active process has a thread set of size >=1.‣ The current thread is a member of the thread set of the current process.
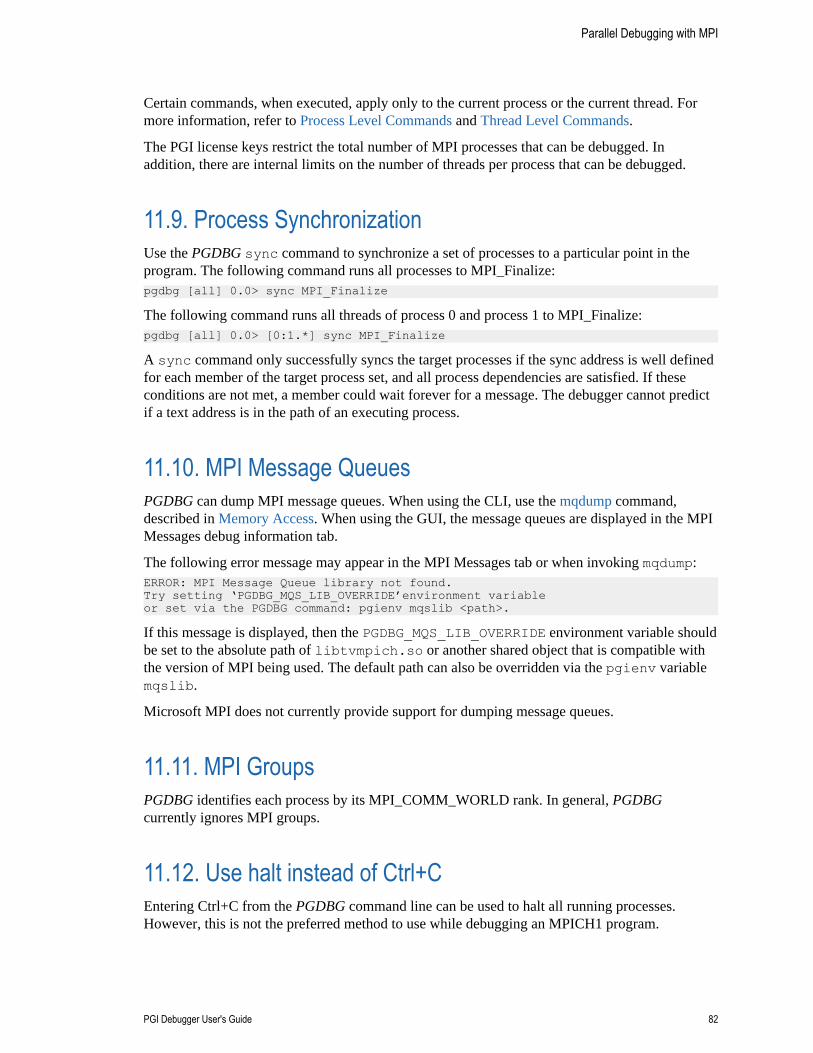
Parallel Debugging with MPI
PGI Debugger User's Guide 82
Certain commands, when executed, apply only to the current process or the current thread. Formore information, refer to Process Level Commands and Thread Level Commands.
The PGI license keys restrict the total number of MPI processes that can be debugged. Inaddition, there are internal limits on the number of threads per process that can be debugged.
11.9. Process SynchronizationUse the PGDBG sync command to synchronize a set of processes to a particular point in theprogram. The following command runs all processes to MPI_Finalize:pgdbg [all] 0.0> sync MPI_Finalize
The following command runs all threads of process 0 and process 1 to MPI_Finalize:pgdbg [all] 0.0> [0:1.*] sync MPI_Finalize
A sync command only successfully syncs the target processes if the sync address is well definedfor each member of the target process set, and all process dependencies are satisfied. If theseconditions are not met, a member could wait forever for a message. The debugger cannot predictif a text address is in the path of an executing process.
11.10. MPI Message QueuesPGDBG can dump MPI message queues. When using the CLI, use the mqdump command,described in Memory Access. When using the GUI, the message queues are displayed in the MPIMessages debug information tab.
The following error message may appear in the MPI Messages tab or when invoking mqdump:ERROR: MPI Message Queue library not found.Try setting ‘PGDBG_MQS_LIB_OVERRIDE’environment variableor set via the PGDBG command: pgienv mqslib <path>.
If this message is displayed, then the PGDBG_MQS_LIB_OVERRIDE environment variable shouldbe set to the absolute path of libtvmpich.so or another shared object that is compatible withthe version of MPI being used. The default path can also be overridden via the pgienv variablemqslib.
Microsoft MPI does not currently provide support for dumping message queues.
11.11. MPI GroupsPGDBG identifies each process by its MPI_COMM_WORLD rank. In general, PGDBGcurrently ignores MPI groups.
11.12. Use halt instead of Ctrl+CEntering Ctrl+C from the PGDBG command line can be used to halt all running processes.However, this is not the preferred method to use while debugging an MPICH1 program.
Parallel Debugging with MPI
PGI Debugger User's Guide 83
(MPICH1 support has been deprecated.) PGDBG automatically switches to process wait modenone (pgienv procwait none) as soon as it attaches to its first MPI process.
Setting pgienv procwait none allows commands to be entered while there are runningprocesses, which allows the use of the halt command to stop running processes without the useof Ctrl+C.
halt cannot interrupt a wait command. Ctrl+C must be used for this.
In MPI debugging, wait should be used with care.
11.13. SSH and RSHBy default, PGDBG uses rsh for communication between remote PGDBG components. PGDBGcan also use ssh for secure environments. The environment variable PGRSH should be set to sshor rsh to indicate the desired communication method.
If you opt to use ssh as the mechanism for launching the remote components of PGDBG, youmay want to do some additional configuration. The default configuration of ssh can result ina password prompt for each remote cluster node on which the debugger runs. Check with yournetwork administrator to make sure that you comply with your local security policies whenconfiguring ssh.
The following steps provide one way to configure SSH to eliminate this prompt. Theseinstructions assume $HOME is the same on all nodes of the cluster.$ ssh-keygen -t dsa$ eval ´ssh-agent -s´$ ssh-add <make sure that $HOME is not group-writable>$ cd $HOME/.ssh$ cat id_dsa.pub >> authorized_keys
Then for each cluster node you use in debugging, use:$ ssh <host>
A few things that are important related to this example are these:
‣ The ssh-keygen command prompts for a passphrase that is used to authenticate to thessh-agent during future sessions. The passphrase can be anything you choose.
‣ Once you answer the prompts to make the initial connection, subsequent connections shouldnot require further prompting.
‣ The ssh-agent -s command is correct for sh or bash shells. For csh shells, use ssh-agent -c.
After logging out and logging back in, the ssh-agent must be restarted and reauthorized. Forexample, in a bash shell, this is accomplished as follows:$ eval ´ssh-agent -s´$ ssh-add
You must enter the passphrase that was initially given to ssh-add to authenticate to the ssh-agent.
For further information, consult your ssh documentation.
Parallel Debugging with MPI
PGI Debugger User's Guide 84
11.14. Using the CLI
11.14.1. Setting DISPLAYTo use MPI debugging in text mode, be certain that the DISPLAY variable is undefined in theshell that is invoking mpirun. If this variable is set, you can undefine it by using one of thefollowing commands:
For sh/bash users, use this command:$ unset DISPLAY
For csh/tcsh users, use this command:% unsetenv DISPLAY
11.14.2. Using ContinueWhen debugging an MPI job after invoking the PGDBG CLI with the -mpi option, each processis stopped before the first assembly instruction in the program. Continuing execution using stepor next is not appropriate; instead, use the cont command.
PGI Debugger User's Guide 85
Chapter 12.PARALLEL DEBUGGING OF HYBRIDAPPLICATIONS
PGDBG supports debugging hybrid multi-thread/multi-process applications that use MPI tocommunicate between multi-threaded or OpenMP processes. Multi-threaded and OpenMPapplications may be run using more threads than the available number of CPUs, and MPIapplications may allocate more than one process to a cluster node. PGDBG supports debuggingthe supported types of applications regardless of how well the requested number of threadsmatches the number of CPUs or how well the requested number of processes matches the numberof cluster nodes.
12.1. PGDBG Multilevel Debug ModeAs described in PGDBG Debug Modes, PGDBG can operate in four debug modes. The modedetermines a short form for uniquely naming threads and processes.
The debug mode is set automatically or can be set manually using the pgienv command.
When PGDBG detects multilevel debugging, it sets the debug mode to multilevel. To manuallyset the debug mode to multilevel, use the pgienv command:pgdbg> pgienv mode multilevel
12.2. Multilevel DebuggingThe name of a thread in multilevel debug mode is the thread ID prefixed with its parent processID. This forms a unique name for each thread across all processes. This naming scheme is validin all debug modes. PGDBG changes automatically to multilevel debug mode from process-onlydebug mode or threads-only debug mode when at least one MPI process creates multiple threads.
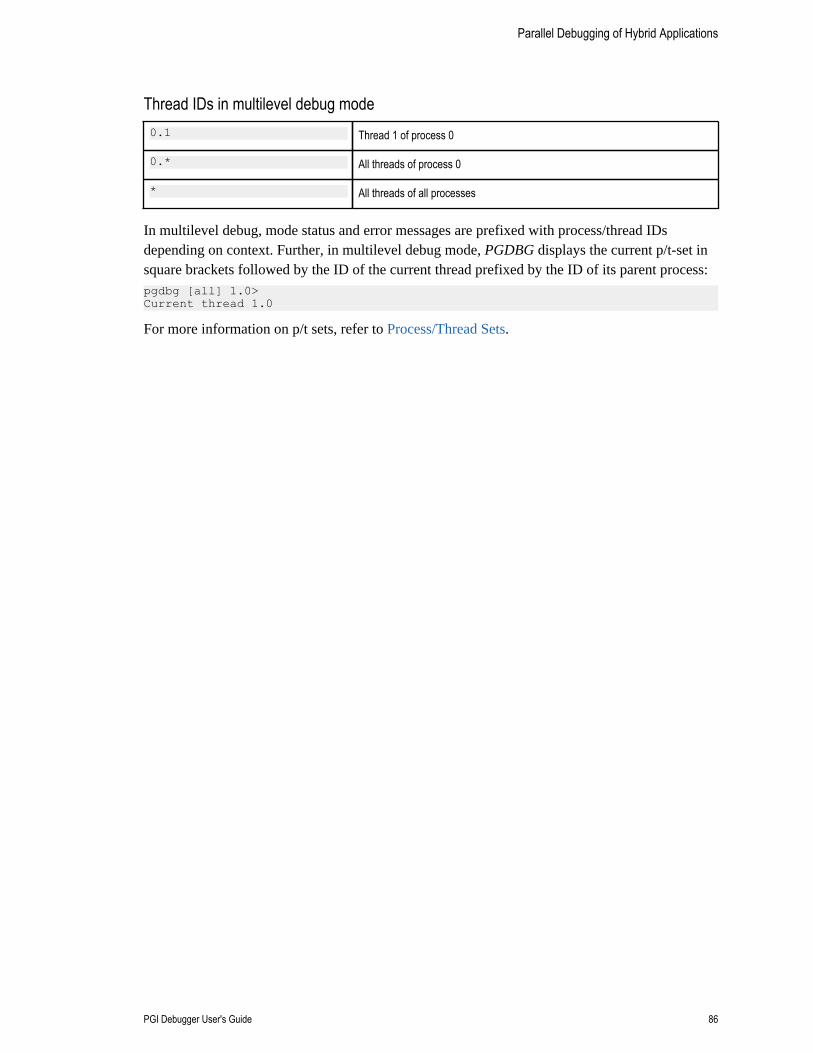
Parallel Debugging of Hybrid Applications
PGI Debugger User's Guide 86
Thread IDs in multilevel debug mode0.1 Thread 1 of process 0
0.* All threads of process 0
* All threads of all processes
In multilevel debug, mode status and error messages are prefixed with process/thread IDsdepending on context. Further, in multilevel debug mode, PGDBG displays the current p/t-set insquare brackets followed by the ID of the current thread prefixed by the ID of its parent process:pgdbg [all] 1.0>Current thread 1.0
For more information on p/t sets, refer to Process/Thread Sets.
PGI Debugger User's Guide 87
Chapter 13.COMMAND REFERENCE
This section describes the PGDBG command set in detail, grouping the commands by thesecategories:
Conversions Miscellaneous Process-Thread Sets Scope
Events Printing Variables andExpressings
Program Locations Symbols and Expressions
Memory Access Process Control Register Access Target
For an alphabetical listing of all the commands, with a brief description of each, refer to theCommand Summary.
13.1. Notation Used in Command SectionsThe command sections that follow use these conventions for the command names and arguments,when the command accepts one.
‣ Command names may be abbreviated by omitting the portion of the command nameenclosed in brackets ([]).
‣ Argument names are italicized.‣ Argument names are chosen to indicate what kind of argument is expected.‣ Arguments enclosed in brackets ([]) are optional.‣ Two or more arguments separated by a vertical line (|) indicate that any one of the arguments
is acceptable.‣ An ellipsis (...) indicates an arbitrarily long list of arguments.‣ Other punctuation, such as commas and quotes, must be entered as shown.
Syntax examplesExample 1:lis[t] [count | lo:hi | routine | line,count]
This syntax indicates that the command list may be abbreviated to lis, and that it can beinvoked without any arguments or with one of the following: an integer count, a line range, aroutine name, or a line and a count.
Command Reference
PGI Debugger User's Guide 88
Example 2:att[ach] pid [exe]
This syntax indicates that the command attach may be abbreviated to att, and, when invoked,must have a process ID argument, pid. Optionally you can specify an executable file, exe.
13.2. Process ControlThe following commands control the execution of the target program. PGDBG lets you easilygroup and control multiple threads and processes. For more details, refer to Basic Process andThread Naming.
13.2.1. attachatt[ach] pid [exe]
Attach to a running process with process ID pid. Use exe to specify the absolute path of theexecutable file. For example, attach 1234 attempts to attach to a running process whoseprocess ID is 1234. You may enter something like attach 1234 /home/demo/a.out toattach to a process ID 1234 called /home/demo/a.out.
PGDBG attempts to infer the arguments of the attached program. If PGDBG fails to infer theargument list, then the program behavior is undefined if the run or rerun command is executed onthe attached process.
The stdio channel of the attached process remains at the terminal from which the program wasoriginally invoked.
The attach command is not supported for MPI programs.
Note that on Ubuntu systems ptrace is, by default, restricted from attaching to non-childprocesses. As a result, PGDBG, as well as other debuggers utilizing ptrace on Linux, is notable to attach to a process for debugging. There are two workarounds:
1) To temporarily allow attaching for debug, modify the file /proc/sys/kernel/yama/ptrace-scope and change the content1
to0
2) To permanently allow attaching for debug, modify the file /etc/sysctl.d/10-ptrace.conf and change the linekernel.yama.ptrace_scope = 1
tokernel.yama.ptrace_scope = 0
13.2.2. contc[ont]
Continue execution from the current location.
Command Reference
PGI Debugger User's Guide 89
13.2.3. debugde[bug] [target [ arg1...argn]]
Load the specified target program with optional command-line arguments.
13.2.4. detachdet[ach]
Detach from the current running process.
13.2.5. halthalt [command]
Halt the running process or thread.
13.2.6. loadlo[ad] [program [args]]
Without arguments, load prints the name and arguments of the program being debugged. Witharguments, load loads the specified program for debugging. Provide program arguments asneeded.
13.2.7. nextn[ext] [count]
Stop after executing one source line in the current routine. This command steps over calledroutines. The count argument stops execution only after executing count source lines.
13.2.8. nextinexti [count]
Stop after executing one instruction in the current routine. This command steps over calledroutines. The count argument stops execution only after executing count instructions.
13.2.9. procproc [id]
Set the current process to the process identified by id. When issued with no argument, proc liststhe location of the current thread of the current process in the current program. For informationon how processes are numbered, refer to Using the CLI.
13.2.10. procsprocs
Print the status of all active processes, listing each process by its logical process ID.
Command Reference
PGI Debugger User's Guide 90
13.2.11. quitq[uit]
Terminate the debugging session.
13.2.12. rerunrer[un] [arg0arg1 ... argn] [< inputfile ] [ [ > | >& | >> | >>& ] outputfile ]
The rerun command is the same as run with one exception: if no args are specified withrerun, then no args are used when the program is launched.
13.2.13. runru[n] [arg0 arg1... argn] [< inputfile ] [ [ > | >& | >> | >>& ] outputfile ]
Execute the program from the beginning. If arguments arg0, arg1, and so on are specified, theyare set up as the command-line arguments of the program. Otherwise, the arguments that wereused with the previous run command are used. Standard input and standard output for the targetprogram can be redirected using < or > and an input or output filename.
13.2.14. setargssetargs [arg1, arg2, ... argn]
Set program arguments for use by the run command. The rerun command does not use thearguments specified by setargs.
13.2.15. steps[tep] [count | count]
Stop after executing one source line. This command steps into called routines. The countargument stops execution after executing count source lines. The up argument stops executionafter stepping out of the current routine (see stepout).
13.2.16. stepistepi [count | up]
Stop after executing one instruction. This command steps into called routines. The countargument stops execution after executing count instructions. The up argument stops the executionafter stepping out of the current routine (see stepout).
13.2.17. stepoutstepo[ut]
Stop after returning to the caller of the current subroutine. This command sets a breakpointat the current return address and continues execution to that point. For this command to workcorrectly, it must be possible to compute the value of the return address. Some subroutines,particularly terminal (i.e. leaf) subroutines at higher optimization levels, may not set up a stack
Command Reference
PGI Debugger User's Guide 91
frame. Executing stepout from such a routine causes the breakpoint to be set in the caller of themost recent routine that set up a stack frame. This command halts execution immediately uponreturn to the calling subroutine.
13.2.18. syncsy[nc] line | func
Advance to the specified source location, either the specified line or the first line in the specifiedfunction func, ignoring any user-defined events.
13.2.19. syncisynci addr | func
Advance to the specified address addr, or to the first address in the specified function func,ignoring any user-defined events.
13.2.20. threadthread [number]
Set the current thread to the thread identified by number; where number is a logical thread ID inthe current process’ active thread list. When issued with no argument, thread lists the currentprogram location of the currently active thread.
13.2.21. threadsthreads
Print the status of all active threads. Threads are grouped by process. Each process is listed by itslogical process ID. Each thread is listed by its logical thread ID.
13.2.22. waitwait [any | all | none]
Return the PGDBG prompt only after specific processes or threads stop.
13.3. Process-Thread SetsThe following commands deal with defining and managing process thread sets. For a detaileddiscussion of process-thread sets, refer to Process/Thread Sets.
13.3.1. defsetdefset name [p/t-set]
Assign a name to a process/thread set. In other words, define a named set of processes/threads.This set can then be referred to by its name. A list of named sets is stored by PGDBG.
13.3.2. focusfocus [p/t-set]
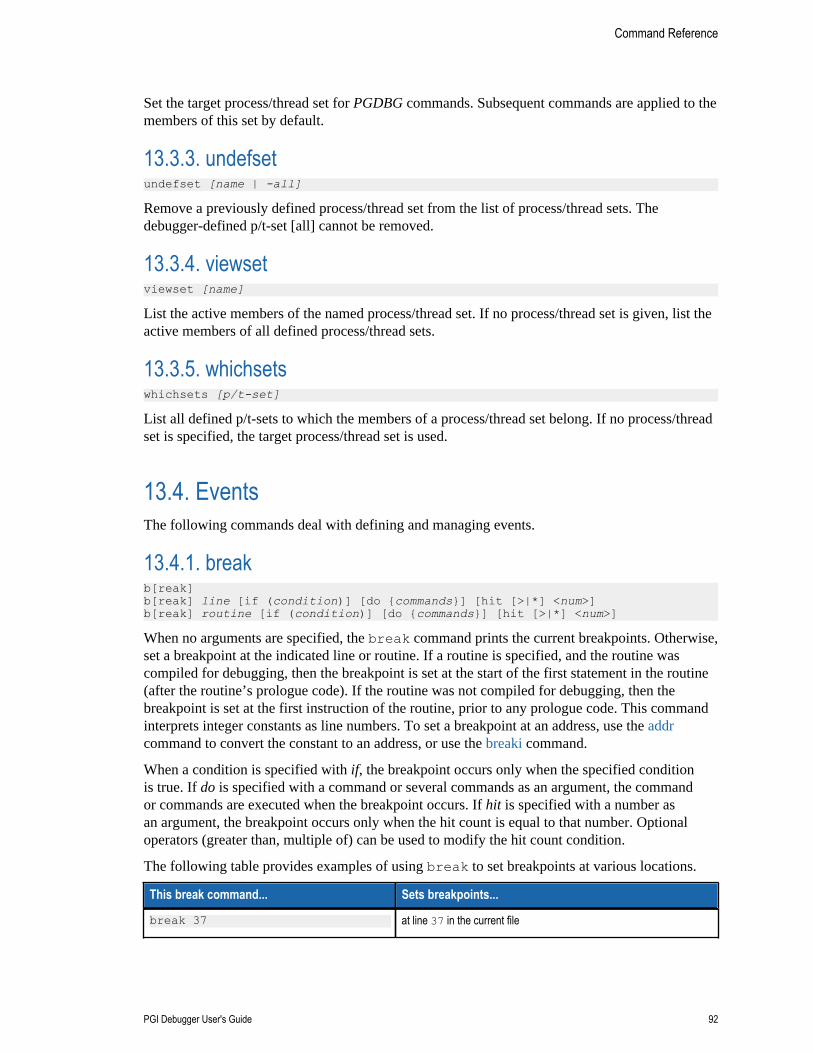
Command Reference
PGI Debugger User's Guide 92
Set the target process/thread set for PGDBG commands. Subsequent commands are applied to themembers of this set by default.
13.3.3. undefsetundefset [name | -all]
Remove a previously defined process/thread set from the list of process/thread sets. Thedebugger-defined p/t-set [all] cannot be removed.
13.3.4. viewsetviewset [name]
List the active members of the named process/thread set. If no process/thread set is given, list theactive members of all defined process/thread sets.
13.3.5. whichsetswhichsets [p/t-set]
List all defined p/t-sets to which the members of a process/thread set belong. If no process/threadset is specified, the target process/thread set is used.
13.4. EventsThe following commands deal with defining and managing events.
13.4.1. breakb[reak] b[reak] line [if (condition)] [do {commands}] [hit [>|*] <num>]b[reak] routine [if (condition)] [do {commands}] [hit [>|*] <num>]
When no arguments are specified, the break command prints the current breakpoints. Otherwise,set a breakpoint at the indicated line or routine. If a routine is specified, and the routine wascompiled for debugging, then the breakpoint is set at the start of the first statement in the routine(after the routine’s prologue code). If the routine was not compiled for debugging, then thebreakpoint is set at the first instruction of the routine, prior to any prologue code. This commandinterprets integer constants as line numbers. To set a breakpoint at an address, use the addrcommand to convert the constant to an address, or use the breaki command.
When a condition is specified with if, the breakpoint occurs only when the specified conditionis true. If do is specified with a command or several commands as an argument, the commandor commands are executed when the breakpoint occurs. If hit is specified with a number asan argument, the breakpoint occurs only when the hit count is equal to that number. Optionaloperators (greater than, multiple of) can be used to modify the hit count condition.
The following table provides examples of using break to set breakpoints at various locations.
This break command... Sets breakpoints...
break 37 at line 37 in the current file
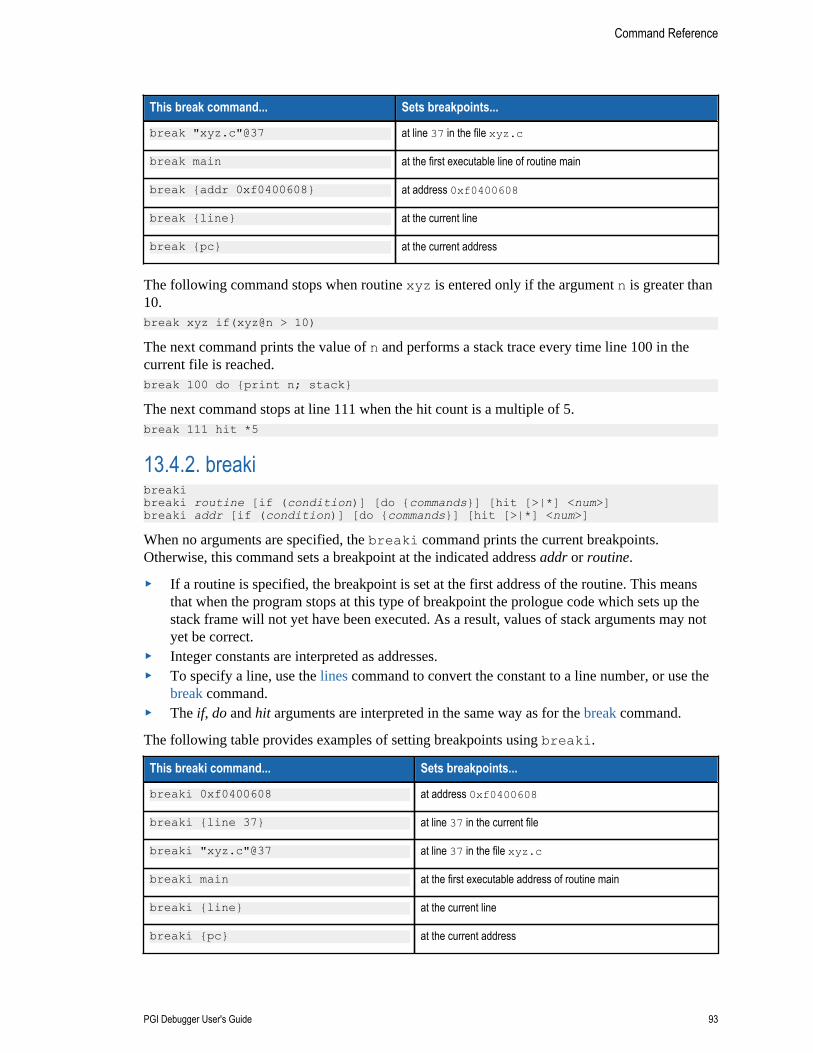
Command Reference
PGI Debugger User's Guide 93
This break command... Sets breakpoints...
break "xyz.c"@37 at line 37 in the file xyz.c
break main at the first executable line of routine main
break {addr 0xf0400608} at address 0xf0400608
break {line} at the current line
break {pc} at the current address
The following command stops when routine xyz is entered only if the argument n is greater than10.break xyz if(xyz@n > 10)
The next command prints the value of n and performs a stack trace every time line 100 in thecurrent file is reached.break 100 do {print n; stack}
The next command stops at line 111 when the hit count is a multiple of 5.break 111 hit *5
13.4.2. breakibreakibreaki routine [if (condition)] [do {commands}] [hit [>|*] <num>]breaki addr [if (condition)] [do {commands}] [hit [>|*] <num>]
When no arguments are specified, the breaki command prints the current breakpoints.Otherwise, this command sets a breakpoint at the indicated address addr or routine.
‣ If a routine is specified, the breakpoint is set at the first address of the routine. This meansthat when the program stops at this type of breakpoint the prologue code which sets up thestack frame will not yet have been executed. As a result, values of stack arguments may notyet be correct.
‣ Integer constants are interpreted as addresses.‣ To specify a line, use the lines command to convert the constant to a line number, or use the
break command.‣ The if, do and hit arguments are interpreted in the same way as for the break command.
The following table provides examples of setting breakpoints using breaki.
This breaki command... Sets breakpoints...
breaki 0xf0400608 at address 0xf0400608
breaki {line 37} at line 37 in the current file
breaki "xyz.c"@37 at line 37 in the file xyz.c
breaki main at the first executable address of routine main
breaki {line} at the current line
breaki {pc} at the current address
Command Reference
PGI Debugger User's Guide 94
In the following example, when n is greater than 3, the following command stops and prints thenew value of n at address 0x6480:breaki 0x6480 if(n>3) do {print "n=", n}
13.4.3. breaksbreaks
Display all the existing breakpoints.
13.4.4. catchcatch [sig:sig] [sig [, sig...]]
When no arguments are specified, the catch command prints the list of signals being caught.With the sig:sig argument, this command catches the specified range of signals. With a listof signals, catch the signals with the specified number(s). When signals are caught, PGDBGintercepts the signal and does not deliver it to the program. The program runs as though the signalwas never sent.
13.4.5. clearclear [ all | routine| line | {addr addr}]
Clear one or more breakpoints. Use the all argument to clear all breakpoints. Use the routineargument to clear all breakpoints from the first statement in the specified routine. Use the linenumber argument to clear all breakpoints from the specified line number in the current sourcefile. Use the addr argument to clear breakpoints from the specified address addr.
When no arguments are specified, the clear command clears all breakpoints at the currentlocation.
13.4.6. deletedel[ete] [event-number | 0 | all | event-number [, event-number...] ]
Use the delete command without arguments to list all defined events by their event-number.
Use the delete command with arguments to delete events. Delete all events with all or deletejust the event with the specified event-number. Using delete 0, is the same as using deleteall.
13.4.7. disabledisab[le] [event-number | all ]
When no arguments are specified, the disable command prints both enabled and disabledevents by event number.
With arguments, this command disables the event specified by event-number or all events.Disabling an event definition suppresses actions associated with the event, but leaves the eventdefined so that it can be used later. (See the enable command.)
13.4.8. dodo {commands} [if (condition)]
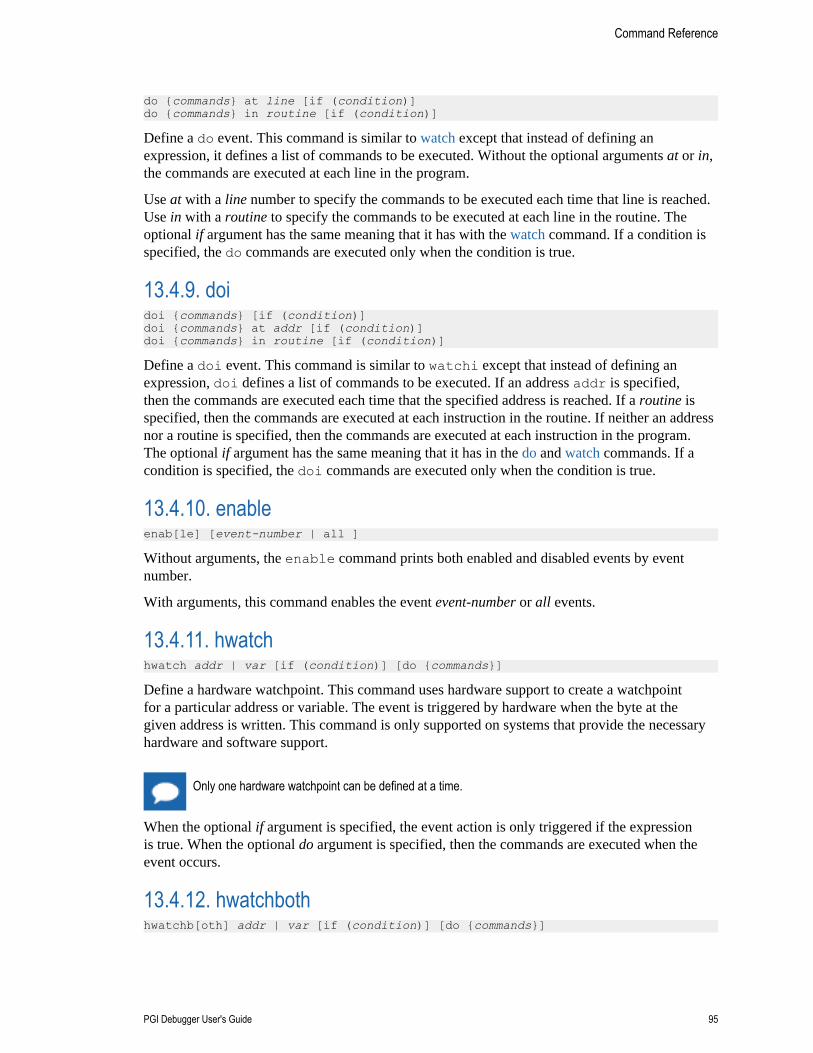
Command Reference
PGI Debugger User's Guide 95
do {commands} at line [if (condition)]do {commands} in routine [if (condition)]
Define a do event. This command is similar to watch except that instead of defining anexpression, it defines a list of commands to be executed. Without the optional arguments at or in,the commands are executed at each line in the program.
Use at with a line number to specify the commands to be executed each time that line is reached.Use in with a routine to specify the commands to be executed at each line in the routine. Theoptional if argument has the same meaning that it has with the watch command. If a condition isspecified, the do commands are executed only when the condition is true.
13.4.9. doidoi {commands} [if (condition)]doi {commands} at addr [if (condition)]doi {commands} in routine [if (condition)]
Define a doi event. This command is similar to watchi except that instead of defining anexpression, doi defines a list of commands to be executed. If an address addr is specified,then the commands are executed each time that the specified address is reached. If a routine isspecified, then the commands are executed at each instruction in the routine. If neither an addressnor a routine is specified, then the commands are executed at each instruction in the program.The optional if argument has the same meaning that it has in the do and watch commands. If acondition is specified, the doi commands are executed only when the condition is true.
13.4.10. enableenab[le] [event-number | all ]
Without arguments, the enable command prints both enabled and disabled events by eventnumber.
With arguments, this command enables the event event-number or all events.
13.4.11. hwatchhwatch addr | var [if (condition)] [do {commands}]
Define a hardware watchpoint. This command uses hardware support to create a watchpointfor a particular address or variable. The event is triggered by hardware when the byte at thegiven address is written. This command is only supported on systems that provide the necessaryhardware and software support.
Only one hardware watchpoint can be defined at a time.
When the optional if argument is specified, the event action is only triggered if the expressionis true. When the optional do argument is specified, then the commands are executed when theevent occurs.
13.4.12. hwatchbothhwatchb[oth] addr | var [if (condition)] [do {commands}]
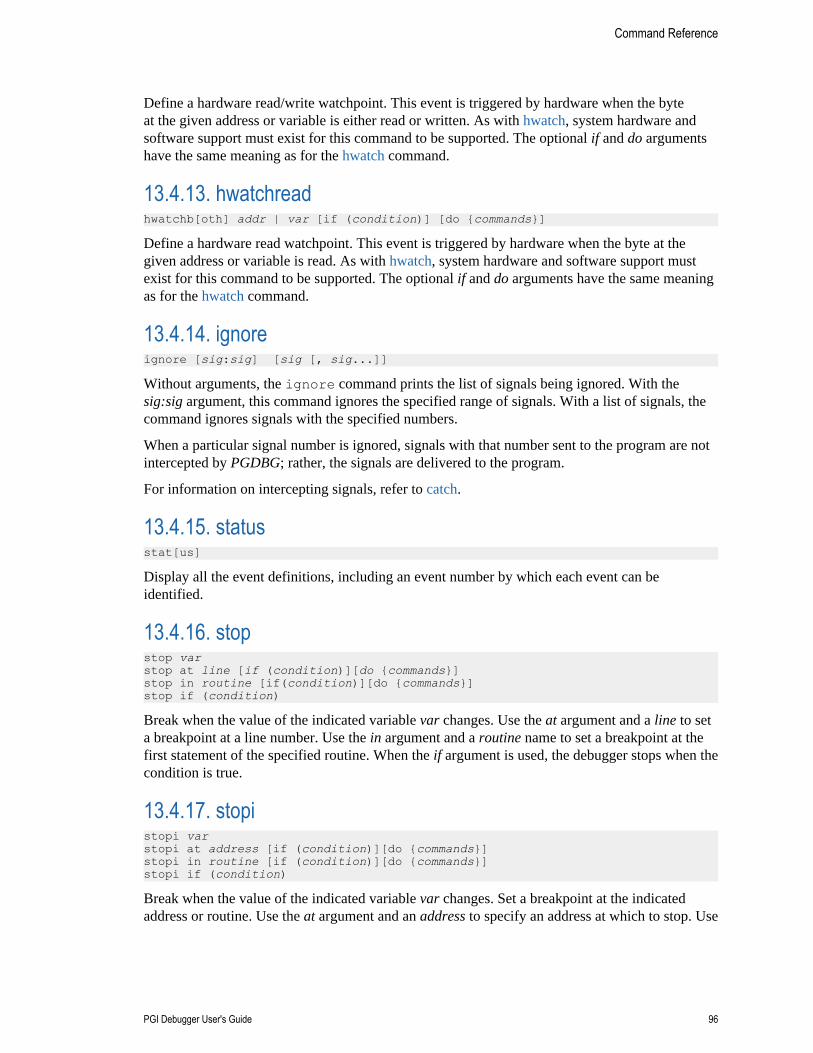
Command Reference
PGI Debugger User's Guide 96
Define a hardware read/write watchpoint. This event is triggered by hardware when the byteat the given address or variable is either read or written. As with hwatch, system hardware andsoftware support must exist for this command to be supported. The optional if and do argumentshave the same meaning as for the hwatch command.
13.4.13. hwatchreadhwatchb[oth] addr | var [if (condition)] [do {commands}]
Define a hardware read watchpoint. This event is triggered by hardware when the byte at thegiven address or variable is read. As with hwatch, system hardware and software support mustexist for this command to be supported. The optional if and do arguments have the same meaningas for the hwatch command.
13.4.14. ignoreignore [sig:sig] [sig [, sig...]]
Without arguments, the ignore command prints the list of signals being ignored. With thesig:sig argument, this command ignores the specified range of signals. With a list of signals, thecommand ignores signals with the specified numbers.
When a particular signal number is ignored, signals with that number sent to the program are notintercepted by PGDBG; rather, the signals are delivered to the program.
For information on intercepting signals, refer to catch.
13.4.15. statusstat[us]
Display all the event definitions, including an event number by which each event can beidentified.
13.4.16. stopstop varstop at line [if (condition)][do {commands}]stop in routine [if(condition)][do {commands}]stop if (condition)
Break when the value of the indicated variable var changes. Use the at argument and a line to seta breakpoint at a line number. Use the in argument and a routine name to set a breakpoint at thefirst statement of the specified routine. When the if argument is used, the debugger stops when thecondition is true.
13.4.17. stopistopi var stopi at address [if (condition)][do {commands}]stopi in routine [if (condition)][do {commands}]stopi if (condition)
Break when the value of the indicated variable var changes. Set a breakpoint at the indicatedaddress or routine. Use the at argument and an address to specify an address at which to stop. Use
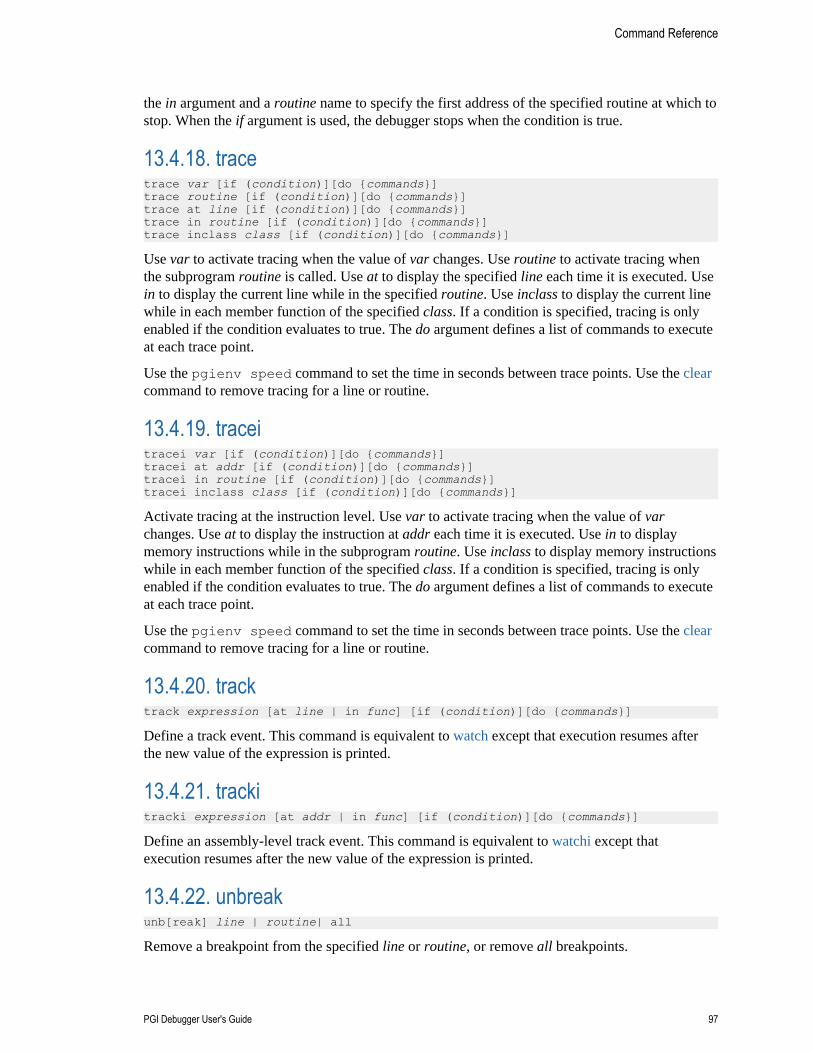
Command Reference
PGI Debugger User's Guide 97
the in argument and a routine name to specify the first address of the specified routine at which tostop. When the if argument is used, the debugger stops when the condition is true.
13.4.18. tracetrace var [if (condition)][do {commands}]trace routine [if (condition)][do {commands}]trace at line [if (condition)][do {commands}]trace in routine [if (condition)][do {commands}]trace inclass class [if (condition)][do {commands}]
Use var to activate tracing when the value of var changes. Use routine to activate tracing whenthe subprogram routine is called. Use at to display the specified line each time it is executed. Usein to display the current line while in the specified routine. Use inclass to display the current linewhile in each member function of the specified class. If a condition is specified, tracing is onlyenabled if the condition evaluates to true. The do argument defines a list of commands to executeat each trace point.
Use the pgienv speed command to set the time in seconds between trace points. Use the clearcommand to remove tracing for a line or routine.
13.4.19. traceitracei var [if (condition)][do {commands}]tracei at addr [if (condition)][do {commands}]tracei in routine [if (condition)][do {commands}]tracei inclass class [if (condition)][do {commands}]
Activate tracing at the instruction level. Use var to activate tracing when the value of varchanges. Use at to display the instruction at addr each time it is executed. Use in to displaymemory instructions while in the subprogram routine. Use inclass to display memory instructionswhile in each member function of the specified class. If a condition is specified, tracing is onlyenabled if the condition evaluates to true. The do argument defines a list of commands to executeat each trace point.
Use the pgienv speed command to set the time in seconds between trace points. Use the clearcommand to remove tracing for a line or routine.
13.4.20. tracktrack expression [at line | in func] [if (condition)][do {commands}]
Define a track event. This command is equivalent to watch except that execution resumes afterthe new value of the expression is printed.
13.4.21. trackitracki expression [at addr | in func] [if (condition)][do {commands}]
Define an assembly-level track event. This command is equivalent to watchi except thatexecution resumes after the new value of the expression is printed.
13.4.22. unbreakunb[reak] line | routine| all
Remove a breakpoint from the specified line or routine, or remove all breakpoints.
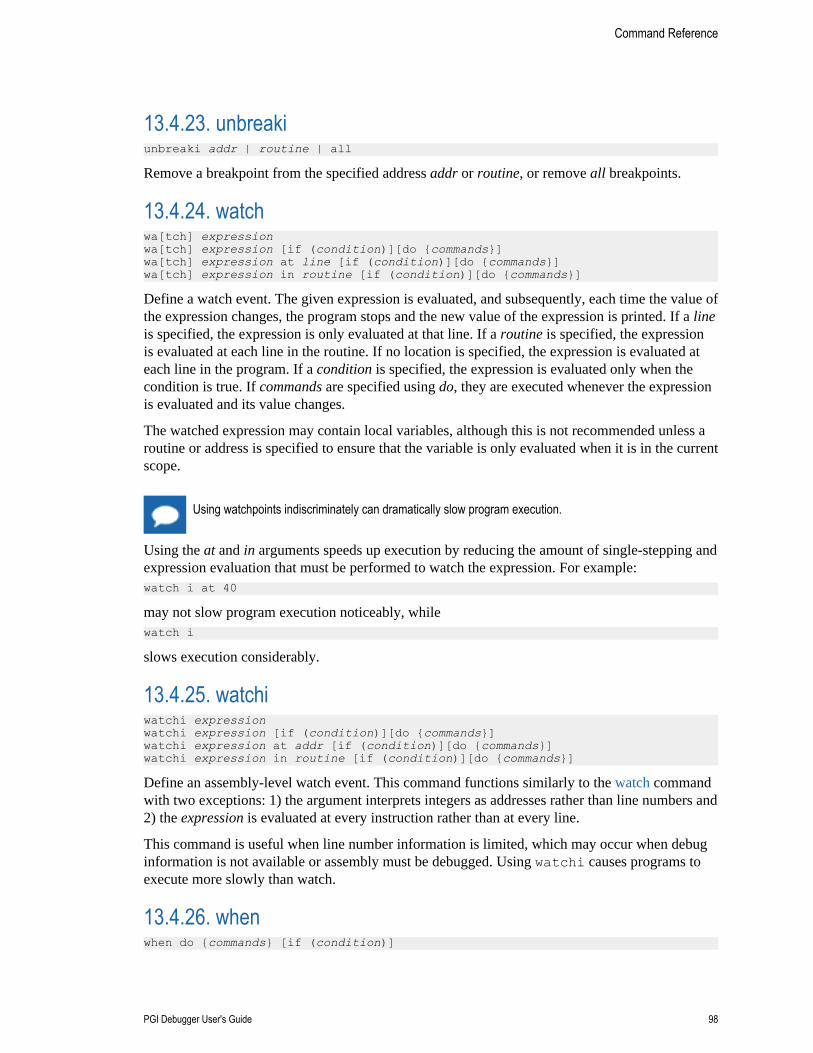
Command Reference
PGI Debugger User's Guide 98
13.4.23. unbreakiunbreaki addr | routine | all
Remove a breakpoint from the specified address addr or routine, or remove all breakpoints.
13.4.24. watchwa[tch] expression wa[tch] expression [if (condition)][do {commands}]wa[tch] expression at line [if (condition)][do {commands}]wa[tch] expression in routine [if (condition)][do {commands}]
Define a watch event. The given expression is evaluated, and subsequently, each time the value ofthe expression changes, the program stops and the new value of the expression is printed. If a lineis specified, the expression is only evaluated at that line. If a routine is specified, the expressionis evaluated at each line in the routine. If no location is specified, the expression is evaluated ateach line in the program. If a condition is specified, the expression is evaluated only when thecondition is true. If commands are specified using do, they are executed whenever the expressionis evaluated and its value changes.
The watched expression may contain local variables, although this is not recommended unless aroutine or address is specified to ensure that the variable is only evaluated when it is in the currentscope.
Using watchpoints indiscriminately can dramatically slow program execution.
Using the at and in arguments speeds up execution by reducing the amount of single-stepping andexpression evaluation that must be performed to watch the expression. For example:watch i at 40
may not slow program execution noticeably, whilewatch i
slows execution considerably.
13.4.25. watchiwatchi expression watchi expression [if (condition)][do {commands}]watchi expression at addr [if (condition)][do {commands}]watchi expression in routine [if (condition)][do {commands}]
Define an assembly-level watch event. This command functions similarly to the watch commandwith two exceptions: 1) the argument interprets integers as addresses rather than line numbers and2) the expression is evaluated at every instruction rather than at every line.
This command is useful when line number information is limited, which may occur when debuginformation is not available or assembly must be debugged. Using watchi causes programs toexecute more slowly than watch.
13.4.26. whenwhen do {commands} [if (condition)]
Command Reference
PGI Debugger User's Guide 99
when at line do {commands} [if (condition)]when in routine do {commands} [if (condition)]
Execute commands at every line in the program, at a specified line in the program, or in thespecified routine. If an optional condition is specified, commands are executed only when thecondition evaluates to true.
13.4.27. wheniwheni do {commands} [if (condition)]wheni at addr do {commands} [if (condition)]wheni in routine do {commands} [if (condition)]
Execute commands at each address in the program. If an address addr is specified, the commandsare executed each time the address is reached. If a routine is specified, the commands areexecuted at each line in the routine. If an optional condition is specified, commands are executedwhenever the condition evaluates to true.
13.5. Program LocationsThis section describes PGDBG program location commands.
13.5.1. arrivearri[ve]
Print location information for the current location.
13.5.2. cdcd [dir]
Change the current directory to the $HOME directory or to the specified directory dir.
13.5.3. disasmdis[asm] [ count | lo:hi | routine | addr, count ]
Disassemble memory.
If no argument is given, disassemble four instructions starting at the current address. If an integercount is given, disassemble count instructions starting at the current address. If an address range(lo:hi) is given, disassemble the memory in the range. If a routine is given, disassemble the entireroutine. If the routine was compiled for debugging and source code is available, the source codeis interleaved with the disassembly. If an address addr and a count are both given, disassemblecount instructions starting at the provided address.
13.5.4. editedit [filename | routine]
Use the editor specified by the environment variable $EDITOR to edit a file.
Command Reference
PGI Debugger User's Guide 100
If no argument is supplied, edit the current file starting at the current location. To edit a specificfile, provide the filename argument. To edit the file containing the subprogram routine, specifythe routine name.
This command is only supported in the CLI.
13.5.5. filefile [filename]
Change the source file to the file filename and change the scope accordingly. With no argument,print the current file.
13.5.6. lineslines [routine]
Print the lines table for the specified routine. With no argument, prints the lines table for thecurrent routine.
13.5.7. listlis[t] [ count | line,num | lo:hi | routine[,num] ]
Provide a source listing.
By default, list displays ten lines of source centered at the current source line. If a count isgiven, list the specified number of lines. If a line and count are both given, start the listing ofcount lines at line. If a line range (lo:hi) is given, list the indicated source lines in the currentsource file. If a routine name is given, list the source code for the indicated routine. If a number isspecified with routine, list the first number lines of the source code for the indicated routine.list [dbx mode]
The list command works somewhat differently when PGDBG is in dbx mode.lis[t] [ line | first,last | routine | file ]
By default, list displays ten lines of source centered at the current source line. If a line isprovided, the source at that line is displayed. If a range of line numbers is provided (first,last),lines from the first specified line to the last specified line are displayed. If a routine is provided,the display listing begins in that routine. If a file name is provided, the display listing begins inthat file. File names must be quoted.
13.5.8. pwdpwd
Print the current working directory.
13.5.9. stackdumpstackd[ump] [count]
Print the call stack. This command displays a hex dump of the stack frame for each active routine.This command is an assembly-level version of the stacktrace command. If a count is specified,display a maximum of count stack frames.
Command Reference
PGI Debugger User's Guide 101
13.5.10. stacktracestack[trace] [count]
Print the call stack. Print the available information for each active routine, including the routinename, source file, line number, and current address. This command also prints the names andvalues of any arguments, when available. If a count is specified, display a maximum of countstack frames. The stacktrace and where commands are equivalent.
13.5.11. wherew[here] [count]
Print the call stack. Print the available information for each active routine, including the routinename, source file, line number, and current address. This command also prints the names andvalues of any arguments, when available. If a count is specified, display a maximum of countstack frames. The where and stacktrace commands are equivalent.
13.5.12. ///string/
Search forward for a string of characters in the current source file. With a specified string, searchfor the next occurrence of string in the current source file.
13.5.13. ???string?
Search backward for a string of characters in the current source file. Without arguments, searchfor the previous occurrence of string in the current source file.
13.6. Printing Variables and ExpressionsThis section describes PGDBG commands used for printing and setting variables. The primaryprint commands are print and printf, described at the beginning of this section. The rest ofthe commands for printing provide alternate methods for printing.
13.6.1. printp[rint] exp1 [,...expn]
Evaluate and print one or more expressions. This command is invoked to print the result ofeach line of command input. Values are printed in a format appropriate to their type. For valuesof structure type, each field name and value is printed. Character pointers are printed as a hexaddress followed by the character string.
Character string constants print out literally using a comma-separated list. For example:pgdbg> print "The value of i is ", i
Prints this:
Command Reference
PGI Debugger User's Guide 102
"The value of i is", 37
The array sub-range operator (:) prints a range of an array. The following examples print elements0 through 9 of the array a:
C/ C++[ example 1:pgdbg> print a[0:9]a[0:4]: 0 1 2 3 4a[5:9]: 5 6 7 8 9
FORTRAN example 1:pgdbg> print a(0:9)a(0:4): 0 1 2 3 4a(5:9): 5 6 7 8 9
Notice that the output is formatted and annotated with index information. PGDBG formats arrayoutput into columns. For each row, the first column prints an index expression which summarizesthe elements printed in that row. Elements associated with each index expression are then printedin order. This is especially useful when printing slices of large multidimensional arrays.
PGDBG also supports array expression strides. Below are examples for C/ C++ and FORTRAN.
C/ C++ example 2:pgdbg> print a[0:9:2]a[0:8]: 0 2 4 6 8
FORTRAN example 2:pgdbg> print a(0:9:2)a(0:8): 0 2 4 6 8
The print statement may be used to display members of derived types in FORTRAN or structuresin C/ C++. Here are examples.
C/ C++ example 3:typedef struct tt { int a[10]; }TT; TT d = {0,1,2,3,4,5,6,7,8,9}; TT * p = &d;
pgdbg> print d.a[0:9:2] d.a[0:8:2]: 0 2 4 6 8pgdbg> print p->a[0:9:2] p->a[0:7:2]: 0 2 4 6 p->a[8]: 8
FORTRAN example 3: type tt integer, dimension(0:9) :: a end type type (tt) :: d data d%a / 0, 1, 2, 3, 4, 5, 6, 7, 8, 9 /
pgdbg> print d%a(0:9:2) d%a(0:8:2): 0 2 4 6 8
13.6.2. printfprintf "format_string", expr,...expr
Command Reference
PGI Debugger User's Guide 103
Print expressions in the format indicated by the format string. This command behaves like the Clibrary function printf. For example:pgdbg> printf "f[%d]=%G",i,f[i]f[3]=3.14
The pgienv stringlen command sets the maximum number of characters that print with aprint command. For example, the char declaration below:char *c="a whole bunch of chars over 1000 chars long....";
By default, the print c command prints only the first 512 (default value of stringlen) bytes.Printing of C strings is usually terminated by the terminating null character. This limit is asafeguard against unterminated C strings.
13.6.3. asciiasc[ii] exp [,...exp]
Evaluate and print exp as an ASCII character. Control characters are prefixed with the '^'character; for example, 3 prints as ^c. Otherwise, values that cannot be printed as characters areprinted as integer values prefixed by ´\'. For example, 250 is printed as \250.
13.6.4. binbin exp [,...exp]
Evaluate and print the expressions. Integer values are printed in base2.
13.6.5. decdec exp [,...exp]
Evaluate and print the expressions. Integer values are printed in decimal.
13.6.6. displaydisplay [ exp [,...exp] ]
Without arguments, list the expressions for PGDBG to automatically display at breakpoints.With one or more arguments, print expression exp at every breakpoint. See also the undisplaycommand.
13.6.7. hexhex exp [,...exp]
Evaluate and print expressions as hexadecimal integers.
13.6.8. octoct exp [,...exp]
Evaluate and print expressions as octal integers.
13.6.9. stringstr[ing] exp [,...exp]
Command Reference
PGI Debugger User's Guide 104
Evaluate and print expressions as null-terminated character strings. This command prints amaximum of 70 characters.
13.6.10. undisplayundisplay 0 | all | exp [,...exp]
Remove all expressions specified by previous display commands. With an argument or severalarguments, remove the expression exp from the list of display expressions.
13.7. Symbols and ExpressionsThis section describes the commands that deal with symbols and expressions.
13.7.1. assignas[sign] var = exp
Set variable var to the value of the expression exp. The variable can be any valid identifieraccessed properly for the current scope. For example, given a C variable declared ‘int * i’,you can use the following command to assign the value 9999 to it.assign *i = 9999
13.7.2. callcall routine [(exp,...)]
Call the named routine. C argument passing conventions are used. Breakpoints encounteredduring execution of the routine are ignored. Fortran functions and subroutines can be called, butthe argument values are passed according to C conventions. PGDBG may not always be able toaccess the return value of a Fortran function if the return value is an array. In the example below,PGDBG calls the routine foo with four arguments:pgdbg> call foo(1,2,3,4)
If a signal is caught during execution of the called routine, PGDBG stops the execution and asksif you want to cancel the call command. For example, suppose a command is issued to call fooas shown above, and for some reason a signal is sent to the process while it is executing the callto foo. In this case, PGDBG prints the following prompt:PGDBG Message: Thread [0] was signalled while executing a functionreachable from the most recent PGDBG command line call to foo. Would youlike to cancel this command line call? Answering yes will revert the registerstate of Thread [0] back to the state it had prior to the last call to foofrom the command line. Answering no will leave Thread [0] stopped in the call to foo from the command line.Please enter 'y' or 'n' > yCommand line call to foo cancelled
Answering yes to this question returns the register state of each thread back to the state they hadbefore invoking the call command. Answering no to this question leaves each thread at thepoint they were at when the signal occurred.
Answering no to this question and continuing execution of the called routine may produce unpredictableresults.
Command Reference
PGI Debugger User's Guide 105
13.7.3. declarationdecl[aration] name
Print the declaration for the symbol name based on its type according to the symbol table. Thesymbol must be a variable, argument, enumeration constant, routine, structure, union, enum, ortypedef tag.
For example, given the C declarations:int i, iar[10];struct abc {int a; char b[4]; structabc *c;}val;
the decl command provides the following output:pgdbg> decl Iint i
pgdbg> decl iarint iar[10]
pgdbg> decl valstruct abc val
pgdbg> decl abcstruct abc { int a; char b[4]; struct abc *c;};
13.7.4. entryentr[y] [routine]
Return the address of the first executable statement in the program or specified routine. This isthe first address after the routine's prologue code.
13.7.5. lvallv[al] expr
Return the lvalue of the expression expr. The lvalue of an expression is the value it would haveif it appeared on the left hand side of an assignment statement. Roughly speaking, an lvalue is alocation to which a value can be assigned. This may be an address, a stack offset, or a register.
13.7.6. rvalrv[al] expr
Return the rvalue of the expression expr. The rvalue of an expression is the value it would have ifit appeared on the right hand side of an assignment statement. The type of the expression may beany scalar, pointer, structure, or function type.
13.7.7. setset var=expression
Command Reference
PGI Debugger User's Guide 106
Set variable var to the value of expression. The variable can be any valid identifier accessedproperly for the current scope. For example, given a C variable declared int * i, the followingcommand could be used to assign the value 9999 to it.pgdbg> set *i = 9999
13.7.8. sizeofsiz[eof] name
Return the size, in bytes, of the variable type name. If name refers to a routine, sizeof returnsthe size in bytes of the subprogram.
13.7.9. typetype expr
Return the type of the expression expr. The expression may contain structure reference operators(. , and -> ), dereference (*), and array index ([ ] ) expressions. For example, given the Cdeclarations:int i, iar[10];struct abc {int a; char b[4]; struct abc *c;}val;
the type command provides the following output:pgdbg> type iintpgdbg> type iarint [10]pgdbg> type valstruct abcpgdbg> type val.aint
pgdbg> type val.abc->b[2]char
pgdbg> whatis whatis name
With no arguments, print the declaration for the current routine.
With the argument name, print the declaration for the symbol name.
13.8. ScopeThe following commands deal with program scope. For a discussion of scope meaning andconventions, refer to Scope Rules.
13.8.1. classclas[s] [class]
Without arguments, class returns the current class. With a class argument, enter the scope ofclass class.
Command Reference
PGI Debugger User's Guide 107
13.8.2. classesclassse[s]
Print the C++ class names.
13.8.3. declsdecls [routine | "sourcefile" | {global} ]
Print the declarations of all identifiers defined in the indicated scope. If no scope is given, printthe declarations for the current search scope.
13.8.4. downdown [number]
Enter the scope of the routine down one level or number levels on the call stack.
13.8.5. enteren[ter] [routine | "sourcefile" | global ]
Set the search scope to be the indicated scope, which may be a routine, file or global. Usingenter with no argument is the same as using enter global.
13.8.6. filesfiles
Return the list of known source files used to create the executable file.
13.8.7. globalglob[al]
Return a symbol representing global scope. This command is useful in combination with thescope operator @ to specify symbols with global scope.
13.8.8. namesnames [routine | "sourcefile" | global ]
Print the names of all identifiers defined in the indicated scope. If no scope is specified, use thesearch scope.
13.8.9. scopesco[pe]
Return a symbol for the search scope. The search scope is set to the current routine each timeprogram execution stops. It may also be set using the enter command. The search scope is alwayssearched first for symbols.
Command Reference
PGI Debugger User's Guide 108
13.8.10. upup [number]
Enter the scope of the routine up one or number levels from the current routine on the call stack.
13.8.11. whereiswhereis name
Print all declarations for name.
13.8.12. whichwhich name
Print the full scope qualification of symbol name.
13.9. Register AccessSystem registers can be accessed by name. For details on referring to registers in PGDBG, referto Register Symbols.
13.9.1. fpfp
Return the current value of the frame pointer.
13.9.2. pcpc
Return the current program address.
13.9.3. regsregsregs -info regs -grp=grp1[,grp2...]regs -fmt=fmt1[,fmt2...] regs -mode=scalar|vector
Print the names and values of registers. By default, regs prints the General Purpose registers.Use the –grp option to specify one or more register groups, the –fmt option to specify one ormore display formats, and –mode to specify scalar or vector mode. Use the –info option todisplay the register groups on the current system and the display formats available for each group.All optional arguments with the exception of –info can be used with the others.
13.9.4. retaddrret[addr]
Return the current return address.
Command Reference
PGI Debugger User's Guide 109
13.9.5. spsp
Return the current value of the stack pointer.
13.10. Memory AccessThe following commands display the contents of arbitrary memory locations. For each of thesecommands, the addr argument may be a variable or identifier.
13.10.1. creadcr[ead]addr
Fetch and return an 8-bit signed integer (character) from the specified address.
13.10.2. dreaddr[ead]addr
Fetch and return a 64-bit double from the specified address.
13.10.3. dumpdu[mp] address[, count[,format-string]]
This command dumps the contents of a region of memory. The output is formatted accordingto a descriptor. Starting at the indicated address, values are fetched from memory and displayedaccording to the format descriptor. This process is repeated count times.
Interpretation of the format descriptor is similar to that used by printf. Format specifiers arepreceded by %.
The recognized format descriptors are for decimal, octal, hex, or unsigned: %d, %D, %o, %O, %x, %X, %u, %U
Default size is machine dependent. The size of the item read can be modified by either inserting'h' or 'l' before the format character to indicate half word or long word. For example, if yourmachine’s default size is 32-bit, then %hd represents a 16-bit quantity. Alternatively, a 1, 2, or 4after the format character can be used to specify the number of bytes to read.
Fetch and print a character. %c
Fetch and print a float (lower case) or double (upper case) value using printf f, e, or g format. %f, %F, %e, %E, %g, %G
Fetch and print a null terminated string. %s
Interpret the next object as a pointer to an item specified by the following format characters. Thepointed-to item is fetched and displayed. %p
Command Reference
PGI Debugger User's Guide 110
Pointer to int. Prints the address of the pointer, the value of the pointer, and the contents of thepointed-to address, which is printed using hexadecimal format. %px
Fetch an instruction and disassemble it. %i
Display address about to be dumped. %w, %W
Display nothing while advancing or decrementing the current address by n bytes. %z<n>, %Z<n>, %z<-n>, %Z<-n>
Display nothing while advancing the current address as needed to align modulo n. %a<n>, %A<n>
Display nothing while advancing the current address as needed to align modulo n.
13.10.4. freadfr[ead]addr
Fetch and print a 32-bit float from the specified address.
13.10.5. ireadir[ead] addr
Fetch and print a signed integer from the specified address.
13.10.6. lreadlr[ead] addr
Fetch and print an address from the specified address.
13.10.7. mqdumpmq[dump]
Dump MPI message queue information for the current process. For more information onmqdump, refer to MPI Message Queues.
13.10.8. sreadsr[ead]addr
Fetch and print a short signed integer from the specified address.
13.11. ConversionsThe commands in this section are useful for converting between different kinds of values. Thesecommands accept a variety of arguments, and return a value of a particular kind.
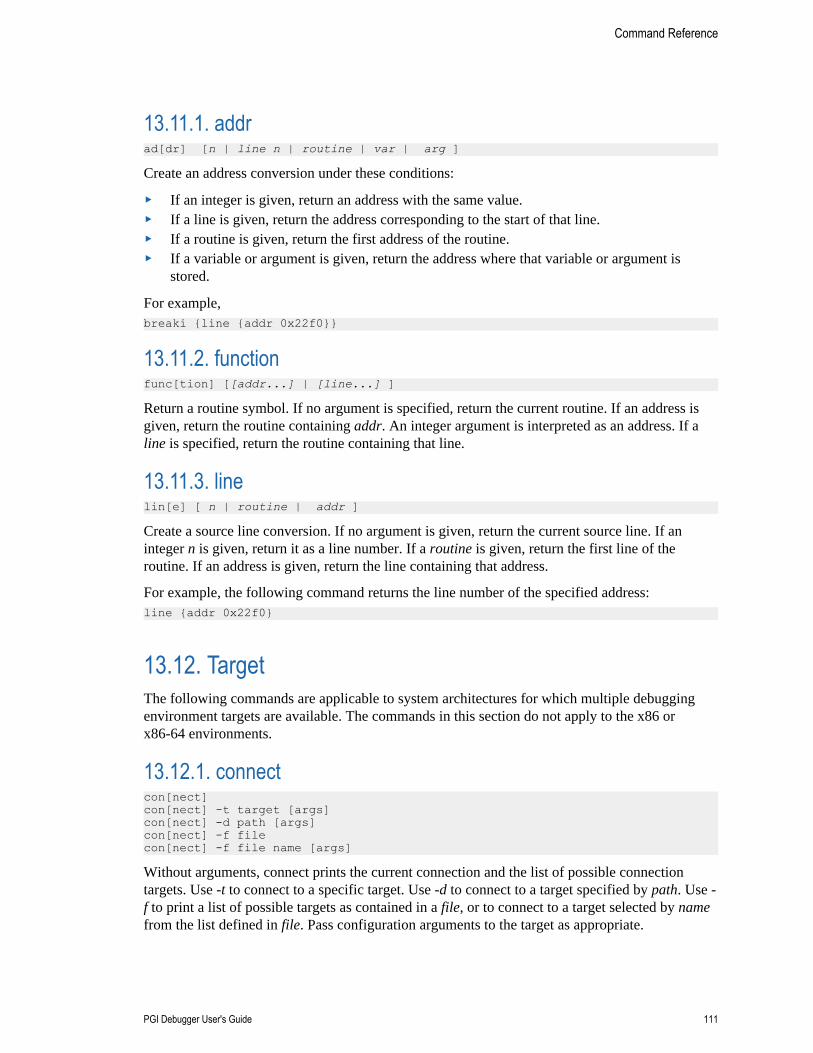
Command Reference
PGI Debugger User's Guide 111
13.11.1. addrad[dr] [n | line n | routine | var | arg ]
Create an address conversion under these conditions:
‣ If an integer is given, return an address with the same value.‣ If a line is given, return the address corresponding to the start of that line.‣ If a routine is given, return the first address of the routine.‣ If a variable or argument is given, return the address where that variable or argument is
stored.
For example,breaki {line {addr 0x22f0}}
13.11.2. functionfunc[tion] [[addr...] | [line...] ]
Return a routine symbol. If no argument is specified, return the current routine. If an address isgiven, return the routine containing addr. An integer argument is interpreted as an address. If aline is specified, return the routine containing that line.
13.11.3. linelin[e] [ n | routine | addr ]
Create a source line conversion. If no argument is given, return the current source line. If aninteger n is given, return it as a line number. If a routine is given, return the first line of theroutine. If an address is given, return the line containing that address.
For example, the following command returns the line number of the specified address:line {addr 0x22f0}
13.12. TargetThe following commands are applicable to system architectures for which multiple debuggingenvironment targets are available. The commands in this section do not apply to the x86 orx86-64 environments.
13.12.1. connectcon[nect]con[nect] -t target [args] con[nect] -d path [args] con[nect] -f file con[nect] -f file name [args]
Without arguments, connect prints the current connection and the list of possible connectiontargets. Use -t to connect to a specific target. Use -d to connect to a target specified by path. Use -f to print a list of possible targets as contained in a file, or to connect to a target selected by namefrom the list defined in file. Pass configuration arguments to the target as appropriate.
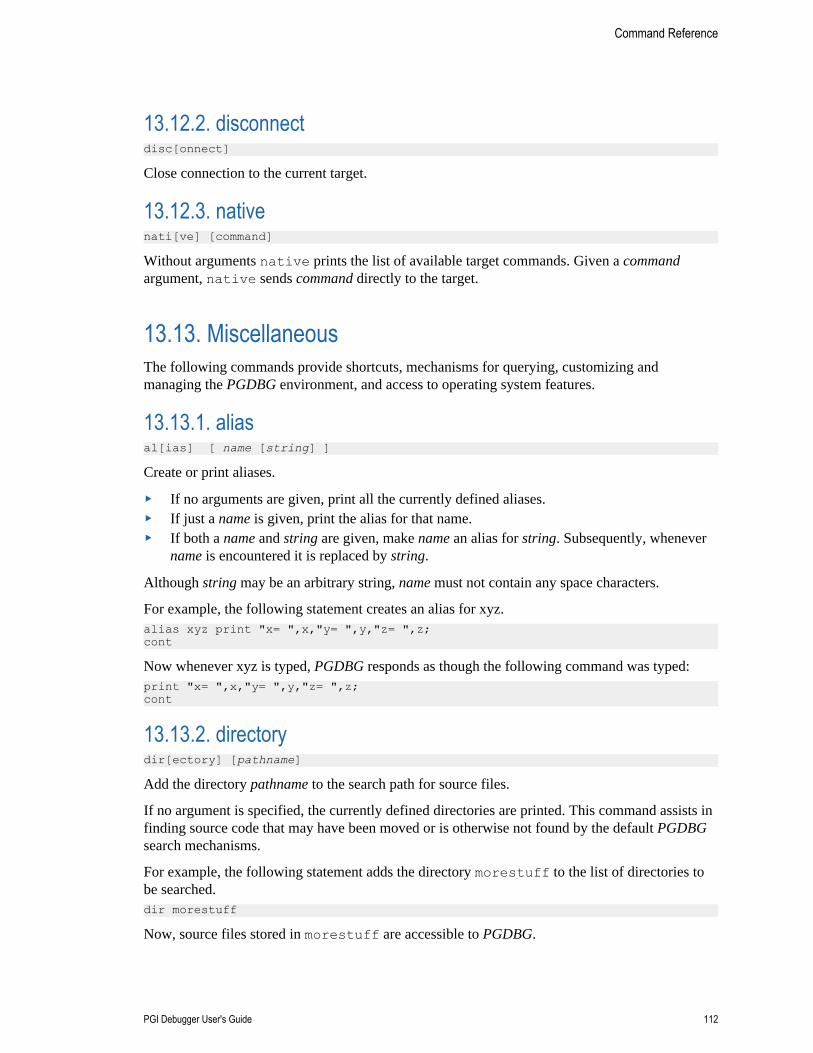
Command Reference
PGI Debugger User's Guide 112
13.12.2. disconnectdisc[onnect]
Close connection to the current target.
13.12.3. nativenati[ve] [command]
Without arguments native prints the list of available target commands. Given a commandargument, native sends command directly to the target.
13.13. MiscellaneousThe following commands provide shortcuts, mechanisms for querying, customizing andmanaging the PGDBG environment, and access to operating system features.
13.13.1. aliasal[ias] [ name [string] ]
Create or print aliases.
‣ If no arguments are given, print all the currently defined aliases.‣ If just a name is given, print the alias for that name.‣ If both a name and string are given, make name an alias for string. Subsequently, whenever
name is encountered it is replaced by string.
Although string may be an arbitrary string, name must not contain any space characters.
For example, the following statement creates an alias for xyz.alias xyz print "x= ",x,"y= ",y,"z= ",z;cont
Now whenever xyz is typed, PGDBG responds as though the following command was typed:print "x= ",x,"y= ",y,"z= ",z;cont
13.13.2. directorydir[ectory] [pathname]
Add the directory pathname to the search path for source files.
If no argument is specified, the currently defined directories are printed. This command assists infinding source code that may have been moved or is otherwise not found by the default PGDBGsearch mechanisms.
For example, the following statement adds the directory morestuff to the list of directories tobe searched.dir morestuff
Now, source files stored in morestuff are accessible to PGDBG.
Command Reference
PGI Debugger User's Guide 113
If the first character in pathname is ~, then $HOME replaces that character.
13.13.3. helphelp [command]
If no argument is specified, print a brief summary of all the commands. If a command isspecified, print more detailed information about the use of that command.
13.13.4. historyhistory [num]
List the most recently executed commands. With the num argument, resize the history list to holdnum commands.
History allows several characters for command substitution:
!! [modifier] Execute the previous command.
! num [modifier] Execute command number num.
!-num [modifier] Execute the command that is num commands from the most current command
!string [modifier] Execute the most recent command starting with string.
!?string? [modifier] Execute the most recent command containing string.
^ Command substitution. For example, ^old^new^<modifier> is equivalent to !:s/old/new/.
There are two possible history modifiers. To substitute the value new for the value old use::s/old/new/
To print the command without executing it use::p
Use the pgienv history command to toggle whether or not the history record number isdisplayed. The default value is on.
13.13.5. languagelang[uage]
Print the name of the language of the current file.
13.13.6. loglog filename
Keep a log of all commands entered by the user and store it in the named file. This command maybe used in conjunction with the script command to record and replay debug sessions.
13.13.7. noprintnop[rint] exp
Evaluate the expression but do not print the result.
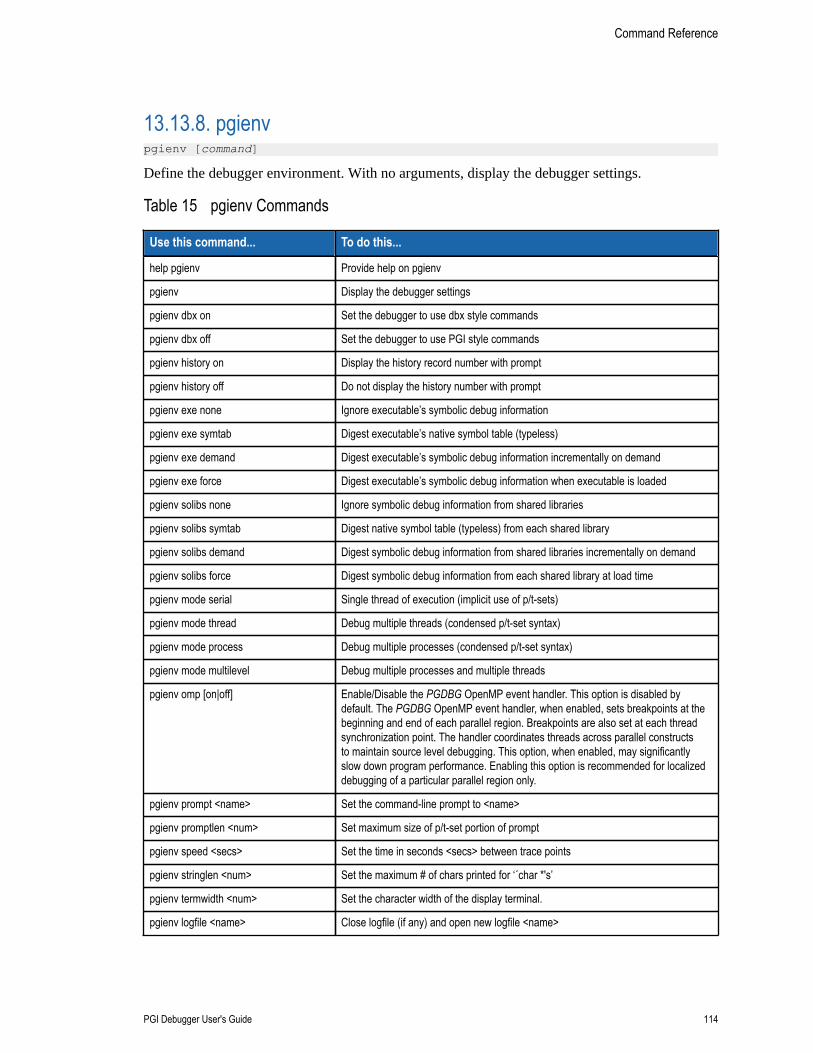
Command Reference
PGI Debugger User's Guide 114
13.13.8. pgienvpgienv [command]
Define the debugger environment. With no arguments, display the debugger settings.
Table 15 pgienv Commands
Use this command... To do this...
help pgienv Provide help on pgienv
pgienv Display the debugger settings
pgienv dbx on Set the debugger to use dbx style commands
pgienv dbx off Set the debugger to use PGI style commands
pgienv history on Display the history record number with prompt
pgienv history off Do not display the history number with prompt
pgienv exe none Ignore executable’s symbolic debug information
pgienv exe symtab Digest executable’s native symbol table (typeless)
pgienv exe demand Digest executable’s symbolic debug information incrementally on demand
pgienv exe force Digest executable’s symbolic debug information when executable is loaded
pgienv solibs none Ignore symbolic debug information from shared libraries
pgienv solibs symtab Digest native symbol table (typeless) from each shared library
pgienv solibs demand Digest symbolic debug information from shared libraries incrementally on demand
pgienv solibs force Digest symbolic debug information from each shared library at load time
pgienv mode serial Single thread of execution (implicit use of p/t-sets)
pgienv mode thread Debug multiple threads (condensed p/t-set syntax)
pgienv mode process Debug multiple processes (condensed p/t-set syntax)
pgienv mode multilevel Debug multiple processes and multiple threads
pgienv omp [on|off] Enable/Disable the PGDBG OpenMP event handler. This option is disabled bydefault. The PGDBG OpenMP event handler, when enabled, sets breakpoints at thebeginning and end of each parallel region. Breakpoints are also set at each threadsynchronization point. The handler coordinates threads across parallel constructsto maintain source level debugging. This option, when enabled, may significantlyslow down program performance. Enabling this option is recommended for localizeddebugging of a particular parallel region only.
pgienv prompt <name> Set the command-line prompt to <name>
pgienv promptlen <num> Set maximum size of p/t-set portion of prompt
pgienv speed <secs> Set the time in seconds <secs> between trace points
pgienv stringlen <num> Set the maximum � of chars printed for ‘´char *'s’
pgienv termwidth <num> Set the character width of the display terminal.
pgienv logfile <name> Close logfile (if any) and open new logfile <name>
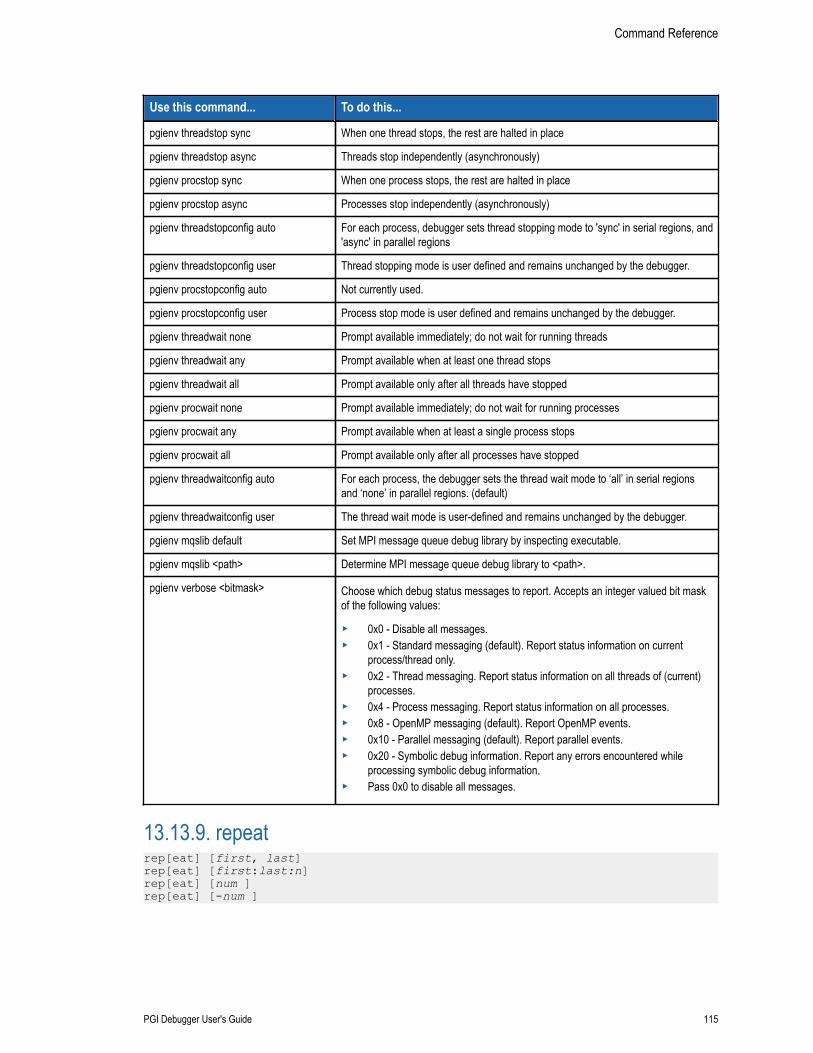
Command Reference
PGI Debugger User's Guide 115
Use this command... To do this...
pgienv threadstop sync When one thread stops, the rest are halted in place
pgienv threadstop async Threads stop independently (asynchronously)
pgienv procstop sync When one process stops, the rest are halted in place
pgienv procstop async Processes stop independently (asynchronously)
pgienv threadstopconfig auto For each process, debugger sets thread stopping mode to 'sync' in serial regions, and'async' in parallel regions
pgienv threadstopconfig user Thread stopping mode is user defined and remains unchanged by the debugger.
pgienv procstopconfig auto Not currently used.
pgienv procstopconfig user Process stop mode is user defined and remains unchanged by the debugger.
pgienv threadwait none Prompt available immediately; do not wait for running threads
pgienv threadwait any Prompt available when at least one thread stops
pgienv threadwait all Prompt available only after all threads have stopped
pgienv procwait none Prompt available immediately; do not wait for running processes
pgienv procwait any Prompt available when at least a single process stops
pgienv procwait all Prompt available only after all processes have stopped
pgienv threadwaitconfig auto For each process, the debugger sets the thread wait mode to ‘all’ in serial regionsand ‘none’ in parallel regions. (default)
pgienv threadwaitconfig user The thread wait mode is user-defined and remains unchanged by the debugger.
pgienv mqslib default Set MPI message queue debug library by inspecting executable.
pgienv mqslib <path> Determine MPI message queue debug library to <path>.
pgienv verbose <bitmask> Choose which debug status messages to report. Accepts an integer valued bit maskof the following values:
‣ 0x0 - Disable all messages.‣ 0x1 - Standard messaging (default). Report status information on current
process/thread only.‣ 0x2 - Thread messaging. Report status information on all threads of (current)
processes.‣ 0x4 - Process messaging. Report status information on all processes.‣ 0x8 - OpenMP messaging (default). Report OpenMP events.‣ 0x10 - Parallel messaging (default). Report parallel events.‣ 0x20 - Symbolic debug information. Report any errors encountered while
processing symbolic debug information.‣ Pass 0x0 to disable all messages.
13.13.9. repeatrep[eat] [first, last]rep[eat] [first:last:n]rep[eat] [num ]rep[eat] [-num ]
Command Reference
PGI Debugger User's Guide 116
Repeat the execution of one or more previous history list commands. Use the num argument to re-execute the last num commands. With the first and last arguments, re-execute commands numberfirst to last (optionally n times).
13.13.10. scriptscr[ipt] filename
Open the indicated file and execute the contents as though they were entered as commands. Use ~before the filename in place of the environment variable $HOME.
13.13.11. setenvsetenv name | name value
Print the value of the environment variable name. With a specified value, set name to value.
13.13.12. shellshell [arg0, arg1,... argn]
Fork a shell and give it the indicated arguments. The default shell type is sh or defined by$SHELL. If no arguments are specified, an interactive shell is invoked, and executes until a Ctrl+D is entered.
13.13.13. sleepsle[ep] [time]
Pause for one second or time seconds.
13.13.14. sourcesou[rce] filename
Open the indicated file and execute the contents as though they were entered as commands. Use ~before the filename in place of the environment variable $HOME.
13.13.15. unaliasunal[ias] name
Remove the alias definition for name, if one exists.
13.13.16. useuse [dir]
Print the current list of directories or add dir to the list of directories to search. The character ~ orenvironment variable $HOME can be used interchangeably.
PGI Debugger User's Guide 117
Chapter 14.CONTACT INFORMATION
You can contact PGI at:
20400 NW Amberwood Drive Suite 100Beaverton, OR 97006
Or electronically using any of the following means:
Fax: +1-503-682-2637Sales: [email protected]: http://www.pgroup.com
The PGI User Forum is monitored by members of the PGI engineering and support teams aswell as other PGI customers. The forum newsgroups may contain answers to commonly askedquestions. Log in to the PGI website to access the forum:
http://www.pgroup.com/userforum/index.php
Many questions and problems can be resolved by following instructions and the informationavailable at our frequently asked questions (FAQ) site:
http://www.pgroup.com/support/faq.htm
Submit technical support requests through the online form at:
https://www.pgroup.com/support/support_request.php
PGI documentation is available at http://www.pgroup.com/resources/docs.htm.
Notice
ALL NVIDIA DESIGN SPECIFICATIONS, REFERENCE BOARDS, FILES, DRAWINGS,DIAGNOSTICS, LISTS, AND OTHER DOCUMENTS (TOGETHER AND SEPARATELY,"MATERIALS") ARE BEING PROVIDED "AS IS." NVIDIA MAKES NO WARRANTIES,EXPRESSED, IMPLIED, STATUTORY, OR OTHERWISE WITH RESPECT TO THE MATERIALS,AND EXPRESSLY DISCLAIMS ALL IMPLIED WARRANTIES OF NONINFRINGEMENT,MERCHANTABILITY, AND FITNESS FOR A PARTICULAR PURPOSE.
Information furnished is believed to be accurate and reliable. However, NVIDIA Corporation assumesno responsibility for the consequences of use of such information or for any infringement of patentsor other rights of third parties that may result from its use. No license is granted by implication ofotherwise under any patent rights of NVIDIA Corporation. Specifications mentioned in this publicationare subject to change without notice. This publication supersedes and replaces all other informationpreviously supplied. NVIDIA Corporation products are not authorized as critical components in lifesupport devices or systems without express written approval of NVIDIA Corporation.
Trademarks
PGI Workstation, PGI Server, PGI Accelerator, PGF95, PGF90, PGFORTRAN, and PGI UnifiedBinary are trademarks; and PGI, PGHPF, PGF77, PGCC, PGC++, PGI Visual Fortran, PVF, PGI CDK,Cluster Development Kit, PGPROF, PGDBG, and The Portland Group are registered trademarks ofNVIDIA Corporation in the U.S. and other countries. Other company and product names may betrademarks of the respective companies with which they are associated.
Copyright© 2013–2016 NVIDIA Corporation. All rights reserved.