Embed Size (px)
Citation preview
Supplement to Environmental Assessment for the Bull Run Hydroelectric Project FERC Project No. 477
Numerical Modeling of Sediment Transport
in the Sandy River, OR Following Removal of Marmot Dam
Technical Report
Prepared by Stillwater Sciences
Berkeley, California
Prepared for Portland General Electric Company
Portland, Oregon
March 2000
Numerical Modeling of Sediment Transport in the TECHNICAL REPORT Sandy River, OR following Removal of Marmot
March 2000 Stillwater Sciences
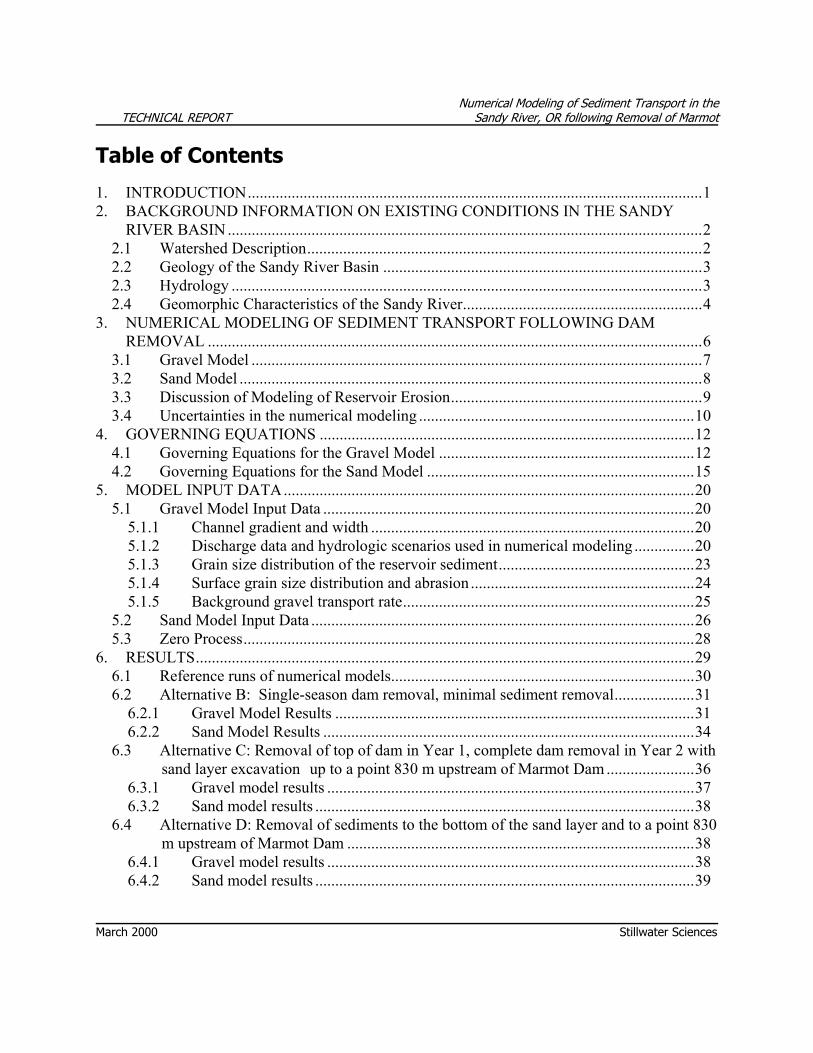
Table of Contents 1. INTRODUCTION..................................................................................................................1 2. BACKGROUND INFORMATION ON EXISTING CONDITIONS IN THE SANDY
RIVER BASIN .......................................................................................................................2 2.1 Watershed Description...................................................................................................2 2.2 Geology of the Sandy River Basin ................................................................................3 2.3 Hydrology ......................................................................................................................3 2.4 Geomorphic Characteristics of the Sandy River............................................................4
3. NUMERICAL MODELING OF SEDIMENT TRANSPORT FOLLOWING DAM REMOVAL ............................................................................................................................6
3.1 Gravel Model .................................................................................................................7 3.2 Sand Model ....................................................................................................................8 3.3 Discussion of Modeling of Reservoir Erosion...............................................................9 3.4 Uncertainties in the numerical modeling .....................................................................10
4. GOVERNING EQUATIONS ..............................................................................................12 4.1 Governing Equations for the Gravel Model ................................................................12 4.2 Governing Equations for the Sand Model ...................................................................15
5. MODEL INPUT DATA.......................................................................................................20 5.1 Gravel Model Input Data .............................................................................................20
5.1.1 Channel gradient and width .................................................................................20 5.1.2 Discharge data and hydrologic scenarios used in numerical modeling ...............20 5.1.3 Grain size distribution of the reservoir sediment.................................................23 5.1.4 Surface grain size distribution and abrasion ........................................................24 5.1.5 Background gravel transport rate.........................................................................25
5.2 Sand Model Input Data ................................................................................................26 5.3 Zero Process.................................................................................................................28
6. RESULTS.............................................................................................................................29 6.1 Reference runs of numerical models............................................................................30 6.2 Alternative B: Single-season dam removal, minimal sediment removal....................31
6.2.1 Gravel Model Results ..........................................................................................31 6.2.2 Sand Model Results .............................................................................................34
6.3 Alternative C: Removal of top of dam in Year 1, complete dam removal in Year 2 with sand layer excavation up to a point 830 m upstream of Marmot Dam ......................36
6.3.1 Gravel model results ............................................................................................37 6.3.2 Sand model results ...............................................................................................38
6.4 Alternative D: Removal of sediments to the bottom of the sand layer and to a point 830 m upstream of Marmot Dam .......................................................................................38
6.4.1 Gravel model results ............................................................................................38 6.4.2 Sand model results ...............................................................................................39

Numerical Modeling of Sediment Transport in the TECHNICAL REPORT Sandy River, OR following Removal of Marmot
March 2000 Stillwater Sciences
7. DISCUSSION......................................................................................................................39 Acknowledgments........................................................................................................................41 8. REFERENCES.....................................................................................................................42 List of Symbols ............................................................................................................................46 ATTACHMENT A ......................................................................................................................48
Numerical Modeling of Sediment Transport in the TECHNICAL REPORT Sandy River, OR following Removal of Marmot
March 2000 Stillwater Sciences
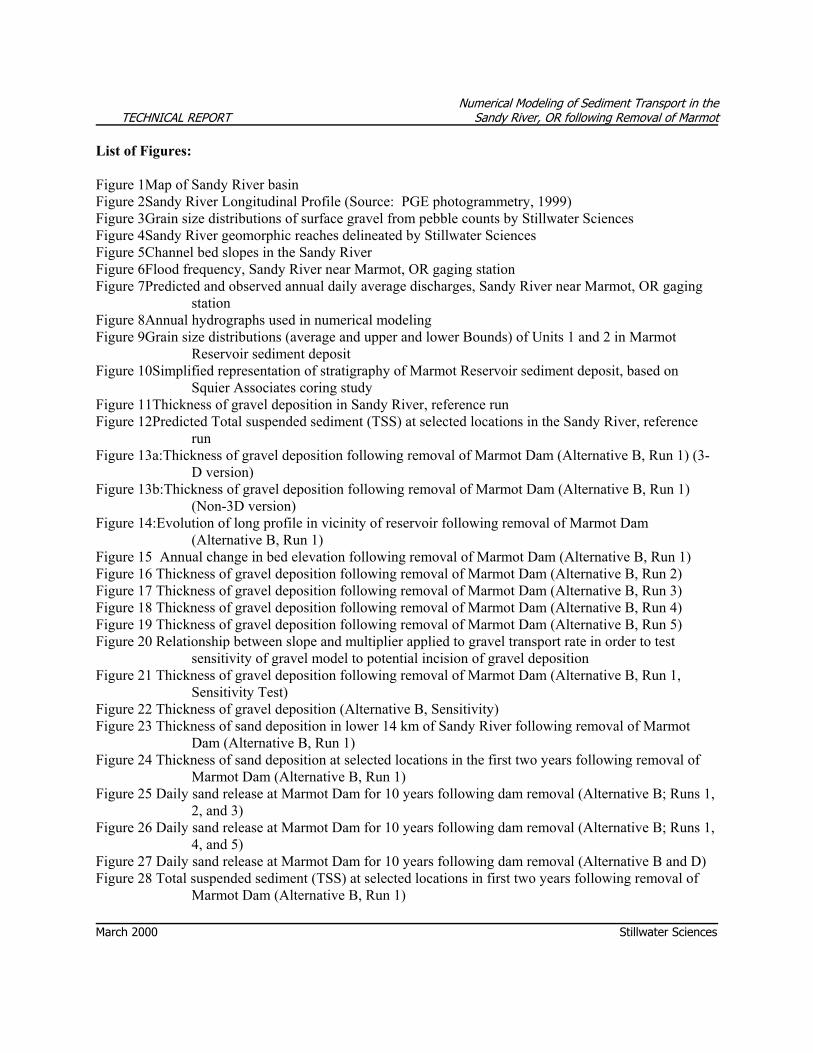
List of Figures: Figure 1Map of Sandy River basin Figure 2Sandy River Longitudinal Profile (Source: PGE photogrammetry, 1999) Figure 3Grain size distributions of surface gravel from pebble counts by Stillwater Sciences Figure 4Sandy River geomorphic reaches delineated by Stillwater Sciences Figure 5Channel bed slopes in the Sandy River Figure 6Flood frequency, Sandy River near Marmot, OR gaging station Figure 7Predicted and observed annual daily average discharges, Sandy River near Marmot, OR gaging
station Figure 8Annual hydrographs used in numerical modeling Figure 9Grain size distributions (average and upper and lower Bounds) of Units 1 and 2 in Marmot
Reservoir sediment deposit Figure 10Simplified representation of stratigraphy of Marmot Reservoir sediment deposit, based on
Squier Associates coring study Figure 11Thickness of gravel deposition in Sandy River, reference run Figure 12Predicted Total suspended sediment (TSS) at selected locations in the Sandy River, reference
run Figure 13a:Thickness of gravel deposition following removal of Marmot Dam (Alternative B, Run 1) (3-
D version) Figure 13b:Thickness of gravel deposition following removal of Marmot Dam (Alternative B, Run 1)
(Non-3D version) Figure 14:Evolution of long profile in vicinity of reservoir following removal of Marmot Dam
(Alternative B, Run 1) Figure 15 Annual change in bed elevation following removal of Marmot Dam (Alternative B, Run 1) Figure 16 Thickness of gravel deposition following removal of Marmot Dam (Alternative B, Run 2) Figure 17 Thickness of gravel deposition following removal of Marmot Dam (Alternative B, Run 3) Figure 18 Thickness of gravel deposition following removal of Marmot Dam (Alternative B, Run 4) Figure 19 Thickness of gravel deposition following removal of Marmot Dam (Alternative B, Run 5) Figure 20 Relationship between slope and multiplier applied to gravel transport rate in order to test
sensitivity of gravel model to potential incision of gravel deposition Figure 21 Thickness of gravel deposition following removal of Marmot Dam (Alternative B, Run 1,
Sensitivity Test) Figure 22 Thickness of gravel deposition (Alternative B, Sensitivity) Figure 23 Thickness of sand deposition in lower 14 km of Sandy River following removal of Marmot
Dam (Alternative B, Run 1) Figure 24 Thickness of sand deposition at selected locations in the first two years following removal of
Marmot Dam (Alternative B, Run 1) Figure 25 Daily sand release at Marmot Dam for 10 years following dam removal (Alternative B; Runs 1,
2, and 3) Figure 26 Daily sand release at Marmot Dam for 10 years following dam removal (Alternative B; Runs 1,
4, and 5) Figure 27 Daily sand release at Marmot Dam for 10 years following dam removal (Alternative B and D) Figure 28 Total suspended sediment (TSS) at selected locations in first two years following removal of
Marmot Dam (Alternative B, Run 1)
Numerical Modeling of Sediment Transport in the TECHNICAL REPORT Sandy River, OR following Removal of Marmot
March 2000 Stillwater Sciences
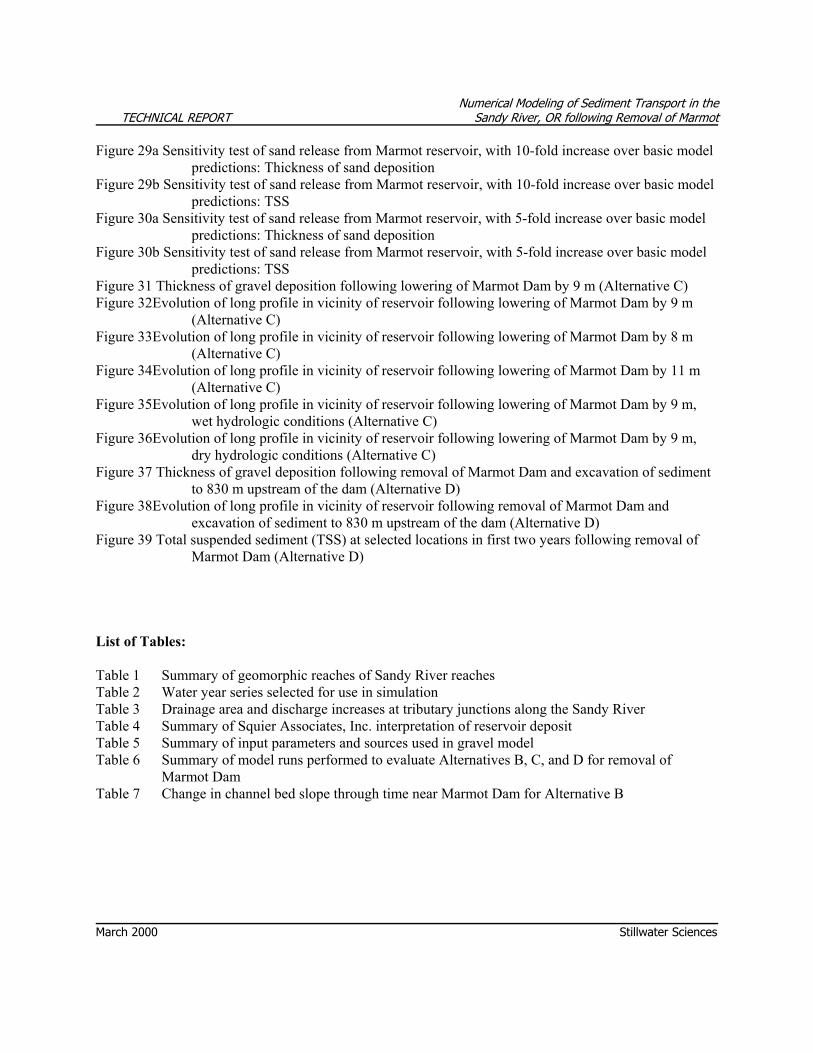
Figure 29a Sensitivity test of sand release from Marmot reservoir, with 10-fold increase over basic model predictions: Thickness of sand deposition
Figure 29b Sensitivity test of sand release from Marmot reservoir, with 10-fold increase over basic model predictions: TSS
Figure 30a Sensitivity test of sand release from Marmot reservoir, with 5-fold increase over basic model predictions: Thickness of sand deposition
Figure 30b Sensitivity test of sand release from Marmot reservoir, with 5-fold increase over basic model predictions: TSS
Figure 31 Thickness of gravel deposition following lowering of Marmot Dam by 9 m (Alternative C) Figure 32Evolution of long profile in vicinity of reservoir following lowering of Marmot Dam by 9 m
(Alternative C) Figure 33Evolution of long profile in vicinity of reservoir following lowering of Marmot Dam by 8 m
(Alternative C) Figure 34Evolution of long profile in vicinity of reservoir following lowering of Marmot Dam by 11 m
(Alternative C) Figure 35Evolution of long profile in vicinity of reservoir following lowering of Marmot Dam by 9 m,
wet hydrologic conditions (Alternative C) Figure 36Evolution of long profile in vicinity of reservoir following lowering of Marmot Dam by 9 m,
dry hydrologic conditions (Alternative C) Figure 37 Thickness of gravel deposition following removal of Marmot Dam and excavation of sediment
to 830 m upstream of the dam (Alternative D) Figure 38Evolution of long profile in vicinity of reservoir following removal of Marmot Dam and
excavation of sediment to 830 m upstream of the dam (Alternative D) Figure 39 Total suspended sediment (TSS) at selected locations in first two years following removal of
Marmot Dam (Alternative D) List of Tables: Table 1 Summary of geomorphic reaches of Sandy River reaches Table 2 Water year series selected for use in simulation Table 3 Drainage area and discharge increases at tributary junctions along the Sandy River Table 4 Summary of Squier Associates, Inc. interpretation of reservoir deposit Table 5 Summary of input parameters and sources used in gravel model Table 6 Summary of model runs performed to evaluate Alternatives B, C, and D for removal of
Marmot Dam Table 7 Change in channel bed slope through time near Marmot Dam for Alternative B

Numerical Modeling of Sediment Transport in the TECHNICAL REPORT Sandy River, OR following Removal of Marmot
Dam
March 2000 Stillwater Sciences F:\PGE\YCMODELING\REPORT\CURRENT\ABSTRCT2.WPD i
EXECUTIVE SUMMARY Marmot Dam, a hydroelectric facility on the Sandy River, OR, is scheduled to be removed by its owner, Portland General Electric. The dam is located on the Sandy River at River Mile (RM) 30 (Rkm 48), has an upstream drainage area of about 680 km2, and is 14-m high. The dam’s impoundment is currently filled to near the dam’s crest with approximately 750,000 m3 of fine and coarse sediment, of which 490,000 m3 is primarily gravel and 260,000 m3 is primarily sand (Squier Associates 2000). The Sandy River originates from Mt. Hood in the Cascade Range of northwestern Oregon and drains into the lower Columbia River. Mt. Hood glaciers, the ongoing influence of past laharic events, and the basin’s underlying lithology result in naturally high sediment loading in the Sandy River. Stillwater Sciences developed one-dimensional numerical models of coarse and fine sediment transport to quantify the routing of sediment from behind Marmot Dam downstream through the Sandy River. The model results presented here examine three dam removal alternatives, in which varying amounts of the sediment stored behind Marmot Dam would be released downstream: (1) Alternative B, which entails removal of Marmot Dam in one season, with removal of only a minimal amount of sediment as required for construction activities, (2) Alternative C, in which the dam would be lowered in Year 1 and completely removed in Year 2, with sediment excavation up to a point 830 m upstream of Marmot Dam during Year 2, and (3) Alternative D, which entails removal of the dam in one season and concurrent removal of accumulated sediments from the dam to a point about 830 m upstream (this would allow excavation of most of the fine sediment in the reservoir and of the majority of the overall amount of sediment in the reservoir). A fourth alternative, Alternative A, would entail excavation of nearly all sediment in the reservoir before dam removal and was not modeled. We also conducted model runs in which hydrologic conditions, assumed grain size distributions of reservoir sediment, and rates of sediment release from the reservoir were varied to test the sensitivity of model results to these factors. The gravel (coarse sediment) transport model is based on Parker’s surface-based bedload equation (Parker et al. 1982, Parker 1990); the sand transport model is based on Brownlie’s bed material equation (Brownlie 1981). Key input data for the models include channel gradient, channel width, grain size distribution of the sediment stored behind Marmot Dam, and water discharge. Results of modeling of Alternative B, in which nearly all sediment stored behind Marmot Dam would be released downstream, indicate that in the first year following removal, coarse sediment would quickly form a debris fan immediately downstream of the dam, with small amounts of deposition predicted further downstream. In subsequent years, additional sediment would move out of the reservoir and downstream from the debris fan, resulting in a gradual increase in deposition thickness of coarse sediment about 2–4 km downstream of the dam, reaching a maximum of about 1 m on a reach-averaged basis. Coarse sediment is predicted to travel quickly through most of the Sandy River gorge, which has a steep gradient and high confinement, with aggradation increasing downstream of the gorge (9–13 km downstream of the dam, where the channel widens and decreases in gradient) from Years 1 through 10 following dam removal, where aggradation is predicted to gradually build to a maximum predicted thickness of about 1.5–2 m. Further downstream, the model predicts small amounts of aggradation (<0.5 m), although this aggradation is similar in magnitude to aggradation predicted in a reference run of the model. In most reaches and in most years that were modeled, particularly with increasing time after dam removal, the
Numerical Modeling of Sediment Transport in the TECHNICAL REPORT Sandy River, OR following Removal of Marmot
Dam
March 2000 Stillwater Sciences F:\PGE\YCMODELING\REPORT\CURRENT\ABSTRCT2.WPD ii
predicted rate of change in bed elevation is low (<0.5 m/yr); such changes may be indistinguishable from natural scour and fill processes. Under Alternatives C and D, overall temporal and spatial patterns of downstream sediment deposition would be similar to Alternative B, with smaller predicted deposition thicknesses. On a reach-averaged and time-averaged basis, patterns of downstream thickness of gravel deposition show limited sensitivity to variations in hydrologic conditions and assumed grain size distribution of the reservoir deposit. All model runs indicate that the coarse sediment stored behind Marmot Dam would move downstream by both translation and dispersion. The sand transport model indicates that, under all alternatives, sand aggradation is most likely to occur in the lower 10 km of the Sandy River, which has a very low gradient. No sand aggradation is predicted further upstream. The model predicts deposition thicknesses of up to about 0.4 m, with the greatest aggradation expected to occur in the first year following dam removal. Aggradation is predicted to occur primarily in the lower 3 km of the river, which roughly corresponds to the current location of the gravel/sand transition area in the Sandy River. Deposition thickness could be greater than predicted because of the backwater effect of the Columbia River, which was not modeled. Sand aggradation could be lower than model predictions in the lower Sandy River, however, if deposition occurs in upstream reaches, which is not predicted in basic model runs but which is likely to occur as local deposition in wider reaches, as transient deposition between high-flow periods, and as infiltration of sand into the channel bed interstices. Post-dam removal total suspended sediment (TSS) concentrations are not predicted to increase substantially under any of the removal alternatives. The modeling predicts that, downstream of Marmot Dam, peak TSS of about 500 ppm would occur in the first winter following dam removal under Alternative B, and that sand transport out of the reservoir would likely continue for approximately a decade following dam removal. TSS levels associated with dam removal are predicted to be relatively low because the fine sediment in the reservoir deposit is armored by a coarser surface layer and would therefore be released gradually, rather than as one large pulse. Overall, increases in suspended sediment concentrations following dam removal under Alternatives C and D are expected to be lower in magnitude and shorter in duration than under Alternative B. There is considerable uncertainty in the pattern of sand release from the reservoir, however, and sensitivity tests evaluating accelerated rates of sand release suggest that the magnitude of increases in TSS and sand aggradation could be greater than for basic model runs, with deposition thickness potentially reaching nearly 1 m in the lower Sandy River and TSS concentrations reaching a peak of 2,000 to 4,000 ppm in the winter following dam removal. The model results are most applicable on a reach-scale and time-averaged basis. The models do not account for certain depositional processes, such as infiltration of fine sediment into the interstices of the channel bed, bar formation, channel migration, sand transport out of the reservoir during low flows, and the production of sand and silt from gravel abrasion (i.e., suspended load estimates do not include products of gravel abrasion). The models are one-dimensional, providing predictions of sediment deposition thicknesses that are averaged over the width of the channel cross section and that represent deposition over the existing channel bed. Modeled deposition thicknesses do not account for local variations in shear stress caused by features such as deep pools, bedrock outcrops, or large boulders, and the amount of sediment actually deposited may be substantially higher or lower than predicted by the model in localized areas of the channel. Modeling results are particularly well-suited for comparing

Numerical Modeling of Sediment Transport in the TECHNICAL REPORT Sandy River, OR following Removal of Marmot
Dam
March 2000 Stillwater Sciences F:\PGE\YCMODELING\REPORT\CURRENT\ABSTRCT2.WPD iii
impacts expected under the different alternatives. Key areas of uncertainty in this modeling effort include the following: (1) reservoir erosion processes and sediment transport out of the reservoir area (one-dimensional modeling does not capture processes such as channel incision in the reservoir reach and assumes laterally uniform erosion); (2) effects of coarse bed materials on sediment transport (particularly sand transport, as there are no equations specifically designed for sand transport over a coarse bed); (2) the separation of sand and gravel components in the modeling of sediment transport, rather than modeling of a mixed sand/gravel mixture (sand and gravel transport are treated separately, although they do likely affect each other); (3) simplifications in channel geometry used in the model (e.g., a rectangular channel is assumed, and widths do not vary with stage); (4) rough assumptions used for several input parameters (e.g., background sediment transport rates in the Sandy River); and (5) uncertainties surrounding sediment transport mechanics. This is a pioneering modeling study using state-of-the art methods to route sand and gravel through the Sandy River following a simulated dam removal. Despite the uncertainties, the model is unique in its ability to provide predictions of sediment transport and deposition over large temporal and spatial scales, to allow comparison of various dam-removal alternatives, and to provide a basis for evaluating the potential downstream impacts of sediment release under these alternatives. Although the models upon which this effort is based (e.g., Cui et al. 2000, Cui and Parker 2000) have been tested in flumes and in the field, the accuracy of the model developed for dam removal in the Sandy River has not been verified, and model results should be interpreted accordingly. We have used professional judgement and field observations of the Sandy River to interpret model results in terms of expected geomorphic effects in the Sandy River (for example, discussing how predicted reach-averaged deposition patterns may be manifested in the river) and potential impacts on anadromous salmonid habitats, as presented in Stillwater Sciences (2000). Data collected following removal of Marmot Dam will permit testing of the accuracy of this modeling effort.
Numerical Modeling of Sediment Transport in the TECHNICAL REPORT Sandy River, OR following Removal of Marmot
March 2000 Stillwater Sciences Page 1
1. INTRODUCTION Portland General Electric (PGE), the holder of the Federal Energy Regulatory Commission (FERC) license for the Bull Run Hydroelectric Project, is planning to decommission the Bull Run Project. This will entail removal of Marmot Dam, on the Sandy River, Oregon and Little Sandy Dam (on the Little Sandy River), as well as decommissioning of associated flumes and canals, Roslyn Lake, and the Bull Run powerhouse. Marmot Dam is located on the Sandy River at River Mile (RM) 30 (Rkm 48), has an upstream drainage area of about 680 km2, and diverts water to the Bull Run powerhouse. This dam was originally completed in 1913, and the original wood crib, rock-filled structure was replaced in 1989 by a 14-m high, 104-m wide concrete dam. Marmot Dam is equipped with a fish ladder for upstream passage and a juvenile bypass facility for downstream passage. Approximately 750,000 m3 of sediment are stored behind Marmot Dam, of which 490,000 m3 is primarily gravel/pebble and 260,000 m3 is primarily sand (Squier Associates 2000). The Sandy River originates from Mt. Hood and drains into the lower Columbia River. The Sandy River basin is located about 48 km east of Portland, Oregon on the western slopes of the Cascade Range. Stillwater Sciences has evaluated the geomorphic effects of removing Marmot and Little Sandy Dams and associated impacts on anadromous salmonid habitats and populations. A central component of this assessment was numerical modeling to estimate sediment transport and deposition dynamics in the Sandy River downstream of Marmot Dam for various removal alternatives. This report describes the methods and results of the numerical models of sediment transport in the Sandy River. Brief background information on the lithologic, hydrologic, and geomorphic setting of the Sandy River basin is also provided. Stillwater Sciences (2000) includes interpretation of model results in terms of geomorphic and biological effects on the Sandy River, including discussion of effects of predicted sediment transport patterns on channel morphology, spawning and rearing habitats, and fish migration. Four alternative methods have been developed for removal of Marmot Dam, each of which differs in the amount of sediment accumulated behind the dam that would be released downstream. Stillwater Sciences= analysis included numerical modeling for Alternatives B, C, and D. The alternatives are as follows:
• Alternative A - Remove all sediments to a point 1,700 m upstream of Marmot Dam. This alternative entails excavation of approximately 690,000 m3 of sediment and concurrent removal of the dam in one season. No numerical modeling of sediment release under Alternative A was performed because this alternative calls for nearly all sediment to be removed prior to dam removal; therefore, very little reservoir sediment would be released downstream under this alternative.
• Alternative B - Single season dam removal - minimal sediment removal. This
alternative calls for removal of Marmot Dam and associated facilities in one season, with removal of sediments only as required for construction activities. Approximately 750,000 m3 of reservoir sediments would therefore be released downstream following
Numerical Modeling of Sediment Transport in the TECHNICAL REPORT Sandy River, OR following Removal of Marmot
March 2000 Stillwater Sciences Page 2
removal of a cofferdam built to facilitate construction work (the actual amount released downstream may be somewhat smaller because some sediment would be excavated to facilitate construction work).
• Alternative C - Removal of top of dam in Year 1, complete dam removal in Year 2
with sand layer excavation. This alternative entails removal of Marmot Dam over a 2-year period, with excavation of sand from the reservoir deposit during the second year. In the first year, the top part of the dam would be removed. In the second year, sediment would be excavated to the bottom of the sand layer and the rest of the dam will be removed. The amount of sediment that would be transported downstream under this option is unknown, as it would depend in part on the flows occurring in the first winter following removal of the top of the dam and before the bottom was removed.
• Alternative D - Remove sediments to the bottom of the sand layer and to a point 830
m upstream of Marmot Dam. This alternative entails removal of the dam, canal, and fish ladder in one season and concurrent removal of accumulated sediments from the back of the dam to a point about 830 m upstream. Under Alternative D, approximately 75% of the reservoir sediment would be excavated (about 560,000 m3), including most of the fine sediment. The remaining 25% of reservoir sediment (about 190,000 m3), nearly all of which is believed to consist of coarse material, would be available for downstream fluvial transport.
Little Sandy Dam, a 5-m high concrete dam completed in 1912 on the Little Sandy River, will also be removed. Because of the small amount of sediment stored behind this dam, no numerical modeling was performed to assess dam removal effects on the Little Sandy River.
2. BACKGROUND INFORMATION ON EXISTING CONDITIONS IN THE SANDY RIVER BASIN
2.1 Watershed Description The Sandy River and its tributaries drain a 1,316-km2 basin on the western slope of the Cascade Range of northwestern Oregon (Figure 1). The basin extends approximately 89 km from its headwaters to its confluence with the Columbia River near Troutdale (Columbia River RM 120.5). Principal tributaries to the Sandy River include Zigzag, Salmon, and Bull Run rivers and Still, Cedar, Gordon, and Beaver creeks. The Bull Run River is the largest tributary to the Sandy River and has a drainage area of approximately 265 km2 (USDA Forest Service 1997). Annual precipitation ranges from 102 cm near the Sandy River=s mouth to 279 cm near its source on Mt. Hood (ODFW 1990).
Numerical Modeling of Sediment Transport in the TECHNICAL REPORT Sandy River, OR following Removal of Marmot
March 2000 Stillwater Sciences Page 3
2.2 Geology of the Sandy River Basin The geology of the Sandy River basin reflects Tertiary (Miocene and Pliocene) and Quaternary (Pleistocene and Holocene) volcanic events and Pleistocene glaciations. The most extensive geologic units are Pliocene volcanics (basaltic andesite lava flows); the Miocene Rhododendron Formation, which is composed of weak andesitic tuffs and breccias (volcanic rock) and is common in the upper basin; and the Miocene Troutdale Formation, which is a sedimentary formation that is fluvially derived from the erosion of local volcanic rocks and is common in the lower part of the Sandy River basin (USDA Forest Service 1996). Volcanic mudflows (lahars) originating from Mt. Hood have had an important geomorphic effect on the Sandy River and have traveled as far as the confluence with the Columbia River (Allen 1988). The last two episodes of eruptive activity occurred 1,500 and 200 years ago (the Timberline and Old Maid episodes, respectively), when numerous pyroclastic flows and lahars occurred. During the most recent (Old Maid) eruptive period, the Sandy River became choked with sediment over 20-m deep that completely buried the pre-eruption valley floor between Sandy and Troutdale. Since then, channels have incised into these deposits, leaving behind several-meter-high terraces with actively eroding banks. The ongoing influence of past laharic events, Mt. Hood glaciers, and the basin=s underlying lithology result in naturally high sediment loading in the Sandy River.
2.3 Hydrology Hydrologic regimes in the Sandy River basin are characterized by low flows in August and September and high flows generated by rainfall and rain-on-snow events in winter and snowmelt in spring. Because the headwaters of the Sandy and Zigzag rivers originate from glaciers on the slopes of Mt. Hood, at an elevation of about 1,890 m, flow and sediment loading are greatly influenced by glacial processes and steep unstable slopes (ODFW 1997). Glacial sediments frequently cause the mainstem Sandy River to remain turbid throughout the summer snowmelt period. Basin hydrology has been altered by flow regulation and diversion. The City of Portland and PGE own major water development facilities in the basin, both of which are called the Bull Run Project. These facilities include dams on the Sandy, Little Sandy, and Bull Run rivers (Figure 1). The City of Portland=s Bull Run Project, located on the Bull Run River, provides water supply to the City of Portland and sells power to PGE. No minimum flows are currently required at the City's Bull Run Project; consequently, the Bull Run River is dewatered under normal conditions downstream of the City=s facilities. The City=s dams also block delivery of coarse sediment from the Bull Run basin to downstream reaches. The U.S. Geological Survey operates streamflow gauges on the Sandy, Little Sandy, and Bull Run rivers. Discharge data from the Sandy River near Marmot gauge (station number 14137000) and the Sandy River below Bull Run gauge (station number 14142500) were used in sediment transport modeling, as discussed in Section 5.1.2 below.
Numerical Modeling of Sediment Transport in the TECHNICAL REPORT Sandy River, OR following Removal of Marmot
March 2000 Stillwater Sciences Page 4
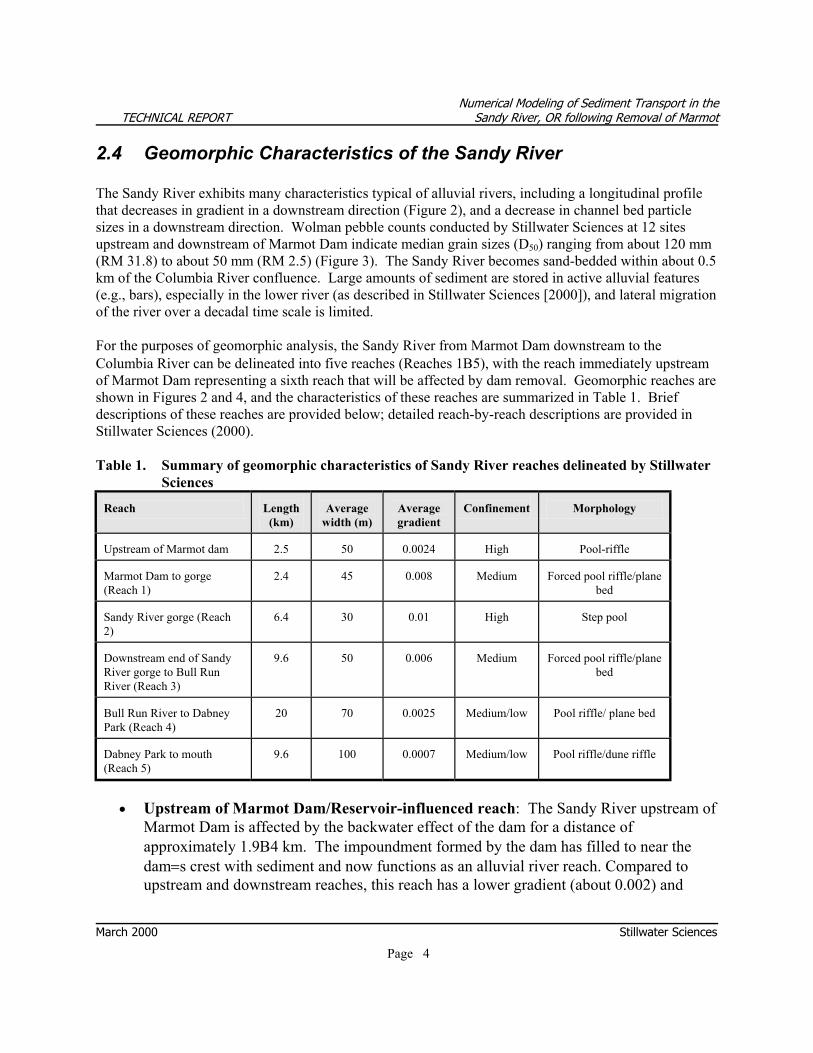
2.4 Geomorphic Characteristics of the Sandy River The Sandy River exhibits many characteristics typical of alluvial rivers, including a longitudinal profile that decreases in gradient in a downstream direction (Figure 2), and a decrease in channel bed particle sizes in a downstream direction. Wolman pebble counts conducted by Stillwater Sciences at 12 sites upstream and downstream of Marmot Dam indicate median grain sizes (D50) ranging from about 120 mm (RM 31.8) to about 50 mm (RM 2.5) (Figure 3). The Sandy River becomes sand-bedded within about 0.5 km of the Columbia River confluence. Large amounts of sediment are stored in active alluvial features (e.g., bars), especially in the lower river (as described in Stillwater Sciences [2000]), and lateral migration of the river over a decadal time scale is limited. For the purposes of geomorphic analysis, the Sandy River from Marmot Dam downstream to the Columbia River can be delineated into five reaches (Reaches 1Β5), with the reach immediately upstream of Marmot Dam representing a sixth reach that will be affected by dam removal. Geomorphic reaches are shown in Figures 2 and 4, and the characteristics of these reaches are summarized in Table 1. Brief descriptions of these reaches are provided below; detailed reach-by-reach descriptions are provided in Stillwater Sciences (2000). Table 1. Summary of geomorphic characteristics of Sandy River reaches delineated by Stillwater
Sciences Reach
Length (km)
Average
width (m)
Average gradient
Confinement
Morphology
Upstream of Marmot dam
2.5
50
0.0024
High
Pool-riffle
Marmot Dam to gorge (Reach 1)
2.4
45
0.008
Medium
Forced pool riffle/plane
bed Sandy River gorge (Reach 2)
6.4
30
0.01
High
Step pool
Downstream end of Sandy River gorge to Bull Run River (Reach 3)
9.6
50
0.006
Medium
Forced pool riffle/plane
bed
Bull Run River to Dabney Park (Reach 4)
20
70
0.0025
Medium/low
Pool riffle/ plane bed
Dabney Park to mouth (Reach 5)
9.6
100
0.0007
Medium/low
Pool riffle/dune riffle
• Upstream of Marmot Dam/Reservoir-influenced reach: The Sandy River upstream of
Marmot Dam is affected by the backwater effect of the dam for a distance of approximately 1.9Β4 km. The impoundment formed by the dam has filled to near the dam=s crest with sediment and now functions as an alluvial river reach. Compared to upstream and downstream reaches, this reach has a lower gradient (about 0.002) and

Numerical Modeling of Sediment Transport in the TECHNICAL REPORT Sandy River, OR following Removal of Marmot
March 2000 Stillwater Sciences Page 5
smaller bed substrates (i.e., a higher percentage of gravels) as a result of the grade control provided by the dam and the backwater effect of the dam=s impoundment. The valley in this reach is about 40Β60 m wide. The length of time required for the reservoir to fill with sediment is not known, but it is generally believed that it was filled in the early years following the dam closure. Results of sediment sampling in the reservoir conducted for this project in 1999 are described in Section 5.1.3 below.
• Reach 1 extends from Marmot Dam to the upstream end of the Sandy River gorge and is
2.4-km long. This reach is characterized by a 0.008 gradient, moderate confinement at bankfull flow, and moderately pronounced forced pool-riffle morphology with a few small lateral cobble/boulder bars. The bed surface is armored and consists mainly of cobbles and boulders; gravels are limited. Several large woody debris accumulations create potential depositional zones in this reach.
• Reach 2 is the Sandy River gorge, which is 6.4 km in length and is bounded by 20Β30 m high
bedrock strath terraces with steep hillslopes above. This reach is characterized by a 0.01 gradient, high confinement, and step-pool morphology with only patchy cobble/boulder deposits and long, deep bedrock pools that are separated by coarse-bedded riffles and boulder rapids. Large (house-sized) boulders are present in the channel and create enhanced frictional losses, thereby reducing the effective shear stress available to transport sediment. In general, few deposition areas are present in this reach. Bedrock exposure is more common in the channel bed in this reach than in other reaches of the Sandy River. The steep gradient and high confinement in this reach create very high shear stresses, resulting in high sediment transport capacity.
• Reach 3 extends from the downstream end of the gorge (near Revenue Bridge) to the
Bull Run River confluence at Dodge Park and is about 10 km in length. This reach widens considerably compared to Reaches 1 and 2 (with an average width of 50 m), has an average gradient of 0.006, and is characterized by forced pool-riffle morphology with many cobble/boulder bars and a cobble/gravel-dominated channel bed. Because the channel and valley bottom widen and gradient decreases downstream of the gorge, sediment transport capacity is reduced and the potential for sediment deposition increases. Shear stresses remain relatively high, however, and although average bed particle sizes in this reach decrease compared to Reaches 1 and 2, gravels suitable as spawning substrate are limited, occurring only in scattered patches and pool tail-outs (ODFW 1990, 1997).
• Reach 4 extends from the Bull Run confluence (Dodge Park) to Dabney State Park, a
length of 20 km. This reach has an average gradient of approximately 0.0025, is bounded by high (mostly alluvial) terraces, and is characterized by pool-riffle morphology with many cobble/gravel bars. The channel bed is a mixture of cobbles, gravel, and sand. In Reach 4, channel confinement, gradient, and bed particle size decrease further compared
Numerical Modeling of Sediment Transport in the TECHNICAL REPORT Sandy River, OR following Removal of Marmot
March 2000 Stillwater Sciences Page 6
to reaches upstream, with these tendencies particularly evident in the reach from Oxbow Park (RM 11.9) to Dabney Park (RM 6.6). Large bars, side channel, overflow channel, and island features are present in larger magnitude and greater frequency. Sand content in the bed subsurface is generally high, notably increasing at Oxbow Park. Portions of the active bed and bars are covered with and/or saturated with sand.
• Reach 5 extends 9.6 km from Dabney State Park to the confluence with the Columbia
River. This reach is characterized by a 0.0007 gradient, moderate-to-low confinement at bankfull flow, and dune-ripple morphology with large gravel/sand alternate and medial bars. The channel bed is a mixture of sand and gravel, is highly mobile, and has a very high sand content in the bed subsurface. The Sandy River delta forms the downstream-most portion of Reach 5. In the delta, the channel is sand-bedded and depositional dynamics are strongly influenced by the backwater effect of the Columbia River.
3. NUMERICAL MODELING OF SEDIMENT TRANSPORT FOLLOWING DAM REMOVAL
Stillwater Sciences developed one-dimensional numerical models of fine and coarse sediment transport to predict the routing of sediment from behind Marmot Dam downstream through the Sandy River. The numerical modeling allows assessment and comparison of sediment transport characteristics under different dam removal methods and river conditions. Stillwater Sciences developed a coarse sediment transport model based on Parker=s surface-based bedload equation (Parker et al. 1982, Parker 1990) and a model of sand transport from reservoir deposits based on Brownlie=s bed material equation (Brownlie 1981).1 Current sediment transport equations for gravel/sand mixtures are still at a developing stage, and verification of even the best equations in this category (e.g., Wilcock 1997, 1998) has been limited. To avoid using an equation for a gravel/sand mixture, we developed separate models to simulate gravel and sand transport. Separate modeling of gravel and sand was based on our hypotheses that (1) as the sediment is released from the reservoir deposit, gravel particles will be transported as bedload and sand will be transported mostly as suspended load because of the steep slope of the Sandy River, and (2) gravel and sand transport occur in different time scales (years vs. days). For example, a gravel particle may take years to travel 48 km, the distance from Marmot Dam to the Columbia River confluence. A sand particle, however, may travel the same distance, once it is exposed to the surface, in only several days during a flood event. Transport of fine sediment (including sand) was therefore modeled separately from coarse sediment (gravel). We acknowledge that in reality, transport of gravel and sand will each influence the transport rate of the other. Model results include predictions of the time required for sediment to be cleared from the reservoir area,
1In discussions of the sediment transport modeling, we use Αgravel≅ to refer to all particles with diameters greater than
2 mm (i.e., pebble, gravel, cobble, boulder). ΑSand≅ is used to refer to particles less than 2 mm in diameter.
Numerical Modeling of Sediment Transport in the TECHNICAL REPORT Sandy River, OR following Removal of Marmot
March 2000 Stillwater Sciences Page 7
time required for sediment to travel out of the Sandy River (including various sub-reaches), thickness of downstream sediment deposits in various reaches (on a reach-averaged and cross-section-averaged basis), changes in deposition thickness through time, and total suspended sediment concentrations through time along the river=s longitudinal profile following dam removal. Questions that were explored with the numerical models for different dam removal alternatives include:
• How does sediment (both suspended and bedload) travel over the coarse alluvial and bedrock channel bed of the Sandy River?
• How does transport distance from the dam affect suspended sediment concentrations and coarse and fine sediment accumulations following dam removal? Is there a distance downstream at which no detectable changes are expected?
• Will substantial bed aggradation occur following dam removal or is the sediment transport capacity in reaches downstream of Marmot Dam high enough that little aggradation would occur? If there is an aggradational effect, how long will it last and in what reaches will it be most prominent?
• How do discharge conditions during and following dam removal affect downstream sediment transport and deposition characteristics?
While numerical modeling provides estimates of sediment transport rates and cross-section and reach-averaged depths of sediment deposits, current state-of-the-art modeling typically cannot predict complex three-dimensional geomorphic responses over long river reaches and time scales, such as depositional patterns in channel cross section, local changes in sediment particle size distribution, infiltration of sand into the channel bed, or changes in the mobility of the existing channel bed downstream of the Marmot Dam.
3.1 Gravel Model The gravel model we developed is essentially the same as those of Cui et al. (2000) and Cui and Parker (2000), with minor adjustments to accommodate the specific conditions of the Sandy River and Marmot Dam. The Sandy River gravel model, as well as Cui et al. (2000) and Cui and Parker (2000), are based on Parker=s surface-based bedload equation (Parker et al. 1982, Parker 1990a,b, 1991a,b), which calculates gravel transport rate and bedload grain size distribution based on the grain size distribution of the surface layer and the boundary shear stress. The Parker equation (1990a, b) was developed to apply to gravel-bed streams and was not intended for application to sand or for suspended material of any size. It is only applicable to particles larger than 2 mm in diameter. Application of the Parker equation (1990a,b, 1991a,b) to a mixture with a relatively large amount of sand, such as the sediment accumulation behind Marmot Dam, may therefore create some error in predictions of the gravel transport rate. The model of Cui et al. (2000) simulated evolution of gravel pulses in a laboratory flume, and the model of Cui and Parker (2000) extended the model to a field scale to include abrasion as a factor affecting evolution of gravel pulses. Hansler et al. (1998) successfully simulated the evolution of a large landslide in the Navarro River, California with an early version of the Cui and Parker (2000) model. In both the laboratory flume and field cases, the model predicted that pulses traveled predominantly by dispersion rather than by translation, matching with flume and field observations. In comparisons of numerical
Numerical Modeling of Sediment Transport in the TECHNICAL REPORT Sandy River, OR following Removal of Marmot
March 2000 Stillwater Sciences Page 8
model predictions versus flume observations of the evolution of a sediment pulse, the numerical model performed best when the sediment pulse was coarser than the ambient sediment load (i.e., when there was less fine sediment in the pulse). As the sediment in the pulse became finer, with larger amounts of sand and silt, the model underpredicted the rate of pulse deformation (i.e., the pulse moved downstream in the flume and changed shape more quickly than predicted by the model) (Cui et al. 2000). The surface-based bedload equation used in the model (Parker et al. 1982, Parker 1990a, b) was based on field data for gravel and designed for gravel-bed rivers, which may explain their better performance in predicting the evolution of a coarser pulse of sediment. In comparisons of model predictions with the field case of the Navarro landslide, the model overpredicted the rate of pulse deformation, dispersing all the sediment in the landslide area in three years while field observation indicated that some landslide material remained in its original location three years after the landslide. The predicted areas of subsequent downstream deposition of landslide sediment, however, matched those observed in the field (Hansler et al. 1998; T. Lisle, pers. comm., 1999). Parker=s equation has been tested elsewhere in both laboratory flume and natural river situations. Cui et al. (1996) tested the Parker equation in three large-scale flume experiments, and Cui and Parker (1998) successfully applied the equation to predict channel profile. Uses of the equation in simulation of gravel-bed rivers are also discussed in Cui and Parker (1997), Andrews (1994, 2000), Chang (1994), and Hoey and Ferguson (1994). The gravel transport model is written in FORTRAN as a DOS application. The gravel model provides predictions of thickness of downstream coarse sediment deposits in various reaches on a reach-averaged and cross-section-averaged basis (i.e., predictions are one-dimensional). Model results also include predictions of the time required for sediment to be cleared from the reservoir area, time required for sediment to travel out of the Sandy River (including various sub-reaches), and changes in deposition thickness through time. The gravel model is also used to generate predictions of sand (sediment finer than 2 mm and coarser than 0.0625 mm) and silt (sediment finer than 0.0625 mm) release from the reservoir, for use as input data to the sand model (as described in Section 3.3).
3.2 Sand Model We developed a one-dimensional model of sand transport from reservoir deposits based on Brownlie=s bed material equation (Brownlie 1981). Brownlie's equation was developed for sand-bedded rivers but is used here because no sediment transport equations exist to calculate sand transport in a bedrock or coarse sediment-dominated river. In applying Brownlie's equation of sediment transport and friction, the roughness height is modified to account for the bedrock, boulders, and gravel present along the bed of the Sandy River. We hypothesize that with these roughness adjustments, application of Brownlie=s equation can provide reasonable estimates of sand transport rates. Calibration and validation of this approach is required, however, and the error associated with applying Brownlie=s equation to a gravel-bed river, even with roughness adjustments, is not known. Some basic assumptions of this model include:
• sand transport can be represented as transport over a rough bedrock surface (i.e., the existing gravel bed of the Sandy River remains immobile with respect to sand transport);
• silt is transported as throughput load that is carried in suspension and cannot be deposited in the
Numerical Modeling of Sediment Transport in the TECHNICAL REPORT Sandy River, OR following Removal of Marmot
March 2000 Stillwater Sciences Page 9
channel bed; • reservoir sediment is not cohesive; and • sand release from the reservoir is completely dependent on the mobilization and transport
of gravel out of the reservoir (i.e., data on the rate of sand transport out of the reservoir is derived from the gravel model, as described further in Section 3.3).
With the sediment release information generated by the gravel model as the input (see Section 3.3), the sand model predicts the thickness of downstream sand deposition on a reach-averaged and cross-section-averaged basis, including the changes in deposition thickness through time. The model also predicts suspended sediment concentrations through time along the river=s longitudinal profile following dam removal. The sand transport model is written in FORTRAN as a DOS application.
3.3 Discussion of Modeling of Reservoir Erosion A key uncertainty in this modeling relates to the expected pattern of reservoir erosion and release of sediment from the reservoir. The model assumes laterally uniform sediment transport out of the reservoir, with sediment mobilization and transport derived from Parker=s (1990) sediment transport equation. This section describes the methods and assumptions used in modeling of reservoir erosion. The sediment deposit behind Marmot Dam is stratified, with a sandy layer at the bottom and coarser sediment in the upper layer of the deposit. This is because upon completion of the dam, the backwater zone behind the dam enabled the deposition of bedload as well as the settling of suspended particles. Thus, the first necessary element of the model is the capability to handle stratification of the reservoir deposit. Reservoir stratification is accounted for by dividing the reservoir deposit vertically into layers and assigning each layer with a different grain size distribution, based on the results of sediment coring by Squier Associates (see Section 5.1.3 for description of these results). Although the overall stratification of the reservoir results in a larger proportion of fine sediment in the lower layers of the reservoir and more coarse sediment in the upper layers, each layer in the deposit typically contains a range of grain sizes. Because we developed separate models of gravel and sand transport, modeling of erosion of the mixed layers in the reservoir deposit required simplifying assumptions, as described below. In the reservoir area, the model assumes that the erosion of the sediment deposit is exclusively dependent on the erosion of gravel within each layer of the deposit. The model predicts erosion of each layer according to the grain size distribution of the layer (based only on particles > 2 mm within the layer), the local slope, and discharge. As each layer in the reservoir deposit is exposed, the model assumes that the entire layer will be mobilized when shear stresses are sufficient to mobilize the gravel (> 2 mm) component of the layer, as indicated by the Parker equation. Because the Parker equation is not intended for application to particles smaller than 2 mm, it is not used here to directly estimate sand mobilization. Rather, erosion of sand is estimated on a volumetric basis, based on the estimated volume of sand in each layer of the deposit. As the gravels within a layer are mobilized, the sand volume within that layer is also mobilized and transported downstream. Sand is therefore mobilized and available for transport only when the gravel within the same layer as the sand is mobilized. Estimates of the volume of sand release from the reservoir deposit that are generated by the gravel model using this method are given as a daily
Numerical Modeling of Sediment Transport in the TECHNICAL REPORT Sandy River, OR following Removal of Marmot
March 2000 Stillwater Sciences Page 10
average value at the dam site and are used as the input for the sand model. The upstream boundary used in the gravel model starts about 4 km upstream of Marmot Dam, whereas the upstream boundary of the sand model is Marmot Dam. The model also assumes that transport out of the reservoir would be laterally uniform. Erosion of reservoir sediment would in fact likely result in incision of a channel within the valley walls, although the valley width is relatively narrow (40Β60 m) in the reservoir reach. Incision of a channel in the reservoir deposit could accelerate exposure of the underlying sand layer in the incised area and increase the time (compared to model predictions) required for sediment on the margins of the reservoir deposit to be eroded downstream. Informal observations of the evolution of reservoir sediment deposits following approximately 30 dam removals in Pennsylvania indicate that vertical incision almost always occurs, leaving isolated terraces or Αprotofloodplains≅ (J. Pizzutto, pers. comm., 2000). We acknowledge that modeling of reservoir erosion incorporates major simplifying assumptions and is a key area of model uncertainty. Gravel and sand components in the reservoir will likely interact in manners that are not captured by this modeling. For example, sand transport from a given layer in the reservoir deposit will likely occur more rapidly than transport of the gravel in that layer, and the presence of a large amount of sand in certain layers likely reduces the validity of applying the Parker equation, as observed by Cui et al. (2000). In addition, sand following the gravel leaving the reservoir could smooth the bed and increase the mobility of the leading gravel front downstream (T. Lisle, pers. comm., 2000). In order to address uncertainties in modeling of sediment transport from the reservoir and to qualitatively assess the potential effects of incision, we performed sensitivity tests to evaluate how increased rates of sediment delivery from the reservoir to downstream reaches affect the model results, thereby simulating incision of a channel through the reservoir sediment deposit and more rapid downstream sand transport. These included a sensitivity test of the gravel model, in which we assumed that the accelerated sediment transport by downcutting is related to the cross sectionally averaged channel bed slope, and sensitivity tests on the sand model, in which faster rates of sand release from the reservoir were assumed. The results of these sensitivity tests are described in Section 6 below.
3.4 Uncertainties in the numerical modeling The sediment transport models developed for the Sandy River are state-of-the-art models based on tested sediment transport equations, and the models have been reviewed by experts in the field of sediment transport (Attachment A). Some uncertainty is inherent in numerical modeling, however, and the modeling effort described here contains a number of such uncertainties. Many hypotheses are incorporated in the models, both in terms of theoretical development (i.e., reflecting uncertainties in current scientific understanding about the mechanics of sediment transport) and input data. Key areas of uncertainty in this modeling effort, each of which is discussed in more detail either in previous sections or below, are as follows:
• reservoir erosion processes and sediment transport out of the reservoir area (Section 3.3); • effects of coarse bed materials, especially large boulders, on sediment transport (particularly sand
transport, as there are no equations for sand transport over a coarse bed); • the separation of sand and gravel components in the modeling of sediment transport, rather than
Numerical Modeling of Sediment Transport in the TECHNICAL REPORT Sandy River, OR following Removal of Marmot
March 2000 Stillwater Sciences Page 11
modeling of a mixed sand/gravel mixture (sand and gravel transport are treated separately, although they do likely affect each other);
• simplifications in channel geometry used in the model (e.g., a rectangular channel is assumed, and widths do not vary with stage);
• rough assumptions used for several input parameters; • uncertainties surrounding sediment transport mechanics.
The models are one-dimensional, providing predictions of sediment deposition thicknesses that are averaged over the width of the channel cross section and that represent deposition over the existing channel bed. Model predictions do not account for local variations in shear stress caused by features such as deep pools, bedrock outcrops, or large boulders, and the amount of sediment actually deposited may be substantially higher or lower than predicted by the model in localized areas of the channel. The modeling also does not account for certain depositional processes, such as infiltration of fine sediment into the interstices of the channel bed and the production of sand and silt from gravel abrasion (i.e., suspended load estimates do not include products of gravel abrasion). The model results are most applicable on a reach-scale and time-averaged basis. Model results reflect a set of hydrologic conditions used as input, which was based on historical flow data from the Sandy River near Marmot gaging station. We modeled a range of hydrologic scenarios, as discussed in Section 5.1.2, to provide insight into the potential effects of different flow scenarios on sediment transport and deposition in the first year following dam removal. Use of a different set of hydrologic conditions would alter certain model predictions, such as the rate of sediment movement out of the reservoir reach. Although the specific hydrologic conditions that occur after dam removal will invariably be different than those used in the model, and extreme flow events were not modeled, the hydrologic scenarios we modeled represent a range of hydrologic conditions that could reasonably be expected to occur in the Sandy River following dam removal. The gravel and sand models require input parameters on a range of physical characteristics that influence sediment transport in the Sandy River (Sections 5.1 and 5.2), and these input data contain varying levels of uncertainty. For those input parameters to which the model is most sensitive (i.e., channel gradient, channel width, grain size distribution of the reservoir deposit, and water discharge), we used data collected specifically for this project or that were already available (water discharge). Uncertainty in these data should be relatively small, and sensitivity analyses were performed to examine the effects of varying input data on hydrologic conditions and on the grain-size distribution of reservoir sediment. For other input parameters, such as background gravel and sand transport rates, size distribution of bedload, and abrasion rates in the Sandy River, existing data were not available and new data were not collected for this project. For many of these input parameters, only order-of-magnitude estimates are required for the models, and we therefore used rough assumptions based on our observations of the Sandy River and on published data from elsewhere in the region. Many of the assumptions used in the modeling are conservative with respect to predicted impacts. For example, model runs assume a slightly greater amount of sediment would be released from behind Marmot Dam than volumes estimated by PGE and Squier Associates (2000). This is because our review of PGE photogrammetry data suggests a slightly greater upstream extent of reservoir sediment than estimated by Squier Associates (2000) based on their coring study.
Numerical Modeling of Sediment Transport in the TECHNICAL REPORT Sandy River, OR following Removal of Marmot
March 2000 Stillwater Sciences Page 12
Although the models upon which this effort is based (e.g., Cui et al. 2000, Cui and Parker 2000) have been tested in flumes and in the field, the accuracy of the model developed for dam removal in the Sandy River has not been verified, and model results should be interpreted accordingly. We have used professional judgement (including input from Dr. William Dietrich [University of California-Berkeley] and Dr. Tom Lisle [USDA Forest Service, Redwood Sciences Laboratory]) and field observations of the Sandy River to interpret model results in terms of expected geomorphic effects in the Sandy River (for example, discussing how predicted reach-averaged deposition patterns may be manifested in the river), as presented in Stillwater Sciences (2000). Data collected following removal of Marmot Dam will permit testing of the accuracy of this modeling effort. It should be emphasized that this is a state-of-the-art modeling effort, and despite the uncertainties, is unique in its ability to provide predictions of sediment transport and deposition over large temporal and spatial scales and to allow comparison of various dam-removal alternatives. Modeling results are particularly well-suited for comparing impacts expected under the different alternatives. When each dam removal alternative is modeled using identical input data for flows, grain size distribution of reservoir sediment, and other parameters, the results assist evaluation of the relative risks of environmental impacts associated with each alternative.
4. GOVERNING EQUATIONS
4.1 Governing Equations for the Gravel Model The governing equation for the flow in the gravel model is the one-dimensional backwater equation (see Chaudhry 1993):
(1)F-1S-S=
dxdh
2r
f0
where h is water depth; x is downstream distance; S0 is bed slope; Sf is friction slope; and Fr is Froude number. As discussed below, the backwater equation is applied only when flows have a low Froude number. Froude number Fr is defined as:
where Qw is water discharge, B is channel width, and g is acceleration due to gravity. The Exner equations of sediment continuity take the following forms (Parker 1991a,b, Cui and Parker 1998):
(2)ghB
Q=F3
wr
Numerical Modeling of Sediment Transport in the TECHNICAL REPORT Sandy River, OR following Removal of Marmot
March 2000 Stillwater Sciences Page 13
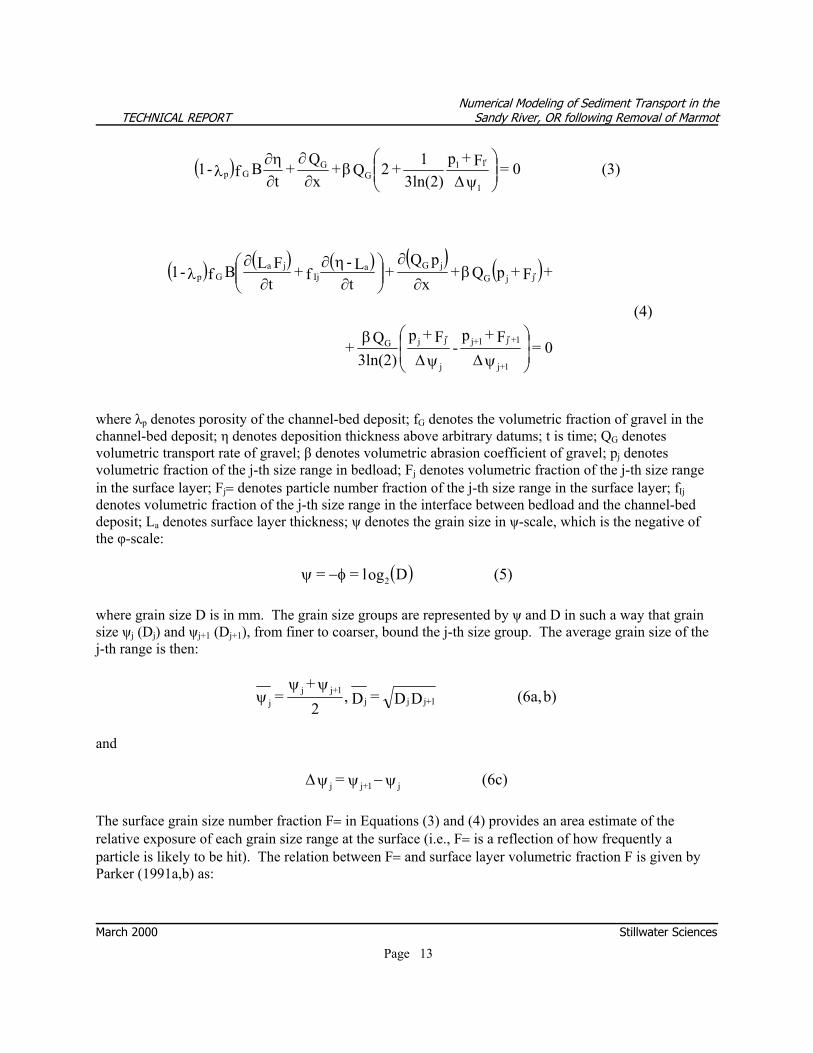
where λp denotes porosity of the channel-bed deposit; fG denotes the volumetric fraction of gravel in the channel-bed deposit; η denotes deposition thickness above arbitrary datums; t is time; QG denotes volumetric transport rate of gravel; β denotes volumetric abrasion coefficient of gravel; pj denotes volumetric fraction of the j-th size range in bedload; Fj denotes volumetric fraction of the j-th size range in the surface layer; Fj= denotes particle number fraction of the j-th size range in the surface layer; fIj denotes volumetric fraction of the j-th size range in the interface between bedload and the channel-bed deposit; La denotes surface layer thickness; ψ denotes the grain size in ψ-scale, which is the negative of the φ-scale:
( ) (5)Dogl== 2φ−ψ where grain size D is in mm. The grain size groups are represented by ψ and D in such a way that grain size ψj (Dj) and ψj+1 (Dj+1), from finer to coarser, bound the j-th size group. The average grain size of the j-th range is then:
b)(6a,DD=D,2
+= 1+jjj
1+jjj
ψψψ
and
(6c)= j1+jj ψ−ψψ∆ The surface grain size number fraction F= in Equations (3) and (4) provides an area estimate of the relative exposure of each grain size range at the surface (i.e., F= is a reflection of how frequently a particle is likely to be hit). The relation between F= and surface layer volumetric fraction F is given by Parker (1991a,b) as:
( ) (3)0=F+p3ln(2)
1+2Q+xQ+
tBf-1
1
11G
GGp
ψ∆
β∂
∂∂η∂
λ′
( ) ( ) ( ) ( ) ( )(4)
0=F+p
-F+p
3ln(2)Q+
+F+pQ+x
pQ+
tL-
f+tFLBf-1
1+j
1+j1+j
j
jjG
jjGjGa
Ijja
Gp
ψ∆ψ∆β
β∂
∂
∂
η∂∂
∂λ
′′
′
Numerical Modeling of Sediment Transport in the TECHNICAL REPORT Sandy River, OR following Removal of Marmot
March 2000 Stillwater Sciences Page 14
(7)D/F
D/F=Fjj
jjj
Σ′
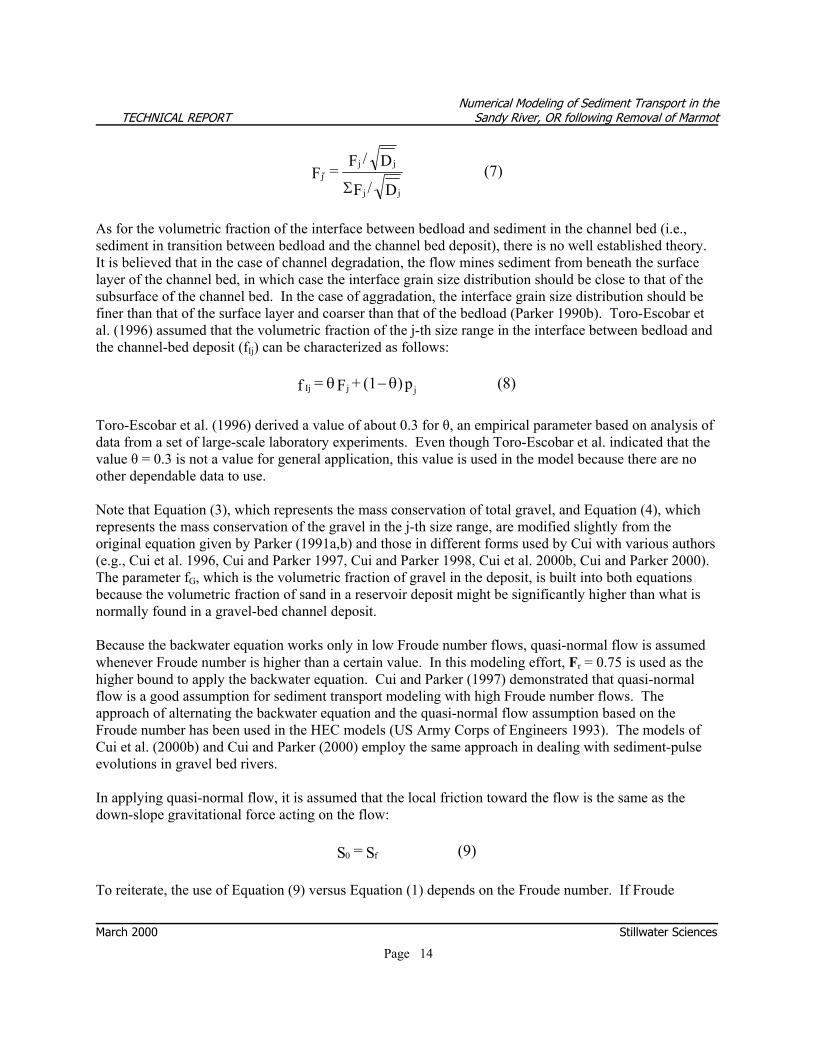
As for the volumetric fraction of the interface between bedload and sediment in the channel bed (i.e., sediment in transition between bedload and the channel bed deposit), there is no well established theory. It is believed that in the case of channel degradation, the flow mines sediment from beneath the surface layer of the channel bed, in which case the interface grain size distribution should be close to that of the subsurface of the channel bed. In the case of aggradation, the interface grain size distribution should be finer than that of the surface layer and coarser than that of the bedload (Parker 1990b). Toro-Escobar et al. (1996) assumed that the volumetric fraction of the j-th size range in the interface between bedload and the channel-bed deposit (fIj) can be characterized as follows:
(8)p)(1+F=f jjIj θ−θ Toro-Escobar et al. (1996) derived a value of about 0.3 for θ, an empirical parameter based on analysis of data from a set of large-scale laboratory experiments. Even though Toro-Escobar et al. indicated that the value θ = 0.3 is not a value for general application, this value is used in the model because there are no other dependable data to use. Note that Equation (3), which represents the mass conservation of total gravel, and Equation (4), which represents the mass conservation of the gravel in the j-th size range, are modified slightly from the original equation given by Parker (1991a,b) and those in different forms used by Cui with various authors (e.g., Cui et al. 1996, Cui and Parker 1997, Cui and Parker 1998, Cui et al. 2000b, Cui and Parker 2000). The parameter fG, which is the volumetric fraction of gravel in the deposit, is built into both equations because the volumetric fraction of sand in a reservoir deposit might be significantly higher than what is normally found in a gravel-bed channel deposit. Because the backwater equation works only in low Froude number flows, quasi-normal flow is assumed whenever Froude number is higher than a certain value. In this modeling effort, Fr = 0.75 is used as the higher bound to apply the backwater equation. Cui and Parker (1997) demonstrated that quasi-normal flow is a good assumption for sediment transport modeling with high Froude number flows. The approach of alternating the backwater equation and the quasi-normal flow assumption based on the Froude number has been used in the HEC models (US Army Corps of Engineers 1993). The models of Cui et al. (2000b) and Cui and Parker (2000) employ the same approach in dealing with sediment-pulse evolutions in gravel bed rivers. In applying quasi-normal flow, it is assumed that the local friction toward the flow is the same as the down-slope gravitational force acting on the flow:
(9)S=S f0 To reiterate, the use of Equation (9) versus Equation (1) depends on the Froude number. If Froude
Numerical Modeling of Sediment Transport in the TECHNICAL REPORT Sandy River, OR following Removal of Marmot
March 2000 Stillwater Sciences Page 15
number is lower then the defined upper limit of Fr = 0.75, equation (1) is used, and if Fr ∃ 0.75 equation (9) is applied as an approximation. A Keulegan-type relation (modified from Keulegan [1938]) is used to characterize the flow friction:
(10)k
11h2.5ln=uu
s*
where u* is shear velocity; u denotes flow velocity and ks is roughness height. Shear velocity is defined as:
(11)ghS=u f* The roughness height takes the form used by Cui et al. (1996, 2000b) and Cui and Parker (1997, 1998, 2000):
(12)D2=k 1.28sgsgs σ
Equation (12) is a statistical approximation of the original equation given by Parker (1990a,b, 1991a,b). In Equation (12) Dsg denotes geometric mean grain size of surface gravel and σsg is geometric standard deviation of surface gravel. The sediment transport equation to be used in the gravel model is the surface-based bedload equation of Parker (Parker 1990a,b, 1991a,b), which is discussed briefly in Section 3.1 above. Details of the equation are not given in this report. Interested readers are referred to the original papers.
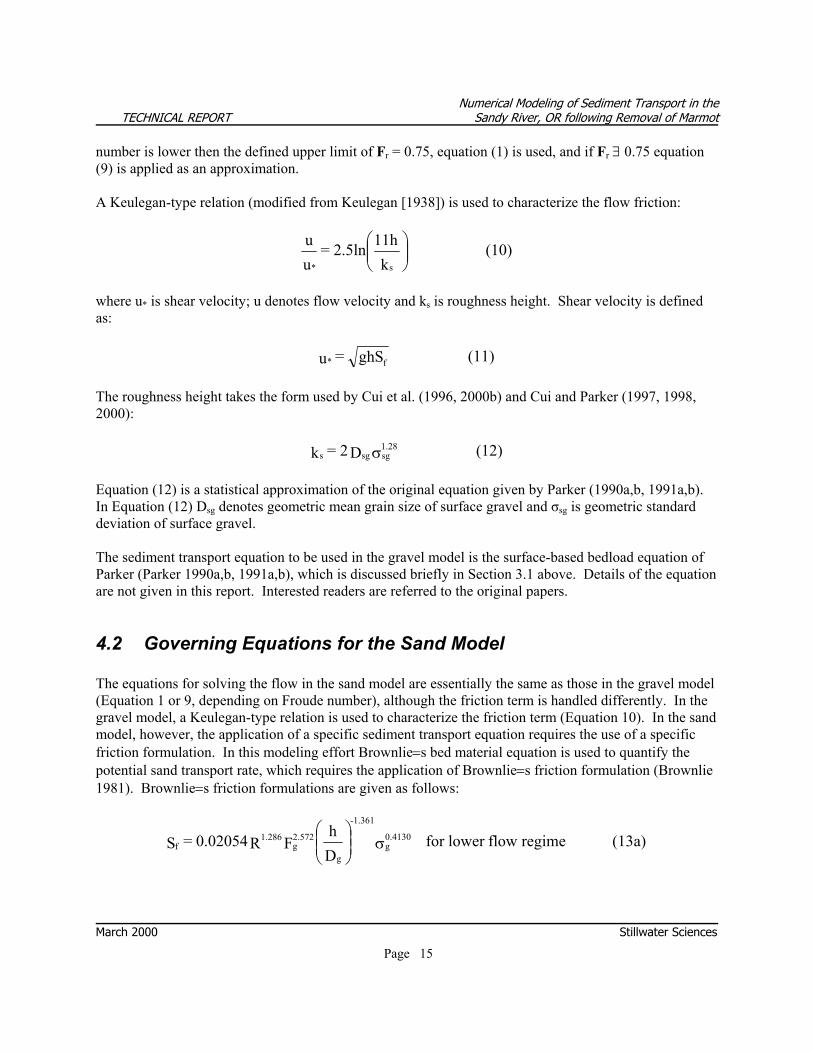
4.2 Governing Equations for the Sand Model The equations for solving the flow in the sand model are essentially the same as those in the gravel model (Equation 1 or 9, depending on Froude number), although the friction term is handled differently. In the gravel model, a Keulegan-type relation is used to characterize the friction term (Equation 10). In the sand model, however, the application of a specific sediment transport equation requires the use of a specific friction formulation. In this modeling effort Brownlie=s bed material equation is used to quantify the potential sand transport rate, which requires the application of Brownlie=s friction formulation (Brownlie 1981). Brownlie=s friction formulations are given as follows:
(13a)regimeflowlowerforDh
FR0.02054=S 0.4130g
g
-1.361
2.572g
1.286f σ
Numerical Modeling of Sediment Transport in the TECHNICAL REPORT Sandy River, OR following Removal of Marmot
March 2000 Stillwater Sciences Page 16
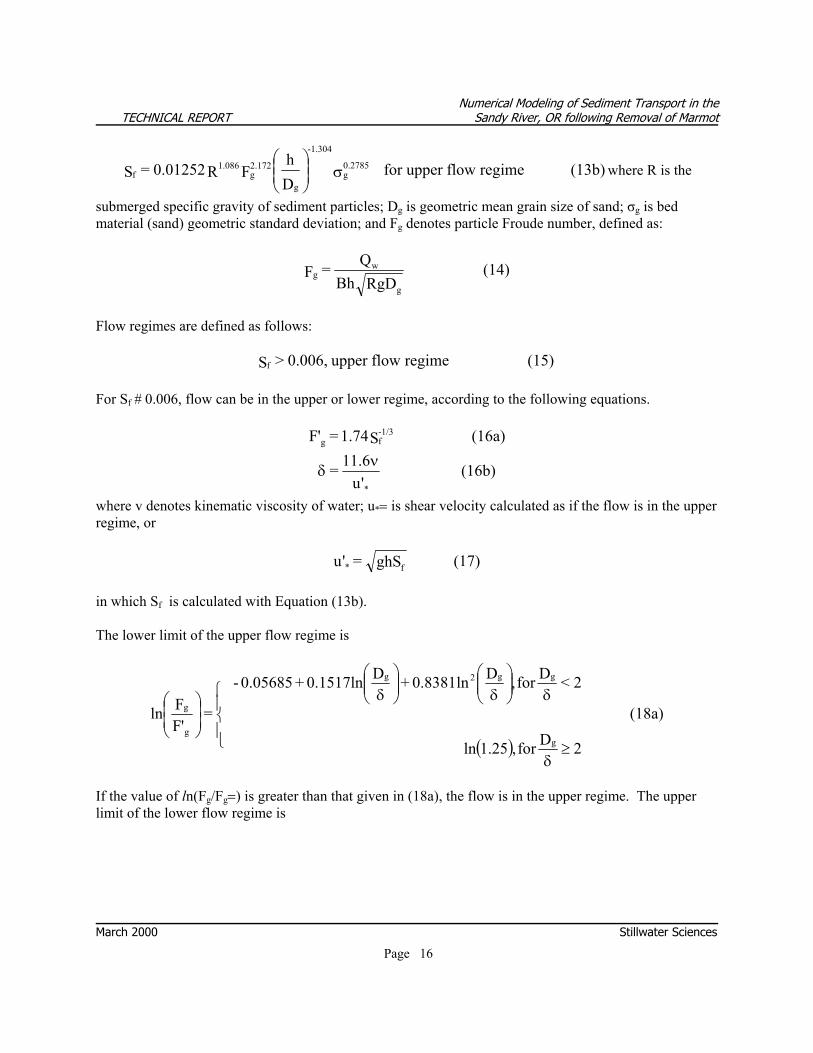
(13b)regimeflowupperforDh
FR0.01252=S 0.2785g
g
-1.304
2.172g
1.086f σ
where R is the
submerged specific gravity of sediment particles; Dg is geometric mean grain size of sand; σg is bed material (sand) geometric standard deviation; and Fg denotes particle Froude number, defined as:
(14)RgDBh
Q=Fg
wg
Flow regimes are defined as follows:
(15)regimeflowupper0.006,>Sf For Sf # 0.006, flow can be in the upper or lower regime, according to the following equations.
(16a)S1.74='F -1/3fg
(16b)'u
11.6=*
νδ
where v denotes kinematic viscosity of water; u*= is shear velocity calculated as if the flow is in the upper regime, or
(17)ghS='u f* in which Sf is calculated with Equation (13b). The lower limit of the upper flow regime is
( )
(18a)
2Dfor,1.25ln
2<Dfor,Dln0.8381+D0.1517ln+0.05685-
='F
Fln
g
gg2g
g
g
≥δ
δ
δ
δ
If the value of ln(Fg/Fg=) is greater than that given in (18a), the flow is in the upper regime. The upper limit of the lower flow regime is
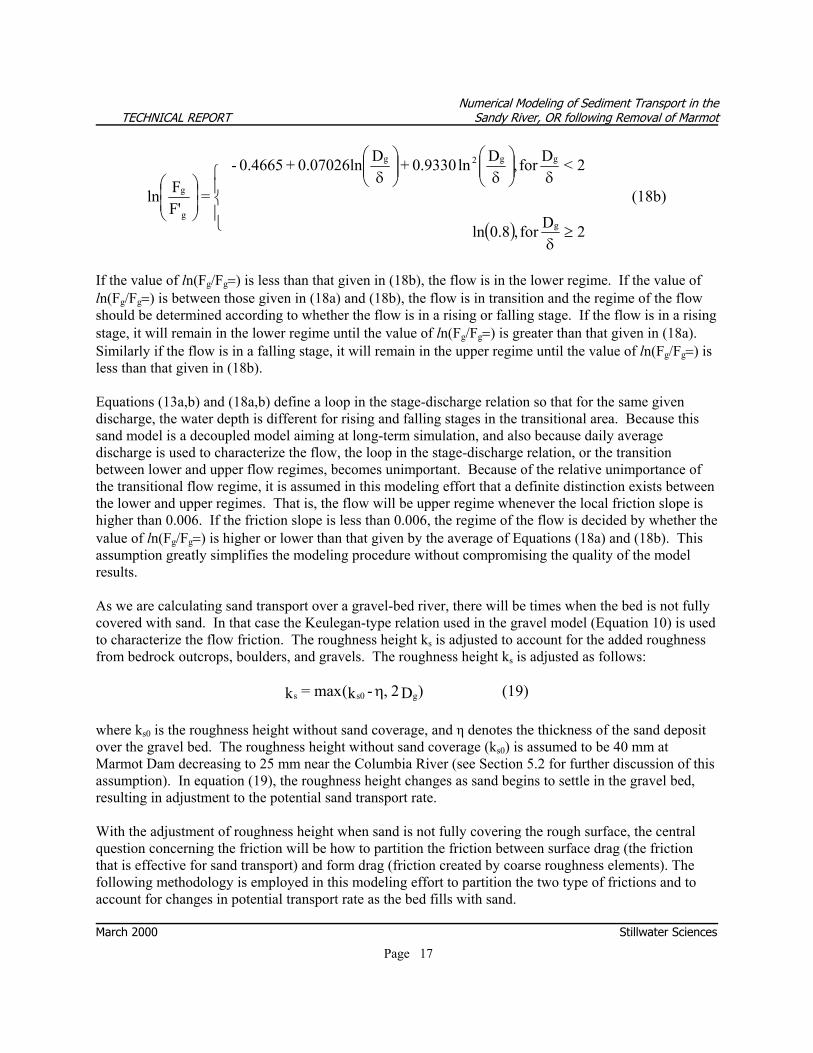
Numerical Modeling of Sediment Transport in the TECHNICAL REPORT Sandy River, OR following Removal of Marmot
March 2000 Stillwater Sciences Page 17
( )
(18b)
2Dfor,0.8ln
2<Dfor,Dln0.9330+D0.07026ln+0.4665-
='F
Fln
g
gg2g
g
g
≥δ
δ
δ
δ
If the value of ln(Fg/Fg=) is less than that given in (18b), the flow is in the lower regime. If the value of ln(Fg/Fg=) is between those given in (18a) and (18b), the flow is in transition and the regime of the flow should be determined according to whether the flow is in a rising or falling stage. If the flow is in a rising stage, it will remain in the lower regime until the value of ln(Fg/Fg=) is greater than that given in (18a). Similarly if the flow is in a falling stage, it will remain in the upper regime until the value of ln(Fg/Fg=) is less than that given in (18b). Equations (13a,b) and (18a,b) define a loop in the stage-discharge relation so that for the same given discharge, the water depth is different for rising and falling stages in the transitional area. Because this sand model is a decoupled model aiming at long-term simulation, and also because daily average discharge is used to characterize the flow, the loop in the stage-discharge relation, or the transition between lower and upper flow regimes, becomes unimportant. Because of the relative unimportance of the transitional flow regime, it is assumed in this modeling effort that a definite distinction exists between the lower and upper regimes. That is, the flow will be upper regime whenever the local friction slope is higher than 0.006. If the friction slope is less than 0.006, the regime of the flow is decided by whether the value of ln(Fg/Fg=) is higher or lower than that given by the average of Equations (18a) and (18b). This assumption greatly simplifies the modeling procedure without compromising the quality of the model results. As we are calculating sand transport over a gravel-bed river, there will be times when the bed is not fully covered with sand. In that case the Keulegan-type relation used in the gravel model (Equation 10) is used to characterize the flow friction. The roughness height ks is adjusted to account for the added roughness from bedrock outcrops, boulders, and gravels. The roughness height ks is adjusted as follows:
(19))D2,-k(max=k gs0s η where ks0 is the roughness height without sand coverage, and η denotes the thickness of the sand deposit over the gravel bed. The roughness height without sand coverage (ks0) is assumed to be 40 mm at Marmot Dam decreasing to 25 mm near the Columbia River (see Section 5.2 for further discussion of this assumption). In equation (19), the roughness height changes as sand begins to settle in the gravel bed, resulting in adjustment to the potential sand transport rate. With the adjustment of roughness height when sand is not fully covering the rough surface, the central question concerning the friction will be how to partition the friction between surface drag (the friction that is effective for sand transport) and form drag (friction created by coarse roughness elements). The following methodology is employed in this modeling effort to partition the two type of frictions and to account for changes in potential transport rate as the bed fills with sand.
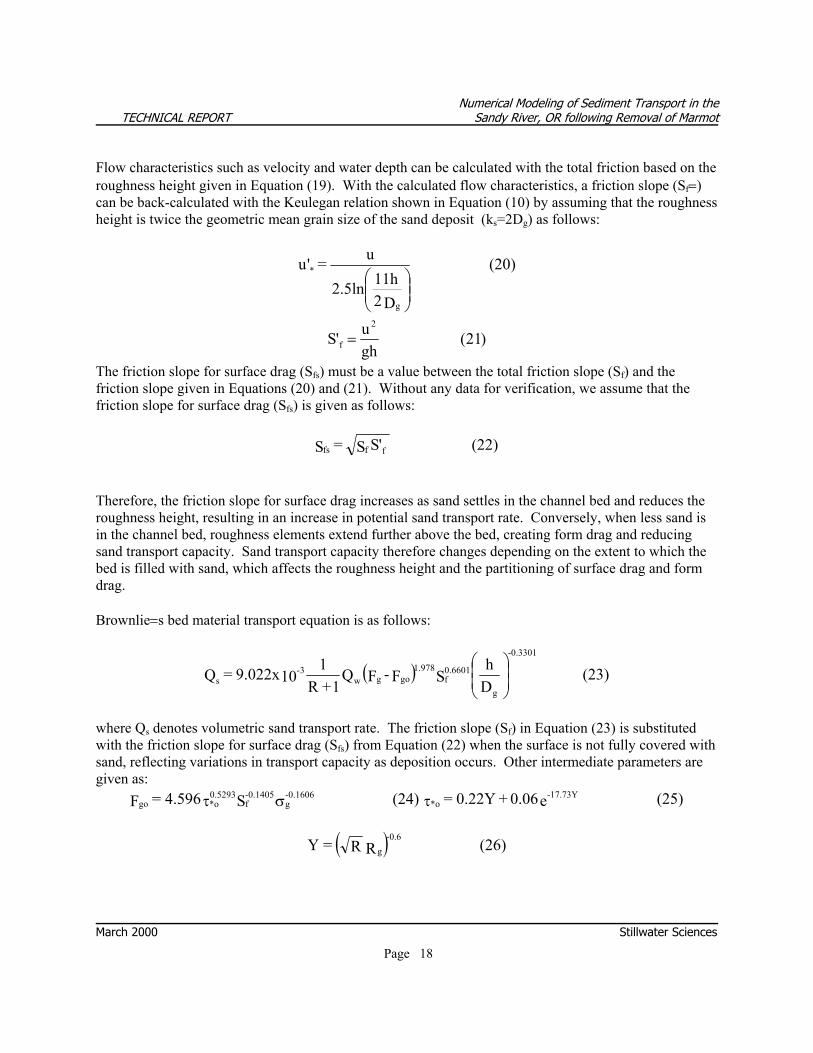
Numerical Modeling of Sediment Transport in the TECHNICAL REPORT Sandy River, OR following Removal of Marmot
March 2000 Stillwater Sciences Page 18
Flow characteristics such as velocity and water depth can be calculated with the total friction based on the roughness height given in Equation (19). With the calculated flow characteristics, a friction slope (Sf=) can be back-calculated with the Keulegan relation shown in Equation (10) by assuming that the roughness height is twice the geometric mean grain size of the sand deposit (ks=2Dg) as follows:
(20)
D211h2.5ln
u='u
g
*
)21(ghu'S
2
f =
The friction slope for surface drag (Sfs) must be a value between the total friction slope (Sf) and the friction slope given in Equations (20) and (21). Without any data for verification, we assume that the friction slope for surface drag (Sfs) is given as follows:
Therefore, the friction slope for surface drag increases as sand settles in the channel bed and reduces the roughness height, resulting in an increase in potential sand transport rate. Conversely, when less sand is in the channel bed, roughness elements extend further above the bed, creating form drag and reducing sand transport capacity. Sand transport capacity therefore changes depending on the extent to which the bed is filled with sand, which affects the roughness height and the partitioning of surface drag and form drag. Brownlie=s bed material transport equation is as follows:
( ) (23)Dh
SF-FQ1+R
1109.022x=Q
g
-0.3301
0.6601fgog
1.978w
3-s
where Qs denotes volumetric sand transport rate. The friction slope (Sf) in Equation (23) is substituted with the friction slope for surface drag (Sfs) from Equation (22) when the surface is not fully covered with sand, reflecting variations in transport capacity as deposition occurs. Other intermediate parameters are given as:
(24)S4.596=F -0.1606g
-0.1405f
0.5293*ogo στ (25)e0.06+0.22Y= -17.73Y
*oτ
( ) (26)RR=Y g-0.6
(22)'SS=S fffs

Numerical Modeling of Sediment Transport in the TECHNICAL REPORT Sandy River, OR following Removal of Marmot
March 2000 Stillwater Sciences Page 19
(27)gD
=R3g
g ν
where Rg is particle Reynolds number, Brownlie=s bed material equation is not used to directly calculate sand transport rate in the model. Instead, it is used to calculate a potential sand transport rate, or maximum possible sand transport rate, over the gravel bed. The actual sand transport rate at a specific location may or may not be the same as the potential sand transport rate calculated with Equation (23), based on the mass conservation equation given below (Equations 28a,b) and a combination of factors such as whether the bed is covered with sand, if the channel is aggrading or degrading, and the magnitude of upstream sand supply. For example, if the upstream sand supply to a specific section is less than the potential sand transport rate, the flow will scour sand from the bed so that the actual sediment transport rate at the location will be the same as the potential sand transport rate. If, however, there is not enough sand in the bed, the actual sand transport rate will be adjusted to a value that is smaller than that given by the potential sand transport rate, so that the sand deposit will be vanishing. Inputs and outputs of adjacent elements are thereby accounted for to route sand downstream. The Exner equations for sand continuity take the following forms:
( ) (28a)k<00,=xQ
-11+
tB1
s0s
gs
≤η∂
∂
λλ∂η∂
(28b)k>0,=xQ
-11+
tB1
s0s
s
η∂
∂
λ∂η∂
where λs is porosity of the sand deposit and λg is the porosity of the gravel bed or other roughness elements. Sand deposition below the roughness elements (i.e., infiltration of sand into coarser substrate interstices) is not modeled. Sand deposition below the roughness level would reduce the thickness of sand deposits above the coarse surface layer and would reduce TSS compared to the model results presented below, although this effect would be small. In this model effort, silt (finer than 62.5 µm) from the reservoir deposit is treated as throughput load that is carried in suspension and cannot be deposited in the channel bed. This portion of sediment, however, is included in the calculation of total suspended sediment (TSS). For the sediment particles coarser then 62.5 µm, the criterion set for suspension is given as follows (van Rijn 1984):
(29)1<u
v*
s
κ
where vs denotes particle settling velocity calculated with the procedure given by Dietrich (1982); and κ is the von Karman constant (assumed to equal 0.4). All the particles finer than 62.5 µm and those satisfying Equation (29) are considered as suspended sediment.
Numerical Modeling of Sediment Transport in the TECHNICAL REPORT Sandy River, OR following Removal of Marmot
March 2000 Stillwater Sciences Page 20
5. MODEL INPUT DATA
5.1 Gravel Model Input Data The gravel model incorporates the following input data: channel gradients (based on a longitudinal profile of the Sandy River), channel widths, water discharge at each section of the river, grain size distribution and volumetric fraction of gravel both in the channel and in the reservoir deposit, gravel transport rate upstream of Marmot Dam, and grain size distribution of bedload supply upstream of Marmot Dam. These input parameters and their sources are summarized in Table 5 (at the end of Section 5.1) and are described in more detail in the following sections.
5.1.1 Channel gradient and width A longitudinal profile of the Sandy River from 4.8 km upstream of Marmot Dam (RM 33) downstream to the Columbia River (RM 0) was developed using photogrammetry measurements of the Sandy River performed by PGE in summer 1999. The photogrammetry measurement, shown in Figures 2 and 5, gives the water surface elevation with an accuracy of ∀0.6 m (∀2 ft). To further smooth the long profile, the photogrammetry data were averaged over a 0.8 km distance. Bankfull channel widths were measured from 1:6,000 aerial photos of the Sandy River corridor. Randomly selected sections were checked in the field with a laser distance finder by Stillwater Sciences in September 1999 to verify the accuracy of aerial-photograph measurements. Field-checking found that channel widths measured from aerial photographs were generally within 10% accuracy. One exception is in Reach 2 (the gorge reach), where widths cannot be read from the aerial photos due to the narrow channel and valley in this reach. Channel widths in the gorge were measured in the field by Stillwater Sciences; these surveys documented channel widths in the gorge ranging from 25 to 45 m, with an estimated average of about 30 m. Because width measurements in the gorge were not georeferenced due to logistical difficulties of data collection in the gorge, the estimated average width of 30 m was applied to the entire gorge reach in the model. In all other reaches of the Sandy River, channel width was varied in the model according to the aerial photograph measurements. In some cases, small adjustments were made to measured widths as part of the Αzero process≅ (see Section 5.3 below). Because a rectangular channel form is used as a simplifying assumption in this modeling effort, widths do not vary with stage.
5.1.2 Discharge data and hydrologic scenarios used in numerical modeling A discharge series spanning the length of model runs was also required as input to the model. Daily discharge data used as input for the modeling are from the USGS Sandy River near Marmot gauge (station number 1413700), which is located 0.5 km above Marmot Dam and has been in operation since 1911, and the Sandy River below Bull Run gauge (station number 14142500), which is located 0.2 km
Numerical Modeling of Sediment Transport in the TECHNICAL REPORT Sandy River, OR following Removal of Marmot
March 2000 Stillwater Sciences Page 21
downstream of the Bull Run River confluence (RM 18.4) and has a period of record of 1910Β1914; 1929Β1966; and 1984 to present. Selection of water years from the period of record for use in modeling is discussed below. Numerical modeling was performed for three different hydrologic scenarios to evaluate the effects of various flow regimes following dam removal on sediment transport and deposition dynamics. The flows occurring following dam removal, particularly in the first year after removal, will have an important influence on the time required for downstream transport of reservoir sediment, on subsequent deposition patterns, and on the duration of impacts to aquatic organisms. We developed scenarios for wet, average, and dry hydrologic conditions for input into the numerical modeling, with the flows in the first year following removal varying in each scenario (i.e., hydrologic scenarios were defined according to the discharge conditions in the first year of the model run). The hydrologic scenarios account for both peak flow magnitude and overall water yield, both of which influence sediment transport dynamics. The peak and annual daily average discharges from the Marmot gauge were fit to a Log Pearson III distribution (Figure 6) and a normal distribution (Figure 7), respectively, in order to predict the return period of future discharges. Based on this analysis, we selected daily discharge records as input for Year 1 of model runs from three representative water years, with exceedence probabilities (which are equivalent to the inverse of the return period) for both annual peak discharge and average daily discharge corresponding to wet, average, and dry hydrologic conditions. For year 1 of model runs, we selected water years in which the exceedance probabilities for both peak flows and average annual discharge at the Marmot gauge were similar, as follows:
• The Αdry-conditions≅ scenario was defined as one in which flows used as input for year 1 had both a peak flow and average annual discharge with an approximately 90% exceedance probability (i.e., a 1.1-year return period). Based on the period of record, the 1987 water year matched these criteria (Table 2).
• The Αaverage-conditions≅ scenario was defined as one in which flows used as input for year 1
had both a peak flow and average annual discharge with an approximately 50% exceedance probability (i.e., a 2-year return period). We selected the 1991 water year to represent average conditions (Table 2).
• The Αwet-conditions≅ scenario was defined as one in which flows used as input for year 1 had
both a peak flow and average annual discharge with an approximately 10% exceedance probability (i.e., a 10-year return period). The 1961 water year fit these criteria (Table 2).
The years following the first year were selected randomly from all of the water years in the period of record using a numerical random generator, and the same water years for years 2 through 10 were used in the three different hydrologic scenarios. Water years chosen for the model runs are shown in Table 2, and annual hydrographs for these water years are shown in Figure 8. In addition to data from the Sandy River near Marmot gauge, the model also incorporated discharge data from the Sandy River below Bull Run River gauge, in order to account for downstream flow accretion.
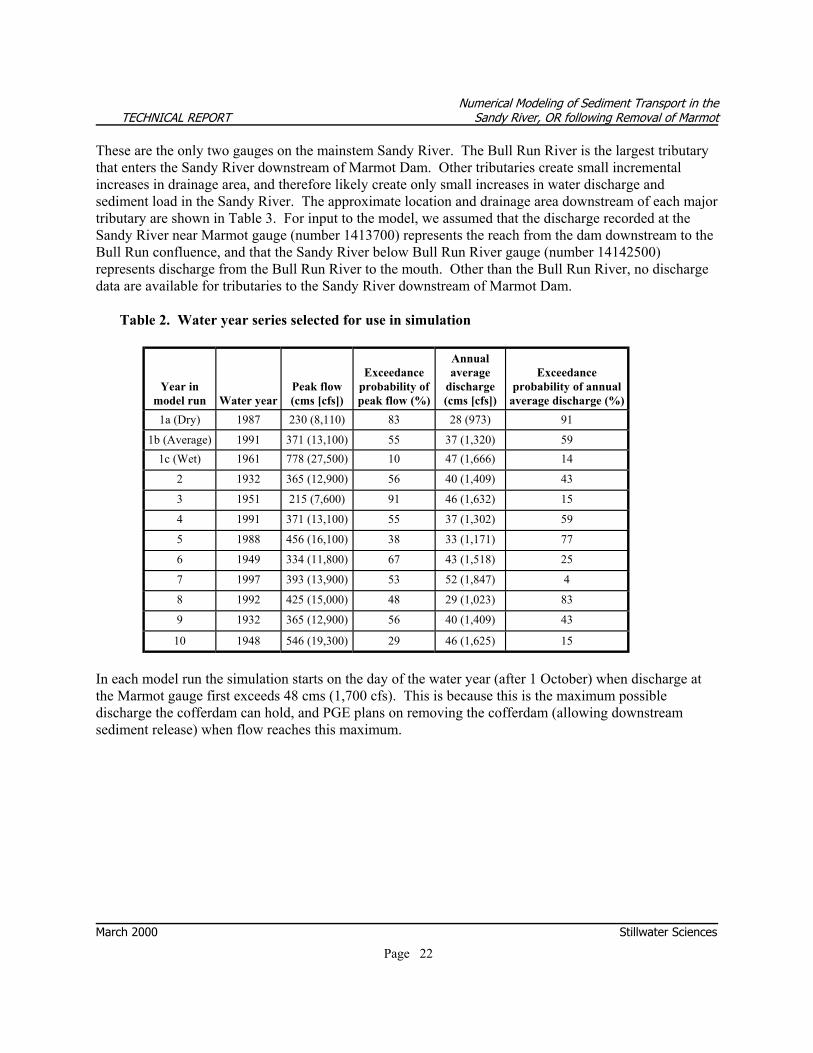
Numerical Modeling of Sediment Transport in the TECHNICAL REPORT Sandy River, OR following Removal of Marmot
March 2000 Stillwater Sciences Page 22
These are the only two gauges on the mainstem Sandy River. The Bull Run River is the largest tributary that enters the Sandy River downstream of Marmot Dam. Other tributaries create small incremental increases in drainage area, and therefore likely create only small increases in water discharge and sediment load in the Sandy River. The approximate location and drainage area downstream of each major tributary are shown in Table 3. For input to the model, we assumed that the discharge recorded at the Sandy River near Marmot gauge (number 1413700) represents the reach from the dam downstream to the Bull Run confluence, and that the Sandy River below Bull Run River gauge (number 14142500) represents discharge from the Bull Run River to the mouth. Other than the Bull Run River, no discharge data are available for tributaries to the Sandy River downstream of Marmot Dam.
Table 2. Water year series selected for use in simulation
Year in
model run Water year
Peak flow (cms [cfs])
Exceedance
probability of peak flow (%)
Annual average
discharge (cms [cfs])
Exceedance
probability of annual average discharge (%)
1a (Dry)
1987 230 (8,110)
83
28 (973)
91
1b (Average)
1991
371 (13,100)
55
37 (1,320)
59
1c (Wet)
1961 778 (27,500)
10
47 (1,666)
14
2
1932
365 (12,900)
56
40 (1,409)
43
3
1951
215 (7,600)
91
46 (1,632)
15
4
1991
371 (13,100)
55
37 (1,302)
59
5
1988
456 (16,100)
38
33 (1,171)
77
6
1949
334 (11,800)
67
43 (1,518)
25
7
1997
393 (13,900)
53
52 (1,847)
4
8
1992
425 (15,000)
48
29 (1,023)
83
9
1932
365 (12,900)
))))
56
40 (1,409)
43
10
1948
546 (19,300)
29
46 (1,625)
15
In each model run the simulation starts on the day of the water year (after 1 October) when discharge at the Marmot gauge first exceeds 48 cms (1,700 cfs). This is because this is the maximum possible discharge the cofferdam can hold, and PGE plans on removing the cofferdam (allowing downstream sediment release) when flow reaches this maximum.
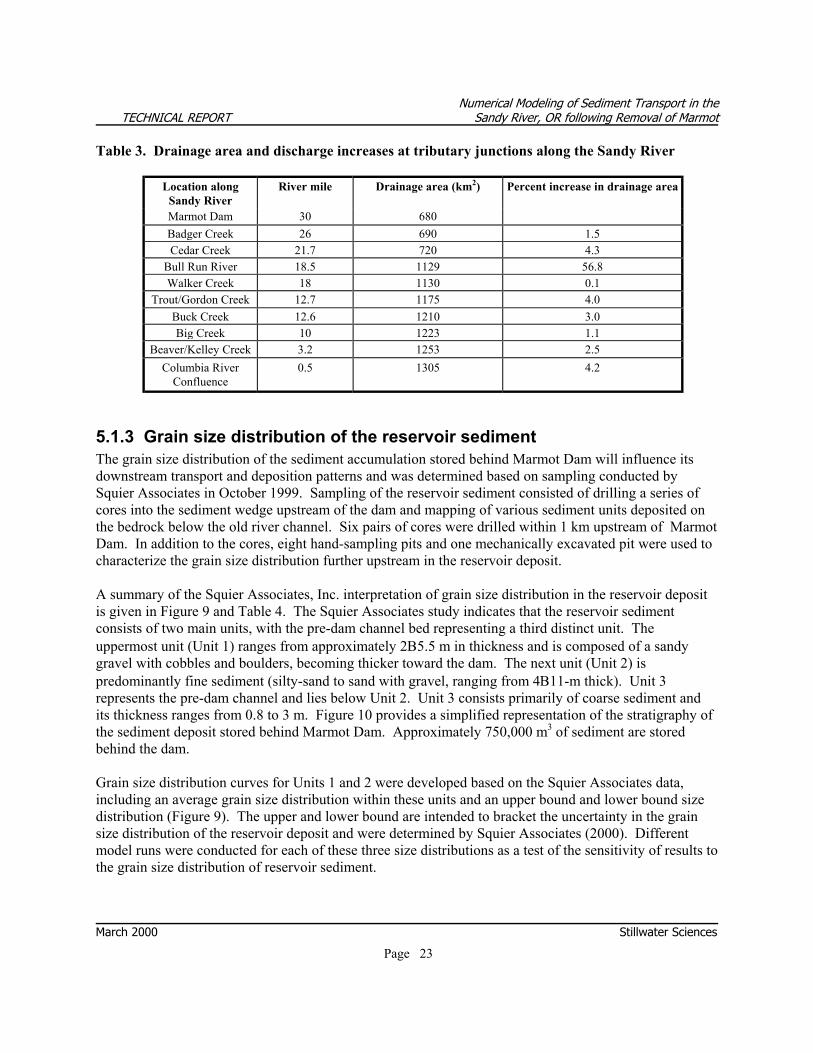
Numerical Modeling of Sediment Transport in the TECHNICAL REPORT Sandy River, OR following Removal of Marmot
March 2000 Stillwater Sciences Page 23
Table 3. Drainage area and discharge increases at tributary junctions along the Sandy River
Location along Sandy River
River mile
Drainage area (km2)
Percent increase in drainage area
Marmot Dam
30
680
Badger Creek
26
690
1.5 Cedar Creek
21.7
720
4.3
Bull Run River
18.5
1129
56.8 Walker Creek
18
1130
0.1
Trout/Gordon Creek
12.7
1175
4.0 Buck Creek
12.6
1210
3.0
Big Creek
10
1223
1.1 Beaver/Kelley Creek
3.2
1253
2.5
Columbia River Confluence
0.5
1305
4.2
5.1.3 Grain size distribution of the reservoir sediment The grain size distribution of the sediment accumulation stored behind Marmot Dam will influence its downstream transport and deposition patterns and was determined based on sampling conducted by Squier Associates in October 1999. Sampling of the reservoir sediment consisted of drilling a series of cores into the sediment wedge upstream of the dam and mapping of various sediment units deposited on the bedrock below the old river channel. Six pairs of cores were drilled within 1 km upstream of Marmot Dam. In addition to the cores, eight hand-sampling pits and one mechanically excavated pit were used to characterize the grain size distribution further upstream in the reservoir deposit. A summary of the Squier Associates, Inc. interpretation of grain size distribution in the reservoir deposit is given in Figure 9 and Table 4. The Squier Associates study indicates that the reservoir sediment consists of two main units, with the pre-dam channel bed representing a third distinct unit. The uppermost unit (Unit 1) ranges from approximately 2Β5.5 m in thickness and is composed of a sandy gravel with cobbles and boulders, becoming thicker toward the dam. The next unit (Unit 2) is predominantly fine sediment (silty-sand to sand with gravel, ranging from 4Β11-m thick). Unit 3 represents the pre-dam channel and lies below Unit 2. Unit 3 consists primarily of coarse sediment and its thickness ranges from 0.8 to 3 m. Figure 10 provides a simplified representation of the stratigraphy of the sediment deposit stored behind Marmot Dam. Approximately 750,000 m3 of sediment are stored behind the dam. Grain size distribution curves for Units 1 and 2 were developed based on the Squier Associates data, including an average grain size distribution within these units and an upper bound and lower bound size distribution (Figure 9). The upper and lower bound are intended to bracket the uncertainty in the grain size distribution of the reservoir deposit and were determined by Squier Associates (2000). Different model runs were conducted for each of these three size distributions as a test of the sensitivity of results to the grain size distribution of reservoir sediment.
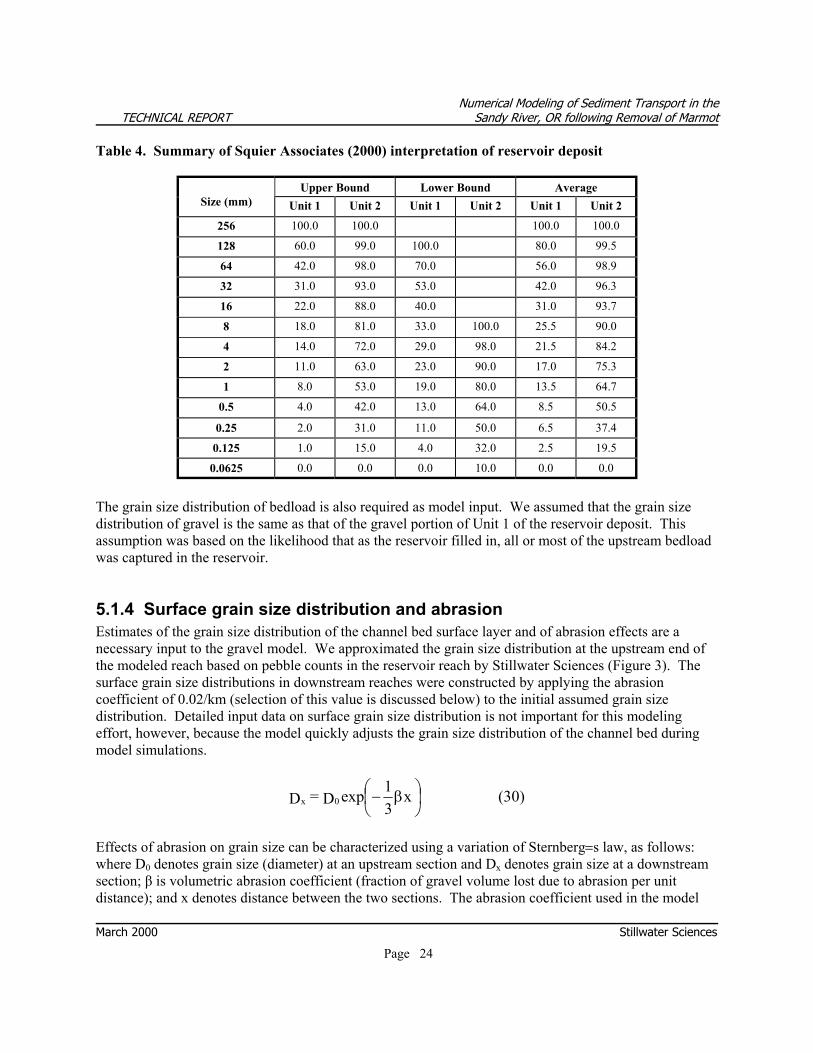
Numerical Modeling of Sediment Transport in the TECHNICAL REPORT Sandy River, OR following Removal of Marmot
March 2000 Stillwater Sciences Page 24
Table 4. Summary of Squier Associates (2000) interpretation of reservoir deposit
Upper Bound
Lower Bound
Average
Size (mm)
Unit 1
Unit 2
Unit 1
Unit 2
Unit 1
Unit 2
256
100.0
100.0
100.0
100.0
128
60.0
99.0
100.0
80.0
99.5
64
42.0
98.0
70.0
56.0
98.9
32
31.0
93.0
53.0
42.0
96.3
16
22.0
88.0
40.0
31.0
93.7
8
18.0
81.0
33.0
100.0
25.5
90.0
4
14.0
72.0
29.0
98.0
21.5
84.2
2
11.0
63.0
23.0
90.0
17.0
75.3
1
8.0
53.0
19.0
80.0
13.5
64.7
0.5
4.0
42.0
13.0
64.0
8.5
50.5
0.25
2.0
31.0
11.0
50.0
6.5
37.4
0.125
1.0
15.0
4.0
32.0
2.5
19.5
0.0625
0.0
0.0
0.0
10.0
0.0
0.0
The grain size distribution of bedload is also required as model input. We assumed that the grain size distribution of gravel is the same as that of the gravel portion of Unit 1 of the reservoir deposit. This assumption was based on the likelihood that as the reservoir filled in, all or most of the upstream bedload was captured in the reservoir.
5.1.4 Surface grain size distribution and abrasion Estimates of the grain size distribution of the channel bed surface layer and of abrasion effects are a necessary input to the gravel model. We approximated the grain size distribution at the upstream end of the modeled reach based on pebble counts in the reservoir reach by Stillwater Sciences (Figure 3). The surface grain size distributions in downstream reaches were constructed by applying the abrasion coefficient of 0.02/km (selection of this value is discussed below) to the initial assumed grain size distribution. Detailed input data on surface grain size distribution is not important for this modeling effort, however, because the model quickly adjusts the grain size distribution of the channel bed during model simulations.
(30)x31expD=D 0x
β−
Effects of abrasion on grain size can be characterized using a variation of Sternberg=s law, as follows: where D0 denotes grain size (diameter) at an upstream section and Dx denotes grain size at a downstream section; β is volumetric abrasion coefficient (fraction of gravel volume lost due to abrasion per unit distance); and x denotes distance between the two sections. The abrasion coefficient used in the model
Numerical Modeling of Sediment Transport in the TECHNICAL REPORT Sandy River, OR following Removal of Marmot
March 2000 Stillwater Sciences Page 25
dictates the rate of attrition of gravel released from the reservoir and therefore influences predicted deposition (i.e., if attrition is greater, less deposition will occur because fewer coarse particles will be available for deposition). We used an abrasion coefficient (β) of 0.02/km in our modeling effort. No data are available on abrasion in the Sandy River basin, although abrasion values reported by Collins and Dunne (1989) for rocks from rivers in the Olympic Mountains, Washington provide a range of values that could be applicable to the Sandy River basin. Collins and Dunne (1989), who carried out tumbling-mill experiments, reported abrasion coefficients ranging from about 0.006/km (Humptulips River) to about 0.021/km (Satsop River basin, basaltic colluvium). Geologically, gravel in the Sandy River basin (which is dominated by andesite, dacite and andesitic basalt) is likely to be most similar to the basaltic colluvium (β = 0.021/km) measured by Collins and Dunne (1989). We therefore adopted an abrasion coefficient of 0.02/km. Application of an abrasion coefficient of 0.02/km to the Sandy River would result in reduction by abrasion of a characteristic grain size of 100 mm at Marmot Dam to 73 mm at the Columbia River confluence (a distance of 48 km), using Equation (30). This estimate can be compared to field observations by Stillwater Sciences. Pebble counts in selected reaches of the Sandy River suggest median grain sizes of about 100 mm in the vicinity of Marmot Dam and 30Β40 mm between Rkm 4 and 9. The channel is sand-bedded at the confluence with the Columbia River. The observed downstream fining in the Sandy River is not only attributable to abrasion, however; factors such as reworking of lahar deposits and fine sediment inputs from bank erosion also contribute to downstream fining. It is therefore difficult to assess the accuracy of our estimate of abrasion coefficient using field observations. Production of sand and silt from gravel abrasion are not accounted for in calculations of TSS and sand aggradation; we do not expect this to be an important source of uncertainty in terms of affecting model results, however. Because this modeling effort focuses on evaluation of channel aggradation following sediment release from the reservoir deposit (rather than degradation/incision in the downstream channel bed), results are not sensitive to subsurface grain size distribution in the channel bed downstream of the dam. For simplicity, it is assumed that the subsurface grain size distribution is the same as that of the surface layer downstream of the reservoir area. In the reservoir reach, subsurface grain sizes are estimated based on the coring study by Squier Associates, as discussed in Section 5.1.3.
5.1.5 Background gravel transport rate A background rate of gravel transport in the Sandy River upstream of Marmot Dam is a required input to the gravel model, but no data are available for reference. In order to derive a gravel transport rate, we assumed that the Sandy River=s gravel transport capacity upstream of Marmot Dam exceeds supply, based on the abundance of bedrock outcrops and boulders in the channel. Thus it is possible to assume that the actual sediment transport rate upstream of Marmot dam is a fraction of the transport capacity. This fraction was determined by the model using trial and error as part of the Αzero process≅, whereby various gravel transport rates were plugged in to reference-condition runs so that downstream aggradation and degradation is minimized over the whole river reach (see Section 5.3 for further discussion of the zero process). The resulting gravel input rates are hypothetical and have not been tested by any field data.
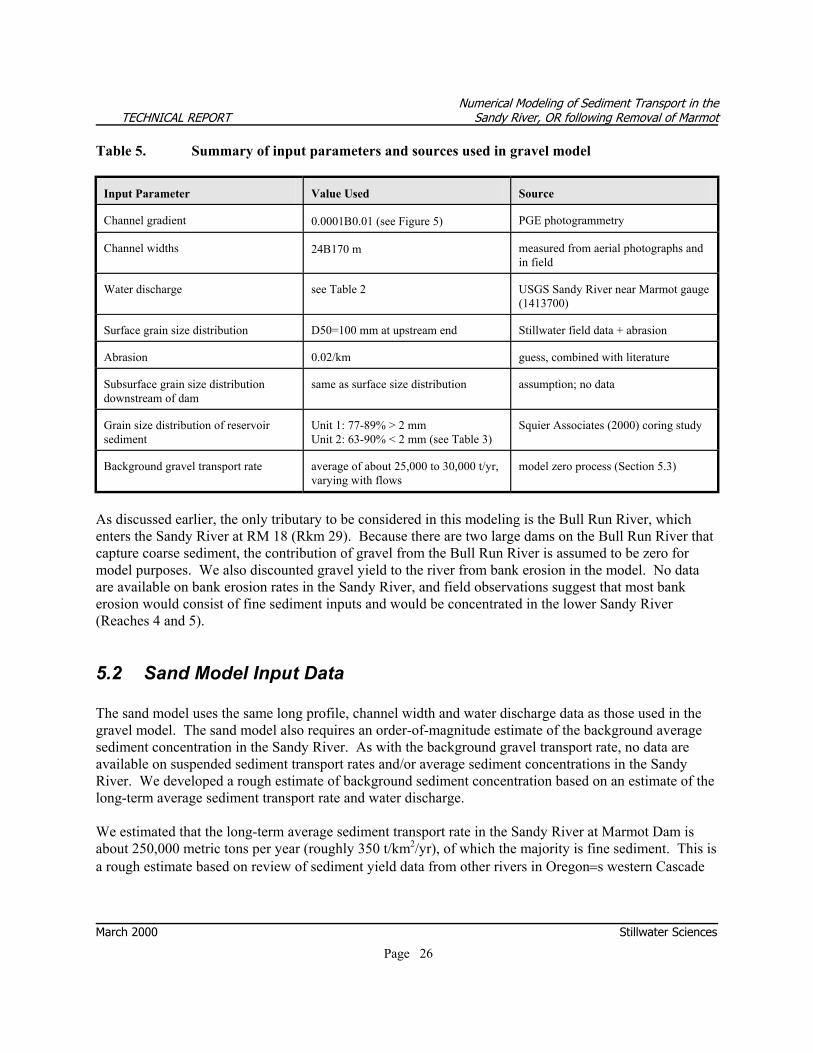
Numerical Modeling of Sediment Transport in the TECHNICAL REPORT Sandy River, OR following Removal of Marmot
March 2000 Stillwater Sciences Page 26
Table 5. Summary of input parameters and sources used in gravel model
Input Parameter
Value Used
Source
Channel gradient
0.0001Β0.01 (see Figure 5)
PGE photogrammetry
Channel widths
24Β170 m
measured from aerial photographs and in field
Water discharge
see Table 2
USGS Sandy River near Marmot gauge (1413700)
Surface grain size distribution
D50=100 mm at upstream end
Stillwater field data + abrasion
Abrasion
0.02/km
guess, combined with literature
Subsurface grain size distribution downstream of dam
same as surface size distribution
assumption; no data
Grain size distribution of reservoir sediment
Unit 1: 77-89% > 2 mm Unit 2: 63-90% < 2 mm (see Table 3)
Squier Associates (2000) coring study
Background gravel transport rate
average of about 25,000 to 30,000 t/yr, varying with flows
model zero process (Section 5.3)
As discussed earlier, the only tributary to be considered in this modeling is the Bull Run River, which enters the Sandy River at RM 18 (Rkm 29). Because there are two large dams on the Bull Run River that capture coarse sediment, the contribution of gravel from the Bull Run River is assumed to be zero for model purposes. We also discounted gravel yield to the river from bank erosion in the model. No data are available on bank erosion rates in the Sandy River, and field observations suggest that most bank erosion would consist of fine sediment inputs and would be concentrated in the lower Sandy River (Reaches 4 and 5).
5.2 Sand Model Input Data The sand model uses the same long profile, channel width and water discharge data as those used in the gravel model. The sand model also requires an order-of-magnitude estimate of the background average sediment concentration in the Sandy River. As with the background gravel transport rate, no data are available on suspended sediment transport rates and/or average sediment concentrations in the Sandy River. We developed a rough estimate of background sediment concentration based on an estimate of the long-term average sediment transport rate and water discharge. We estimated that the long-term average sediment transport rate in the Sandy River at Marmot Dam is about 250,000 metric tons per year (roughly 350 t/km2/yr), of which the majority is fine sediment. This is a rough estimate based on review of sediment yield data from other rivers in Oregon=s western Cascade
Numerical Modeling of Sediment Transport in the TECHNICAL REPORT Sandy River, OR following Removal of Marmot
March 2000 Stillwater Sciences Page 27
Range, as summarized below.2 Swanson et al. (1982) found that in 30 small undisturbed watersheds in the H. J. Andrews Experimental Forest, Oregon, sediment yields averaged about 100 t/km2/yr. Other measurements of sediment flux in undisturbed basins vary between 26 t/km2/yr in the H. J. Andrews Forest (Grant and Wolf 1991) and 24Β119 t/km2/yr elsewhere in the western Cascades (Larsen and Sidle 1980). Much higher sediment yields have been measured in managed watersheds, including estimates of 255 t/km2/yr in the H.J. Andrews Forest (Swanson and Dyrness 1975), and up to about 500 t/km2/yr elsewhere in the western Cascades (Curtiss 1975, Larsen and Sidle 1980, McBain and Trush 1998). In the Sandy River basin, sediment yields may be substantially higher on average than in the H. J. Andrews Forest and elsewhere in the western Cascades due to Mt. Hood glaciers, the presence of semi-consolidated lahar deposits, steep topography, and land uses. Ferguson (1986) found that traditional methods of estimating suspended sediment load may underestimate loads by up to 50%, suggesting that many of the sediment yield estimates reported here may be underestimates. Average sediment yields may in fact be several times higher than the average value for the H. J. Andrews Forest of about 100 t/km2/yr estimated by Swanson et al. (1982). Therefore, we used an estimated sediment transport rate of 350 t/km2/yr. The range on this estimate could be approximately 100 to 600 t/km2/yr (350∀250 t/km2/yr). This estimate translates to an average sediment concentration of about 200 mg/l. In this modeling effort, a constant 200 mg/l background sand concentration at Marmot Dam is used. The accuracy of this value does not affect the output of the model because if the sediment flux from reservoir erosion following removal of Marmot Dam is much higher than the background value, as it is expected to be, then the backgound concentration assumed for model input becomes unimportant in model output. The grain size distribution of the input sediment for the sand model is assumed to be the same as that of Unit 2 of the reservoir deposit (Table 4, Figure 9). The roughness height without sand coverage (ks0 in Equations 19 and 20 above) is assumed to be 0.4 m at Marmot Dam and to decrease exponentially to 0.25 m at the Columbia River confluence. These values are guesses based on field observation and correspond to roughly 4Β10 times the geometric mean grain size. We also completed a model run in which the roughness heights were doubled (i.e., 0.8 m at Marmot Dam and 0.5 m at the Columbia River confluence) in order to test the sensitivity of model results to the assumed roughness height. Doubling the roughness height in the sensitivity test results in an increased likelihood that sand deposition will be initialized. Changing the roughness height has only a limited effect on the overall thickness of predicted sand deposition, however. Predictions of sand deposition thickness are more sensitive to the assumed rate of sand release from the reservoir, as discussed in the description of sensitivity tests in Section 6.2.2.
2Note that the model zero process is unable to derive a total background sediment transport rate, as was performed to
estimate background gravel transport rate (see Section 5.3). We therefore used literature review to develop a rough estimate of the background sediment transport rate for use in the sand model.
Numerical Modeling of Sediment Transport in the TECHNICAL REPORT Sandy River, OR following Removal of Marmot
March 2000 Stillwater Sciences Page 28
5.3 Zero Process A Αzero process≅ is generally required for long-term, large-scale sediment transport simulation. The purpose of the zero process used in this modeling effort is to generate a starting point for the modeling and to evaluate certain input parameters. The process recognizes the imperfection of the numerical model as well as the data base to be used to run the model, as described below. In the zero process, the model is run repeatedly under a reference condition, in which input data such as discharge are the same as for the simulation of dam removal, but neither Marmot Dam nor any sediment pulse from the reservoir deposit are considered. If the model is fed with raw input data (e.g., channel gradient, width) without modification, however, it typically will not produce quasi-equilibrium results at reference conditions. The goal of this process is to run the model, modifying certain input parameters if necessary, until the model produces quasi-equilibrium results, whereby the river experiences aggradation and degradation at different reaches over different periods of time and hydrological events, but overall, long-term aggradation or degradation is limited. If a quasi-equilibrium condition is established as the baseline for modeling, changes in the system can be interpreted as a direct result of the introduced disturbances, in this case release of the sediment pulse from Marmot Dam. Boundary conditions in the model are given by discharge at the upstream end of the modeled reach (4 km upstream of Marmot Dam) and along the Sandy River in a downstream direction, background gravel transport at the upstream end (given as a fraction of the potential gravel transport rate, as described below), the assumed grain size distribution of the background gravel load, and a fixed bed elevation at the downstream end of the modeled reach (the confluence of the Sandy River with the Columbia River). The water surface elevation at the downstream end is acquired by the normal flow assumption. In the zero process, certain data are modified so that the model will perform in a quasi-equilibrium state at reference conditions. The data that can be modified include channel width and bed slope. In our zero process, the channel width is modified in such a way that certain extremely wide sections are reduced to no less than 80% of the original value. The model is then run repeatedly, with the output of the channel bed elevation (slope) as the input of the subsequent run until the channel bed reaches quasi-equilibrium. In this modeling exercise, the gravel input upstream of Marmot Dam (which is needed as input to the model) is not known. This gravel transport rate can be estimated by trial and error in the zero process.3 Large-scale deposition (aggradation) will occur if the input sediment transport rate is too high and large-scale erosion (incision/degradation) will occur if the input sediment transport rate is too low. The input gravel transport rates selected for modeling, based on the zero process, vary with hydrology and, for the hydrologic conditions shown in Table 3, vary from about 7,000 t/yr to 72,000 t/yr at Marmot Dam. These results suggest an average long-term gravel transport rate of about 25,000 to 30,000 t/yr (roughly 10% of
3A background gravel transport rate could also be estimated using the literature-based estimate of total background
sediment transport rate described in Section 5.2. The ratio of gravel load to total load is unknown, however, and use of the zero process allows the use of background gravel transport rates that vary with flows, rather than assuming a single average rate.
Numerical Modeling of Sediment Transport in the TECHNICAL REPORT Sandy River, OR following Removal of Marmot
March 2000 Stillwater Sciences Page 29
the total sediment yield estimated in Section 5.2), although there is no observational evidence to verify the accuracy of these values. Assuming a bulk density of 1.7 t/m3, this average annual gravel transport rate would result in Marmot reservoir completely filling in about 30 years following dam closure. The actual length of time required for the reservoir to fill is unknown but 30 years appears to be a reasonable estimate, based on (1) regional sediment yield data and (2) the rapid sedimentation of an area of the reservoir that was excavated in the 1980s to facilitate reconstruction of the dam in 1989. The Αzeroed≅ bed slope is given in Figure 5 along with the original photogrammetry data. This figure shows that the zero process retains the general overall channel slope but modifies local gradients in order to convey the background sediment load through all reaches of the Sandy River.
6. RESULTS Model runs were performed to estimate sediment transport under Alternatives B, C, and D for removal of Marmot Dam, including modeling of various hydrologic scenarios, assumed grain size distributions of reservoir sediment, and other sensitivity analyses. The model runs we performed are summarized in Table 6. Average, dry, and wet hydrologic scenarios (Table 3), as well as average, upper bound, and lower bound grain size distributions (Figure 9), are explained in Sections 5.1.2 and 5.1.3. A reference-condition run, which does not account for the presence of Marmot Dam and/or sediment release from the reservoir, was also performed as part of the zero process (Section 5.3). Several sensitivity analyses were also conducted on Alternative B. For Alternative C, we used numerical modeling to test the effects of lowering Marmot Dam by different amounts in Year 1 on sediment transport patterns and to estimate downstream deposition patterns under these scenarios. We carried out the following model runs for Alternative C, based on average hydrologic conditions in Year 1 following lowering of the dam:
• lowering of Marmot Dam by about 7.6 m in Year 1, and leaving the lower 6.7 m in place until the following year,
• lowering of Marmot Dam by about 9 m in Year 1, and leaving the lower 5.2 m in place until the following year, and
• lowering of Marmot Dam by 10.7 m in Year 1, and leaving the lower 3.7 m in place until the following year.
In addition, we modeled the effects of wet and dry water years for dam lowering of 9 m, using techniques identical to those used to model Alternative B (only average hydrologic conditions were modeled for the 7.6-m and 10.7-m lowering scenarios). Modeling for Alternative D was only completed for average hydrologic conditions and average grain size distributions of reservoir sediment. Results of these model runs are described below. Additional discussion of the geomorphic effects of sediment release under Alternatives B, C, and D and associated effects on anadromous salmonids is
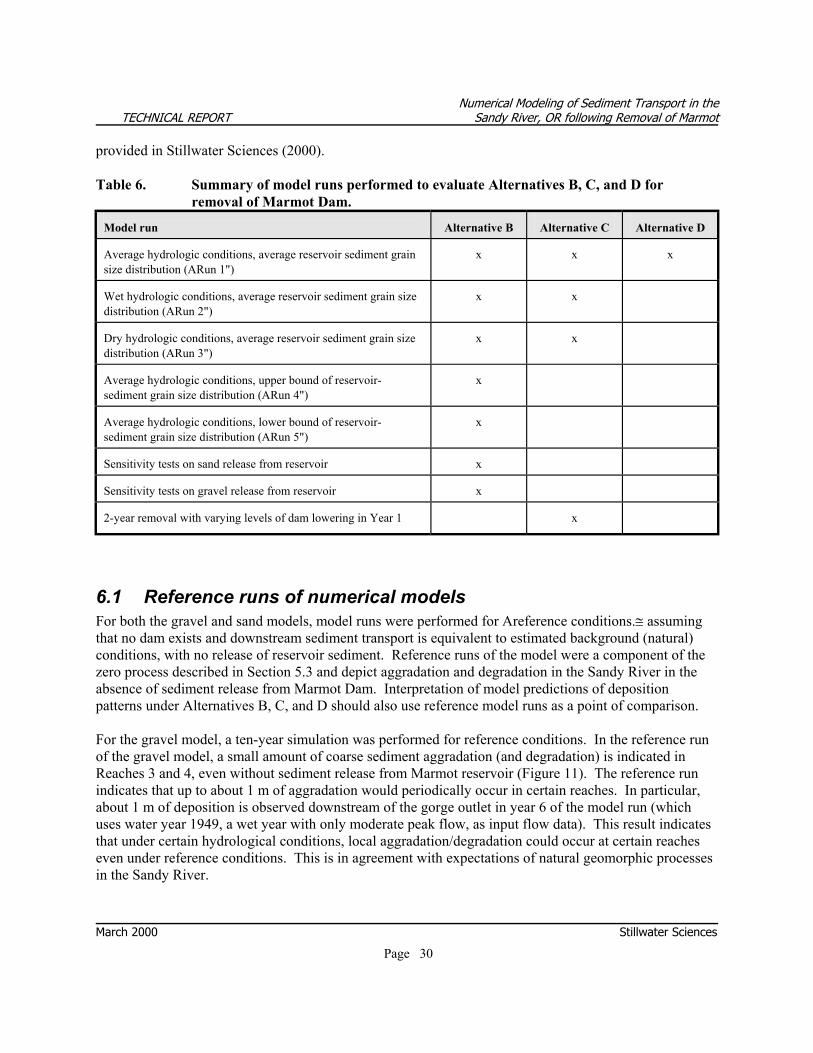
Numerical Modeling of Sediment Transport in the TECHNICAL REPORT Sandy River, OR following Removal of Marmot
March 2000 Stillwater Sciences Page 30
provided in Stillwater Sciences (2000). Table 6. Summary of model runs performed to evaluate Alternatives B, C, and D for
removal of Marmot Dam. Model run
Alternative B
Alternative C
Alternative D
Average hydrologic conditions, average reservoir sediment grain size distribution (ΑRun 1")
x
x
x
Wet hydrologic conditions, average reservoir sediment grain size distribution (ΑRun 2")
x
x
Dry hydrologic conditions, average reservoir sediment grain size distribution (ΑRun 3")
x
x
Average hydrologic conditions, upper bound of reservoir-sediment grain size distribution (ΑRun 4")
x
Average hydrologic conditions, lower bound of reservoir-sediment grain size distribution (ΑRun 5")
x
Sensitivity tests on sand release from reservoir
x
Sensitivity tests on gravel release from reservoir
x
2-year removal with varying levels of dam lowering in Year 1
x
6.1 Reference runs of numerical models For both the gravel and sand models, model runs were performed for Αreference conditions.≅ assuming that no dam exists and downstream sediment transport is equivalent to estimated background (natural) conditions, with no release of reservoir sediment. Reference runs of the model were a component of the zero process described in Section 5.3 and depict aggradation and degradation in the Sandy River in the absence of sediment release from Marmot Dam. Interpretation of model predictions of deposition patterns under Alternatives B, C, and D should also use reference model runs as a point of comparison. For the gravel model, a ten-year simulation was performed for reference conditions. In the reference run of the gravel model, a small amount of coarse sediment aggradation (and degradation) is indicated in Reaches 3 and 4, even without sediment release from Marmot reservoir (Figure 11). The reference run indicates that up to about 1 m of aggradation would periodically occur in certain reaches. In particular, about 1 m of deposition is observed downstream of the gorge outlet in year 6 of the model run (which uses water year 1949, a wet year with only moderate peak flow, as input flow data). This result indicates that under certain hydrological conditions, local aggradation/degradation could occur at certain reaches even under reference conditions. This is in agreement with expectations of natural geomorphic processes in the Sandy River.
Numerical Modeling of Sediment Transport in the TECHNICAL REPORT Sandy River, OR following Removal of Marmot
March 2000 Stillwater Sciences Page 31
Reference runs of the sand model were also completed. These indicate TSS concentrations fluctuating between about 90 and 150 ppm at the site of Marmot Dam, with lower concentrations further downstream (Figure 12), based on the assumed background sediment concentration. Reference runs also show sand aggradation occurring in Reach 5.
6.2 Alternative B: Single-season dam removal, minimal sediment removal
Under this alternative, only a minimal amount of sediment would be excavated from behind the dam (i.e., only as required to facilitate dam removal activities). All of the remaining reservoir sediment would be released downstream following dam removal. Approximately 750,000 m3 of sediment, consisting of approximately 35% sand (and finer) and 65% gravel (and coarser) is stored in the reservoir according to the Squier Associates (2000) coring study. Model runs for Alternative B assumed a slightly greater amount of sediment is in the reservoir and would be released downstream (800,000 m3) than suggested by Squier Associates (2000). This volume difference reflects our assumption that the upstream extent of the reservoir deposit may extend further upstream than indicated by Squier Associates (2000), based on our review of PGE photogrammetry data (Figure 2), but the difference does not affect model results. Basic model runs for Alternative B are summarized in Table 6 above. We also completed numerous sensitivity analyses for Alternative B, results of which are summarized below.
6.2.1 Gravel Model Results Run 1: Average hydrologic conditions, average reservoir sediment grain size distribution Figure 13 illustrates model predictions of the downstream movement of coarse sediment out of the reservoir and resulting increases in bed elevation (aggradation) downstream of Marmot Dam, under average hydrologic conditions (see Section 5.1.2) and over a 20-year period. These model results indicate that, in the first year following removal, coarse sediment would move downstream into the portion of Reach 1 immediately downstream of the dam, creating a debris fan up to a maximum of about 4 m thick, with small amounts of deposition predicted further downstream in Reach 1 and in Reach 3. In subsequent years, additional sediment would move out of the reservoir, resulting in a gradual increase in deposition thickness in Reach 1, reaching a maximum of about 1 m on a reach-averaged basis. The aggradational wave is predicted to travel quickly through most of the gorge (Reach 2), with aggradation increasing in the downstream end of the gorge and the upstream end of Reach 3 from Years 1 through 10. Aggradation is predicted to gradually build to a maximum predicted thickness of about 1.5Β2 m in the upper portion of Reach 3 (9Β13 km downstream of the dam), where the channel widens and decreases in gradient (Figure 13). In Reach 1, the greatest amount of aggradation would be expected in the early years following dam removal, while in Reach 3, aggradation would be expected to show gradual increases through the first 10 years. After the first ten years, deposition thickness in Reach 3 would gradually decrease as the sediment wave is transported downstream. The model predicts small amounts of aggradation (typically <0.5 m) downstream of the Bull Run River confluence, although this aggradation is similar in magnitude to aggradation predicted in a reference run of the model and is not likely to be distinguishable from natural depositional processes.
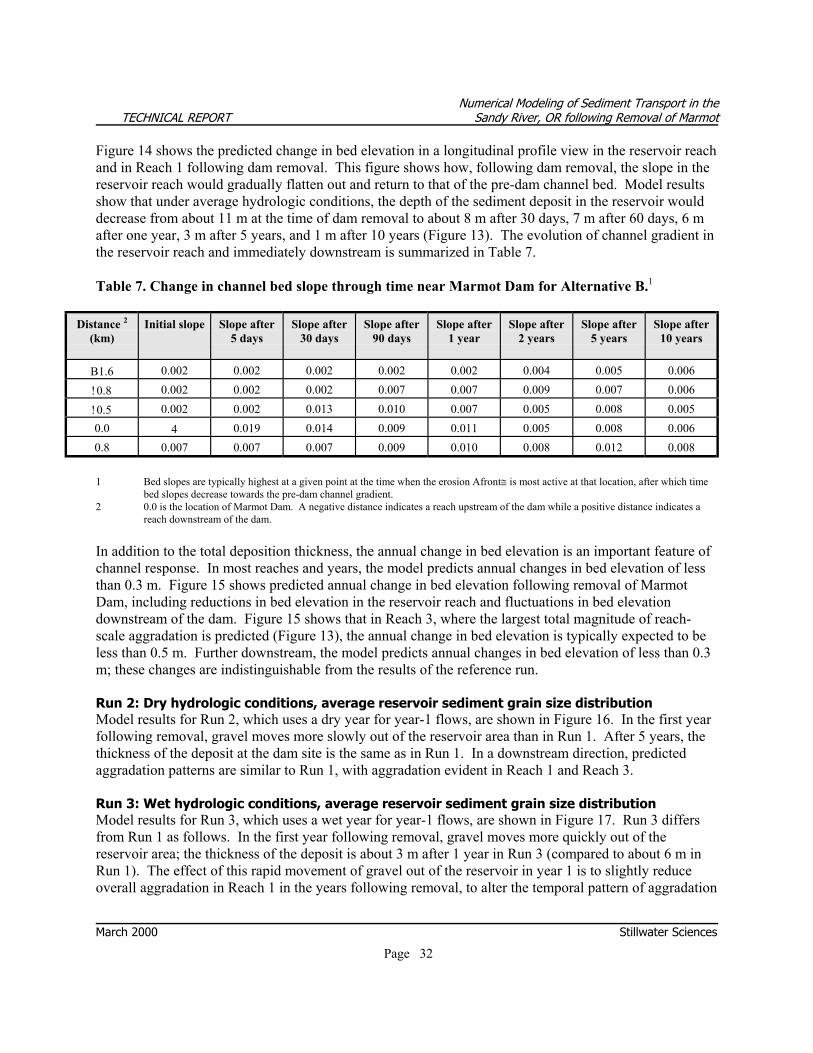
Numerical Modeling of Sediment Transport in the TECHNICAL REPORT Sandy River, OR following Removal of Marmot
March 2000 Stillwater Sciences Page 32
Figure 14 shows the predicted change in bed elevation in a longitudinal profile view in the reservoir reach and in Reach 1 following dam removal. This figure shows how, following dam removal, the slope in the reservoir reach would gradually flatten out and return to that of the pre-dam channel bed. Model results show that under average hydrologic conditions, the depth of the sediment deposit in the reservoir would decrease from about 11 m at the time of dam removal to about 8 m after 30 days, 7 m after 60 days, 6 m after one year, 3 m after 5 years, and 1 m after 10 years (Figure 13). The evolution of channel gradient in the reservoir reach and immediately downstream is summarized in Table 7. Table 7. Change in channel bed slope through time near Marmot Dam for Alternative B.1
Distance 2 (km)
Initial slope
Slope after
5 days
Slope after
30 days
Slope after
90 days
Slope after
1 year
Slope after
2 years
Slope after
5 years
Slope after
10 years
Β1.6
0.002
0.002
0.002
0.002
0.002
0.004
0.005
0.006
!0.8
0.002
0.002
0.002
0.007
0.007
0.009
0.007
0.006 !0.5
0.002
0.002
0.013
0.010
0.007
0.005
0.008
0.005
0.0
4
0.019
0.014
0.009
0.011
0.005
0.008
0.006 0.8
0.007
0.007
0.007
0.009
0.010
0.008
0.012
0.008
1 Bed slopes are typically highest at a given point at the time when the erosion Αfront≅ is most active at that location, after which time
bed slopes decrease towards the pre-dam channel gradient. 2 0.0 is the location of Marmot Dam. A negative distance indicates a reach upstream of the dam while a positive distance indicates a
reach downstream of the dam. In addition to the total deposition thickness, the annual change in bed elevation is an important feature of channel response. In most reaches and years, the model predicts annual changes in bed elevation of less than 0.3 m. Figure 15 shows predicted annual change in bed elevation following removal of Marmot Dam, including reductions in bed elevation in the reservoir reach and fluctuations in bed elevation downstream of the dam. Figure 15 shows that in Reach 3, where the largest total magnitude of reach-scale aggradation is predicted (Figure 13), the annual change in bed elevation is typically expected to be less than 0.5 m. Further downstream, the model predicts annual changes in bed elevation of less than 0.3 m; these changes are indistinguishable from the results of the reference run. Run 2: Dry hydrologic conditions, average reservoir sediment grain size distribution Model results for Run 2, which uses a dry year for year-1 flows, are shown in Figure 16. In the first year following removal, gravel moves more slowly out of the reservoir area than in Run 1. After 5 years, the thickness of the deposit at the dam site is the same as in Run 1. In a downstream direction, predicted aggradation patterns are similar to Run 1, with aggradation evident in Reach 1 and Reach 3. Run 3: Wet hydrologic conditions, average reservoir sediment grain size distribution Model results for Run 3, which uses a wet year for year-1 flows, are shown in Figure 17. Run 3 differs from Run 1 as follows. In the first year following removal, gravel moves more quickly out of the reservoir area; the thickness of the deposit is about 3 m after 1 year in Run 3 (compared to about 6 m in Run 1). The effect of this rapid movement of gravel out of the reservoir in year 1 is to slightly reduce overall aggradation in Reach 1 in the years following removal, to alter the temporal pattern of aggradation
Numerical Modeling of Sediment Transport in the TECHNICAL REPORT Sandy River, OR following Removal of Marmot
March 2000 Stillwater Sciences Page 33
in reach 3 (with thicker deposition in the first several years after removal compared to Run 1, but with similar magnitude of aggradation over a 10-year scale), and to slightly increase aggradation in Reach 4 compared to Run 1. As in Run 1, no aggradation is predicted in Reach 2 (the gorge) and the greatest aggradation is predicted for Reach 3. Runs 4 and 5: ΑUpper bound≅ and Αlower bound≅ grain size distributions of reservoir sediment (with average hydrologic conditions) In addition to varying the hydrologic input data, we also conducted model runs for Alternative B with different assumed grain size distributions for the reservoir deposit (with average hydrologic conditions). Runs 1, 2, and 3 above assumed an Αaverage≅ grain size distribution (Figure 9). Using the Αupper bound≅ and Αlower bound≅ grain size distributions shown in Table 4 and Figure 9 causes only slight changes in the predicted pattern of sediment deposition, including prediction of small amounts of short-term deposition (<0.5 m) in Reach 2 (Figures 18, 19). In summary, modeling of Alternative B indicates that variations in hydrologic conditions and in assumed grain size distributions for the reservoir deposit would result in differences in the rate of erosion of the reservoir deposit but would cause only slight changes in the predicted spatial and temporal pattern of downstream gravel deposition. Sensitivity test on gravel model to simulate reservoir incision As discussed in Section 3.3, gravel erosion from the reservoir is assumed to be laterally uniform in the model, while in reality, incision of a channel through the reservoir reach will likely occur to some extent following dam removal. We performed a sensitivity analysis to assess how an increase in the rate of gravel transport out of the reservoir resulting from channel incision could affect downstream deposition patterns. In this sensitivity test, we assumed that channel incision in the reservoir reach would be most likely when the local channel bed slope is high, as would be the case at the downstream end of the reservoir deposit immediately following dam removal, and that this could result in a gravel transport rate that is greater than predicted by the Parker equation. The increase in sediment transport rate resulting from downcutting is therefore hypothesized to be an incremental function of bed slope. To simulate this, we applied a multiplier (α) that varies with bed slope to the gravel transport rate calculated by the Parker equation for channel bed slopes above 0.01. The transport rate out of the reservoir calculated by the Parker equation is thereby increased by a factor of up to 10 in this sensitivity test, depending on local bed slope. Figure 20 shows the relationship between the multiplier (α) applied to the gravel transport rate and channel bed slope. This multiplier, including the values of Αa≅ and Αn≅ assumed in deriving it (see Figure 20), are purely hypothetical and are not based on any data; we developed them only for the purposes of testing accelerated gravel transport from the reservoir as a result of incision. Figures 21 and 22 show downstream deposition patterns and the evolution of the long profile in the vicinity of the reservoir reach associated with the simulation of accelerated gravel transport in this sensitivity test. These results indicate that, if the down cutting process affects the gravel transport rate as is assumed in this sensitivity test, there will be only short term effect on the pattern of gravel erosion from the reservoir and downstream deposition. This is because slopes will be steepest immediately following dam removal at the downstream end of the sediment deposit, but downstream transport of this material would result in reduced bed slopes (and sediment transport rates) within a short time, even if channel

Numerical Modeling of Sediment Transport in the TECHNICAL REPORT Sandy River, OR following Removal of Marmot
March 2000 Stillwater Sciences Page 34
incision does occur. This sensitivity test does not fully simulate the effects of channel incision on sediment transport patterns out of the reservoir reach, but it does capture one potential effect of incision (i.e., transport rates that are higher than calculated by the Parker equation when bed slopes are steep). Potential effects of incision on accelerating the rate of sand release are simulated in sensitivity tests on the sand model, as described in Section 6.2.2 below.
6.2.2 Sand Model Results As with the gravel model, five model runs were completed to predict sand transport under Alternative B, with the model runs representing the same discharge and grain size variations as for the gravel model (Table 6). Additional model runs to test the sensitivity of the results of the sand model to assumptions about the rate of sand release from the reservoir were also performed and are discussed below. Runs 1Β5: Variations in hydrologic conditions and grain size distribution of reservoir sediment After the dam is removed and the channel begins to incise into the reservoir deposit, sand and fine sediment will be mobilized from the reservoir deposit, traveling downstream mostly as suspended load. No differences in sand aggradation patterns or magnitude are discernable between the five model runs. Modeling of sand transport indicates that sand aggradation is most likely to occur in the lower 6 mi (10 km) of the Sandy River (Reach 5), and that essentially no aggradation would occur further upstream. Reach 5 has the lowest transport capacity of any reach in the Sandy River, reflecting its greater width and low gradient, and is currently sand-bedded in its lower portion. The model predicts deposition thicknesses of up to about 0.4 m in Reach 5 (Figure 23; note that only Reach 5 is depicted in this figure), with the greatest aggradation expected to occur in the first year following removal of Marmot Dam. The deposition thickness could be much greater than this, however, because of the potential backwater effect of the Columbia River. Because the model does not account for this backwater effect, we have a low level of confidence in model results in terms of actual magnitude of deposition thickness in Reach 5. Figure 24 shows the pattern of sand deposition at selected locations in Reach 5 during the first two years following removal of Marmot Dam and indicates that the magnitude of sand aggradation would fluctuate both seasonally and between years. Aggradation in Reach 5 is predicted to occur mainly in the lower 3 km of the Sandy River (with lesser aggradation in the upper part of the reach), which roughly corresponds to the location of the gravel/sand transition area in the Sandy River (i.e., very little gravel is found in the channel bed downstream of this portion, whereas upstream the bed contains both sand and gravel). Observations in other river systems suggest that the gravel/sand transition zone is typically an area of active deposition (Dietrich et al. 1999). Modeling indicates that sand would be metered out of the reservoir area in the years following dam removal, with the magnitude of sand transport depending on the rate of movement of gravel out of the reservoir. The rate of sand transport out of the reservoir varies with flows, as indicated by the wet, average, and dry hydrologic conditions that were modeled (Figure 25), and with the assumed grain size distribution of the reservoir deposit (average, upper bound, lower bound) (Figure 26). In all model runs, the magnitude of sand transport out of the reservoir is expected to be largest in the first winter following dam removal, although sand transport out of the reservoir continues for the duration of the model runs
Numerical Modeling of Sediment Transport in the TECHNICAL REPORT Sandy River, OR following Removal of Marmot
March 2000 Stillwater Sciences Page 35
(Figures 25, 26). Figure 27 shows predicted sand release following removal of Marmot Dam for Alternatives B and D, based on average hydrologic conditions. As discussed in Section 3.3, the rate of sediment release from the reservoir is a key uncertainty in this modeling effort, and sensitivity analyses to evaluate various rates of sand release are discussed below. According to model results, sand release from the reservoir would not result in large increases in total suspended sediment (TSS). Modeling indicates that, between Marmot Dam and the Bull Run confluence, peak TSS of about 500 ppm would occur in the first winter following dam removal under average hydrologic conditions (Figure 28). TSS would generally remain between 100 and 200 ppm during the first two years after removal, with increases above this level associated with high flows during the second winter. Downstream of the Bull Run River, TSS levels would be lower because of the dilution effect of flows from the Bull Run River. TSS levels associated with dam removal are relatively low because of the nature of the sediment deposit, in which fine sediment deposits are armored by a coarser surface layer (Figure 10) and are therefore released gradually, rather than as one large pulse. Background TSS levels in the Sandy River are not known; modeled results should be considered indicative of potential increases in TSS above background levels due to sediment release from Marmot Reservoir. Predictions of TSS concentration show limited sensitivity to the assumed grain size distribution: TSS levels are highest for the assumed lower-bound (i.e., finer) distribution and lowest for the assumed upper-bound (i.e., coarser) distribution, but they remain within the range described above for all scenarios. For the modeled hydrologic scenarios (Runs 1Β3), TSS levels are lowest for Run 2 (dry conditions in year 1), generally remaining below 200 ppm, and are similar in Runs 1 (average conditions) and 3 (wet conditions). Sensitivity tests of accelerated sand release from Marmot reservoir As discussed above, modeling suggests that sand will be metered out of the reservoir in association with transport of gravel, resulting in only small increases in TSS and downstream deposition. Incision, however, could accelerate the exposure and downstream transport of the sand layer compared to basic model predictions of reservoir erosion patterns. In addition, the use of the gravel model to estimate the rate of sand release from the reservoir, as desribed in Section 3.3, contains considerable uncertainty. To address these uncertainties, we completed sensitivity tests in which the rate of sand release from the reservoir was increased by 5-fold and 10-fold over the rates of sand release predicted by the model based on predicted shear stresses and laterally uniform transport in the reservoir reach. These analyses tested the effects of accelerated sand release (compared with the slower release predicted by the basic model) on downstream sand deposition patterns and total suspended sediment (TSS) concentrations under Alternative B. The results of these tests provide an upper bound on downstream sand transport and potential downstream impacts. The results of the test for the 10-fold and 5-fold increases in sand release are shown in Figures 29a and 29b, and Figures 30a and 30b, respectively. Increasing the rate of sand release by a factor of 5 or 10 would result in complete sand evacuation from the reservoir in about 4 and 2 years, respectively. The sensitivity analysis for the 10-fold increase indicates that sand release from the reservoir at ten times the expected rate would result in a peak TSS concentration of approximately 4,000 ppm in the first winter following dam removal (compared with a maximum of about 500 ppm for basic model runs under this alternative), with other spikes in TSS above 500 ppm during storm events (Figure 29b). Otherwise TSS
Numerical Modeling of Sediment Transport in the TECHNICAL REPORT Sandy River, OR following Removal of Marmot
March 2000 Stillwater Sciences Page 36
would generally remain between 100 and 400 ppm between Marmot Dam and the Bull Run River confluence, resembling assumed background conditions during late summer and early fall low-flow conditions. In the second winter following dam removal, TSS would increase above 400 ppm during storms, with a maximum of 2,000 ppm, and decline to near-background conditions during late summer and fall (Figure 29b). Increasing the rate of sand release by 10-fold would also result in additional deposition downstream, including deposition of about 0.2Β0.4 m in the downstream end of Reach 4 (where no deposition is predicted for basic model runs) and maximum aggradation of about 1 m in Reach 5 (Figure 29a) (compared to about 0.4 m in basic model runs). Aggradation is predicted throughout Reach 5 in this sensitivity test, with maximum aggradation predicted within about 2 km of the Columbia River. The results of the sensitivity test assuming sand release at 5 times the rate predicted by the model are shown in Figures 30a and 30b. As would be expected, these results are intermediate between the results of basic model runs and the test assuming a 10-fold increase. Maximum TSS is predicted to be about 2,000 ppm, with TSS of about 200 to 1,000 ppm associated with high-flow events during the first two years following dam removal (Figure 30b). Maximum thickness of sand deposition is predicted to be almost 1 m (Figure 30a), with the extent and duration of sand aggradation lesser than indicated for the test assuming a 10-fold increase in sand release. Compared to basic model runs, aggradation is predicted to extend an additional 3 km upstream (within Reach 5) under this sensitivity test. If sand release occurred faster than predicted by the basic model runs, as described in these sensitivity tests, this would increase the magnitude of potential impacts but would shorten their duration, because sand would be transported out of the Sandy River more rapidly. The model results shown here are only for the first two years. In basic model runs, release of sediment over a longer period could result in increases in TSS for several winters, and continued potential downstream deposition.
6.3 Alternative C: Removal of top of dam in Year 1, complete dam removal in Year 2 with sand layer excavation up to a point 830 m upstream of Marmot Dam
For Alternative C, we used numerical modeling to test the effects of lowering Marmot Dam by different amounts in Year 1 on sediment transport patterns and to estimate downstream deposition patterns under these scenarios. We carried out the following model runs for Alternative C, based on average hydrologic conditions in Year 1 following lowering of the dam:
• lowering of Marmot Dam by about 7.6 m in Year 1, and leaving the lower 6.7 m in place until the following year,
• lowering of Marmot Dam by about 9 m in Year 1, and leaving the lower 5.2 m in place until the following year, and
• lowering of Marmot Dam by 10.7 m in Year 1, and leaving the lower 3.7 m in place until the following year.
In addition, we modeled the effects of wet and dry water years for dam lowering of 9 m, using techniques
Numerical Modeling of Sediment Transport in the TECHNICAL REPORT Sandy River, OR following Removal of Marmot
March 2000 Stillwater Sciences Page 37
identical to those used to model Alternative B (only average hydrologic conditions were modeled for the 7.6-m and 10.7-m lowering scenarios). Basic runs for Alternative C, including modeling of reservoir erosion and downstream deposition, were only extended for one year. After the first year, sediment would be removed up to 830 m upstream of Marmot Dam and the rest of the dam would be removed, after which time Alternative C can be considered the same as Alternative D in terms of sediment transport and deposition (see Section 6.4 for discussion of Alternative D).
6.3.1 Gravel model results Modeling results show that if the top 9 m of Marmot Dam were removed, approximately 25% of the reservoir sediment would be transported downstream in Year 1, consisting mostly of gravel but including a small sand component. The thickness of the reservoir deposit would decrease from approximately 11 m at the time of dam removal to about 6 m after 1 year under average hydrologic conditions (Figure 31, 32). This result is similar to the amount of reservoir erosion predicted in Year 1 under Alternative B, in which the entire dam would have been removed in Year 1. Likewise, there is little difference in the amount of lowering of the sediment between removal of 9 m and 10.7 m of the dam after 1 year. If the dam is lowered only 7.6 m, however, less than 20% of the total reservoir sediment would be eroded downstream, and the height of the sediment is reduced to 6.5 m after 1 year, about 0.6 m less than the other scenarios. Hydrologic conditions would also affect the removal of sediment immediately upstream of the dam. One year after a 9-m lowering, the depth of the sediment deposit is predicted to be 6.7 m and 4.4 m under dry and wet conditions, respectively, versus 5.9 m under average hydrologic conditions. As noted above, modeling of sediment deposition downstream of Marmot Dam was only carried out for the first year following dam lowering, because in subsequent years this alternative would resemble Alternative D. The greatest amount of aggradation is predicted immediately downstream of the dam (approximately 3 m), as sediment is eroded from the reservoir and a debris fan forms in the first 1 km below the dam. Further downstream, modeling predicts that under average hydrologic conditions, downstream deposition thickness would generally be less than 0.6 m, regardless of the level of dam lowering, with the largest amount of aggradation in Reach 1 and less aggradation in Reach 3 (Figure 31). Model predictions indicate that altering the level of dam removal from 7.6 to 10.7 m would not significantly change the amount of aggradation downstream (Figures 33, 34). Altering the hydrologic regime, however, would affect the amount of downstream aggradation. In a wet water year, maximum aggradation height would be approximately double and much more extensive than average water year values (Figure 35), whereas under dry conditions in Year 1, there would be little or no aggradation after the first 1 km downstream of the dam (Figure 36). As noted above, the amount of sediment carried downstream in Year 1 with a lowered dam left in place is predicted to be similar to that under Alternative B. The degree to which the sand layer would be exposed in Year 1 near the downstream end of the reservoir deposit would depend on the level of dam removal (7.6, 9 or 10.7 ft) and hydrologic conditions. There was little difference between lowering the dam 9 m versus lowering the dam 10.7 m during average flow years (both of which are predicted to be similar to Alternative B), but both levels of lowering would expose much more of the sand layer than if the dam was lowered 7.6 m. Hydrologic conditions in Year 1 would also influence the upstream extent (length) of the sand layer exposed. Approximately 400 m of the
Numerical Modeling of Sediment Transport in the TECHNICAL REPORT Sandy River, OR following Removal of Marmot
March 2000 Stillwater Sciences Page 38
sand layer would be exposed under wet conditions in Year 1 versus approximately 215 m under dry conditions in Year 1.
6.3.2 Sand model results Under this alternative, the magnitude of downstream sand transport is predicted to be about 35,000 m3 for lowering of 9 m and average hydrologic conditions, which is similar to the amount predicted for Year 1 under Alternative B. This includes both the sand fraction of the gravel layer (Unit 1) and sand from the exposed portion of the sand layer (Unit 2). Downstream deposition and TSS patterns are therefore similar to those predicted for Year 1 under Alternative B. Downstream sand transport was not modeled after Year 1 for Alternative C but would be similar to Alternative D.
6.4 Alternative D: Removal of sediments to the bottom of the sand layer and to a point 830 m upstream of Marmot Dam
Under this alternative, sediment would be excavated from the dam up to about 830 m upstream. This would allow excavation of most of the fine sediment in the reservoir and of the majority of the overall amount of sediment in the reservoir. Following this excavation, approximately 190,000 m3Β350,000 m3, most of which is believed to consist of coarse material, would remain in the reservoir and thus be available for downstream fluvial transport. This range reflects uncertainty in the location of the pre-dam channel bed in the upper end of the reservoir reach and in the upstream extent of the reservoir deposit. The estimate at the upper end of the range was based on inferences about the location of the pre-dam drawn from PGE photogrammetry (Figure 2). Numerical model runs for this alternative assumed that the amount of sediment at the upper end of this range would be transported downstream. If the volume of sediment after excavation is at the lower end of this range (190,000 m3), the magnitude of downstream deposition may be lower than indicated by the model results presented below. Modeling for Alternative D was only completed for average hydrologic conditions and average grain size distributions of reservoir sediment; no wet and dry conditions were modeled.
6.4.1 Gravel model results In modeling for this alternative, the sediment wedge behind the reservoir at the time of dam removal was assumed (1) to begin about 830 m upstream of Marmot Dam, reflecting the excavation of a portion of the reservoir sediment; (2) to have a thickness at its downstream end of about 7 m, reflecting the estimated depth of the reservoir deposit at this point; and (3) to have a volume of 350,000 m3, reflecting a conservative estimate of the amount of sediment remaining upstream of the 830-m point, as described above. Figures 37 and 38 show results of the gravel model run for Alternative D. Modeling predicts that after one year under average hydrologic conditions, the thickness of remaining sediment in the reservoir would be less than 3 m, and after two years, the rate of change in the thickness of remaining sediment would be slow (Figures 37, 38). Modeling also indicates that the gradient in the reservoir reach flattens out in a short time following dam removal (Figure 38). Downstream transport of reservoir sediment would result in deposition in the downstream portion of the reservoir (from which sediments would have
Numerical Modeling of Sediment Transport in the TECHNICAL REPORT Sandy River, OR following Removal of Marmot
March 2000 Stillwater Sciences Page 39
been previously excavated), a very small amount of deposition in Reach 1 (< 0.5 m), no deposition in the gorge (Reach 2), and deposition of less than 1 m downstream of the gorge (Reach 3) (Figure 37). In Reaches 4 and 5, the small amount of deposition indicated by modeling is similar to that predicted by reference runs of the model (as is the case for model runs for Alternatives B and C).
6.4.2 Sand model results Although a large amount of the sand in the reservoir would be excavated under Alternative D, some sand would likely remain. Our model assumptions are conservative with respect to the amount of sand that may remain in the reservoir, assuming that the sand layer extends slightly further upstream than suggested by Squier Associates (2000). Predicted magnitudes of sand aggradation and TSS are slightly lower than under Alternative B (Figure 39)4. The model predicts that nearly all sand would be eroded in the first year, with only very small amounts of sand released in subsequent years. This differs from Alternative B, in which larger amounts of sand are transported downstream in the various years following removal. Figure 27 compares rates of daily sand release over a 10-year period for Alternatives B and D.
7. DISCUSSION The one-dimensional model predictions of sediment transport and deposition patterns following removal of Marmot Dam that are presented in Section 6 provide a basis for evaluating Alternatives B, C, and D for removal of the dam. Stillwater Sciences (2000) includes interpretation of these model results in terms of the geomorphic effects and potential impacts on anadromous salmonid habitats and populations of the various options for removing Marmot Dam.
4Results of sand aggradation under Alternative D are not presented graphically because they are similar to those
depicted in Figure 23 for Alternative B.
All model runs indicate that the coarse sediment stored behind Marmot Dam would move downstream by both translation and dispersion. Under Alternatives B and C, the sediment wave would first move into Reach 1, creating a debris fan immediately downstream of the dam. Under Alternative D, in which some reservoir sediment is excavated before dam removal, initial deposition would occur in the portion of the reservoir reach that had been excavated. In subsequent years, as additional sediment is transported out of the reservoir, an aggradational wave is first predicted to grow in the downstream portion of Reach 1, followed by increased deposition thicknesses in the upstream end of Reach 3. The largest amount of deposition is typically predicted in Reach 1, immediately downstream of Marmot Dam, and in the upstream end of Reach 3 (about 9 to 13 km downstream of the dam), where channel width increases and channel gradient decreases. Predicted thicknesses of gravel deposition are greatest under Alternative B,

Numerical Modeling of Sediment Transport in the TECHNICAL REPORT Sandy River, OR following Removal of Marmot
March 2000 Stillwater Sciences Page 40
in which the largest amount of sediment would be released from the dam. On a reach-average and time-average basis, patterns of downstream thickness of gravel deposition show limited sensitivity to variations in hydrologic conditions and assumed grain size distribution of the reservoir deposit. Model runs for all alternatives also suggest relatively small increases in total suspended sediment (TSS) concentration and downstream thickness of sand deposition, with sand aggradation confined to the lower 10 km of the Sandy River. There is considerable uncertainty in the pattern of sand release from the reservoir, however, and sensitivity tests evaluating accelerated rates of sand release suggest that the magnitude of increases in TSS and sand aggradation could be greater than for basic model runs. Several considerations that should be taken into account when interpreting the results of the gravel and sand models developed for the Sandy River are highlighted here. As discussed in Section 3.4, both the theoretical development of the models and the input data we used contain uncertainty. The results of model simulations should be considered in the context of these uncertainties and should be interpreted in conjunction with the results of the sensitivity tests we performed. We performed sensitivity tests that were designed to test the key areas of potential uncertainty in model results, including sand and gravel release from the reservoir and incision of the reservoir deposit, assumed roughness heights, hydrologic conditions, and grain size distribution of reservoir sediment. We did not complete sensitivity tests for all input parameters in the model that contain uncertainty (e.g., background gravel transport rates, abrasion coefficients, friction coefficients). As discussed above, model predictions of reservoir erosion patterns contain uncertainties because one-dimensional modeling does not capture processes such as channel incision in the reservoir reach and lateral migration. In the model, sediment transport out of the reservoir area is driven by shear stress (i.e., as indicated by the Parker [1990a] bedload transport equation) and is assumed to be laterally uniform. Erosion of reservoir sediment would in fact likely result in incision of a channel within the valley walls, resulting in an accelerated rate of sand and gravel transport out of the reservoir in the incised portions of the reservoir cross section and accelerated exposure of the sand layer of the reservoir deposit, compared to model predictions based on the assumption of laterally uniform erosion. This could also increase the time required for sediment to be eroded from areas along the margin of the reservoir. Sensitivity tests of the gravel model that simulated accelerated gravel release due to potential incision under Alternative B indicated that accelerated gravel transport would have only a short-term effect following dam removal. Further downstream, coarse sediment deposition patterns are not likely sensitive to uncertainties pertaining to reservoir erosion. Accelerated sand release (compared with the gradual metering predicted by the basic model), however, could have greater effects, resulting in larger-magnitude increases in TSS and downstream sand deposition than predicted by basic model runs, although this would be accompanied by more rapid evacuation of sand from the reservoir reach.
Numerical Modeling of Sediment Transport in the TECHNICAL REPORT Sandy River, OR following Removal of Marmot
March 2000 Stillwater Sciences Page 41
Modeled deposition thicknesses are on a cross-section averaged basis, but sediment deposition will likely be concentrated in current depositional areas (e.g., associated with alluvial bars or momentum defects). Sediment deposition may therefore be substantially higher or lower along a cross section and throughout a reach than predicted by the model. The thickness of sand deposition, even more than for gravel, would likely exhibit strong lateral variation, with the greatest deposition occurring in areas of lower shear stress (T. Lisle, pers. comm., 2000). Sand deposition also could exhibit seasonal variation that is not captured by the model, particularly if sand transport out of the reservoir reach occurs during low-flow periods or where sand deposits occur on the receding limb of high-flow events. In addition, although no sand deposition is predicted upstream of Reach 5, localized deposition may occur in wider reaches of the river. Model results are presented mainly in terms of the predicted magnitude of deposition thickness (aggradation). The rate of change of aggradation (and degradation) is also important (Figure15), particularly in terms of the biological impacts of aggradation and degradation. In most reaches and in most years that were modeled, particularly with increasing time after dam removal, the rate of change in bed elevation is low (<0.5 m/yr); such changes may be indistinguishable from natural scour and fill processes. Examination of a long-profile view (Figure 14) shows that at the end of the model run (20 years), the long profile is indistinguishable from the expected pre-dam long profile. An additional issue of concern in terms of sand modeling is the potential for the backwater effect of the Columbia River to increase sand deposition in the delta area of the Sandy River (the lower portion of Reach 5) compared to model predictions. The sand model does not account for this backwater effect because of difficulties in predicting how Columbia River flows affect water stage in the lower Sandy River and the uncertainty of the combined flow conditions in the Columbia and Sandy rivers following dam removal. If flows are high in the Columbia River at the same time as sand from Marmot Reservoir is being transported downstream in the Sandy River, this would create a backwater effect in Reach 5 (i.e., gradient and velocity would be reduced), and increased deposition (compared to model predictions) could occur. Sand aggradation could be lower than model predictions in Reach 5, however, if deposition occurs in upstream reaches, which is not predicted in basic model runs but which is likely to occur in some localized areas. This is a pioneering modeling study using state-of-the art methods of routing sand and gravel through the Sandy River following a simulated dam removal. The model has not been calibrated or verified, however, and these procedures are necessary for accurate predictions in any modeling study. Lacking this type of verification, quantitative predictions produced by the model are subject to considerable uncertainty. Despite such uncertainty, this modeling effort provides a basis for comparison of various removal alternatives and for evaluating the potential downstream impacts of sediment release under these alternatives. Monitoring following dam removal will provide a quantitative basis for calibrating and validating this model, and efforts are underway to establish monitoring protocols for pre- and post-dam removal periods. Acknowledgments We would like to thank the following peer reviewers for comments on an earlier draft of this report: Jim Pizzuto (University of Delaware), Tom Lisle (USFS), Steve Wiele (USGS), Bill Dietrich (University of California-Berkeley), and Marcelo Garcia (University of Illinois).
Numerical Modeling of Sediment Transport in the TECHNICAL REPORT Sandy River, OR following Removal of Marmot
March 2000 Stillwater Sciences Page 42
8. REFERENCES Allen, J. E. 1988. Volcanic hazard from High Cascade peaks. Oregon Geology 50: 56-63. Andrews, E. D. 1994. Marginal bed load transport in a gravel bed stream, Sagehen Creek, California. Water Resources Research 30: 2241-2250. Andrews, E. D. 2000. Bed material transport in the Virginia River, Utah. Water Resources Research 36: 585-596. Brownlie, W. R. 1981. Prediction of flow depth and sediment discharge in open channels. Report No. KH-R-43A. W. M. Keck Laboratory of Hydraulics and Water Resources, California Institute of Technology, Pasadena. Chang, H.H. 1994. Selection of gravel-tramsport formula for stream modeling. Journal of Hydraulic Engineering 120(5). Chaudhry, M. H. 1993. Open-channel flow. Prentice Hall, Englewood Cliffs, New Jersey. Collins, B. D., and T. Dunne. 1989. Gravel transport, gravel harvesting, and channel-bed degradation in rivers draining the southern Olympic Mountains, Washington, USA. Environmental Geology and Water Science 13: 213-224. Cui, Y., C. Paola, and G. Parker. 1996. Numerical simulation of aggradation and downstream fining. Journal of Hydraulic Research 34: 185-204. Cui, Y., and G. Parker. 1997. A quasi-normal simulation of aggradation and downstream fining with shock fitting. International Journal of Sediment Research 12: 68-82. Cui, Y., and G. Parker. 1998. The arrested gravel front: stable gravel-sand transitions in rivers. Part II: General numerical solution. Journal of Hydraulic Research 36: 159-182. Cui, Y., G. Parker, T. E. Lisle, J. Gott, M. E. Hansler, J. E. Pizzuto, N. E. Allmendinger, and J. M. Reed. 2000a. Sediment pulses in mountain rivers. Part 1. Experiments. Submitted to Water Resources Research (In review). Cui, Y., G. Parker, J. Pizzuto, and T. E. Lisle. 2000b. Sediment pulses in mountain rivers. Part 2. Comparison between experiments and numerical predictions. Submitted to Water Resources Research (In review). Cui, Y., and G. Parker. 2000. A numerical model for the evolution of sediment pulses in mountain rivers. Submitted to Journal of Hydraulic Engineering (In review).
Numerical Modeling of Sediment Transport in the TECHNICAL REPORT Sandy River, OR following Removal of Marmot
March 2000 Stillwater Sciences Page 43
Curtiss, D. A. 1975. Sediment yields of streams in the Umpqua River basin, Oregon. Open-File Report. U. S. Geological Survey. Dietrich, W. E. 1982. Settling velocities of natural particles. Water Resources Research 18: 1615-1626. Dietrich, W. E., G. Day, and G. Parker. 1999. The Fly River, Papua New Guinea: Inferences about river dynamics, floodplain sedimentation and fate of sediment. In Varieties of Fluvial Form. A. J. Miller and A. Gupta, editors. John Wiley & Sons Ltd. Ferguson, R. I. 1986. River loads underestimated by rating curves. Water Resources Research 22: 74-76. Grant, G. E., and A. L. Wolff. 1991. Long-term patterns of sediment transport after timber harvest, western Cascade Mountains, Oregon, USA. Pages 31-40 in N. E. Peters and D. E. Wallings, editor. Sediment and stream water quality in a changing environment: trends and explanation (Proceedings of the Vienna Symposium). IAHS Publication No. 203. International Association of Hydrological Scientists. Hansler, M.E., Sutherland, D.G., Hilton, S.J. and Lisle, T.E. (1998). Sediment wave dispersion and the analysis of a one-dimensional bedload transport model, Navarro River, California. Geol. Soc. Am., Abstracts with Programs, 29(6), A-360. Hoey, T. B. and R. I. Ferguson. 1994. Numerical simulation of downstream fining by selective transport in gravel bed rivers: Model development and illustration. Water Resources Research 30: 2251-2260. Keulegan, G.H. 1938. Laws of turbulent flow in open channels. Journal National Bureau of Standards 21, Research Paper 1151: 707-741. Larsen, K. R., and R. C. Sidle. 1980. Erosion and sedimentation data catalog of the Pacific Northwest. Report No. R6-WM-050-1981. USDA Forest Service, Pacific Northwest Region, Portland, Oregon. Lisle, T. 2000. Personal communication. Research hydrologist, USDA Forest Service. Pacific Southwest Research Station, Arcata, California. McBain and Trush. 1998. Tuolumne River corridor restoration plan, Stanislaus County, CA. Draft report. Prepared for Tuolumne River Technical Advisory Committee (Don Pedro Project, FERC License No. 2299) by McBain and Trush, Arcata, California. ODFW (Oregon Department of Fish and Wildlife). 1990. Sandy River subbasin salmon and steelhead production plan. ODFW, Portland, Oregon. ODFW. 1997. Sandy Basin fish management plan. Draft report. ODFW, Portland, Oregon. Parker, G., P. C. Klingeman, and D. G. McLean. 1982. Bedload and size distribution in paved gravel-bed streams. Journal of Hydraulic Engineering 108: 544-571.
Numerical Modeling of Sediment Transport in the TECHNICAL REPORT Sandy River, OR following Removal of Marmot
March 2000 Stillwater Sciences Page 44
Parker, G. 1990a. Surface-based bedload transport relation for gravel rivers. Journal of Hydraulic Research 28: 417-436. Parker, G. 1990b. The Acronym Series of PASCAL program for computing bedload transport in gravel rivers. External Memorandum M-200. St. Anthony Falls Laboratory, University of Minnesota. Parker, G. 1991a. Selective sorting and abrasion of river gravel. I: Theory. Journal of Hydraulic Engineering 117: 131-149. Parker, G. 1991b. Selective sorting and abrasion of river gravel. II: Application. Journal of Hydraulic Engineering 117: 159-171. Pizzuto, J. 2000. Personal communication. Professor, Department of Geology. University of Delaware. Newark, Delaware. Squier Associates. 2000. Sandy River sediment study, Bull Run Hydroelectric Project. Draft report prepared for Portland General Electric. January 2000. Stillwater Sciences. 2000. Evaluation of geomorphic effects of removal of Marmot and Little Sandy dams and potential impacts on anadromous salmonids. Preliminary final technical report prepared for Portland General Electric. March 2000. Swanson, F. J., and C. T. Dyrness. 1975. Impact of clear-cutting and road construction on soil erosion by landslides in the western Cascade Range, Oregon. Geology 1: 393-396. Swanson, F. J., R. J. Janda, and T. Dunne. 1982. Summary: sediment budget and routing studies. Pages 157-165 in F. J. Swanson, R. J. Janda, T. Dunne and D. N. Swanston, editor. Workshop on sediment budgets and routing in forested drainage basins: proceedings. General Technical Report PNW-141. U. S. Forest Service, Pacific Northwest Forest and Range Experiment Station, Portland, Oregon. Toro-Escobar, C. M., G. Parker, and C. Paola. 1996. Transfer function for the deposition of poorly sorted gravel in response to streambed aggradation. Journal of Hydraulic Research 34: 35-54. U. S. Army Corps of Engineers. 1993. HEC-6: Scour and deposition in rivers and reservoirs. User's manual. Hydrologic Engineering Center, Davis, California. USDA Forest Service. 1996. Upper Sandy watershed analysis. Review copy. Pacific Northwest Region, Mt. Hood National Forest, Oregon. USDA Forest Service. 1997. Bull Run watershed analysis. Mt. Hood National Forest, Gresham, Oregon. van Rijn, L. C. 1984. Sediment transport, Part II: Suspended load transport. Journal of Hydraulic Engineering 110: 1613-1641.

Numerical Modeling of Sediment Transport in the TECHNICAL REPORT Sandy River, OR following Removal of Marmot
March 2000 Stillwater Sciences Page 45
Wilcock, P. R. 1997. A method for predicting sediment transport in gravel-bed rivers. Department of Geography and Environmental Engineering, The Johns Hopkins University, Baltimore, Maryland. Wilcock, P. R. 1998. Two-fraction model of initial sediment motion in gravel-bed rivers. Sciences 280: 410-412.

Numerical Modeling of Sediment Transport in the TECHNICAL REPORT Sandy River, OR following Removal of Marmot
March 2000 Stillwater Sciences Page 46
List of Symbols Gravel model x: downstream distance t: time h: water depth g: acceleration due to gravity S0: bed slope Sf: friction slope Fr: Froude number λp: porosity of the deposit fG: volumetric fraction of gravel in the deposit B: channel width η: deposition thickness above arbitrary datums QG: volumetric transport rate of gravel β: volumetric abrasion coefficient of gravel pj: volumetric fraction of the j-th size range in bedload Fj: volumetric fraction of the j-th size range in surface layer Fj=: particle number fraction of the j-th size range in surface layer fIj: volumetric fraction of the j-th size range in the interface between bedload and the deposit La: surface layer thickness ψ: grain size in ψ-scale, which is the negative of the φ-scale D: grain size (mm) D0: grain size at an upstream section Dx: grain size at a downstream section Qw: water discharge θ: an empirical parameter depicting interface grain size fraction (assumed to be equal to 0.3) u*: shear velocity u: flow velocity ks: roughness height Dsg: surface layer gravel geometric mean grain size σsg: surface layer gravel geometric standard deviation Sand Model R: submerged specific gravity of sediment particles Dg: geometric mean grain size of sand σg: bed material geometric standard deviation of the sand Fg: particle Froude number v: kinematic viscosity of water u*=: shear velocity calculated as if the flow is in upper regime (intermediate shear velocity for partitioning surface and form drag) η: thickness of sand deposit over the gravel bed Qs: volumetric sand transport rate Rg: particle Reynolds number λs: porosity of sand deposit λg: porosity of the gravel bed or other roughness elements vs: particle settling velocity κ: von Karman constant (assumed to be equal to 0.4) kso: roughness height when the rough elements are completely exposed (i.e., without sand coverage) η0: thickness from the datum to the bottom of the roughness element Sf: total friction slope

Numerical Modeling of Sediment Transport in the TECHNICAL REPORT Sandy River, OR following Removal of Marmot
March 2000 Stillwater Sciences Page 47
Sf=: surface friction slope
Numerical Modeling of Sediment Transport in the TECHNICAL REPORT Sandy River, OR following Removal of Marmot
March 2000 Stillwater Sciences Page 48
ATTACHMENT A A draft version of this report was circulated for peer review in January 2000. Peer reviewers included Dr. William Dietrich (Department of Geology and Geophysics, University of CaliforniaΒBerkeley), Dr. Marcelo Garcia (Department of Civil and Environmental Engineering, University of Illinois at UrbanaΒChampaign), Dr. Thomas Lisle (U.S. Forest Service), Dr. James Pizzuto (Department of GeologyΒUniversity of Delaware), and Dr. Stephen Wiele (U.S. Geological Survey). Written comments provided by the peer reviewers on the January 2000 draft are presented in this attachment. Drs. Dietrich and Garcia provided oral comments. The January 2000 draft report included a description of the model and model results for Alternative B (including Runs 1-5 in which varying hydrologic conditions and grain size distributions of reservoir sediment were modeled). At the time of the draft, modeling for Alternatives C and D was not complete. We have attempted to address the peer reviewers= comments in the current version of the technical report.
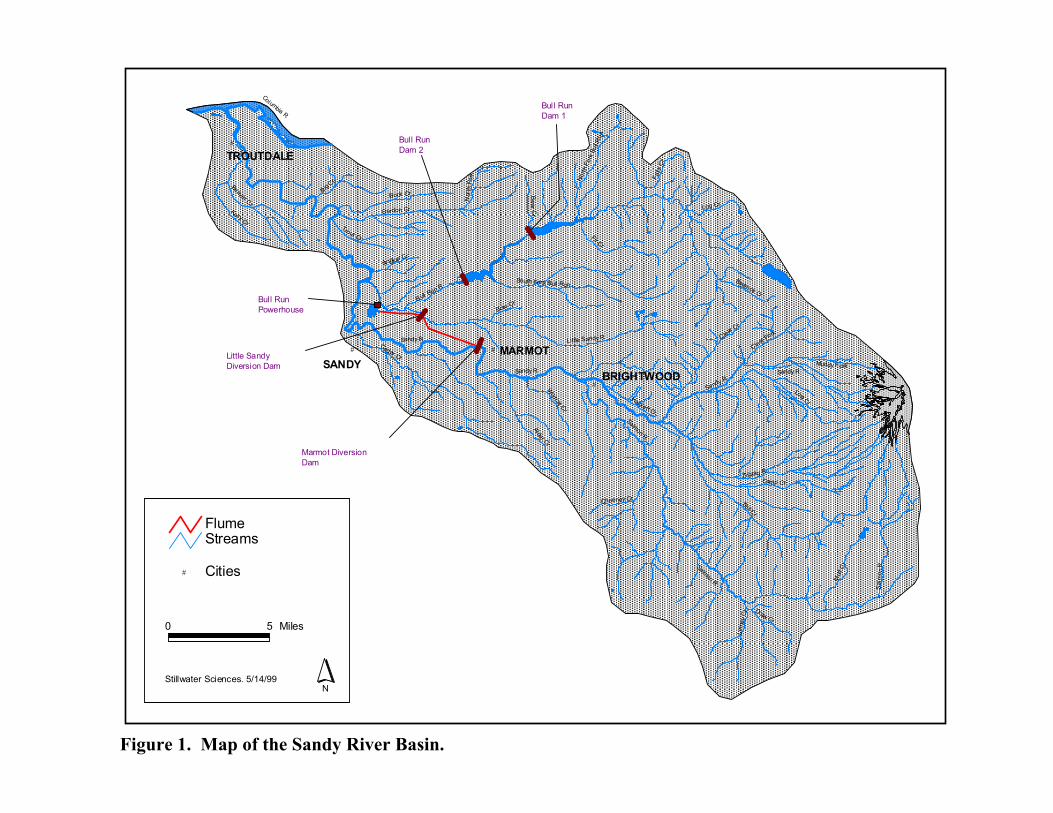
Figure 1. Map of the Sandy River Basin.
������������������������������������������������������������������������������������������������������������������������������������������������������������������������������������������������������������������������������������������������������������������������������������������������
������������������������������������������������������������������������������������������������������������������������������������������������������������������������������������������������������������������������������������������������������������������������������������������������
������������������������������������������������������������������������������������������������������������������������������������������������������������������������������������������������������������������������������������������������������������������������������������������������
������������������������������������������������������������������������������������������������������������������������������������������������������������������������������������������������������������������������������������������������������������������������������������������������
������������������������������������������������������������������������������������������������������������������������������������������������������������������������������������������������������������������������������������������������������������������������������������������������
������������������������������������������������������������������������������������������������������������������������������������������������������������������������������������������������������������������������������������������������������������������������������������������������
������������������������������������������������������������������������������������������������������������������������������������������������������������������������������������������������������������������������������������������������������������������������������������������������
������������������������������������������������������������������������������������������������������������������������������������������������������������������������������������������������������������������������������������������������������������������������������������������������
������������������������������������������������������������������������������������������������������������������������������������������������������������������������������������������������������������������������������������������������������������������������������������������������
������������������������������������������������������������������������������������������������������������������������������������������������������������������������������������������������������������������������������������������������������������������������������������������������
������������������������������������������������������������������������������������������������������������������������������������������������������������������������������������������������������������������������������������������������������������������������������������������������
������������������������������������������������������������������������������������������������������������������������������������������������������������������������������������������������������������������������������������������������������������������������������������������������
������������������������������������������������������������������������������������������������������������������������������������������������������������������������������������������������������������������������������������������������������������������������������������������������
������������������������������������������������������������������������������������������������������������������������������������������������������������������������������������������������������������������������������������������������������������������������������������������������
������������������������������������������������������������������������������������������������������������������������������������������������������������������������������������������������������������������������������������������������������������������������������������������������
������������������������������������������������������������������������������������������������������������������������������������������������������������������������������������������������������������������������������������������������������������������������������������������������
������������������������������������������������������������������������������������������������������������������������������������������������������������������������������������������������������������������������������������������������������������������������������������������������
������������������������������������������������������������������������������������������������������������������������������������������������������������������������������������������������������������������������������������������������������������������������������������������������
������������������������������������������������������������������������������������������������������������������������������������������������������������������������������������������������������������������������������������������������������������������������������������������������
������������������������������������������������������������������������������������������������������������������������������������������������������������������������������������������������������������������������������������������������������������������������������������������������
������������������������������������������������������������������������������������������������������������������������������������������������������������������������������������������������������������������������������������������������������������������������������������������������
������������������������������������������������������������������������������������������������������������������������������������������������������������������������������������������������������������������������������������������������������������������������������������������������
������������������������������������������������������������������������������������������������������������������������������������������������������������������������������������������������������������������������������������������������������������������������������������������������
������������������������������������������������������������������������������������������������������������������������������������������������������������������������������������������������������������������������������������������������������������������������������������������������
������������������������������������������������������������������������������������������������������������������������������������������������������������������������������������������������������������������������������������������������������������������������������������������������
������������������������������������������������������������������������������������������������������������������������������������������������������������������������������������������������������������������������������������������������������������������������������������������������
������������������������������������������������������������������������������������������������������������������������������������������������������������������������������������������������������������������������������������������������������������������������������������������������
������������������������������������������������������������������������������������������������������������������������������������������������������������������������������������������������������������������������������������������������������������������������������������������������
������������������������������������������������������������������������������������������������������������������������������������������������������������������������������������������������������������������������������������������������������������������������������������������������
������������������������������������������������������������������������������������������������������������������������������������������������������������������������������������������������������������������������������������������������������������������������������������������������
������������������������������������������������������������������������������������������������������������������������������������������������������������������������������������������������������������������������������������������������������������������������������������������������
������������������������������������������������������������������������������������������������������������������������������������������������������������������������������������������������������������������������������������������������������������������������������������������������
������������������������������������������������������������������������������������������������������������������������������������������������������������������������������������������������������������������������������������������������������������������������������������������������
������������������������������������������������������������������������������������������������������������������������������������������������������������������������������������������������������������������������������������������������������������������������������������������������
������������������������������������������������������������������������������������������������������������������������������������������������������������������������������������������������������������������������������������������������������������������������������������������������
������������������������������������������������������������������������������������������������������������������������������������������������������������������������������������������������������������������������������������������������������������������������������������������������
������������������������������������������������������������������������������������������������������������������������������������������������������������������������������������������������������������������������������������������������������������������������������������������������
������������������������������������������������������������������������������������������������������������������������������������������������������������������������������������������������������������������������������������������������������������������������������������������������
������������������������������������������������������������������������������������������������������������������������������������������������������������������������������������������������������������������������������������������������������������������������������������������������
������������������������������������������������������������������������������������������������������������������������������������������������������������������������������������������������������������������������������������������������������������������������������������������������#
#
# #
$
$
$
$
$
Gordon Cr
Col umbia R
Bull Run Dam 1
Bull Run Dam 2
Bull Run Powerhouse
Marmot Diversion Dam
Little Sandy Diversion Dam
Sa
lmo
n R
Nor
th F
ork
Walker Cr
Bow Cr
Bedrock Cr
Fa
lls C
r
Hackett Cr
Bull Run R
Wildcat C
rCamp Cr
Be
ar C
r
Cheeney Cr
Buck Cr
Draw Cr
Log Cr
Big
Cr
Fir Cr
Lin
ney
Cr
Kell y Cr
Beaver Cr
Mud
Cr
Muddy Fork
Alder Cr
C lear
Cr
Little Sandy R
Zigzag R
Cedar Cr
Sti ll Cr
Salmon R
Sandy RSandy R
Sandy R
Trout Cr
Clear
Fork
No
rth
Fo
rk B
ull R
un
South Fork Bull Run
Lost Cr
Sandy R
Salmon R
SANDYMARMOT
TROUTDALE
BRIGHTWOOD
# Cities
StreamsFlume
NStillwater Sciences. 5/14/99
0 5 Miles
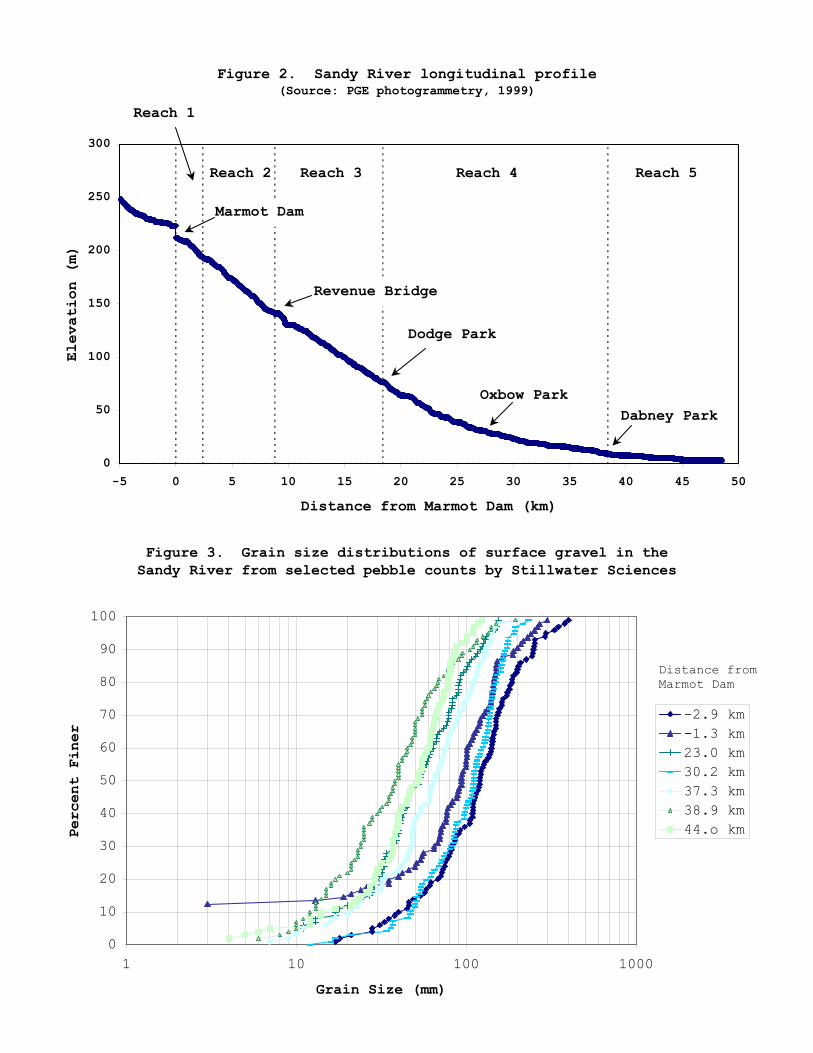
Figure 2. Sandy River longitudinal profile(Source: PGE photogrammetry, 1999)
0
50
100
150
200
250
300
-5 0 5 10 15 20 25 30 35 40 45 50Distance from Marmot Dam (km)
Elevation (m)
Reach 5Reach 4Reach 3Reach 2
Reach 1
Marmot Dam
Dodge Park
Oxbow ParkDabney Park
Revenue Bridge
Figure 3. Grain size distributions of surface gravel in the Sandy River from selected pebble counts by Stillwater Sciences
0
10
20
30
40
50
60
70
80
90
100
1 10 100 1000Grain Size (mm)
Percent Finer
-2.9 km-1.3 km23.0 km30.2 km37.3 km38.9 km44.o km
Distance fromMarmot Dam
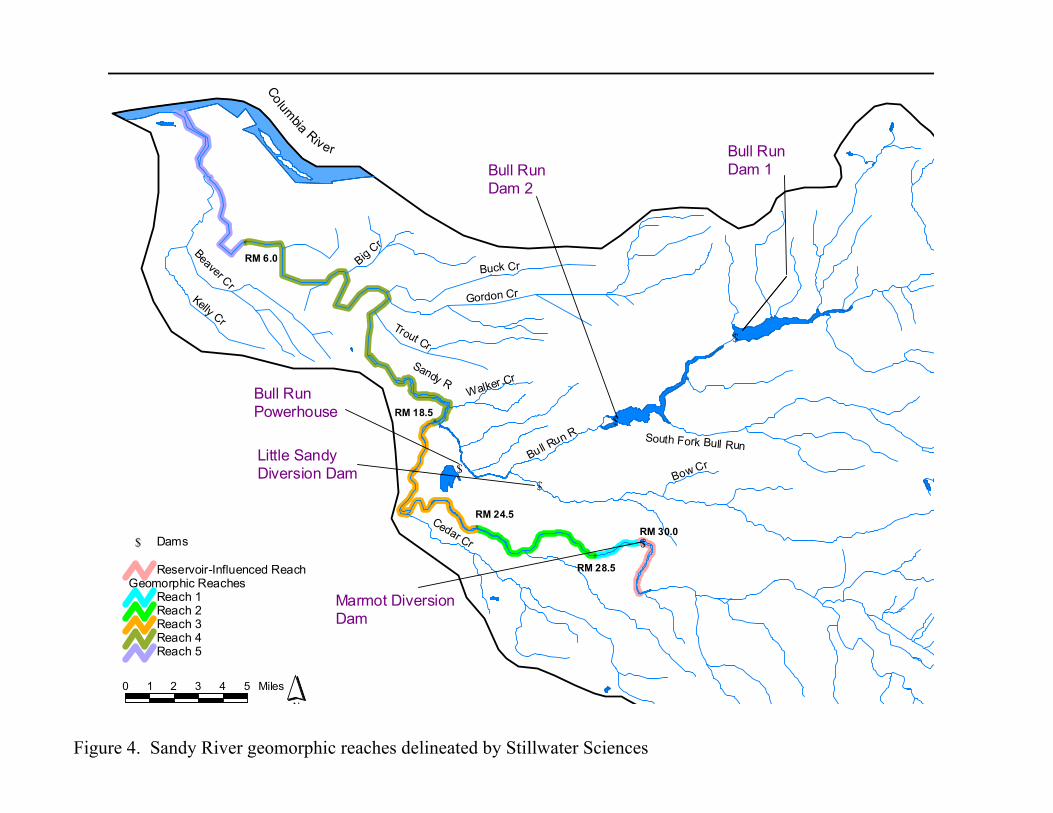
Figure 4. Sandy River geomorphic reaches delineated by Stillwater Sciences
$
$
$
$$
RM 30.0
RM 28.5
RM 24.5
RM 18.5
#
#
#
#
RM 6.0#
Beaver CrKelly Cr
Big Cr
Buck Cr
Bull Run R
Bow Cr
Walker Cr
Gordon Cr
Trout Cr
Cedar Cr
South Fork Bull Run
Sandy R
Bull Run Dam 1
Bull Run Powerhouse
Marmot Diversion Dam
Little Sandy Diversion Dam
Bull Run Dam 2
N
0 1 2 3 4 5 Miles
Geomorphic ReachesReach 1Reach 2Reach 3Reach 4Reach 5
Reservoir-Influenced Reach
$ Dams
S S / /
Colum
bia River
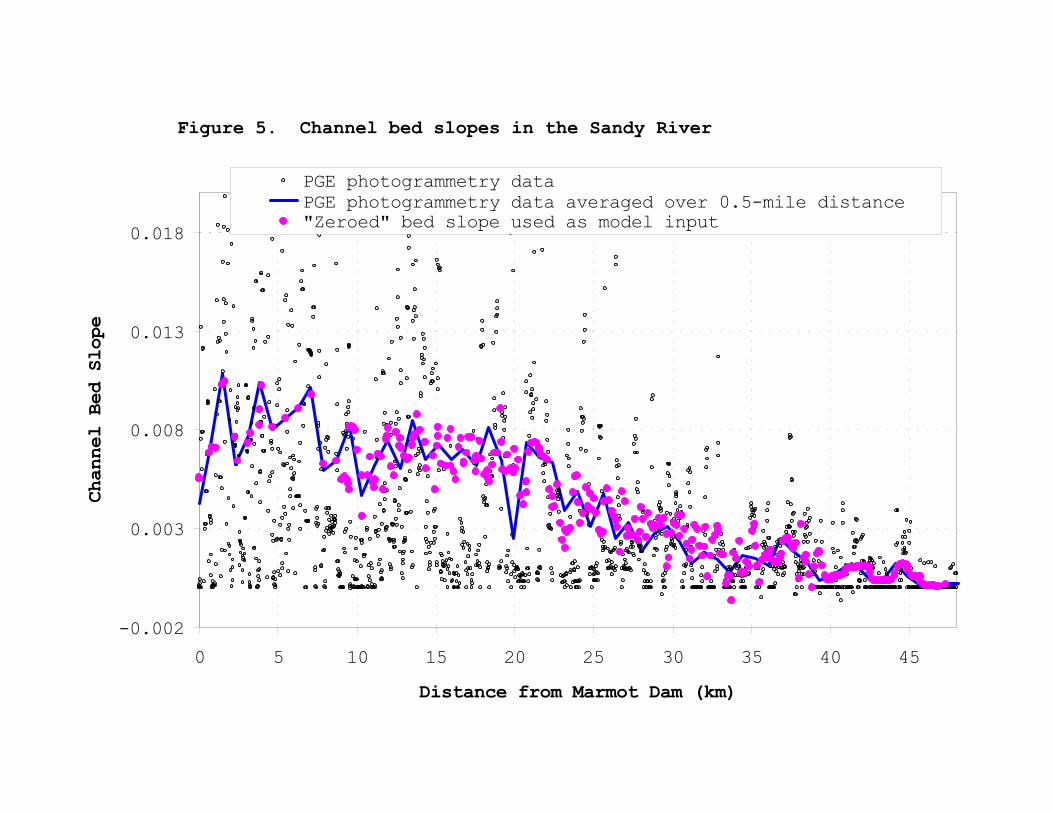
Figure 6. Sandy River channel slope downstream of Marmot Dam
-0.002
0.003
0.008
0.013
0.018
0 5 10 15 20 25 30 35 40 45Distance from Marmot Dam (km)
Channel Bed Slope
PGE photogrammetry dataPGE photogrammetry data averaged over 0.5-mile distance"Zeroed" bed slope used as model input
Figure 5. Channel bed slopes in the Sandy River
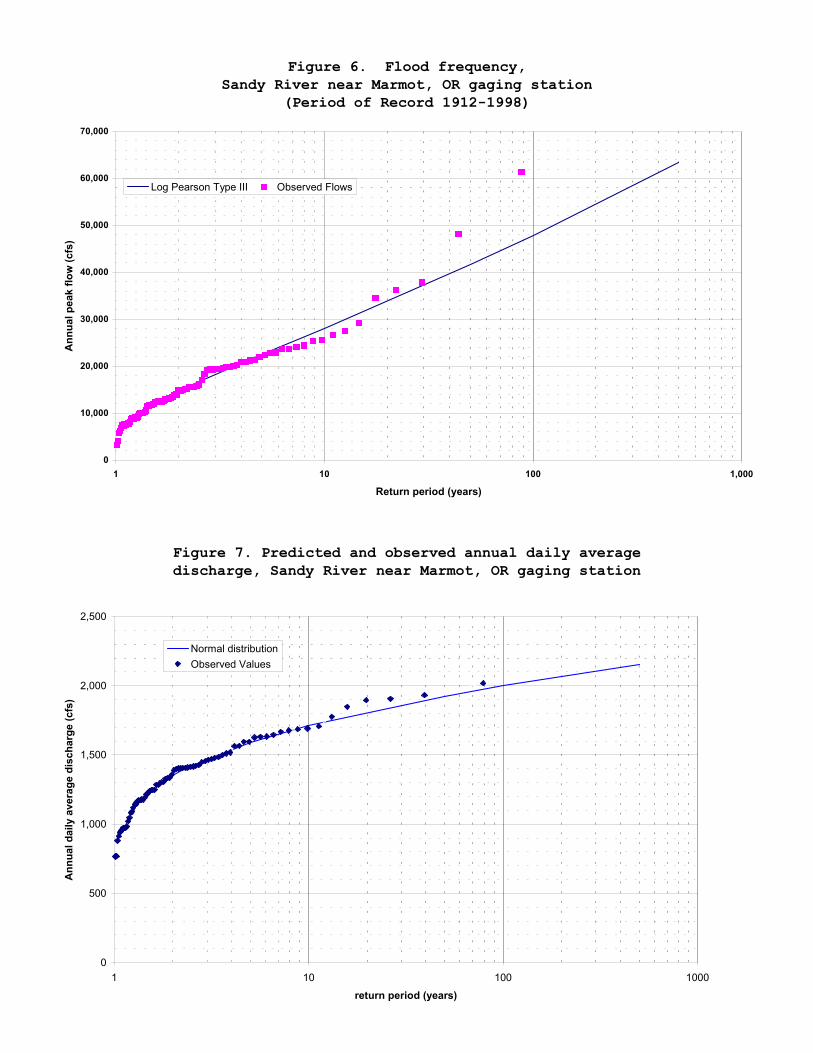
Figure 6. Flood frequency, Sandy River near Marmot, OR gaging station
(Period of Record 1912-1998)
0
10,000
20,000
30,000
40,000
50,000
60,000
70,000
1 10 100 1,000
Return period (years)
Ann
ual p
eak
flow
(cfs
)
Log Pearson Type III Observed Flows
Figure 7. Predicted and observed annual daily average discharge, Sandy River near Marmot, OR gaging station
0
500
1,000
1,500
2,000
2,500
1 10 100 1000
return period (years)
Ann
ual d
aily
ave
rage
dis
char
ge (c
fs)
Normal distributionObserved Values
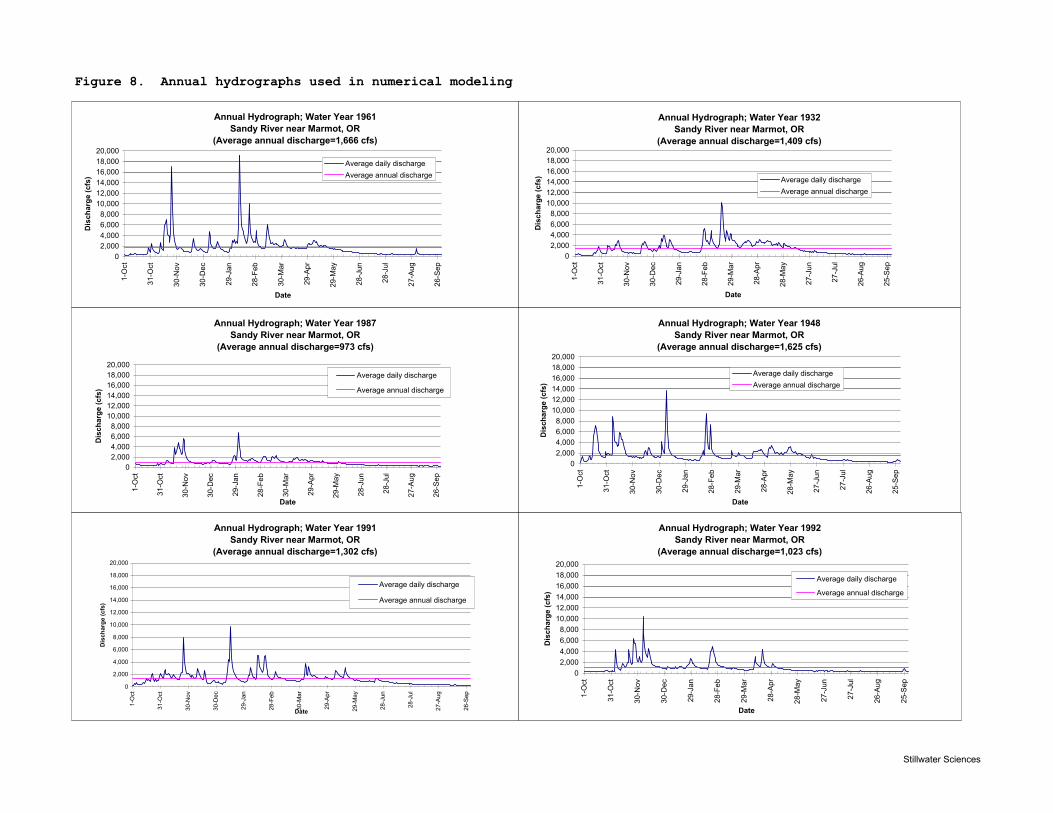
Figure 8. Annual hydrographs used in numerical modeling
Annual Hydrograph; Water Year 1991 Sandy River near Marmot, OR
(Average annual discharge=1,302 cfs)
0
2,000
4,000
6,000
8,000
10,000
12,000
14,000
16,000
18,000
20,000
1-O
ct
31-O
ct
30-N
ov
30-D
ec
29-J
an
28-F
eb
30-M
ar
29-A
pr
29-M
ay
28-J
un
28-J
ul
27-A
ug
26-S
ep
Date
Dis
char
ge (c
fs)
Average daily discharge
Average annual discharge
Annual Hydrograph; Water Year 1987 Sandy River near Marmot, OR
(Average annual discharge=973 cfs)
02,0004,0006,0008,000
10,00012,00014,00016,00018,00020,000
1-O
ct
31-O
ct
30-N
ov
30-D
ec
29-J
an
28-F
eb
30-M
ar
29-A
pr
29-M
ay
28-J
un
28-J
ul
27-A
ug
26-S
ep
Date
Dis
char
ge (c
fs)
Average daily discharge
Average annual discharge
Annual Hydrograph; Water Year 1961 Sandy River near Marmot, OR
(Average annual discharge=1,666 cfs)
02,0004,0006,0008,000
10,00012,00014,00016,00018,00020,000
1-O
ct
31-O
ct
30-N
ov
30-D
ec
29-J
an
28-F
eb
30-M
ar
29-A
pr
29-M
ay
28-J
un
28-J
ul
27-A
ug
26-S
ep
Date
Dis
char
ge (c
fs)
Average daily dischargeAverage annual discharge
Annual Hydrograph; Water Year 1992 Sandy River near Marmot, OR
(Average annual discharge=1,023 cfs)
02,0004,0006,0008,000
10,00012,00014,00016,00018,00020,000
1-O
ct
31-O
ct
30-N
ov
30-D
ec
29-J
an
28-F
eb
29-M
ar
28-A
pr
28-M
ay
27-J
un
27-J
ul
26-A
ug
25-S
ep
Date
Dis
char
ge (c
fs)
Average daily discharge
Average annual discharge
Annual Hydrograph; Water Year 1948 Sandy River near Marmot, OR
(Average annual discharge=1,625 cfs)
02,0004,0006,0008,000
10,00012,00014,00016,00018,00020,000
1-O
ct
31-O
ct
30-N
ov
30-D
ec
29-J
an
28-F
eb
29-M
ar
28-A
pr
28-M
ay
27-J
un
27-J
ul
26-A
ug
25-S
ep
Date
Dis
char
ge (c
fs)
Average daily dischargeAverage annual discharge
Annual Hydrograph; Water Year 1932 Sandy River near Marmot, OR
(Average annual discharge=1,409 cfs)
02,0004,0006,0008,000
10,00012,00014,00016,00018,00020,000
1-O
ct
31-O
ct
30-N
ov
30-D
ec
29-J
an
28-F
eb
29-M
ar
28-A
pr
28-M
ay
27-J
un
27-J
ul
26-A
ug
25-S
ep
Date
Dis
char
ge (c
fs) Average daily discharge
Average annual discharge
Stillwater Sciences
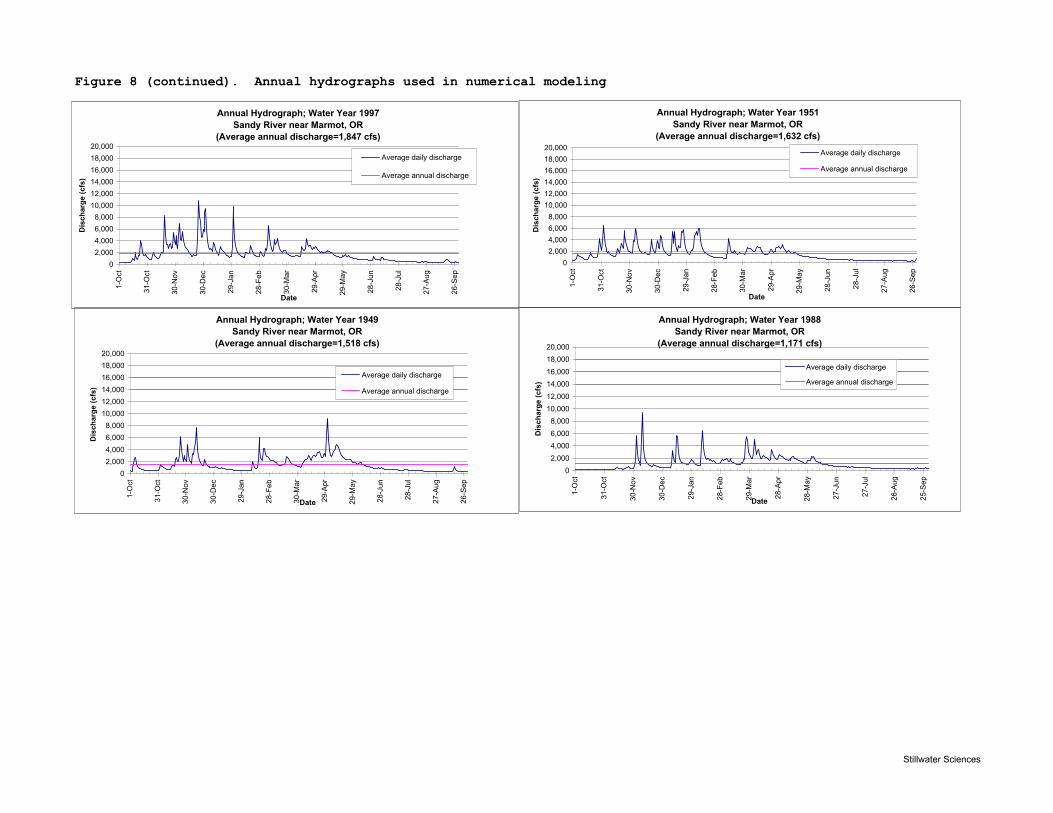
Figure 8 (continued). Annual hydrographs used in numerical modelingAnnual Hydrograph; Water Year 1997
Sandy River near Marmot, OR(Average annual discharge=1,847 cfs)
02,0004,0006,0008,000
10,00012,00014,00016,00018,00020,000
1-O
ct
31-O
ct
30-N
ov
30-D
ec
29-J
an
28-F
eb
30-M
ar
29-A
pr
29-M
ay
28-J
un
28-J
ul
27-A
ug
26-S
ep
Date
Dis
char
ge (c
fs)
Average daily discharge
Average annual discharge
Annual Hydrograph; Water Year 1951 Sandy River near Marmot, OR
(Average annual discharge=1,632 cfs)
02,0004,0006,0008,000
10,00012,00014,00016,00018,00020,000
1-O
ct
31-O
ct
30-N
ov
30-D
ec
29-J
an
28-F
eb
30-M
ar
29-A
pr
29-M
ay
28-J
un
28-J
ul
27-A
ug
26-S
ep
Date
Dis
char
ge (c
fs)
Average daily discharge
Average annual discharge
Annual Hydrograph; Water Year 1949 Sandy River near Marmot, OR
(Average annual discharge=1,518 cfs)
02,0004,0006,0008,000
10,00012,00014,00016,00018,00020,000
1-O
ct
31-O
ct
30-N
ov
30-D
ec
29-J
an
28-F
eb
30-M
ar
29-A
pr
29-M
ay
28-J
un
28-J
ul
27-A
ug
26-S
ep
Date
Dis
char
ge (c
fs)
Average daily discharge
Average annual discharge
Annual Hydrograph; Water Year 1988 Sandy River near Marmot, OR
(Average annual discharge=1,171 cfs)
02,0004,0006,0008,000
10,00012,00014,00016,00018,00020,000
1-O
ct
31-O
ct
30-N
ov
30-D
ec
29-J
an
28-F
eb
29-M
ar
28-A
pr
28-M
ay
27-J
un
27-J
ul
26-A
ug
25-S
ep
Date
Dis
char
ge (c
fs)
Average daily discharge
Average annual discharge
Stillwater Sciences
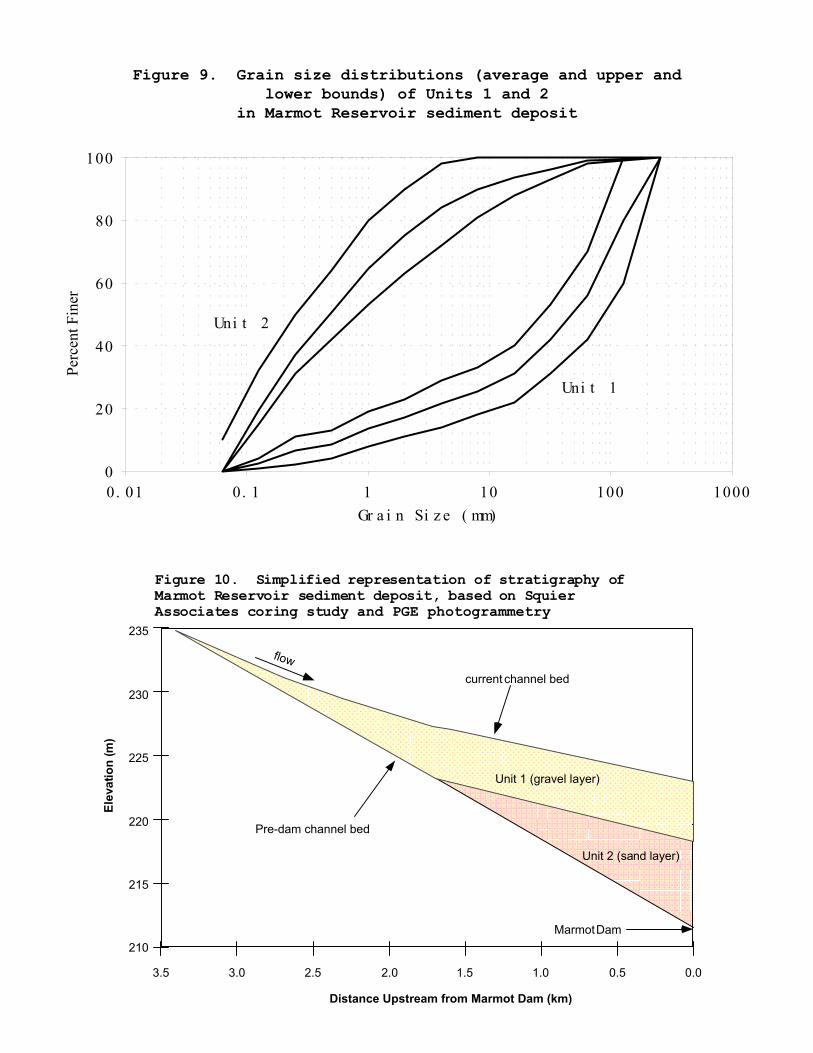
Unit 2 (sand layer)
235
230
225
220
215
210
2.0 1.5 1.0 0.5 0.0
Elev
atio
n (m
)
Distance Upstream from Marmot Dam (km)
Pre-dam channel bed
current channel bed
flow
Marmot Dam
Figure 10. Simplified representation of stratigraphy ofMarmot Reservoir sediment deposit, based on SquierAssociates coring study and PGE photogrammetry
Unit 1 (gravel layer)
2.53.03.5
Figure 9. Grain size distributions (average and upper and lower bounds) of Units 1 and 2
in Marmot Reservoir sediment deposit
0
20
40
60
80
100
0. 01 0. 1 1 10 100 1000Gr a i n Si z e ( mm)
Perc
ent F
iner
Uni t 1
Uni t 2
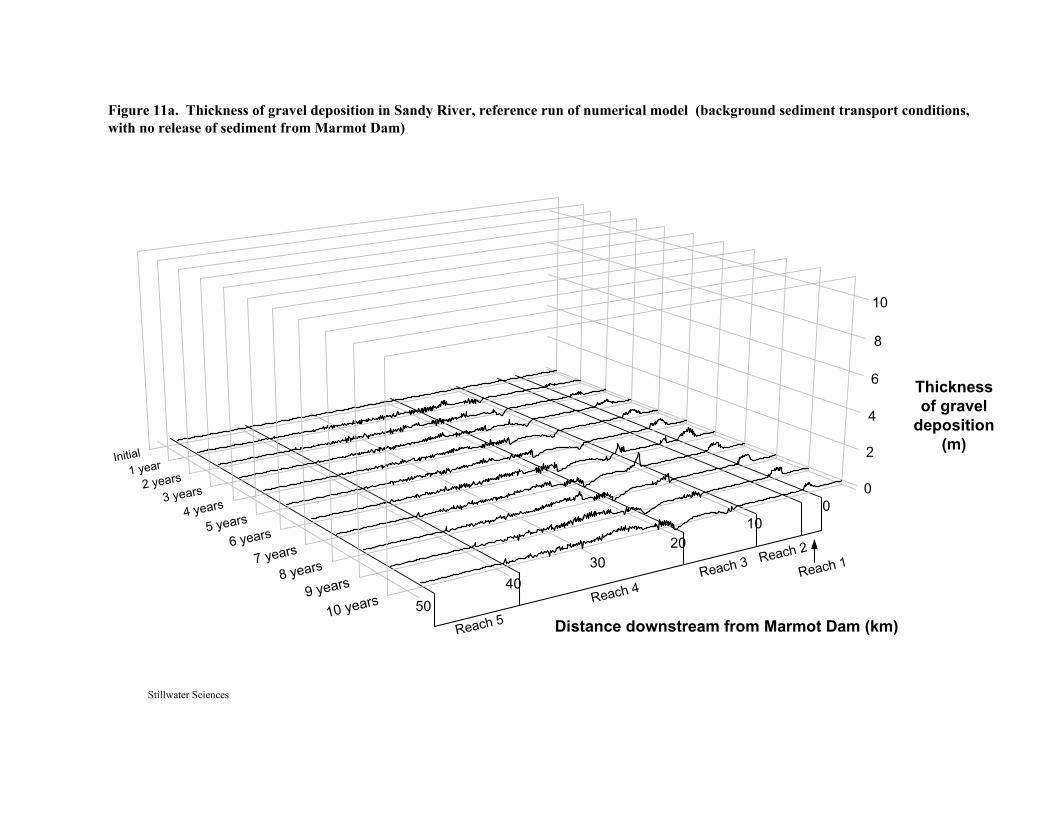
5040
3020
100
0
2
4
6
8
10
Initial1 year
2 years3 years
4 years
5 years
6 years
7 years
8 years
9 years
10 years
Reach 5Reach 4
Reach 3 Reach 2
Reach 1
Thicknessof gravel
deposition(m)
Distance downstream from Marmot Dam (km)
Figure 11a. Thickness of gravel deposition in Sandy River, reference run of numerical model (background sediment transport conditions,with no release of sediment from Marmot Dam)
Stillwater Sciences
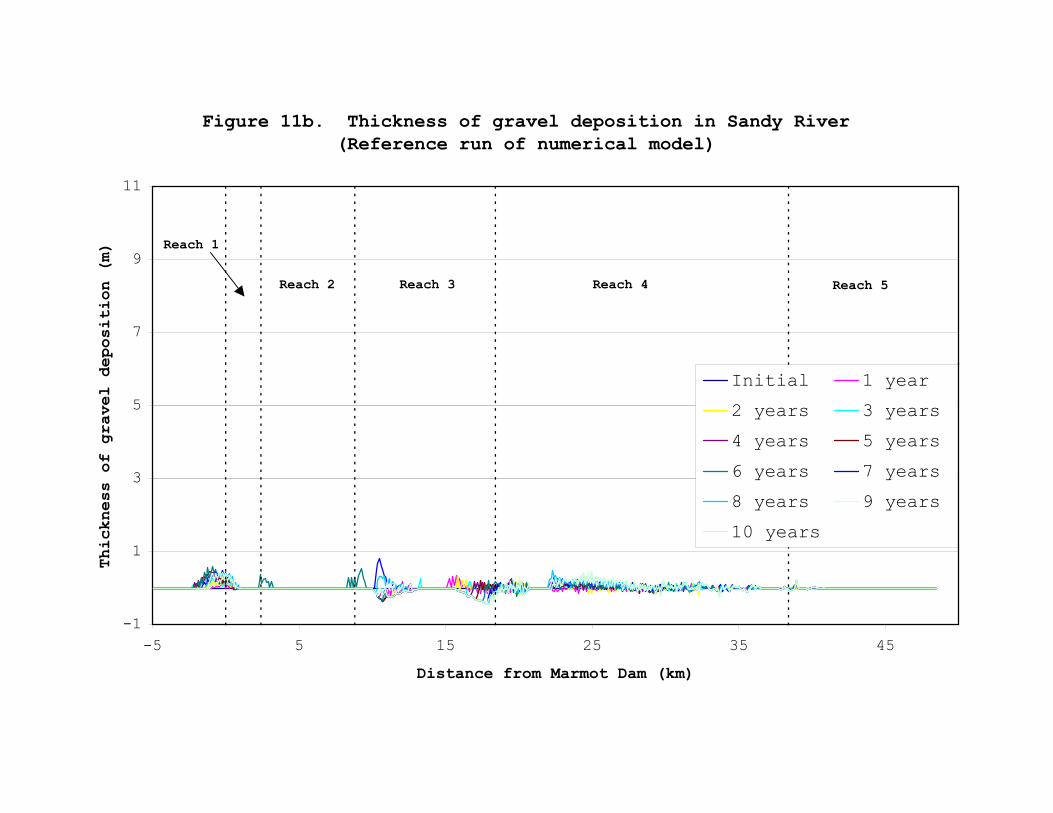
Figure 11b. Thickness of gravel deposition in Sandy River(Reference run of numerical model)
-1
1
3
5
7
9
11
-5 5 15 25 35 45Distance from Marmot Dam (km)
Thickness of gravel deposition (m)
Initial 1 year2 years 3 years4 years 5 years6 years 7 years8 years 9 years10 years
Reach 5Reach 4Reach 3Reach 2
Reach 1
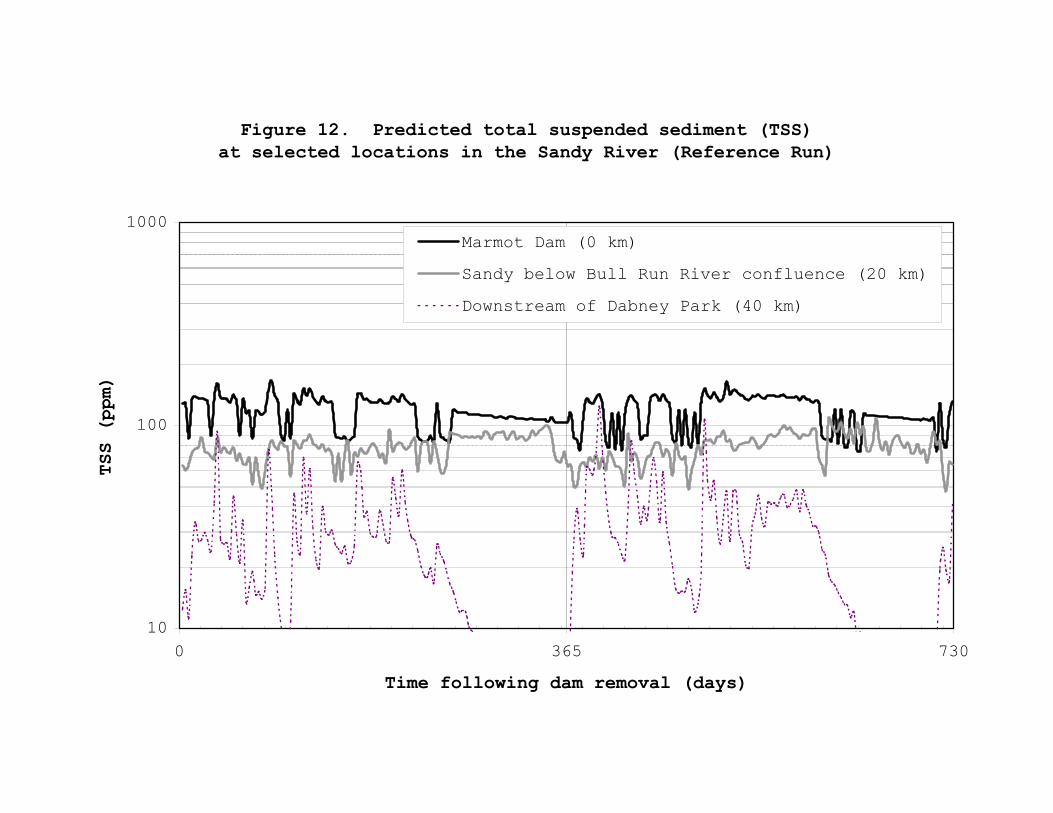
����������������������������������������������������������������������������������������������������������������������������������������������������������������������������������������������������������������������������������������������������������������������������������������������������������������
����������������������������������������������������������������������������������������������������������������������������������������������������������������������������������������������������������������������������������������������������������������������������������������������������������������
����������������������������������������������������������������������������������������������������������������������������������������������������������������������������������������������������������������������������������������������������������������������������������������������������������������
����������������������������������������������������������������������������������������������������������������������������������������������������������������������������������������������������������������������������������������������������������������������������������������������������������������
����������������������������������������������������������������������������������������������������������������������������������������������������������������������������������������������������������������������������������������������������������������������������������������������������������������
��������������������������������������������������������������������������������������������������������������������������������������������������������������������������������������������������������������������������������������������������������������������������������������������������������������������������������������������������������������������������������������������������������������������������������������������������������������������������������������������������������������������������������������������������������������������������������������������������������������������������������
����������������������������������������������������������������������������������������������������������������������������������������������������������������������������������������������������������������������������������������������������������������������������������������������������������������
����������������������������������������������������������������������������������������������������������������������������������������������������������������������������������������������������������������������������������������������������������������������������������������������������������������
����������������������������������������������������������������������������������������������������������������������������������������������������������������������������������������������������������������������������������������������������������������������������������������������������������������
���������������������������������������������������������������������������������������� ����������
���������������������������������������������������������������������������������������� ����������
���������������������������������������������������������������������������������������� ����������
���������������������������������������������������������������������������������������� ����������
���������������������������������������������������������������������������������������� �������������������������������������������������������������������������������������������������� ����������
Figure 12. Predicted total suspended sediment (TSS)at selected locations in the Sandy River (Reference Run)
10
100
1000
0 365 730Time following dam removal (days)
TSS (ppm)
Marmot Dam (0 km)Sandy below Bull Run River confluence (20 km)Downstream of Dabney Park (40 km)
5040
3020
100
0
2
4
6
8
10
Initial10 days
30 days60 days
90 days1 year
2 years3 years
4 years5 years
7 years10 years
15 years
20 years
Thicknessof gravel
deposition(m)
Distance downstream from Marmot Dam (km)
Figure 13a. Thickness of gravel deposition following removal of Marmot Dam (Alternative B - Run 1: Average hydrology and grain size
Stillwater Sciences
Reach 5Reach 4
Reach 3 Reach 2
Reach 1
Figure 13b. Thickness of gravel deposition following removal of Marmot Dam (Alternative B - Run 1: Average hydrology and
grain size)
-1
1
3
5
7
9
11
-5 5 15 25 35 45Distance From Marmot Dam (km)
Thickness of Gravel Deposition (m)
Initial 5 days10 days 30 days60 days 90 days1 year 2 years3 years 4 years5 years 6 years7 years 8 years9 years 10 years
Reach 5Reach 4Reach 3Reach 2
Reach 1
185
190
195
200
205
210
215
220
225
230
235
-3.5 -2.5 -1.5 -0.5 0.5 1.5 2.5 3.5Distance From Marmot Dam (km)
Bed Elevation (m)
Initial 30 days60 days 90 days1 year 2 years4 years 6 years8 years 10 years20 years
Figure 14. Evolution of long profile in vicinity of reservoir following removal of Marmot Dam (Alternative B, Run 1)
Figure 15. Annual change in bed elevation following removal of Marmot Dam (Alternative B, Run 1)
-1
-0.8
-0.6
-0.4
-0.2
0
0.2
0.4
0.6
0.8
1
-5 5 15 25 35 45Distance From Marmot Dam (km)
Annual Change in Bed Elevation (m)
1st year 2nd year3rd year 4th year5th year 6th year7th year 8th year9th year 10th year10 - 15 years 15 - 20 years
Note: Individual years may be difficult to distinguish on this figure; however, the purpose of this graphic is to depict the typical range of annual changes in bed elevation indicated by numerical modeling rather than those occurring in a specific year.
Reach 5Reach 4Reach 3Reach 2
Reach 1
Figure 16. Thickness of gravel deposition following removal of Marmot Dam (Alternative B, Run 2: Wet hydrologic conditions,
average grain size)
-1
1
3
5
7
9
11
-5 5 15 25 35 45Distance From Marmot Dam (km)
Thickness of Gravel Deposition (m)
Initial 30 days1 year 2 years3 years 4 years5 years 6 years7 years 8 years9 years 10 years
Reach 5Reach 4Reach 3Reach 2
Reach 1
Figure 17. Thickness of gravel deposition following removal of Marmot Dam (Alternative B, Run 3: Dry hydrologic conditions,
average grain size)
-1
1
3
5
7
9
11
-5 5 15 25 35 45Distance From Marmot Dam (km)
Thickness of Gravel Deposition (m)
Initial 30 days1 year 2 years3 years 4 years5 years 6 years7 years 8 years9 years 10 years
Reach 5Reach 4Reach 3Reach 2
Reach 1
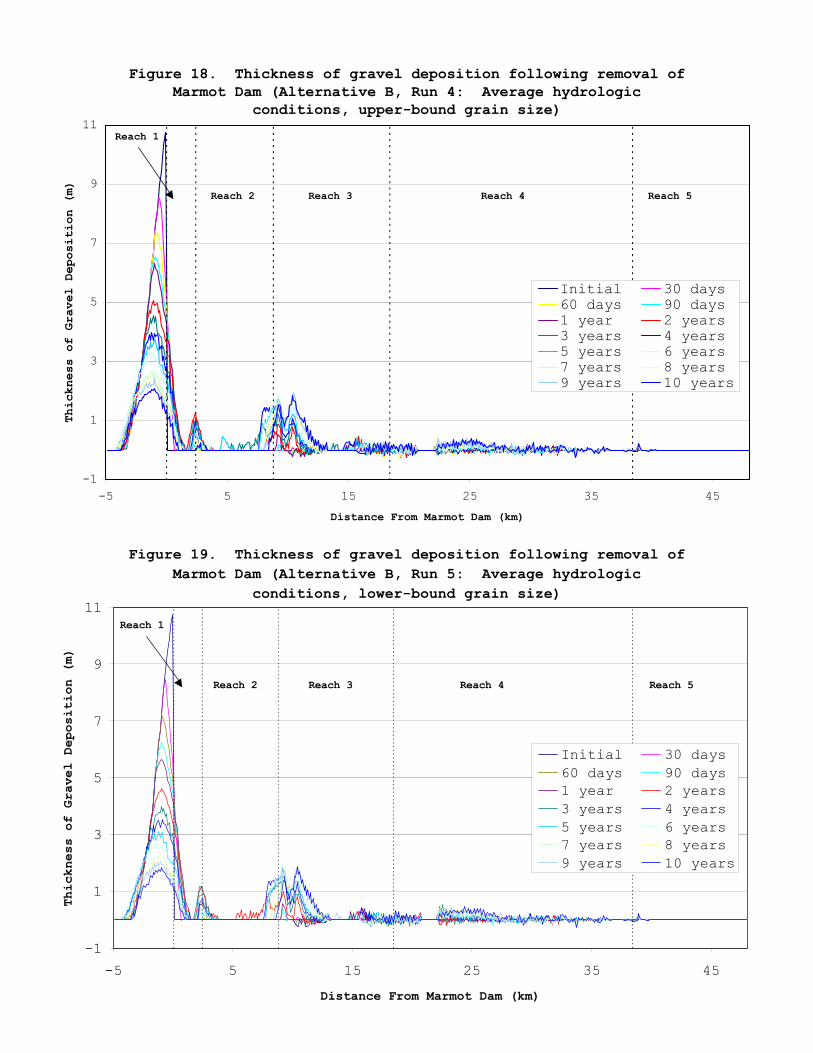
Figure 18. Thickness of gravel deposition following removal of Marmot Dam (Alternative B, Run 4: Average hydrologic
conditions, upper-bound grain size)
-1
1
3
5
7
9
11
-5 5 15 25 35 45Distance From Marmot Dam (km)
Thickness of Gravel Deposition (m)
Initial 30 days60 days 90 days1 year 2 years3 years 4 years5 years 6 years7 years 8 years9 years 10 years
Reach 5Reach 4Reach 3Reach 2
Reach 1
Figure 19. Thickness of gravel deposition following removal of Marmot Dam (Alternative B, Run 5: Average hydrologic
conditions, lower-bound grain size)
-1
1
3
5
7
9
11
-5 5 15 25 35 45Distance From Marmot Dam (km)
Thickness of Gravel Deposition (m)
Initial 30 days60 days 90 days1 year 2 years3 years 4 years5 years 6 years7 years 8 years9 years 10 years
Reach 5Reach 4Reach 3Reach 2
Reach 1
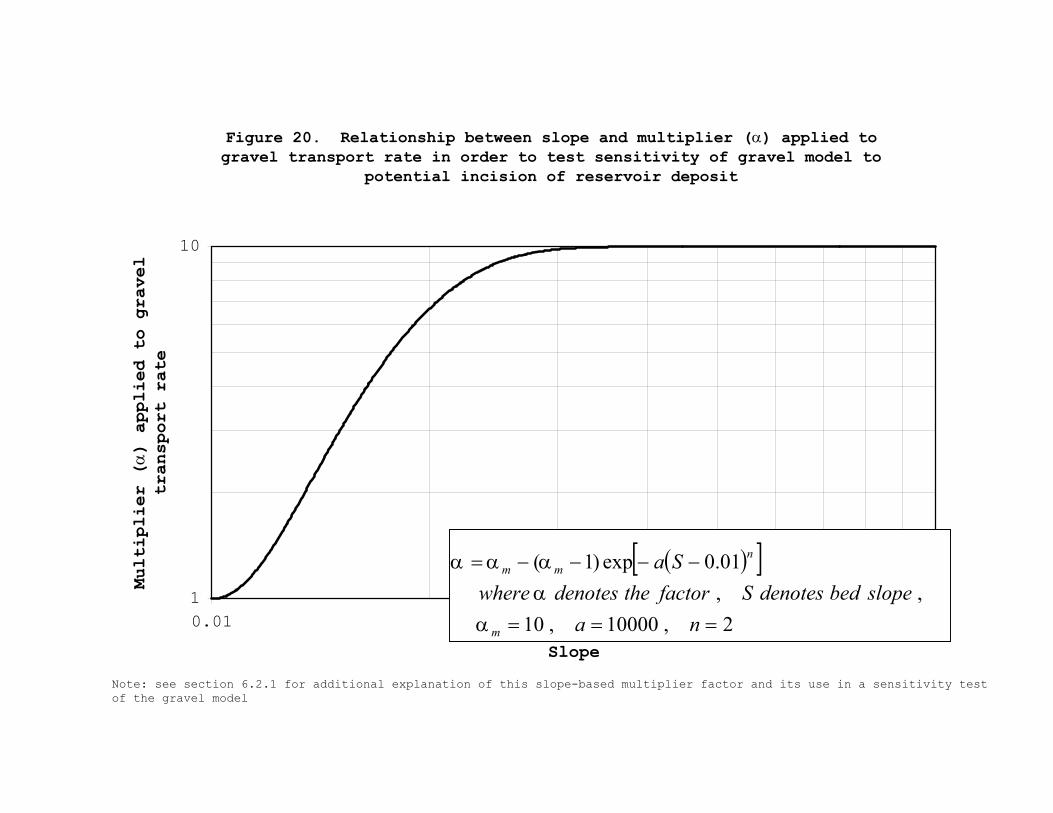
Figure 20. Relationship between slope and multiplier (α) applied to gravel transport rate in order to test sensitivity of gravel model to
potential incision of reservoir deposit
1
10
0.01 0.1Slope
Mult
ipli
er (
α)
appl
ied
to g
rave
l tr
ansp
ort
rate
( )[ ]
2,10000,10,,
01.0exp)1(
===
−−−−=
naslopebeddenotesSfactorthedenoteswhere
Sa
m
nmm
ααααα
Note: see section 6.2.1 for additional explanation of this slope-based multiplier factor and its use in a sensitivity test of the gravel model
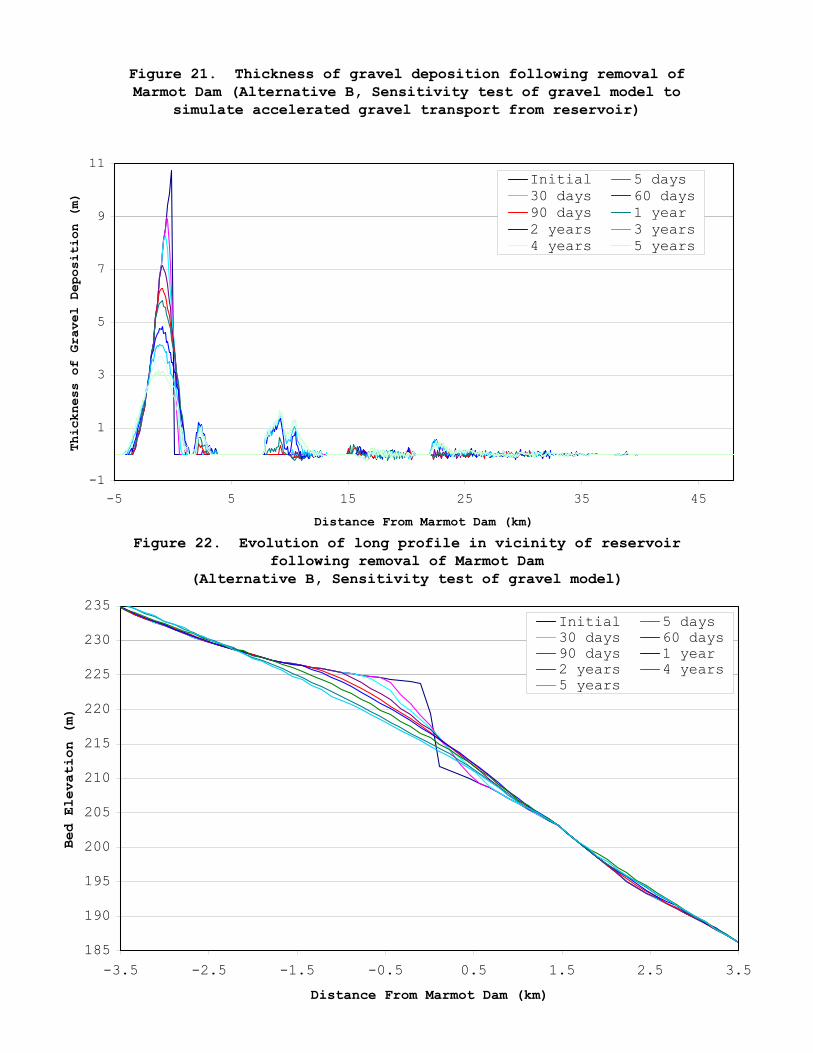
Figure 22. Evolution of long profile in vicinity of reservoir following removal of Marmot Dam
(Alternative B, Sensitivity test of gravel model)
185
190
195
200
205
210
215
220
225
230
235
-3.5 -2.5 -1.5 -0.5 0.5 1.5 2.5 3.5Distance From Marmot Dam (km)
Bed Elevation (m)
Initial 5 days30 days 60 days90 days 1 year2 years 4 years5 years
Figure 21. Thickness of gravel deposition following removal of Marmot Dam (Alternative B, Sensitivity test of gravel model to
simulate accelerated gravel transport from reservoir)
-1
1
3
5
7
9
11
-5 5 15 25 35 45Distance From Marmot Dam (km)
Thickness of Gravel Deposition (m)
Initial 5 days30 days 60 days90 days 1 year2 years 3 years4 years 5 years
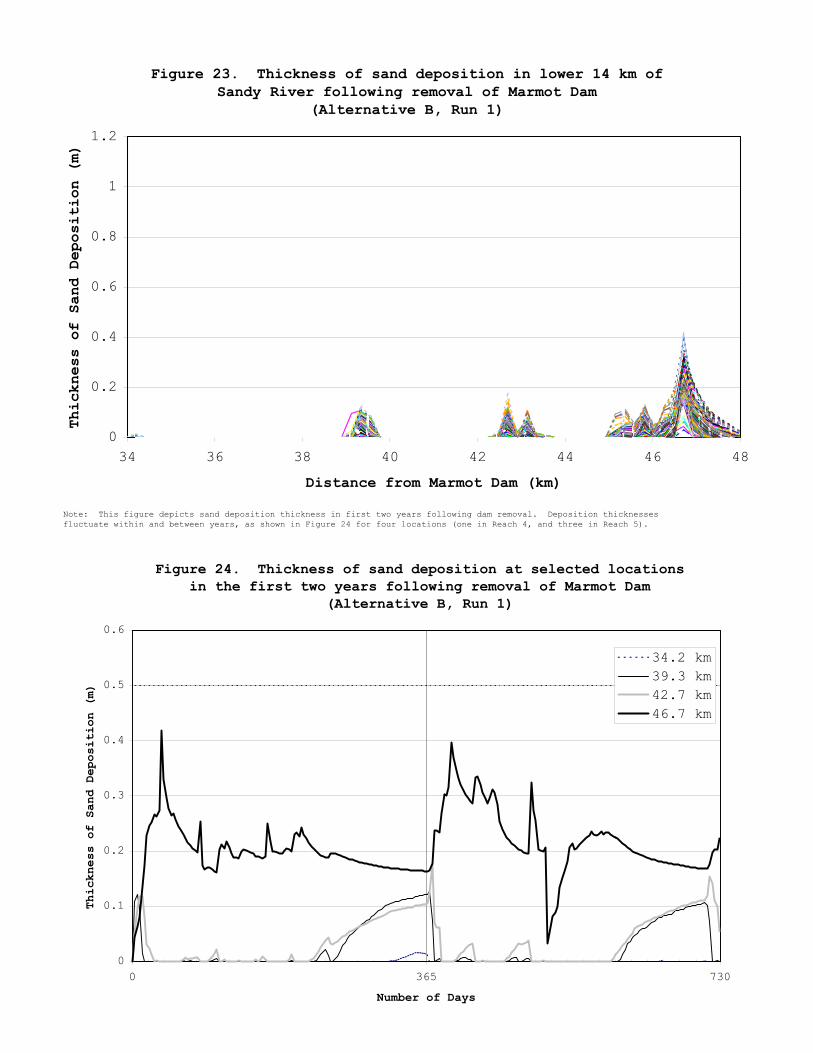
Figure 23. Thickness of sand deposition in lower 14 km of Sandy River following removal of Marmot Dam
(Alternative B, Run 1)
0
0.2
0.4
0.6
0.8
1
1.2
34 36 38 40 42 44 46 48
Distance from Marmot Dam (km)
Thickness of Sand Deposition (m)
Note: This figure depicts sand deposition thickness in first two years following dam removal. Deposition thicknesses fluctuate within and between years, as shown in Figure 24 for four locations (one in Reach 4, and three in Reach 5).
����������������������������������������������������������������������������������������������������������������������������������������������������������������������������������������������������������������������������������������
����������������������������������������������������������������������������������������������������������������������������������������������������������������������������������������������������������������������������������������
����������������������������������������������������������������������������������������������������������������������������������������������������������������������������������������������������������������������������������������
����������������������������������������������������������������������������������������������������������������������������������������������������������������������������������������������������������������������������������������
���������������������������������������������������������������������������������������������������������������������������������������������������������������������������������������������� �������
����������������������������������������������������������������������������������������������������������������������������������������������������������������������������������������������������������������������������������������
Figure 24. Thickness of sand deposition at selected locations in the first two years following removal of Marmot Dam
(Alternative B, Run 1)
0
0.1
0.2
0.3
0.4
0.5
0.6
0 365 730
Number of Days
Thickness of Sand Deposition (m)
34.2 km39.3 km42.7 km46.7 km
Figure 25. Daily sand release at Marmot Dam for 10 years following dam removal, with varying hydrologic conditions in
Year 1 (Alternative B, Runs 1, 2, 3)
0
5000
10000
15000
20000
25000
30000
0 1 2 3 4 5 6 7 8 9 10Year (after dam removal)
Sand Release From Marmot Dam
(tons/day)
Alternative B, Run 1Alternative B, Run 2Alternative B, Run 3
Run 1 = Average hydrograph, Run 2 = Dry hydrograph, Run 3 = Wet hydrograph. All runs assume "average " grain size distribution of reservoir deposit
0
2000
4000
6000
8000
10000
12000
14000
0 1 2 3 4 5 6 7 8 9 10Year (after dam removal)
Sand
Rel
ease
Fro
m Ma
rmot
Dam
(to
ns/d
ay) Alternative B, Run 1
Alternative B, Run 4Alternative B, Run 5
Run 1 = average grain size distribution, Run 4 = upper-bound grain size distribution, Run 5 = lower-bound grain size distribution. All runs assume average hydrologic conditions in Year 1
Figure 26. Daily sand release at Marmot Dam for 10 years following dam removal, with varying assumed grain size
distributions of reservoir sediment (Alternative B, Runs 1, 4, 5)
Figure 27. Daily sand release at Marmot Dam for 10 years following dam removal, with varying amounts of sediment
excavation before dam removal (Alternatives B and D, Run 1)
0
1000
2000
3000
4000
5000
6000
7000
8000
9000
10000
0 1 2 3 4 5 6 7 8 9 10
Year (after dam removal)
Sand Release From Marmot Dam
(tons/day
Alternative BAlternative D
�������������������������������������������������������������������������������������������������������������������������������������������������������������������������������������������������������������������������������������������
�������������������������������������������������������������������������������������������������������������������������������������������������������������������������������������������������������������������������������������������
������������������������������������������������������������������������������������������������������������������������������������������������������������������������������������������������������������������������������������������������������������������������������������������������������������������������������������������������������������������������������������������������������������������������������������������������������������������������������������������������������������������������������������������������������������������������������������������������������������������������������������������������������������������������������������������������������������������������������������������������������������������������������������������������������������������������������������������������������������������������������������������������������������������������������������������������������������������������������������������������������������������������������������������������������������������������������������������������������������������������������������������������������������������������������������������������������������������������������������������������������������������������������������������������������������������������������������������������������������������������������������������������������������������������������������������������������������������
�������������������������������������������������������������������������������������������������������������������������������������������������������������������������������������������������������������������������������������������
������������������������������������������������������������������������������������������������������������������������������������������������������������������������������������������������������������������������������������������������������������������������������������������������������������������������������������������������������������������������������������������������������������������������������������������������������������������������������������������������������������������������������������������������������ ������������������������������������������������������������������������ ������������������������������������������������������������������������ ������������������������������������������������������������������������ ���������������������������������������������������������������������������������������������������������������������������������������������������������������������������������������������������������������������������������������������������
Figure 28. Total suspended sediment (TSS) at selected locations in first two years following removal of Marmot Dam
(Alternative B, Run 1)
10
100
1000
0 365 730Time following dam removal (days)
TSS (ppm)
Marmot Dam (0 km)Sandy below Bull Run River confluence (20 km)Downstream of Dabney Park (40 km)
Figure 29a. Sensitivity test of sand release from Marmot Resevoir, with 10-fold increase over basic model predictions:
Thickness of sand deposition
0
0.2
0.4
0.6
0.8
1
1.2
20 25 30 35 40 45Distance from Marmot Dam (km)
Thickness of Sand Deposition (m)
��������������������������������������������������������������������������������������������������������������������������������������������������������������������������������������������������������������������������������������������������������������������������������������������������������������������������������������������������������������������������������������������������������������������������������������������������������������������������������������������������������������������������������������������������������������������������������������������������������������������������������������������������������������������������������������������������������������������������������������������������������������������������������������������������������������������������������������������������������������������������������������������������������������������������������������������������������������������������������������������������������������������������������������������������������������������������������������������������������������������������������������������������������������������������������������������������������������������������������������������������������������������������������������������������������������������������������������������������������������������������������������������������������������������������������������������������������������������������������������������������������������������������������������������������������������������������������������������������������������������������������������������������������������������������������������������������������������������������������������������������������������������������������������������������������������������������������������������������������������������������������������������������������������������������������������������������������������������������������������������������������
��������������������������������������������������������������������������������������������������������������������������������������������������������������������������������������������������������������������������������������������������������������������������������������������������������������������������������������������������������������������������������������������������������������������������������������������������������������������������������������������������������������������������������������������������������������������������������������������������������������������������������������������������������������������������������������������������������������������������������������������������������������������������������������������������������������������������������������������������������������������������������������������������������������������������������������������������������������������������������������������������������������������������������������������������������������������������������������������������������������������������������������������������������������������������������������������������������������������������������������������������������������������������������������������������������������������������������������������������������������������������������������������������������������������������������������������������������������������������������������������������������������������������������������������������������������������������������������������������������������������������������������������������������������������������������������������������������������������������������������������������������������������������������������������������������������������������������������������������������������������������������������������������������������������������������������������������������������������������������������������������������
�������������������������������������������������������������������������������������������������������������������������������������������������������������������������������������������������������������������������������������������������
������������������������������������������������������������������������������������������������������������������������������������������������������������������������������������������������������������������������������������������������������������������������������������������������������������������������ ������������������������������������������������������������������������������� ������������������������������������������������������������������������������� ������������������������������������������������������������������������������� ������������������������������������������������������������������������������� ������������������������������������������������������������������������������� ��������
Figure 29b. Sensitivity test of sand release from Marmot Resevoir, with 10-fold increase over basic model predictions:
TSS
10
100
1000
10000
0 365 730Time following dam removal (days)
TSS (ppm)
Marmot Dam (0 km)Sandy below Bull Run River confluence (20 km)Downstream of Dabney Park (40 km)
Figure 30a. Sensitivity test of sand release from Marmot Resevoir, with 5-fold increase over basic model predictions: Thickness of sand deposition
0
0.2
0.4
0.6
0.8
1
1.2
30 32 34 36 38 40 42 44 46 48Distance from Marmot Dam (km)
Thickness of Sand Deposition (m)
Figure 30b. Sensitivity test of sand release from Marmot Resevoir, with 5-fold increase over basic model predictions:
TSS
10
100
1000
10000
0 365 730Time following dam removal (days)
TSS (ppm)
Marmot Dam (0 km)Sandy below Bull Run River confluence (20 km)Downstream of Dabney Park (40 km)
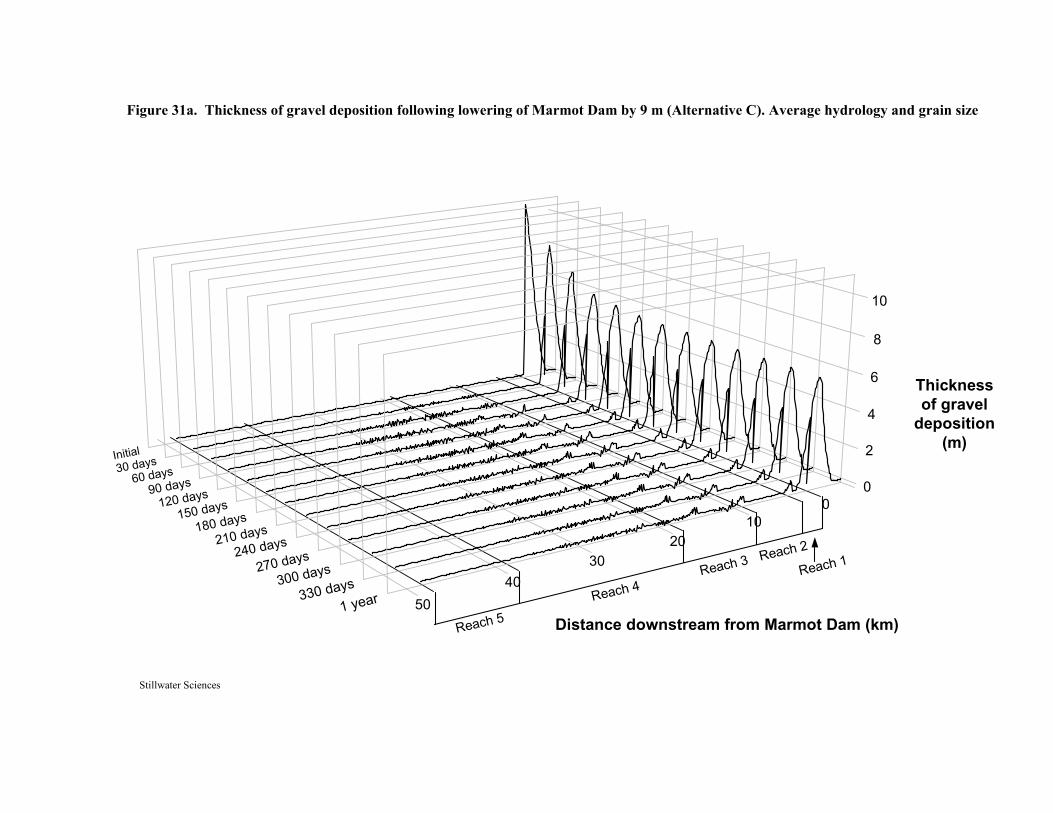
5040
3020
100
0
2
4
6
8
10
Initial30 days
60 days90 days
120 days150 days
180 days
210 days240 days
270 days
300 days
330 days1 year
Figure 31a. Thickness of gravel deposition following lowering of Marmot Dam by 9 m (Alternative C). Average hydrology and grain size
Stillwater Sciences
Thicknessof gravel
deposition(m)
Distance downstream from Marmot Dam (km)Reach 5Reach 4
Reach 3 Reach 2
Reach 1
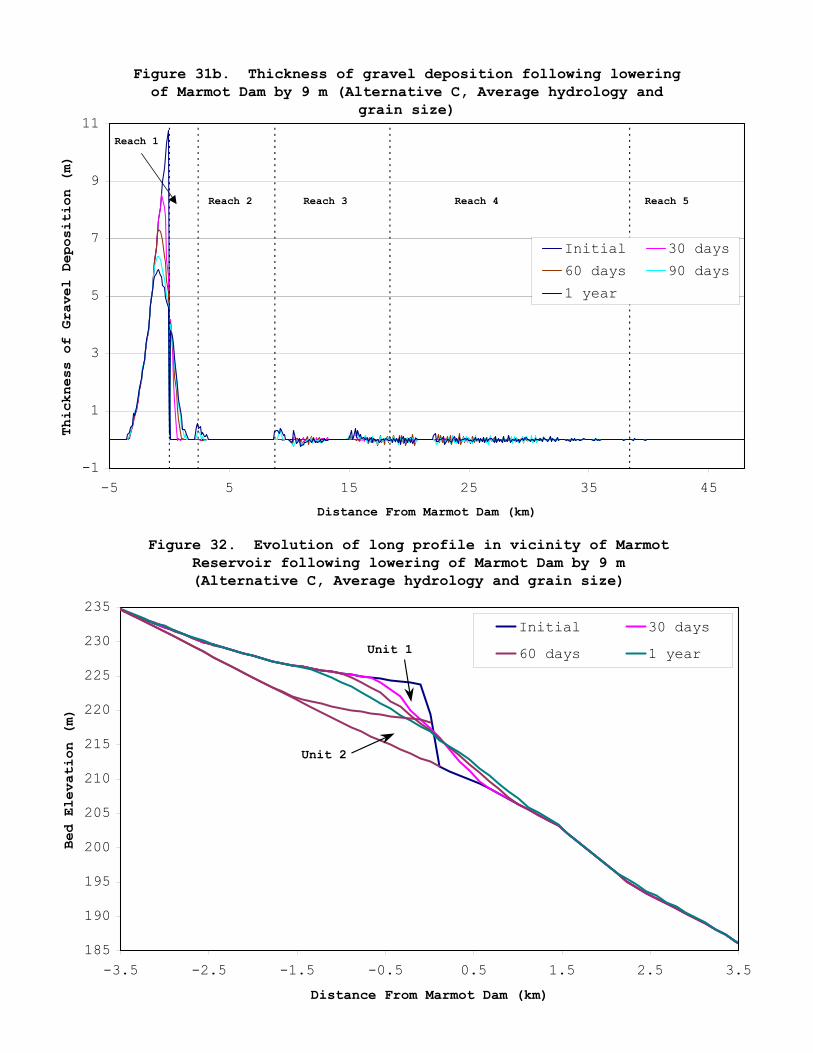
Figure 31b. Thickness of gravel deposition following lowering of Marmot Dam by 9 m (Alternative C, Average hydrology and
grain size)
-1
1
3
5
7
9
11
-5 5 15 25 35 45Distance From Marmot Dam (km)
Thickness of Gravel Deposition (m)
Initial 30 days60 days 90 days1 year
Reach 5Reach 4Reach 3Reach 2
Reach 1
Figure 32. Evolution of long profile in vicinity of Marmot Reservoir following lowering of Marmot Dam by 9 m (Alternative C, Average hydrology and grain size)
185
190
195
200
205
210
215
220
225
230
235
-3.5 -2.5 -1.5 -0.5 0.5 1.5 2.5 3.5Distance From Marmot Dam (km)
Bed Elevation (m)
Initial 30 days60 days 1 yearUnit 1
Unit 2
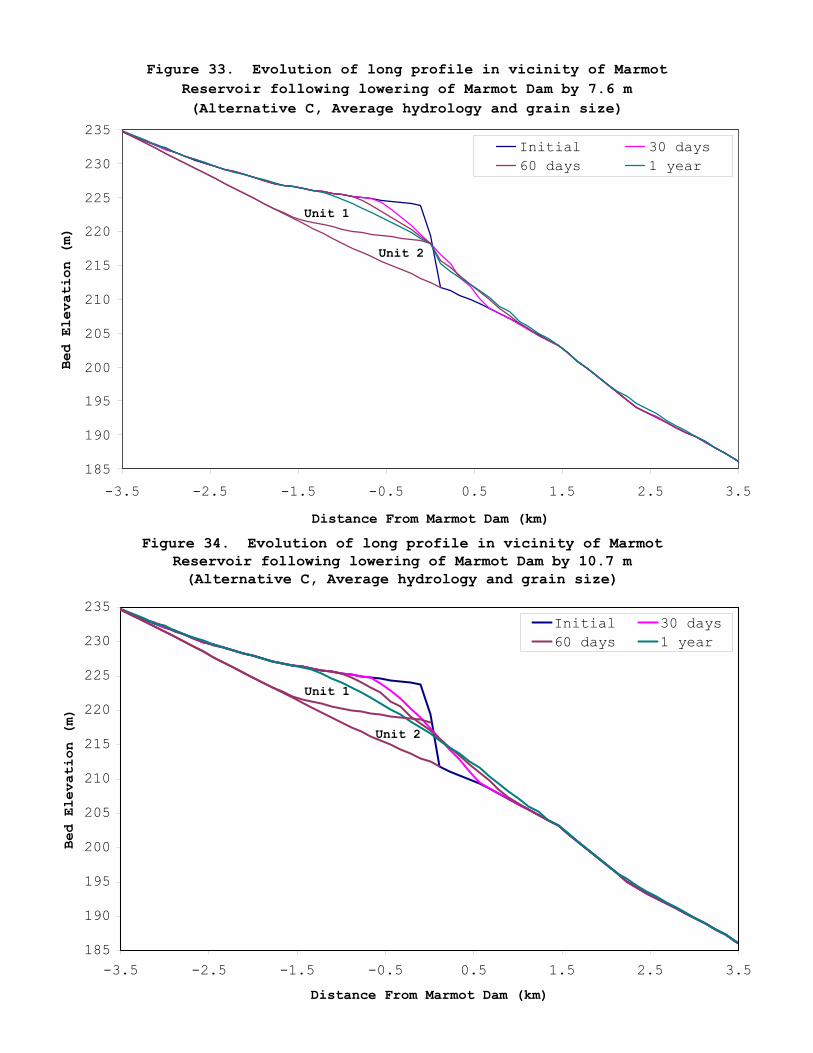
Figure 33. Evolution of long profile in vicinity of Marmot Reservoir following lowering of Marmot Dam by 7.6 m (Alternative C, Average hydrology and grain size)
185
190
195
200
205
210
215
220
225
230
235
-3.5 -2.5 -1.5 -0.5 0.5 1.5 2.5 3.5Distance From Marmot Dam (km)
Bed Elevation (m)
Initial 30 days60 days 1 year
Unit 1
Unit 2
Figure 34. Evolution of long profile in vicinity of Marmot Reservoir following lowering of Marmot Dam by 10.7 m (Alternative C, Average hydrology and grain size)
185
190
195
200
205
210
215
220
225
230
235
-3.5 -2.5 -1.5 -0.5 0.5 1.5 2.5 3.5Distance From Marmot Dam (km)
Bed
Elev
atio
n (m
)
Initial 30 days60 days 1 year
Unit 1
Unit 2
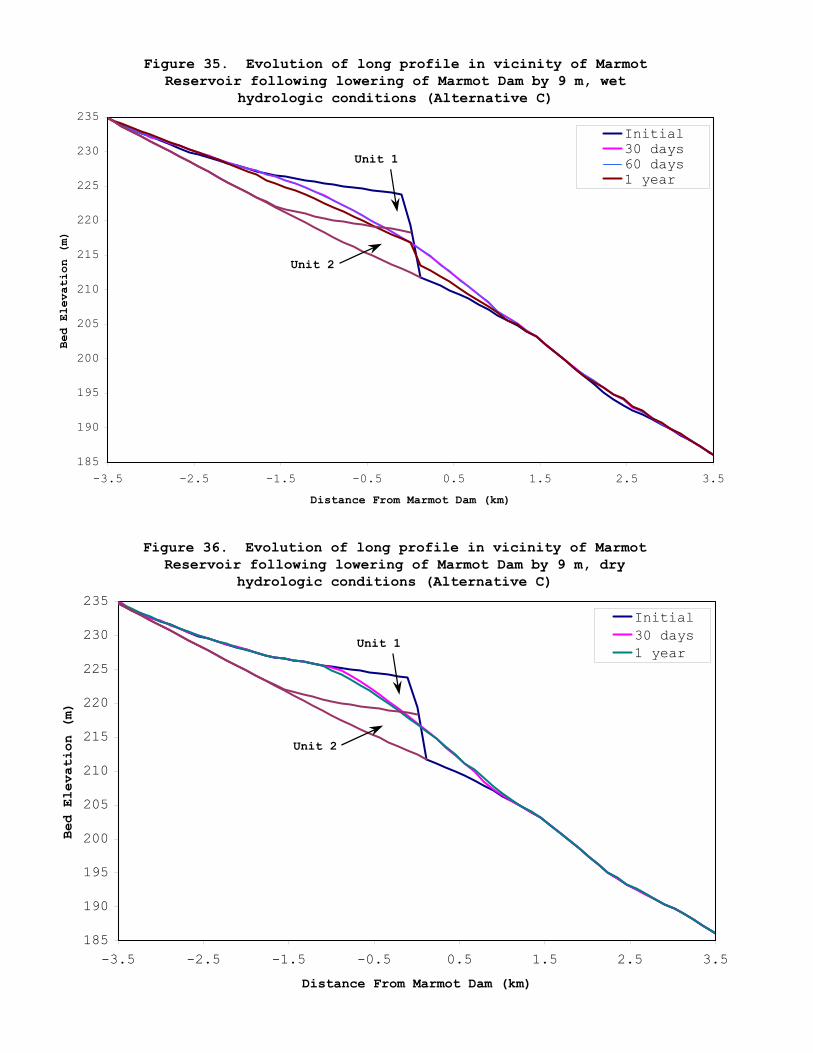
Figure 35. Evolution of long profile in vicinity of Marmot Reservoir following lowering of Marmot Dam by 9 m, wet
hydrologic conditions (Alternative C)
185
190
195
200
205
210
215
220
225
230
235
-3.5 -2.5 -1.5 -0.5 0.5 1.5 2.5 3.5Distance From Marmot Dam (km)
Bed
Elev
atio
n (m
)
Initial30 days60 days1 year
Unit 1
Unit 2
Figure 36. Evolution of long profile in vicinity of Marmot Reservoir following lowering of Marmot Dam by 9 m, dry
hydrologic conditions (Alternative C)
185
190
195
200
205
210
215
220
225
230
235
-3.5 -2.5 -1.5 -0.5 0.5 1.5 2.5 3.5Distance From Marmot Dam (km)
Bed
Elev
atio
n (m
)
Initial30 days1 yearUnit 1
Unit 2
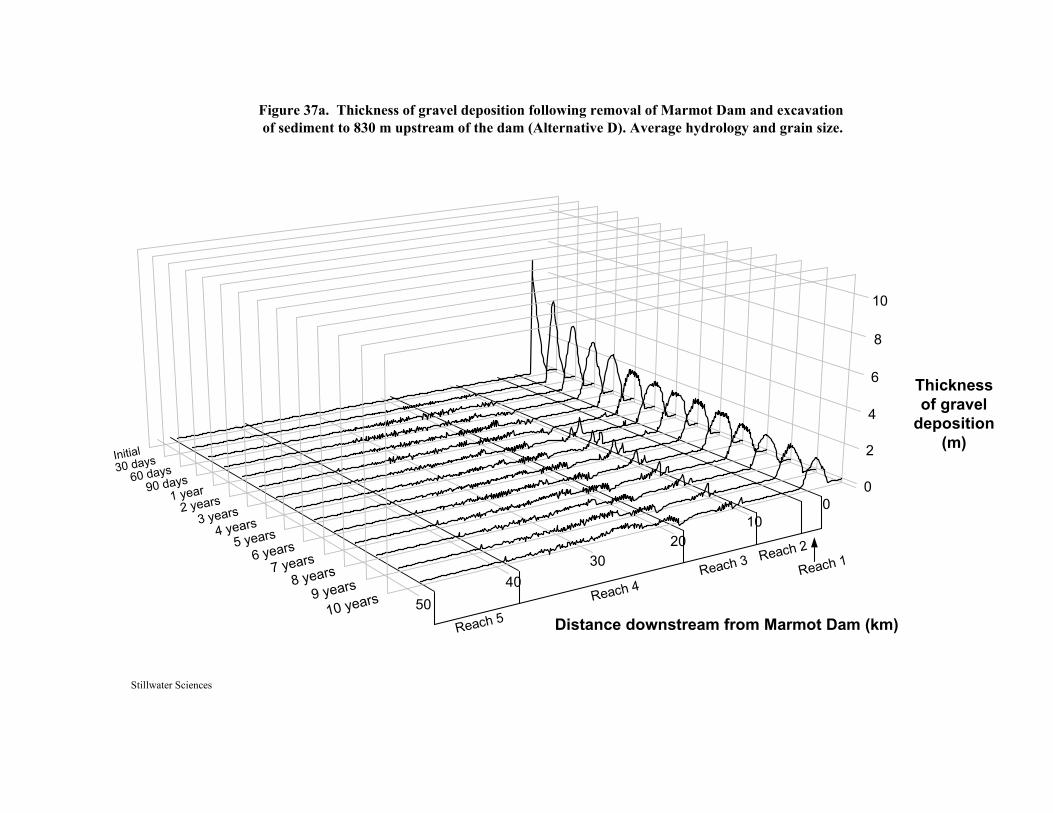
5040
3020
100
0
2
4
6
8
10
Initial30 days
60 days90 days
1 year2 years
3 years4 years
5 years6 years
7 years8 years
9 years
10 years
Figure 37a. Thickness of gravel deposition following removal of Marmot Dam and excavation of sediment to 830 m upstream of the dam (Alternative D). Average hydrology and grain size.
Stillwater Sciences
Thicknessof gravel
deposition(m)
Distance downstream from Marmot Dam (km)Reach 5Reach 4
Reach 3 Reach 2
Reach 1
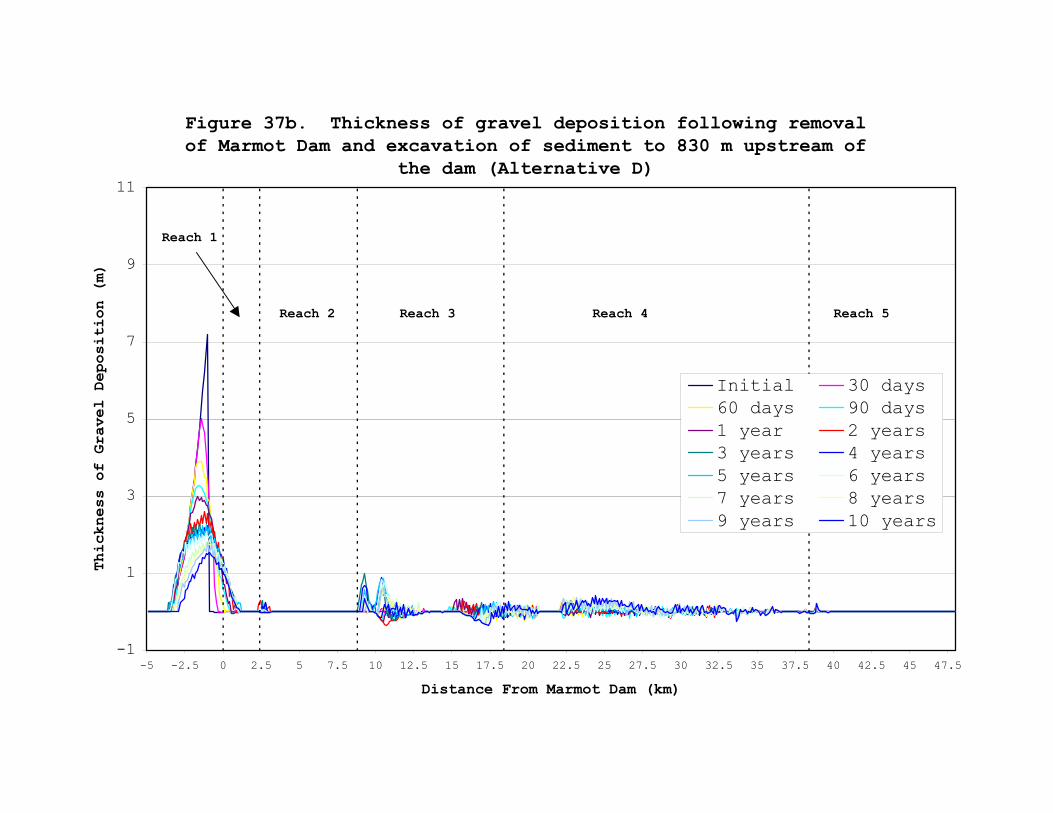
Figure 37b. Thickness of gravel deposition following removal of Marmot Dam and excavation of sediment to 830 m upstream of
the dam (Alternative D)
-1
1
3
5
7
9
11
-5 -2.5 0 2.5 5 7.5 10 12.5 15 17.5 20 22.5 25 27.5 30 32.5 35 37.5 40 42.5 45 47.5Distance From Marmot Dam (km)
Thickness of Gravel Deposition (m)
Initial 30 days60 days 90 days1 year 2 years3 years 4 years5 years 6 years7 years 8 years9 years 10 years
Reach 5Reach 4Reach 3Reach 2
Reach 1

Figure 38. Evolution of long profile in vicinity of reservoir following removal of Marmot Dam and excavation of sediment to
830 m upstream of the dam (Alternative D)
185
190
195
200
205
210
215
220
225
230
235
-3.5 -2.5 -1.5 -0.5 0.5 1.5 2.5 3.5Distance From Marmot Dam (km)
Bed Elevation (m)
Initial 30 days60 days 90 days1 year 2 years4 years 6 years8 years 10 years
Excavation
�����������������������������������������������������������������������������������������������������������������������������������������������������������������������������������������������������������������������������������������������������
�����������������������������������������������������������������������������������������������������������������������������������������������������������������������������������������������������������������������������������������������������
������������������������������������������������������������������������������������������������������������������������������������������������������������������������������������������������������������������������������������������������������������������������������������������������������������������������������������������������������������������������������������������������������������������������������������������������������������������������������������������������������������������������������������������������������������������������������������������������������������������������������������������������������������������������������������������������������������������������������������������������������������������������������������������������������������������������������������������������������������������������������������������������������������������������������������������������������������������������������������������������������������������������������������������������������������������������������������������������������������������������������������������������������������������������������������������������������������������������������������������������������������������������������������������������������������������������������������������������������������������������������������������������������������������������������������������������������������������������������������������������������������������������������
�����������������������������������������������������������������������������������������������������������������������������������������������������������������������������������������������������������������������������������������������������
�������������������������������������������������������������������������������������������������������������������������������������������������������������������������������������������������������������������������������������������������������������������������������������������������������������������������������������������������������������������������������������������������������������������������������������������������������������������������������������������������������������������������������������������������������������������������������������������� ������������������������������������������������������������������������������������������ ������������������������������������������������������������������������������������������ ������������������������������������������������������������������������������������������ ������������������������������������������������������������������������������������������ ��������
Figure 39. Total suspended sediment(TSS)at selected locations in first two years following Marmot Dam removal (Alternative D)
10
100
1000
0 365 730Time following dam removal (days)
TSS (ppm)
Marmot Dam (0 km)Sandy below Bull Run River confluence (20 km)Downstream of Dabney Park (40 km)