Embed Size (px)
Citation preview
Renewable Energy Finance 771 Individual Assignment 2013
Compton Saunders [email protected]
Name: Compton Saunders
Student Number: 13718436 Degree: PGD Sustainable Development
Module: Renewable Energy Finance Lecturers: Jako Volschenk
Total words: 5700 Due Date: September 9th, 2013
ii
Table of Contents List of Figures ............................................................................................................................ iii List of Tables ............................................................................................................................. iii List of Equations ........................................................................................................................ iii Individual Assignment – A Case Study Adaptation and Analysis for Nelspruit Municipality .... 1
1. Case Study: Smart Metering, Intelligent Load Control System incorporating ZigBee technology with IDM Heat Pump Funding ................................................................................. 1
1.1 Overview of Technology and Functionality ...................................................................... 1
1.2 Demand Control and Background .................................................................................... 4
1.3 Load Management Techniques ........................................................................................ 4
1.4 Benefits of Demand Control ............................................................................................. 5
1.5 South African Framework and Integrated Demand Management (IDM) ........................ 6
1.6 Financial ............................................................................................................................ 9
2 Sustainability ......................................................................................................................... 14
2.1 Socio-technical niche ...................................................................................................... 14
2.2 Socio-technical regimes ................................................................................................. 15
2.3 Socio-technical landscapes............................................................................................. 16
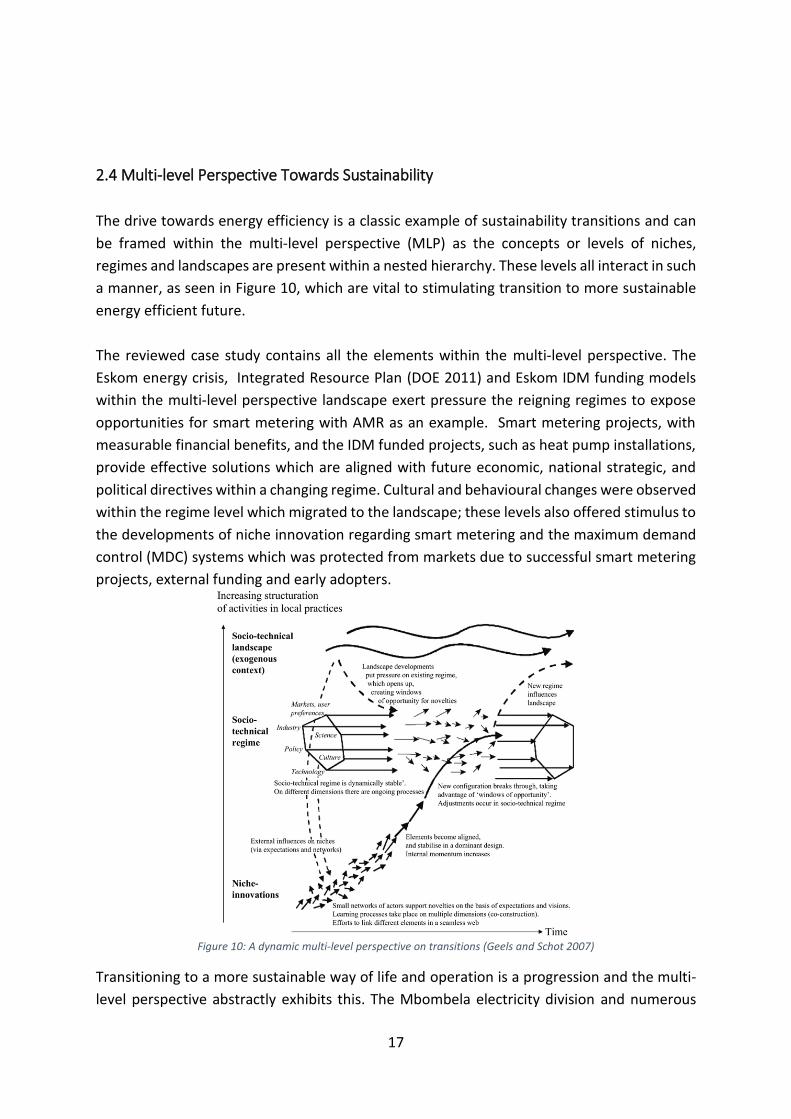
2.4 Multi-level Perspective Towards Sustainability ............................................................. 17
3. Conclusion ............................................................................................................................ 18
Bibliography ............................................................................................................................. 19
iii
List of Figures Figure 1: Energy consumption data as seen in Liveview portal - quasi real-time ..................... 2
Figure 2: Arial view of property where ZigBee wireless mesh technology load switches are installed ...................................................................................................................................... 2
Figure 3: A screen capture of the SCADA interface which allows users to check the status or manually override the control system ....................................................................................... 3
Figure 4: Real operational Ecosystem: Smart Metering with energy efficient heat pumps and Zigbee based maximum demand control .................................................................................. 3
Figure 5: Load management load shape objectives. Source (Malik and AL Mata’ni 2007) ...... 5
Figure 6: Eskom IDM programme overview. Source ESKOM (2012a). ...................................... 7
Figure 7: Electric boiler monthly energy consumption and cost ............................................. 10
Figure 8: Demand of 175 KVA was reached prior to MDC install – monthly cost R15 118 ..... 11
Figure 9: Demand of 135 KVA was reached after MDC install – monthly cost R11 626 ......... 11
Figure 10: A dynamic multi-level perspective on transitions (Geels and Schot 2007) ............ 17
List of Tables Table 1: Eskom Standard Offer and Standard Program payback rates per technology. Source (ESKOM 2013b) .......................................................................................................................... 8
Table 2: Standard Offer payback example total ........................................................................ 8
Table 3: Standard Offer payback structure ................................................................................ 8
Table 4: System cost summary .................................................................................................. 9
Table 5: Cash flow analysis indicating NPV and IRR ................................................................ 13
List of Equations Equation 1: Net Present Value Formula. Source (Bas 2013) ................................................... 12
Equation 2: IRR calculation formula. Source (Bas 2013) ......................................................... 12
Individual Assignment – A Case Study Adaptation and Analysis for Nelspruit Municipality
1. Case Study: Smart Metering, Intelligent Load Control System incorporating ZigBee technology with IDM Heat Pump Funding Over the past few years the researcher has been involved in the development of an innovative
integration project which revolves around smart metering with RF (radio frequency) mesh
communications and maximum demand control (MDC) combined with projects funded via
the Eskom Integrated Demand Management (IDM)1 funding models. One of the aspects which
make these projects unique is the use of ZigBee2 wireless mesh technology within the system
architecture. The case study will attempt to assess the energy efficiency project from a
financial and sustainability transition multilevel perspective. Energy efficiency is not just a
function of technology but also a function of society and its behaviour. A multi-level
perspective (MLP), also seen as a socio-technical transition, considers technology as having a
vital role in sustainability transitions and considers factors including economics, politics,
technology, society and ecology. Geels (2002) states that it is not solely engineers who can
influence technical curves but also policy makers, providers, researchers, consumers, social
groups and capital banks all have a role to play within the process. This is corroborated by
Geels (2010) who states that due to the multi-dimensional nature of such transitions it can be
studied by an array of disciplines and from numerous angles.
1.1 Overview of Technology and Functionality
In the past three years the researcher has implemented numerous smart metering, maximum
demand control systems and energy efficiency projects in Mpumalanga. The advent of smart
metering using automated meter reading (AMR3) has greatly influenced the way the Nelspruit
Municipality and local businesses regard their energy consumption. This has opened the
opportunity to promote energy efficiency technology such as heat pumps using Eskom IDM
funding as well as drive more innovative solutions such as maximum demand control systems.
According to Rousseau and Greyvenstein (2000) at the time of their research heat pump
water heaters (HPWHs) had only been able to penetrate 16% of the commercial water heating
1 Also known as Energy Efficiency and Demand Side Management (EEDSM) or Demand Side Management (DSM) 2 ZigBee is of high level wireless communication protocol that can form mesh networks and enables the relay of information between devices. 3 Automated meter reading (AMR) is the collection of energy consumption data via remote methods such as GPRS in order to bill clients. No person has to visit the meter to take readings.
2
market regardless of their consumption being about one third of the energy and peak demand
than that of a conventional boiler or geyser. This has dramatically changed due to the current
South African energy crisis and incentives schemes which has led to mass rollouts of (HPWHs)
within schools, the hospitality industry and universities to name few. The researcher has been
involved in projects specifically related to schools which have large hostels using conventional
direct electrical resistance boilers and wanted to change to HPWHs as they could access the
Eskom IDM funding while reducing their energy requirements.
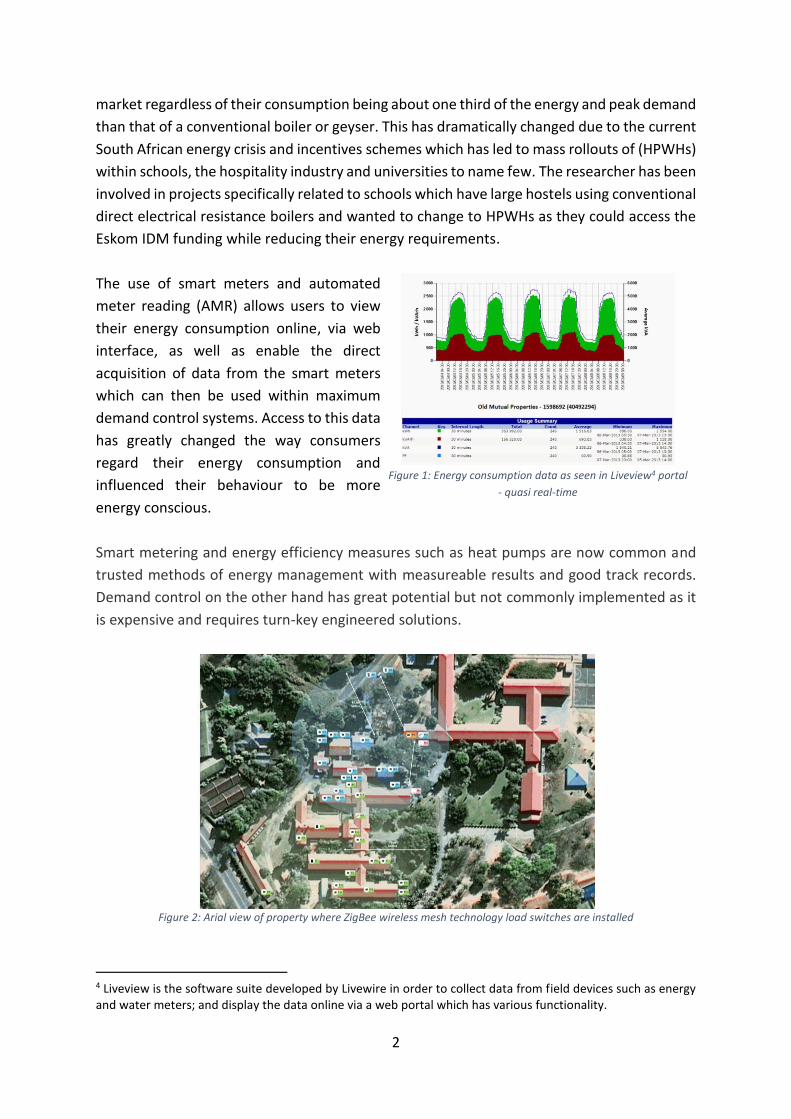
The use of smart meters and automated
meter reading (AMR) allows users to view
their energy consumption online, via web
interface, as well as enable the direct
acquisition of data from the smart meters
which can then be used within maximum
demand control systems. Access to this data
has greatly changed the way consumers
regard their energy consumption and
influenced their behaviour to be more
energy conscious.
Figure 1: Energy consumption data as seen in Liveview4 portal
- quasi real-time
Smart metering and energy efficiency measures such as heat pumps are now common and
trusted methods of energy management with measureable results and good track records.
Demand control on the other hand has great potential but not commonly implemented as it
is expensive and requires turn-key engineered solutions.
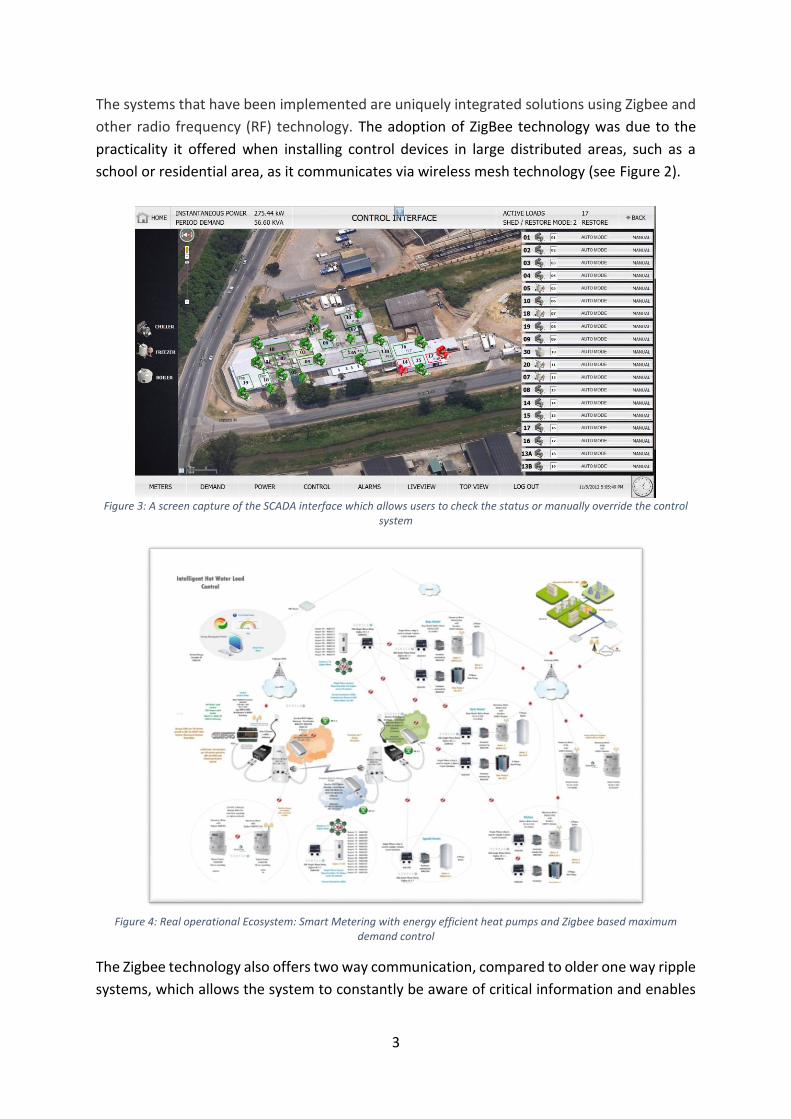
Figure 2: Arial view of property where ZigBee wireless mesh technology load switches are installed
4 Liveview is the software suite developed by Livewire in order to collect data from field devices such as energy and water meters; and display the data online via a web portal which has various functionality.
3
The systems that have been implemented are uniquely integrated solutions using Zigbee and
other radio frequency (RF) technology. The adoption of ZigBee technology was due to the
practicality it offered when installing control devices in large distributed areas, such as a
school or residential area, as it communicates via wireless mesh technology (see Figure 2).
Figure 3: A screen capture of the SCADA interface which allows users to check the status or manually override the control
system
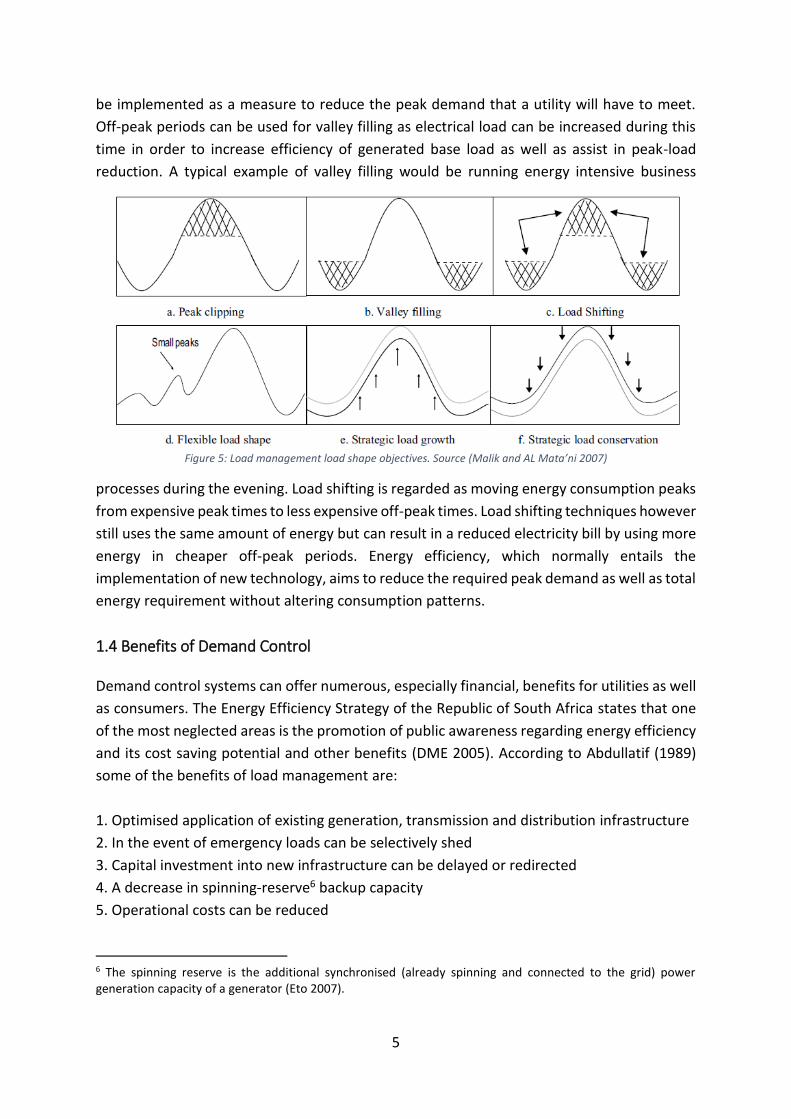
Figure 4: Real operational Ecosystem: Smart Metering with energy efficient heat pumps and Zigbee based maximum
demand control
The Zigbee technology also offers two way communication, compared to older one way ripple
systems, which allows the system to constantly be aware of critical information and enables
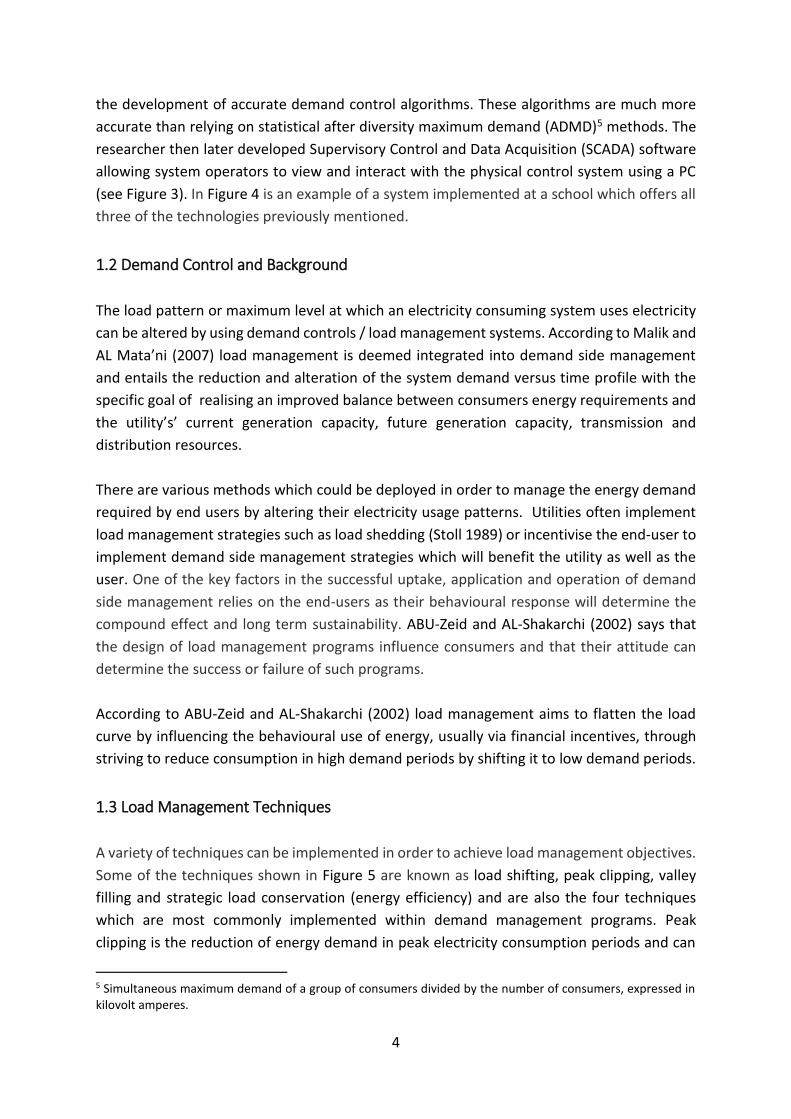
4
the development of accurate demand control algorithms. These algorithms are much more
accurate than relying on statistical after diversity maximum demand (ADMD)5 methods. The
researcher then later developed Supervisory Control and Data Acquisition (SCADA) software
allowing system operators to view and interact with the physical control system using a PC
(see Figure 3). In Figure 4 is an example of a system implemented at a school which offers all
three of the technologies previously mentioned.
1.2 Demand Control and Background
The load pattern or maximum level at which an electricity consuming system uses electricity
can be altered by using demand controls / load management systems. According to Malik and
AL Mata’ni (2007) load management is deemed integrated into demand side management
and entails the reduction and alteration of the system demand versus time profile with the
specific goal of realising an improved balance between consumers energy requirements and
the utility’s’ current generation capacity, future generation capacity, transmission and
distribution resources.
There are various methods which could be deployed in order to manage the energy demand
required by end users by altering their electricity usage patterns. Utilities often implement
load management strategies such as load shedding (Stoll 1989) or incentivise the end-user to
implement demand side management strategies which will benefit the utility as well as the
user. One of the key factors in the successful uptake, application and operation of demand
side management relies on the end-users as their behavioural response will determine the
compound effect and long term sustainability. ABU-Zeid and AL-Shakarchi (2002) says that
the design of load management programs influence consumers and that their attitude can
determine the success or failure of such programs.
According to ABU-Zeid and AL-Shakarchi (2002) load management aims to flatten the load
curve by influencing the behavioural use of energy, usually via financial incentives, through
striving to reduce consumption in high demand periods by shifting it to low demand periods.
1.3 Load Management Techniques
A variety of techniques can be implemented in order to achieve load management objectives.
Some of the techniques shown in Figure 5 are known as load shifting, peak clipping, valley
filling and strategic load conservation (energy efficiency) and are also the four techniques
which are most commonly implemented within demand management programs. Peak
clipping is the reduction of energy demand in peak electricity consumption periods and can
5 Simultaneous maximum demand of a group of consumers divided by the number of consumers, expressed in kilovolt amperes.
5
be implemented as a measure to reduce the peak demand that a utility will have to meet.
Off-peak periods can be used for valley filling as electrical load can be increased during this
time in order to increase efficiency of generated base load as well as assist in peak-load
reduction. A typical example of valley filling would be running energy intensive business
Figure 5: Load management load shape objectives. Source (Malik and AL Mata’ni 2007)
processes during the evening. Load shifting is regarded as moving energy consumption peaks
from expensive peak times to less expensive off-peak times. Load shifting techniques however
still uses the same amount of energy but can result in a reduced electricity bill by using more
energy in cheaper off-peak periods. Energy efficiency, which normally entails the
implementation of new technology, aims to reduce the required peak demand as well as total
energy requirement without altering consumption patterns.
1.4 Benefits of Demand Control Demand control systems can offer numerous, especially financial, benefits for utilities as well
as consumers. The Energy Efficiency Strategy of the Republic of South Africa states that one
of the most neglected areas is the promotion of public awareness regarding energy efficiency
and its cost saving potential and other benefits (DME 2005). According to Abdullatif (1989)
some of the benefits of load management are:
1. Optimised application of existing generation, transmission and distribution infrastructure
2. In the event of emergency loads can be selectively shed
3. Capital investment into new infrastructure can be delayed or redirected
4. A decrease in spinning-reserve6 backup capacity
5. Operational costs can be reduced
6 The spinning reserve is the additional synchronised (already spinning and connected to the grid) power generation capacity of a generator (Eto 2007).
6
6. System load factors can be improved by shifting energy consumption to off-peak periods.
Reducing and shifting load demand can have a significant cost saving effect for industrial and
commercial consumers. The tariffs which are used to calculate the electricity bill for industrial
and commercial consumers have different structures to that of residential consumers and can
include levies, and other charges within the structure besides the energy consumed in
kilowatt-hours (kWh). There can be a considerable financial benefit for managing the Time-
Of-Use (TOU) of energy as well as keeping the demand or notified demand7 below a selected
level.
1.5 South African Framework and Integrated Demand Management (IDM)
In 2005 the National Energy Efficiency Strategy for South Africa had set the goal of achieving
a 15% decrease in energy consumption by 2015 (DME 2005). Eskom8 established its
Integrated Demand Management (IDM) division in order to address the South African energy
and especially electricity supply challenges. The Eskom IDM initiative utilises the framework
and goals set out by the White Paper on Energy Policy (DME 1998), Energy Efficiency Strategy
of the Republic of South Africa (DME 2005) published by the department of Minerals and
Energy (DME) as well the Energy Efficiency and Demand Side Management Policy (NERSA
2012) issued by and the National Energy Regulator (NERSA). NERSA has a mandate to ensure
energy security while the publications by the DME notes the potential of energy efficiency
initiatives. All development and planning decisions related to energy can be geared around
the framework provided by the Integrated Energy Plan for the Republic of South Africa (DME
2003) which also serves as a model to the Integrated Resource Plan (IRP) (DOE 2011). The IRP
focuses on 20 year periods and development planning for demand and supply side strategies
in order to facilitate economical energy security. According to ESKOM (2013a) numerous
initiatives with the purpose of energy consumption optimisation and demand versus supply
balancing are in coordination via the IDM in order to safeguard short-term energy security.
The advancement and application of technologies, processes and consumer behaviour which
are more energy efficient is a key part of the IDM programme ESKOM (2013a).
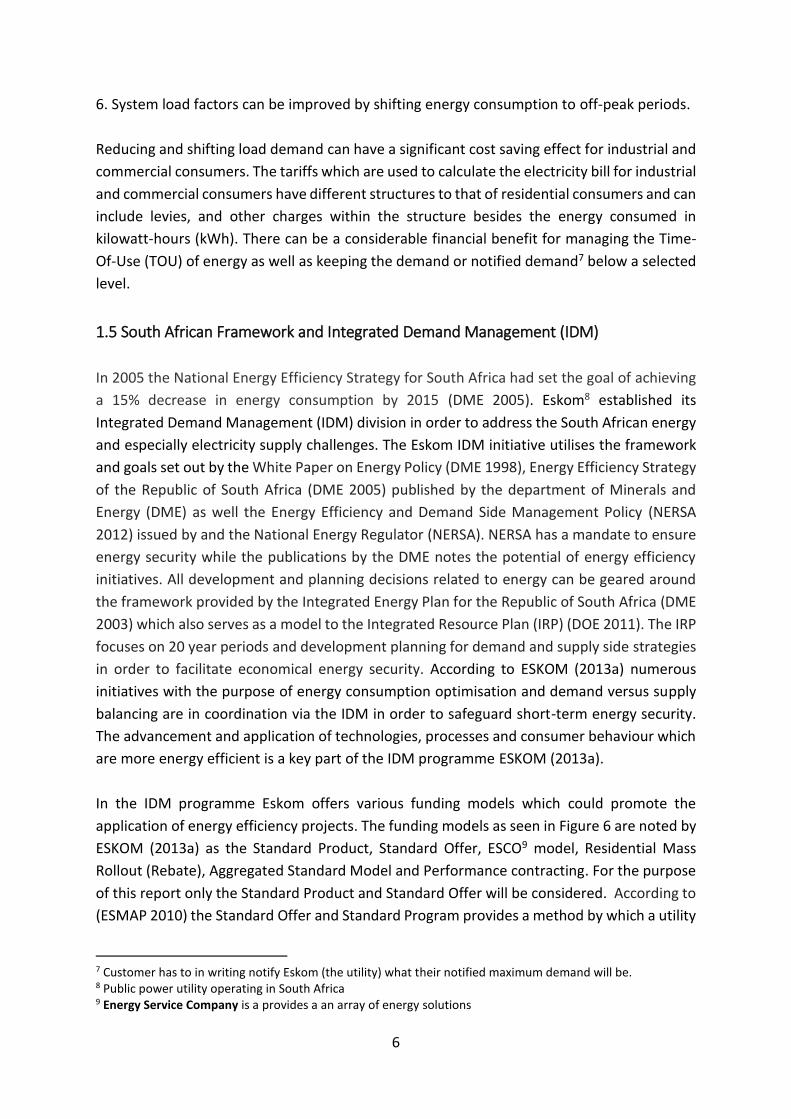
In the IDM programme Eskom offers various funding models which could promote the
application of energy efficiency projects. The funding models as seen in Figure 6 are noted by
ESKOM (2013a) as the Standard Product, Standard Offer, ESCO9 model, Residential Mass
Rollout (Rebate), Aggregated Standard Model and Performance contracting. For the purpose
of this report only the Standard Product and Standard Offer will be considered. According to
(ESMAP 2010) the Standard Offer and Standard Program provides a method by which a utility
7 Customer has to in writing notify Eskom (the utility) what their notified maximum demand will be. 8 Public power utility operating in South Africa 9 Energy Service Company is a provides a an array of energy solutions
7
such as Eskom can buy reductions in energy saving or demand requirements by using a
predetermined and published rate for Rand per kW or in cents per kWh for measured and
verified savings thus enhancing demand-side resources. Standard Product and Standard Offer
only include the following technologies10 within the industrial and commercial sectors:
Renewable energy
Energy efficient lighting systems
Building management systems
Electrical hot water systems
Process optimisation
Solar water heaters
LED down lighters
Figure 6: Eskom IDM programme overview. Source ESKOM (2012a)
The Standard Offer will pay 70% of anticipated total savings after commissioning and
verification with an additional 10% per year for the next three years. In order for the payment
to be made an independent Measurement and Verification (M&V) professional has to assess
and confirm the energy savings according to the guidelines and procedures set out by Eskom
and SATS 50010:2010 standard (ESKOM 2013a). Below in Table 1 is the 2013 predetermined
payback rate offered by Eskom on its Standard Offer funding model (ESKOM 2013b).
10 Only peak times considered and thus focusing on the 16 daytime hours between 6am and 10pm, weekdays.
8
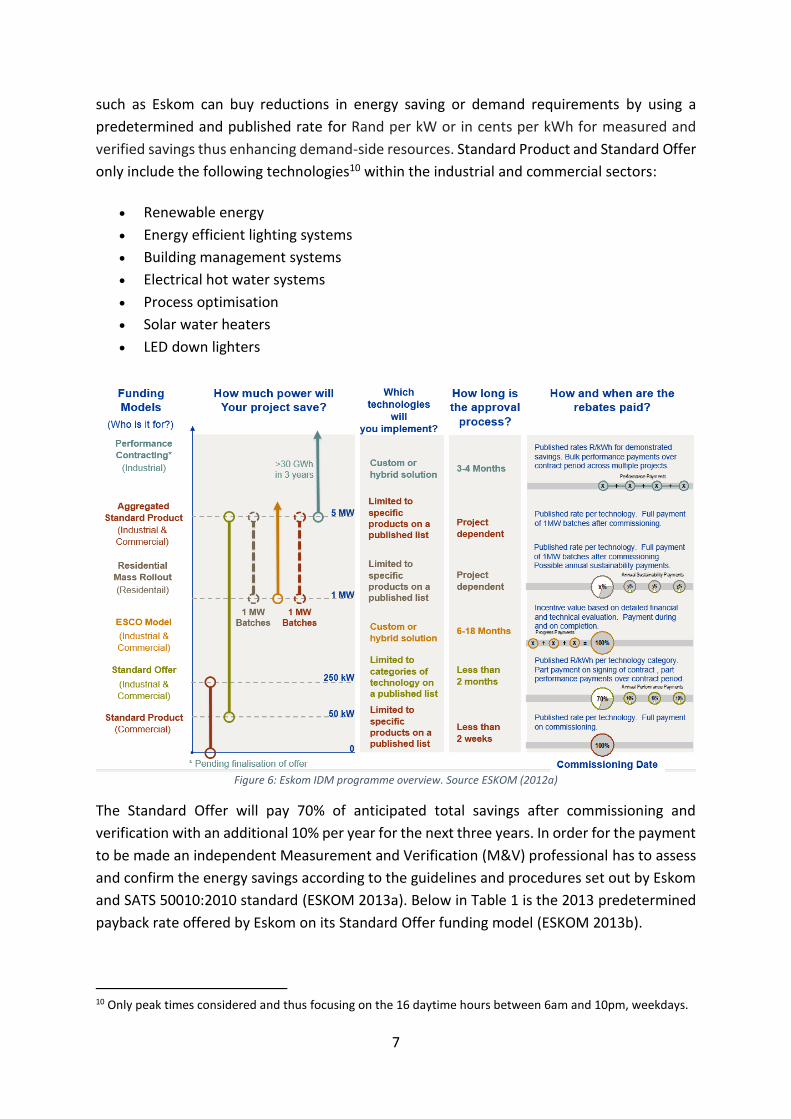
Considering a practical example. A proposal is made for an energy efficiency project under
the Standard Offer Programme and claims to reduce demand side load by 500kW. There are
4160 (16 x 5 x 52) peak hours in a year with a technology offering a rate of R0.42 per kWh
(see Table 1) which equates to rebate value of R2, 620,800 as seen in Table 2. The payback
structure is indicated in Table 3 as per the Standard Offer rules (ESKOM 2013b; ESKOM
2012a).
Table 1: Eskom Standard Offer and Standard Program payback rates per technology. Source (ESKOM 2013b)
Target technologies Benchmark up to Rm/MW c/kWh
Energy efficient lighting systems 5.25 42
LED lighting technologies 6.86 55
Building management systems 5.25 42
Hot water systems 5.25 42
Process optimisation 5.25 42
Industrial and commercial solar water systems 8.736 70
Renewable energy 14.5(average) 120
Table 2: Standard Offer payback example total
Projected Annual kWh Saving Rate [c/kWh] Term [Years]
Capped Rebate Value
500kW x 4160h = 2,080,000 kWh 42 3 R2,620,800.00
Table 3: Standard Offer payback structure
Measure Acceptance Date (70%)
Performance Payment Year 1 (10%)
Performance Payment Year 2 (10%)
Performance Payment Year 3 (10%)
R 1, 834,560.00 R 262,080.00 R 262,080.00 R 262,080.00
As seen from the Tables 1, 2 and 3 above, the Standard Offer provides substantial financial
incentives to implement energy efficiency solutions and can positively contribute to meeting
energy savings objectives. The IDM program within South Africa is a continuous partnership
between the South African government and the utility Eskom. One of the factors that make it
unique is the fact that Eskom has been dynamically partaking in evolving solutions which are
practical (Nortje 2006).
9
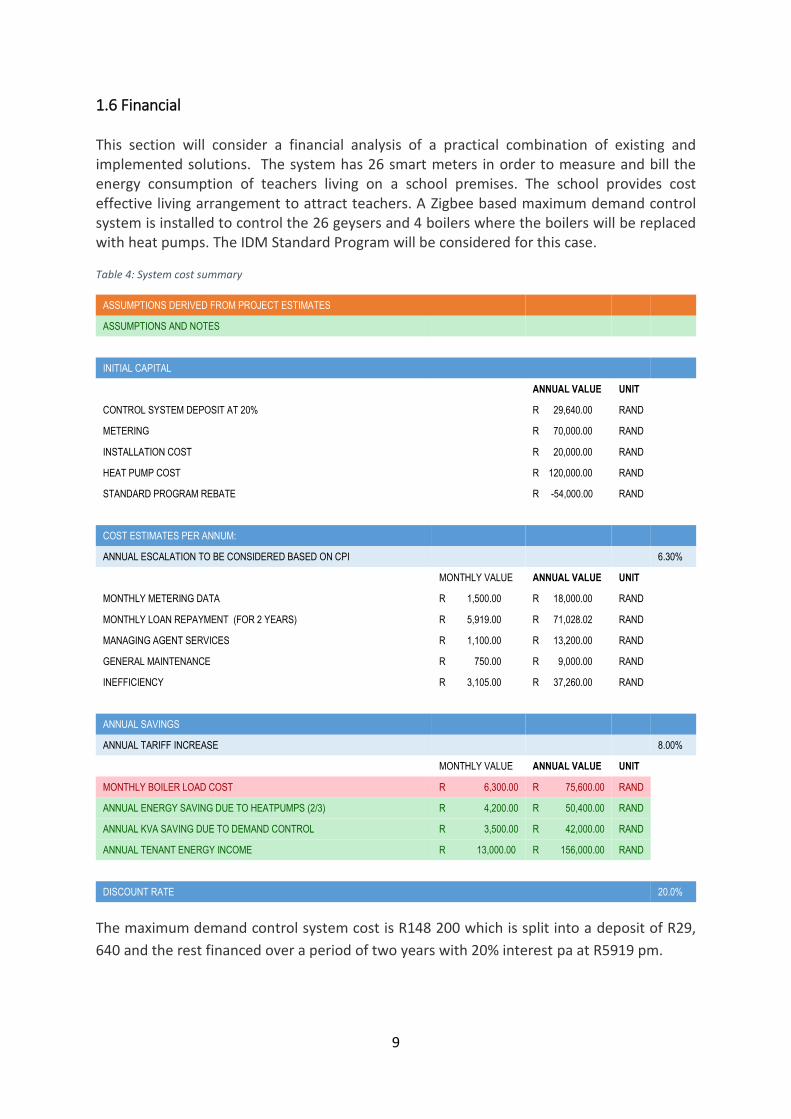
1.6 Financial This section will consider a financial analysis of a practical combination of existing and implemented solutions. The system has 26 smart meters in order to measure and bill the energy consumption of teachers living on a school premises. The school provides cost effective living arrangement to attract teachers. A Zigbee based maximum demand control system is installed to control the 26 geysers and 4 boilers where the boilers will be replaced with heat pumps. The IDM Standard Program will be considered for this case. Table 4: System cost summary
ASSUMPTIONS DERIVED FROM PROJECT ESTIMATES
ASSUMPTIONS AND NOTES
INITIAL CAPITAL
ANNUAL VALUE UNIT
CONTROL SYSTEM DEPOSIT AT 20% R 29,640.00 RAND
METERING R 70,000.00 RAND
INSTALLATION COST R 20,000.00 RAND
HEAT PUMP COST R 120,000.00 RAND
STANDARD PROGRAM REBATE R -54,000.00 RAND
COST ESTIMATES PER ANNUM:
ANNUAL ESCALATION TO BE CONSIDERED BASED ON CPI 6.30%
MONTHLY VALUE ANNUAL VALUE UNIT
MONTHLY METERING DATA R 1,500.00 R 18,000.00 RAND
MONTHLY LOAN REPAYMENT (FOR 2 YEARS) R 5,919.00 R 71,028.02 RAND
MANAGING AGENT SERVICES R 1,100.00 R 13,200.00 RAND
GENERAL MAINTENANCE R 750.00 R 9,000.00 RAND
INEFFICIENCY R 3,105.00 R 37,260.00 RAND
ANNUAL SAVINGS
ANNUAL TARIFF INCREASE 8.00%
MONTHLY VALUE ANNUAL VALUE UNIT
MONTHLY BOILER LOAD COST R 6,300.00 R 75,600.00 RAND
ANNUAL ENERGY SAVING DUE TO HEATPUMPS (2/3) R 4,200.00 R 50,400.00 RAND
ANNUAL KVA SAVING DUE TO DEMAND CONTROL R 3,500.00 R 42,000.00 RAND
ANNUAL TENANT ENERGY INCOME R 13,000.00 R 156,000.00 RAND
DISCOUNT RATE 20.0%
The maximum demand control system cost is R148 200 which is split into a deposit of R29,
640 and the rest financed over a period of two years with 20% interest pa at R5919 pm.
10
The metering system, heat pumps and installation cost is paid on delivery. According to
(ESKOM 2013c) and the IDM Standard Product offering approved heat pumps can be used
and IDM funding could be accessed within two weeks. A preliminary calculation using the
Standard Product Toolkit indicates a rebate of about R54 000 can be obtained (ESKOM 2013c).
The metering data collection (AMR) and billing requires data services and billing which is for
the clients account as well as general maintenance which incur a monthly cost of R1100,
R1500 and R750 respectively.
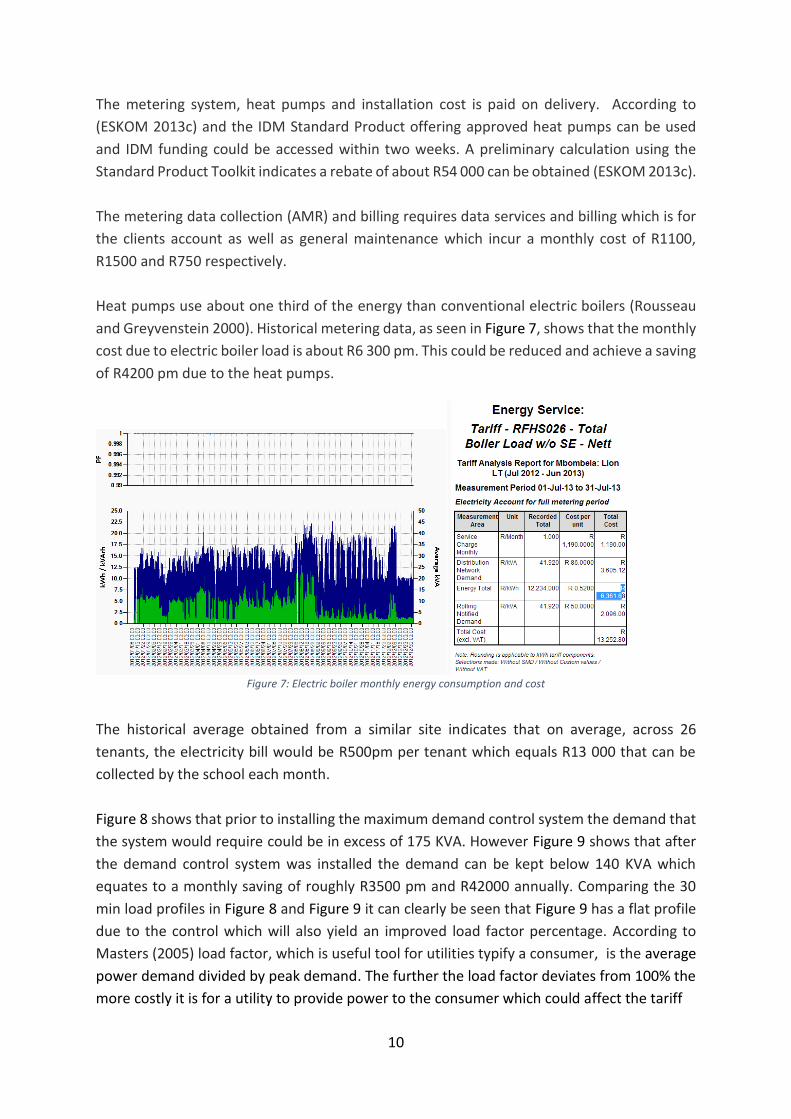
Heat pumps use about one third of the energy than conventional electric boilers (Rousseau
and Greyvenstein 2000). Historical metering data, as seen in Figure 7, shows that the monthly
cost due to electric boiler load is about R6 300 pm. This could be reduced and achieve a saving
of R4200 pm due to the heat pumps.
Figure 7: Electric boiler monthly energy consumption and cost
The historical average obtained from a similar site indicates that on average, across 26
tenants, the electricity bill would be R500pm per tenant which equals R13 000 that can be
collected by the school each month.
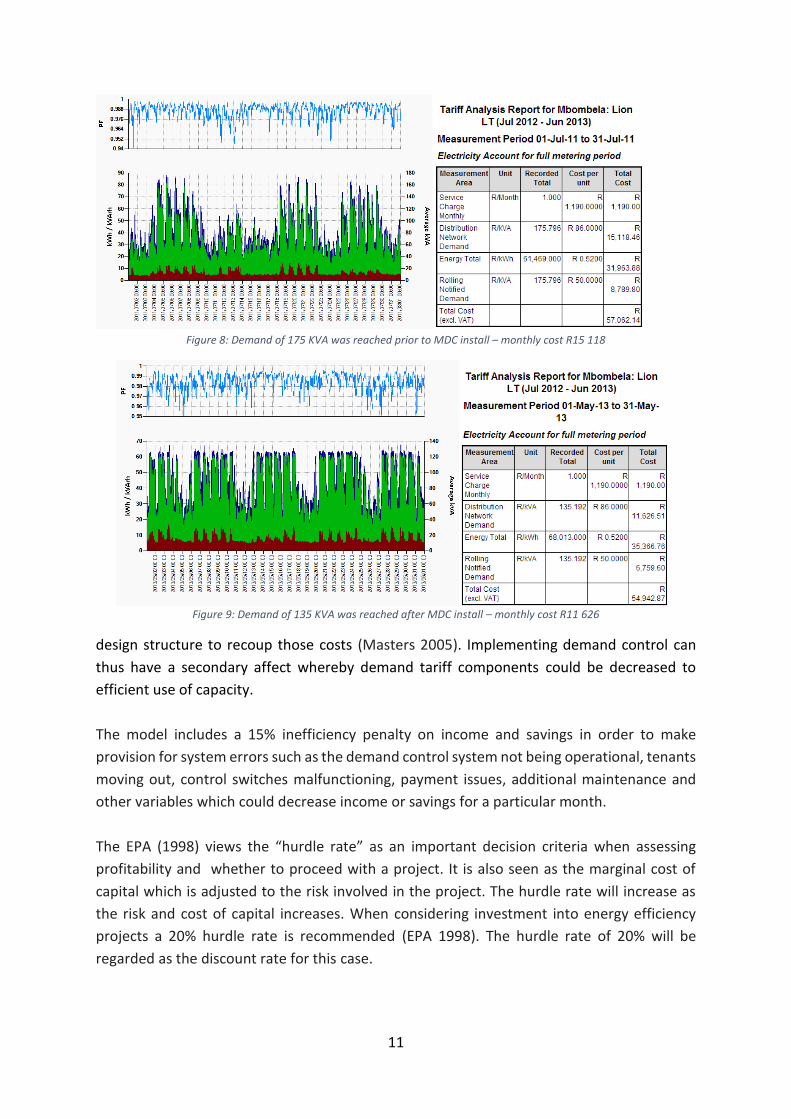
Figure 8 shows that prior to installing the maximum demand control system the demand that
the system would require could be in excess of 175 KVA. However Figure 9 shows that after
the demand control system was installed the demand can be kept below 140 KVA which
equates to a monthly saving of roughly R3500 pm and R42000 annually. Comparing the 30
min load profiles in Figure 8 and Figure 9 it can clearly be seen that Figure 9 has a flat profile
due to the control which will also yield an improved load factor percentage. According to
Masters (2005) load factor, which is useful tool for utilities typify a consumer, is the average
power demand divided by peak demand. The further the load factor deviates from 100% the
more costly it is for a utility to provide power to the consumer which could affect the tariff
11
Figure 8: Demand of 175 KVA was reached prior to MDC install – monthly cost R15 118
Figure 9: Demand of 135 KVA was reached after MDC install – monthly cost R11 626
design structure to recoup those costs (Masters 2005). Implementing demand control can
thus have a secondary affect whereby demand tariff components could be decreased to
efficient use of capacity.
The model includes a 15% inefficiency penalty on income and savings in order to make
provision for system errors such as the demand control system not being operational, tenants
moving out, control switches malfunctioning, payment issues, additional maintenance and
other variables which could decrease income or savings for a particular month.
The EPA (1998) views the “hurdle rate” as an important decision criteria when assessing
profitability and whether to proceed with a project. It is also seen as the marginal cost of
capital which is adjusted to the risk involved in the project. The hurdle rate will increase as
the risk and cost of capital increases. When considering investment into energy efficiency
projects a 20% hurdle rate is recommended (EPA 1998). The hurdle rate of 20% will be
regarded as the discount rate for this case.
12
Project investment appraisal methods such as Net Present Value (NPV) and Internal Rate of
return (IRR) are used to determine whether projects should be declined or accepted (Bas
2013). According to the EPA (1998) the NPV is the total net cash flow that will be generated
by a project during its lifespan and is inclusive of the initial costs as well as where cash flows
in future are discounted.
𝑁𝑃𝑉 = ∑𝑏𝑛 − 𝑐𝑛
(1 + 𝑟)𝑛
𝑁
𝑛=0
[1]
Equation 1: Net Present Value Formula. Source (Bas 2013)
In Equation 1, bn represents the incoming cash flow and cn represents the cash going out for
the period n.
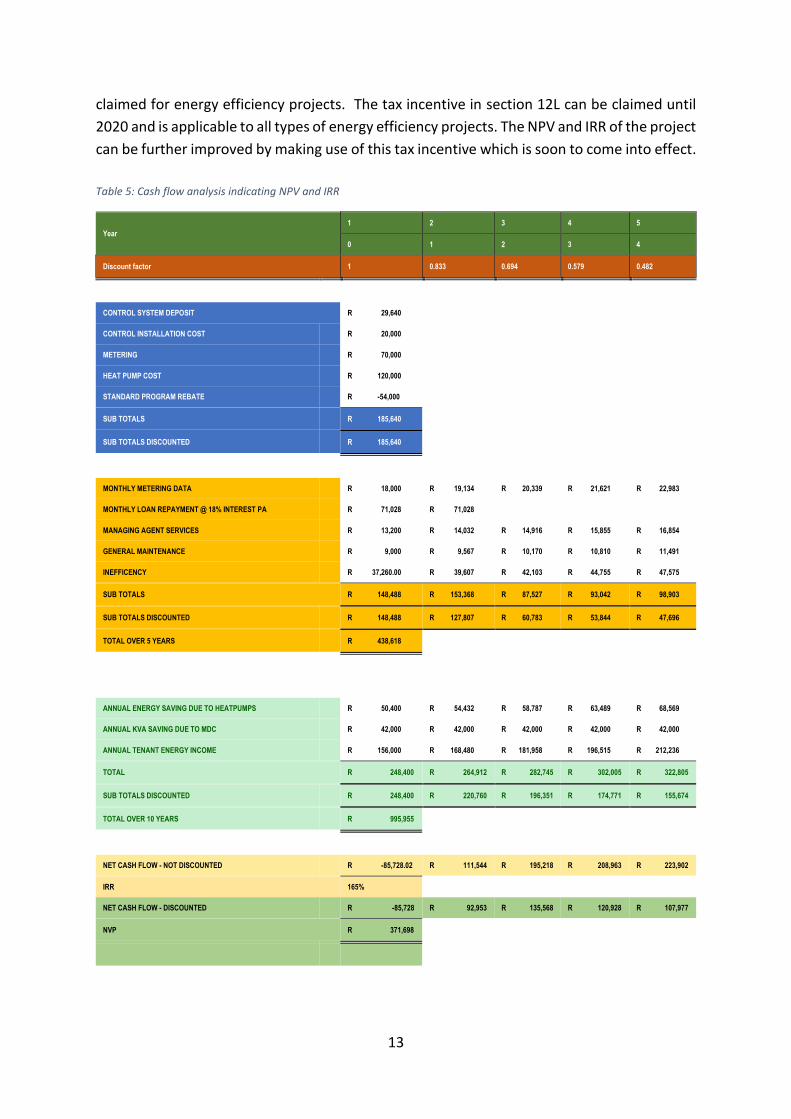
Table 5 shows the cash flows for a period of 5 years and indicates that after 5 year the project
will have a NPV in excess of R370 000. Bas (2013) states that if the NPV of a project is less
than zero it should be rejected while a value of zero would require the decision maker to be
indifferent. However if the NPV is greater than zero it should be considered (Park and Sharp-
Bette 1990). This project would add value to the schools operations and should thus be
considered.
According to EPA (1998) the IRR, which is stated as a percentage, can be seen as the
percentage of interest that connects the projects initial capital investment with the cash flows
expected in the future. The profitability of an investment can be determined by the IRR
percentage as it can directly be evaluated against a loan or hurdle rate (EPA 1998).
∑𝑏𝑛 − 𝑐𝑛
(1 + 𝑟)𝑛
𝑁
𝑛=0
= 0 [2]
Equation 2: IRR calculation formula. Source (Bas 2013)
In order to calculate the IRR a value for 𝑟 has to be found which satisfies the equation.
According to Bas (2013) and Park and Sharp-Bette (1990) if the IRR is higher than what they
call the “Minimum Attractive Rate of Return” ,which can be the hurdle rate, the project can
be accepted and if it is below the project is rejected.
Table 5 shows that over a 5 year period the IRR for the case study is 165% which is way above
the hurdle rate of 20% and indicates that the project should be considered.
Section 19 of the National Energy Act, 2008 (Act no 34 of 2008) (DOE 2008) makes provision
for regulations that allow energy efficiency savings in conjunction with section 12L of the
Income Tax Act, 1962 (Act No. 58 of 1962) (DTI 1962) which will allow a tax incentive to be
13
claimed for energy efficiency projects. The tax incentive in section 12L can be claimed until
2020 and is applicable to all types of energy efficiency projects. The NPV and IRR of the project
can be further improved by making use of this tax incentive which is soon to come into effect.
Table 5: Cash flow analysis indicating NPV and IRR
Year
1 2 3 4 5
0 1 2 3 4
Discount factor 1 0.833 0.694 0.579 0.482
CONTROL SYSTEM DEPOSIT R 29,640
CONTROL INSTALLATION COST R 20,000
METERING R 70,000
HEAT PUMP COST R 120,000
STANDARD PROGRAM REBATE R -54,000
SUB TOTALS R 185,640 R -
SUB TOTALS DISCOUNTED R 185,640
MONTHLY METERING DATA R 18,000 R 19,134 R 20,339 R 21,621 R 22,983
MONTHLY LOAN REPAYMENT @ 18% INTEREST PA R 71,028 R 71,028
MANAGING AGENT SERVICES R 13,200 R 14,032 R 14,916 R 15,855 R 16,854
GENERAL MAINTENANCE R 9,000 R 9,567 R 10,170 R 10,810 R 11,491
INEFFICENCY R 37,260.00 R 39,607 R 42,103 R 44,755 R 47,575
SUB TOTALS R 148,488 R 153,368 R 87,527 R 93,042 R 98,903
SUB TOTALS DISCOUNTED R 148,488 R 127,807 R 60,783 R 53,844 R 47,696
TOTAL OVER 5 YEARS R 438,618
ANNUAL ENERGY SAVING DUE TO HEATPUMPS R 50,400 R 54,432 R 58,787 R 63,489 R 68,569
ANNUAL KVA SAVING DUE TO MDC R 42,000 R 42,000 R 42,000 R 42,000 R 42,000
ANNUAL TENANT ENERGY INCOME R 156,000 R 168,480 R 181,958 R 196,515 R 212,236
TOTAL R 248,400 R 264,912 R 282,745 R 302,005 R 322,805
SUB TOTALS DISCOUNTED R 248,400 R 220,760 R 196,351 R 174,771 R 155,674
TOTAL OVER 10 YEARS R 995,955
NET CASH FLOW - NOT DISCOUNTED R -85,728.02 R 111,544 R 195,218 R 208,963 R 223,902
IRR 165%
NET CASH FLOW - DISCOUNTED R -85,728 R 92,953 R 135,568 R 120,928 R 107,977
NVP R 371,698
14
2 Sustainability There is an inherent link between society and finance as finance and markets would not exist
if not required to fulfil a role within society. Technology, which is a broad term applicable to
all industries, has a critical role in meeting the needs within social context and a socio-
technical perspective considers how socio-technical systems meet the needs of society.
According to Geels (2005) there are a cluster of elements such as markets, user practices,
supply networks and technology that forms a social-technical system.
2.1 Socio-technical niche
Within the Multi-level Perspective (MLP) a niche happens at the micro-level and offers a
protective environment where major innovation can develop within so called “incubation
rooms” and less vulnerable to markets. These are typically projects which are subsidised and
aimed at research or situations where experimentation and early adoption is supported
within a movement (Smith, Voß and Grin 2010). According to UNEP (2002) an energy subsidy
can be seen as an action by government that lowers the price that consumers pay for energy.
This can be related to the current situation in South Africa where Integrated Demand
Management (IDM) projects are subsidised by ESKOM. ESKOM, within their revenue
application for the Third Multi-Year Price Determination (MYPD3) period, which is for the
period 2013/14 to 2017/18 requested IDM funding of R 13 000M but only R 5,183M was
granted by NERSA for a period of 5 years (ESKOM 2012b; de la Rue du Can, Letschert, Leventis
and Covary 2013; NERSA 2013).
Focussing on the case study at hand, in order to access a R5mil subsidy from the Danish
government the Danish company, Develco, supplying Zigbee based products started a
partnership with a South African company with the aim of promoting Danish technology
within South Africa. The relationship did not last as the technology was not matured enough
and riddled with technical issues. The researcher got involved with Develco at the end of 2010
when researching technology options that could fulfil all the requirements of a concept
maximum demand control (MDC) system. In concept the Develco solution could work but
required additional software and hardware changes as well as go through South African
Bureau of Standards (SABS) approval. The research and development process was long and
tedious as the products were prone to failure and required constant debugging, feedback to
Denmark, upgraded, testing, major additional expenses and after deploying the first site in
November 2011 only obtained a stable running system in July 2012.
15
The use of smart metering technology with automated meter reading (AMR) is also an
example of a niche. The technology enables the collection of energy consumption data for
billing via mobile communication technologies. Only in recent years has it gained favour
within the South African market due to a sharp decline on mobile data costs. The situation
described above is typical of a niche as the research and development is provided with a
market shielded environment by funding though the various IDM funding models and
governmental subsidies.
2.2 Socio-technical regimes
The meso-level within the multi-level perspective (MLP) is where socio-technical regimes are
situated. Geels (2005) states that prevailing practises, technology and social activities provide
stability within a socio-technical regime while revolution happens incrementally and is aimed
at optimisation. According to Smith et al. (2010), “Socio-technical regimes are structures
constituted from a co-evolutionary accumulation and alignment of knowledge, investments,
objects, infrastructures, values and norms that span the production-consumption divide”.
There are complex structures which form the way societal functions are executed which often
presents barriers to the implementation of energy efficiency or new technology such as
maximum demand control (MDC) and smart metering systems. According to Trianni and
Cagno (2012) some of the major barriers to implementing energy efficiency solutions is the
lack of capital or incorrect information on energy efficiency interventions which are cost-
efficient or the way that information is presented. Chai and Yeo (2012) offers their own
framework regarding energy efficiency barriers and note the lack of financial incentives as a
barrier. de la Rue du Can et al. (2013) also underpins the low cost of energy in South Africa as
a disincentive towards energy efficiency and it being undervalued as a savings mechanism.
Resistance to change and lack of good results from investments into energy efficiency projects
were all factors which were present within the acceptance of the proposed system to clients.
However these barriers have been mitigated within the South African market due to the
energy crisis and rising energy costs.
Some of the characteristics of regimes are familiarity and stability, but by no means implies
stagnancy, as Geels (2005) states that innovations occurs in incremental steps. Disturbances
caused by independent developments such as crisis or government regulations can create
tension and open the opportunity for niche innovations to enter the space (Smith et al. 2010).
These concepts are all applicable to the case. One of the researchers’ directors has been the
tariff consultant for Mbombela Local Municipality since 1998 and has remain appointed
through various organisational changes. The Eskom energy supply crisis and electricity price
increases have been driving the energy savings market in conjunctions with Eskom energy
efficiency IDM funding.
16
The environment provided the opportunity to offer smart meters with automated meter
reading (AMR) technology to the local municipality which resulted in an additional R2m
monthly income due to correct metering and billing data. The stage was thus set where the
solutions provided by Livewire Engineering and Consulting (Livewire)11 were seen as reliable
and provided a positive return on investment. This perception created the opportunity to
provide other technology such as the Zigbee based maximum demand control solutions.
According to Rip and Kemp (1998) regimes are an effect of preceding changes and create
future change which is what is observed by the fact that the maximum demand control system
implementations were driven by change within structures. This change led to the municipality
recommending our services to consumers who would benefit from MDC.
2.3 Socio-technical landscapes
The socio-technical landscapes offers an organised setting where intangible as well as tangible
aspects ranging from political, environmental, traditional, financial and social can exists.
Smith et al. (2010) says that the multi-level perspective (MLP) traverse issues such as
economic operations restructuring and change within the environmental and political arena.
Literature highlights the interdependency of activities within the regimes, niches and
landscapes. Considering this case study most of the tangible and intangible aspects related to
socio-technological landscapes are present and needs to be considered. An interview with Dr
Johan Delport12 revealed that one of the single most significant changes was the change in
attitude of consumers regarding their energy billing which they now trust due to automated
meter reading (AMR). In the past consumers were disgruntled and negativity towards the
municipality who often used uneducated people to do meter readings which resulted in
constant incorrect billing and revenue loss. Since users could now monitor their energy
consumption online and thus improvement their use of energy new opportunities opened.
As from 2010 energy efficiency started being regarded as a resource within the Integrated
Resource Plan as well as the most affordable and cost effective way to evade energy shortages
and decrease demand (DOE 2011). A regulatory framework with responsibilities regarding
Efficiency Demand-Side Management (EEDSM) was introduced within the Electricity
Regulation Act No. 4 of 2006 (Republic of South Africa 2006). The energy regulator NERSA is
also enabled to implement the Department of Energy (DOE) policies within the Electricity
Regulation Act No. 4 of 2006. EEDSM for the energy sector is further supported by a document
published in 2010 by the DOE in which it introduces the Standard Offer scheme as well as
gives NERSA the mandate to determine the finance levels of EEDSM (DOE 2010).
11 The employer of the researcher 12 Company director and Mbombela tariff consultant since 1998
17
2.4 Multi-level Perspective Towards Sustainability
The drive towards energy efficiency is a classic example of sustainability transitions and can
be framed within the multi-level perspective (MLP) as the concepts or levels of niches,
regimes and landscapes are present within a nested hierarchy. These levels all interact in such
a manner, as seen in Figure 10, which are vital to stimulating transition to more sustainable
energy efficient future.
The reviewed case study contains all the elements within the multi-level perspective. The
Eskom energy crisis, Integrated Resource Plan (DOE 2011) and Eskom IDM funding models
within the multi-level perspective landscape exert pressure the reigning regimes to expose
opportunities for smart metering with AMR as an example. Smart metering projects, with
measurable financial benefits, and the IDM funded projects, such as heat pump installations,
provide effective solutions which are aligned with future economic, national strategic, and
political directives within a changing regime. Cultural and behavioural changes were observed
within the regime level which migrated to the landscape; these levels also offered stimulus to
the developments of niche innovation regarding smart metering and the maximum demand
control (MDC) systems which was protected from markets due to successful smart metering
projects, external funding and early adopters.
Figure 10: A dynamic multi-level perspective on transitions (Geels and Schot 2007)
Transitioning to a more sustainable way of life and operation is a progression and the multi-
level perspective abstractly exhibits this. The Mbombela electricity division and numerous
18
areas of industry are experiencing a transition of socio-technical nature by the introduction
and implementation of technology. End users who were previously disgruntled are now
positively engaged and from a political perspective previous sceptics have now become allies.
Economically there has been great improvements with increased revenue and budgets which
could be allocated towards additional equipment and services.
Dr John Delport has taken the liberty to start an energy fund in conjunction with the Nelspruit
municipality. The fund aims to provide funding to schools, old age homes or businesses, who
are unable to pay for initial funding of deploying a smart metering or maximum demand
control (MDC) system. The fund which will allocate a certain percentage of every kilowatt
hour sold by the municipality can be accessed in conjunction with Eskom IDM funding
programmes. Delport (2013) says that some of the vital elements to catalyst transition is
years of trust and cemented relationships supported by successful initiates.
3. Conclusion Minister of Minerals and Energy, Phumzile Mlambo-Ngcuka said that “Major energy savings
can only be achieved through changes in people’s behaviour, and that depends on informing
them about what options exist” (Mlambo-Ngcuka 2005:i). Demand control techniques have
existed for many years and they are successfully implemented and subsidised by the Eskom
IDM funding program. This has allowed good inroad to be made in the quest for energy
efficiency in South Africa as well as create economic and innovation opportunities. The case
study clearly shows that there is a short and long term financial as well as energy saving
opportunity within energy efficiency projects. This could greatly benefit the consumer as well
as the utility. This case study also provides a glimpse into the multi-level perspective for socio-
technical transitions and highlights its multidisciplinary nature. Geels (2010) however
expresses a concern with using the multi-level perspective as he states that small scale
application are possible to analyse empirically but that it might not be the case with
transitions on a larger scale. His concern is also based on the fact that case studies are often
very isolated and that common patterns present in numerous practises might be difficult to
isolate within large systems. These apprehensions have merit as the case study is based on a
small scale solution with defined practises and technology which enables an accurate
sustainability and financial analysis with results indicating an optimistic outlook. This might
not hold true for larger projects as there are too many variables which could influence the
sustainability and economic feasibility. This case study and similar projects, given enough hind
sight, can offer relative stability in predicting its economic sensibility but the interpretation of
its sustainability is questionable. There are crucial unpredictable elements which determines
the course taken by transformation in the pursuit of sustainability. Long term personal and
business relationships, human behaviour, government policy and funding at any stage could
19
alter the trajectory towards economic viability and sustainability. Ultimately the lingering
question remains – are we truly being propelled towards an economically sustainable future?
Bibliography ABDULLATIF, I. A. 1989. Electric Load Management by Ripple Control Ph.D., Institute for Electrical
Power Research ABU-ZEID, N. S. & AL-SHAKARCHI, M. R. G. 2002. A Study of Load Management by Direct Control for
Jordan's Electrical Power System. Science & Technology, 7. BAS, E. 2013. A robust approach to the decision rules of NPV and IRR for simple projects. Applied
Mathematics and Computation, 219, 5901-5908. CHAI, K.-H. & YEO, C. 2012. Overcoming energy efficiency barriers through systems approach—A
conceptual framework. Energy Policy, 46, 460-472. DE LA RUE DU CAN, S., LETSCHERT, V., LEVENTIS, G. & COVARY, T. 2013. Energy Efficiency Country
Study: Republic of South Africa. Ernest Orlando Lawrence Berkeley National Laboratory. DELPORT, J. G. 4 March 2013. RE: Personal Interview. DME 1998. White Paper on the Energy Policy of the Republic of South Africa. In: ENERGY, D. O. M. A.
(ed.). Department of Minerals and Energy. DME 2003. Integrated Energy Plan For The Republic Of South Africa. Department of Minerals And
Energy. DME 2005. Energy Efficiency Strategy of the Republic of South Africa. In: ENERGY, D. O. M. A. (ed.).
Department of Minerals and Energy. DOE 2008. National Energy Act. Act No 34 of 2008. Department of Energy. DOE 2010. Policy to support the Energy Efficiency and Demand Side Management Program for the
Electricity Sector through the Standard Offer Incentive Scheme. In: ENERGY, D. O. (ed.). Department of Energy.
DOE 2011. Integrated Resource Plan for Electricity 2010-2030. Pretoria: Department of Energy South Africa.
DTI 1962. Income Tax Act. Act No. 58 of 1962. Department of Trade And Industry. EPA 1998. Energy Star Buildings Manual: Business Analysis For Energy-Efficiency Investments. ESKOM 2012a. Financial incentives for energy efficiency. ESKOM 2012b. MYPD3 Application 2014 - 2018. Eskom. ESKOM. 2013a. Integrated Demand Management [Online]. Available:
http://www.eskomidm.co.za/home/about [Accessed 17 August 2013]. ESKOM. 2013b. Integrated Demand Management Standard Offer [Online]. Available:
http://www.eskomidm.co.za/industrial/sop [Accessed 17 August 2013]. ESKOM. 2013c. Integrated Demand Management Standard Product [Online]. Available:
http://www.eskomidm.co.za/industrial/sp [Accessed 17 August 2013]. ESMAP 2010. Implementing Energy Efficiency and Demand Side Management - South Africa’s
Standard Offer Model. Low Carbon Growth Country Studies Program. Washingting, DC: Energy Sector Management Assistance Program.
ETO, J. 2007. Demand Response Spinning Reserve Demonstration. Ernest Orlando Lawrence Berkeley National Laboratory.
GEELS, F. W. 2002. Technological transitions as evolutionary reconfiguration processes: a multi-level perspective and a case-study. Research Policy, 31, 1257–1274.
GEELS, F. W. 2005. The Dynamics of Transitions in Socio-technical Systems: A Multi-level Analysis of the Transition Pathway from Horse-drawn Carriages to Automobiles (1860–1930). Technology Analysis & Strategic Management, 17, 445–476.
GEELS, F. W. 2010. Ontologies, socio-technical transitions (to sustainability), and the multi-level perspective. Research Policy, 39, 495-510.
20
GEELS, F. W. & SCHOT, J. 2007. Typology of sociotechnical transition pathways. Research Policy, 36, 399-417.
MALIK, A. S. & AL MATA’NI, F. S. 2007. Load Management In Industrial Sector And Its Impact On Power Planning – A Case Study Of Oman. International Conference on Communication, Computer & Power. Muscat.
MASTERS, G. M. 2005. Renewable and Efficient Electric Power Systems, Wiley. MLAMBO-NGCUKA, P. 2005. Foreword. In Department of Minerals and Energy (DME), Efficiency
Strategy for the Republic of South Africa. Pretoria. NERSA 2012. Revision of Regulatory Rules for Energy Efficiency and Demand Side Management
(EEDSM) including Standard Offer Programme (SOP). National Energy Regulator of South Africa.
NERSA 2013. NERSA’s decision on Eskom’s Revenue Application for the Third Multi-Year Price Determination period 2013/14 to 2017/18
NORTJE, T. 2006. South Africa’s demand side management programme. Vector, 42-44. PARK, C. S. & SHARP-BETTE, G. P. 1990. Advanced engineering economics, Wiley. REPUBLIC OF SOUTH AFRICA 2006. No. 4 of 2006 Electricity Regulation Act. In: AFRICA, R. O. S. (ed.).
Republic of South Africa. RIP, A. & KEMP, R. 1998. Technological change. In: RAYNER, S. & MALONE, L. (eds.) Human Choice
and Climate Change. Washington: Battelle Press. ROUSSEAU, P. G. & GREYVENSTEIN, G. P. 2000. Enhancing the impact of heat pump water heaters in
the South African commercial sector. Energy, 25, 51-70. SMITH, A., VOß, J.-P. & GRIN, J. 2010. Innovation studies and sustainability transitions: The allure of
the multi-level perspective and its challenges. Research Policy, 39, 435-448. STOLL, H. G. 1989. Least-Cost Electric Utility Planning, Wiley. TRIANNI, A. & CAGNO, E. 2012. Dealing with barriers to energy efficiency and SMEs: Some empirical
evidences. Energy, 37, 494-504. UNEP 2002. Reforming Energy Subsidies. Oxford, UK: United Nations Environment Programme.