Embed Size (px)
Citation preview


2
Pg. No.
1. Business Update 03
2. Update on Merger with Lakshmi Vilas Bank 04
3. Working Towards Banking Approval: Reduction in Commercial Real Estate Exposure 05
4. Adequate Provisioning Buffer and Strong Track Record of Recoveries 06
5. Addressing the Misinformation on Social Media 07
6. Gaining Strength Through the Liquidity Crisis 09
7. Projected Liquidity Framework Results Based on Draft RBI Circular dated May 24, 2019 10
8. Asset Quality: Conservative Provision Levels 11
9. Diversified Liability Profile, Low leverage 12
10. Effective Pass Through: Spread Stay Strong 13
11. Appendix 14
Contents

Business Update
3
Q1 FY 19-20 Q1 FY 18-19 YoY Growth [%]
Balance Sheet 1,20,947 1,38,236 -12.5%
Loan Assets 1,13,189 1,25,628 -9.9%
Net Interest Income [without sell down upfront Income] 1,475 1,690 -12.7%
PBT 1,106 1,402 -21.1%
PAT 802 1,055 -24.0%
Key Financial Highlights: Q1 FY 19-20 vs Q1 FY 18-19 as per Indian Accounting Standards [IndAS]
Amount in ₹ Cr
An interim dividend of ₹ 8 per share of face value ₹ 2/-, amounting to 400%, has been declared in the board meeting held on Aug 6, 2019
1 Cr= 10 Mn
Update on Merger with Lakshmi Vilas Bank
4
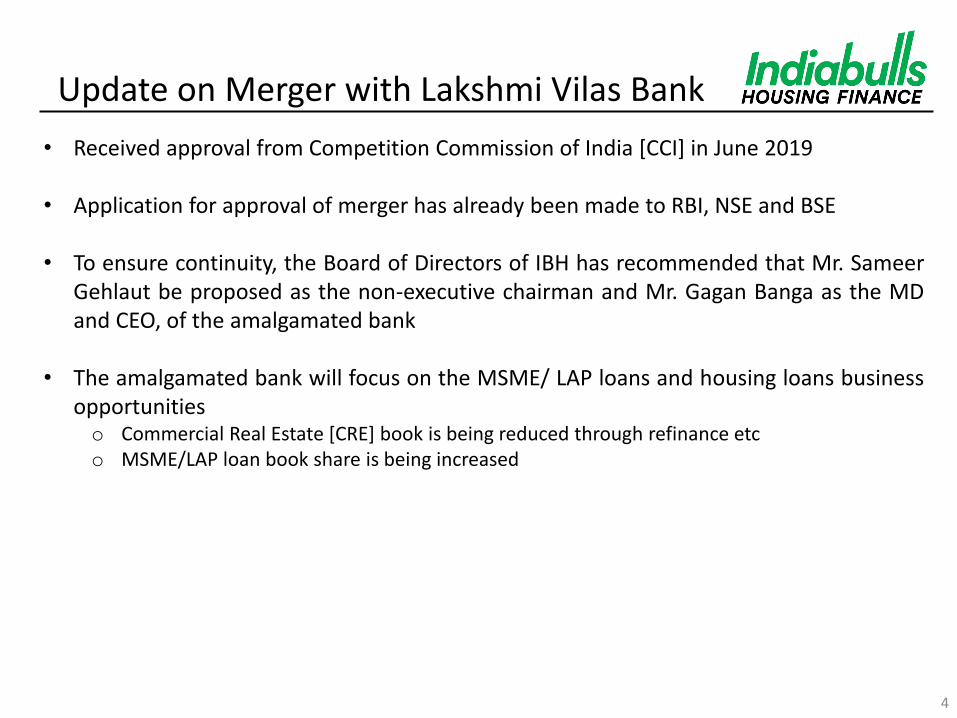
• Received approval from Competition Commission of India [CCI] in June 2019
• Application for approval of merger has already been made to RBI, NSE and BSE
• To ensure continuity, the Board of Directors of IBH has recommended that Mr. Sameer Gehlaut be proposed as the non-executive chairman and Mr. Gagan Banga as the MD and CEO, of the amalgamated bank
• The amalgamated bank will focus on the MSME/ LAP loans and housing loans business opportunities o Commercial Real Estate [CRE] book is being reduced through refinance etc o MSME/LAP loan book share is being increased

Working towards Banking Approval: Reduction in Commercial Real Estate Exposure
5
• Since the announcement of merger in April 2019, in under three months, IBH has reduced its CRE exposure by ₹ 6,005 Cr through refinance etc.
• These assets have been bought/ refinanced by some of the most marquee names in the industry, which is a testament to the quality of our developer loan portfolio
CRE: Commercial Real Estate

Adequate Provisioning Buffer and Strong Track Record of Recoveries
6
• ₹ 1,932 Cr have been recovered in the last five years, which corresponds to 71% of the ₹ 2,735 Cr of incremental slippages in this period of cases of > ₹ 10 Cr exposure
• Secured loan assets ensure a high degree of recoverability as demonstrated by the recent recovery from Palais Royale case, where the SARFAESI process was upheld by the Supreme Court and the money was recovered after four years since the project first went into litigation
• IBH’s OakNorth Bank stake valued at ₹ 3,000 to ₹ 3,500 Crs is also available to create additional provisioning buffer if required, without impacting profits

Addressing the Misinformation on Social Media
• Misinformation on social media circulated with the objective of scuttling the merger with Lakshmi Vilas Bank
• To quell these rumours once and for all, Indiabulls Housing Finance has decided to voluntarily submit its sources of equity funds in public domain since the inception of the company, and the details of all its investors till date. The accuracy of this complete data of the company since its inception may be verified by anyone
• Mr. Sameer Gehlaut, the promoter of Indiabulls companies, is a self-made man and son of an army officer who served the country in the 1971 Indo-Pak war and operation Blue Star in 1984. Sameer started Indiabulls in the year 2000 from a 150 Sq. Ft. office near Hauz Khas bus terminus in New Delhi and along with management teams, has built the companies brick by brick over the years. He or his promoter companies have no loans outstanding from any banks, NBFCs, HFCs or borrowers
• IBH and its erstwhile parent Indiabulls Financial Services, have raised equity funds of ₹ ₹ 8,583 Cr [$ 1.24 Bn] and paid dividends of ₹ 10,113 Cr since inception
• Indiabulls Group has 24,562 employees as on date, has paid ₹ 14,534 Crs in taxes to the government since inception, paid ₹ 11,387 Crs in dividends and has a total of 3,84,855 shareholders. Further, as on date, Indiabulls companies have extended loans to over 25 Lac customers.
• IBH has the 2nd highest FII ownership in a listed company at 56%. Since its IPO at ₹ 19/share and the share price as on date, the company has delivered CAGR returns of over 35% in the last 15 years.
7

Year 2000
S/No. Investors Investment
1 LNM India Internet Ventures Ltd 4.3
2 Transatlantic Corporation Ltd 8.6
3 Infinity technology Trustee Pvt. Ltd. 7.7
Total 20.6
Year 2004
S/No. Investors Investment
1 Initial Public Offering (IPO) 51.7
2 Farallon Capital Partners, L.P. 7.1
3 RR Capital Partners, L.P. 0.4
Total 59.2
Year 2005
S/No. Investors Investment
1 Farallon Capital Partners, L.P. 170.4
2 Amaprop Ltd. 131
3 Amaranth Advisors LLC 116.7
4 Fidelity Mgmt & Research Co 108.9
5 Drawbridge Global Macro Advisors LLC 68.8
6 JLF Asset Mgmt 58.9
7 Tiger Technology Management, LLC 54.2
8 Highfield Capital 47.1
9 Sloane Robinson LLP 47.0
10 Galleon Asset Mgmt Ltd 37.7
11 Fidelity Investments International 34.8
12 Artha Capital Management INC 34.8
13 D.B. Zwirn & Co., L.P. 30.6
14 HSBC Asset Mgmt Europe Ltd 29.9
15 Tudor Investment Corporation 17.1
16 Farallon Capital Institutional Partners II, L.P.
15.8
17 Merrill Lynch International 14.1
18 JP Morgan Securities London 14.0
19 Blackarrow Capital Management, LLC 11.4
20 Highbridge International LLC 10.7
21 Lloyd George Management (Hong Kong) Limited
8.7
22 Smith Management 8.6 23 Susquehanna Advisors Group INC 8.6
24 JP Morgan Securities London 8.6 25 Goldman Sachs Intl (London) 5.4 26 Torrey Pines Capital Management, LP 4.8 27 Diamond Head Capital Partners LP 4.4
28 AXA Investment Managers Gs Ltd 4.3 29 Trellus Management Company, LLC 4.2 30 Indea Capital Pte Ltd 3.2
31 Founders Asset Mgmt LLC 2.2 32 Citadel Investment Group LLC 2.1 33 EBF Associates LP 2.1 34 Ward Ferry Management (BVI) Limited 2.1
35 J.Goldman & Co., L.P. 2.1 36 Balyasny Asset Management 1.2 37 Gartmore Investment Mgmt Plc London 1.1
38 Basis Capital Funds Management Limited 1.1 39 Apex Capital Management, LLC 0.6 40 TT INTL Investment Mgmt London 0.4 41 AXA Investment Managers GS Ltd 0.3
Year 2005
S/No. Investors Investment
42 Dexia Asset Management Belgium SA 0.1
Total 1,131.0
Year 2006
S/No. Investors Investment
1 Crown Capital Ltd. 302.3
2 FCM SPV I Ltd 112.5
3 Farallon Capital Institutional Partners II, L.P. 51.7
4 LNM India Internet Ventures Ltd. 44.6
5 Farallon Capital, L.P. 37.4
Total 548.5
Year 2007
S/No. Investors Investment
1 Oberon Ltd. 644.0
2 Farallon Capital Management, LLC 162.5
3 Letterkenny Holdings Limited 121.7
4 Orient Global Capital PTE Ltd 117.9
5 Khronos 101.2
6 Discovery Capital Management LLC 87.1
7 Elite Operations Ltd. 81.5
8 Toscafund Asset Management LLP 81.5
9 Fortis Investment Mgmt. 73.5
10 Altima Partners LLP 69.2
11 Fidelity Investments International 40.8
12 New Vernon Advisers LP 40.8
13 Bennelong Asset Management LLP 32.5
14 Millenium Partners, LP 28.5
15 Trivium Capital Management 24.5
16 Och-Ziff Capital Management Group 20.2
17 Drawbridge Global Macro Advisors LLC 16.3
18 JP Morgan Asset Management (Uk) Limited 16.0
19 Moon Capital Management LP 16.0
20 Ziff Brothers Investments LLC 16.0
21 Goldman Sachs International 15.2
22 Kingdon Capital Management LLC 12.3
23 DKR Management Company, Inc. 10.2
24 Izara Capital Management, LLC 10.1
25 Marble Bar Asset Management LLP 5.9
26 Goldman Sachs International- Reg S 5.0
27 Artisian Partners Limited Partnership 4.0
28 D.B. Zwirn & Co., LP. 4.0
29 Asian Century Quest Capital, LLC 3.9
30 Banque D'Orsay SA 2.7
31 Credit Suisse 2.7
Total 1,867.5
Year 2009
S/No. Investors Investment
1 Morgan Stanley Mauritus Company limited 428.2
2 HSBC Global Investments Funds NC 181.5
3 Invesco Perpetual Asian Fund 48.2
4 Reliance Growth Fund 46.2
5 Sandstone Capital India Master Fund Limited 36
6 BNP Paribas Arbitrage 31
Year 2009
S/No. Investors Investment
7 Haibis India Alpha(Mauritius) Ltd 24.1
8 Tree Line Asia Master Fund (Singapore) PTE Ltd 24
9 Morgan Stanley India Investment Fund INC 17.7
10 Reliance Tax Saver(ELSS) Fund 17.1
11 Reliance Banking Fund 14.5
12 Morgan Stanley Mutual Fund Nc Morgan Stanley Growth Fund
13.7
13 Citibank International Plc as Depository for Invesco Perpetual Pacific Fund
12.1
14 Abu Dhabi Investment Authority – Itchen 11.7
15 Pictet Country Fund (Mauritius) Ltd 9.6
16 Swiss Finance Corporation (Mauritius) Ltd 7.2
17 Sundaram BNP Paribas Equity Multiplier Fund 7.2
18 Sundaram BNP Paribas Select Midcap 7.2
19 Sloane Robinson LLP 4.8
20 Universities Superannuation Scheme Limited 4.8
21 Indusino International 3.6
22 Morgan Stanley Investment Management INC NC 2.5
23 The Sumitomo Trust and banking Co. Ltd 2.1
24 KB India Growth Equity Fund 1.9
25 Sampo Fund Mangement Limited NC Danske Invest India Fund
1.6
26 Standard Life Investments India Advantage Fund 1.2
27 Merill Lynch Capital Markets Espana S.A. S.V. 0.2
28 Blackstone Asia Advisor LLC Nc 0.2
Total 960.0
Year 2015
S/No. Investors Investment
1 Europacific Growth Fund 1,342
2 Morgan Stanley Asia Singapore PTE 467.2
3 Merill Lynch Capital Markets Espana S.A. S.V. 340.2
4 New World Fund INC 243.9
5 American Funds Insurance Series Global Growth Fund
180.6
6 International Growth and Income Fund 158.6
7 Copthall Mauritius Investment Ltd 140.4
8 Aptus Global Financials Fund 105.3
9 Quantum(M) Limited 99.9
10 Nomura India Investment Fund Mother Fund 98.7
11 American Funds Insurance Series New World Fund 73.1
12 Credit Suisse (Singapore) Limited 66.6
13 Indus India Fund Mauritius Limited 66.6
14 Blackrock GLobal Funds Asian Dragon Fund 53.0
15 Swiss Finance Corporation (Mauritius) Ltd 50.0
16 Kingdon Mauritius Holding l Limited 44.6
17 Government of Singapore 41.5
18 Gluskin Sheff & Associates International Fund 33.3
19 Investec Global Strategy Fund 31.6
20 Kingdon Mauritius Holding II Limited 28.9
21 Lord Abbett International Dividend Income Fund 27.7
22 Blackrock Global Funds- Asian Growth Leaders Fund
25.0
23 Pioneer Asset management S.A 21.80
Year 2015
S/No. Investors Investment
24 The Nomura Trust and Banking Company Limited 19.70
25 Nomura Asset Management Singapore Limited 14.80
26 Blackrock Pacific Fund, INC 13.5
27 Unisuper Limited as Trustee for Unisuper 11.8
28 Monetary Authority of Singapore 11.8
29 Wexford Spectrum Investors (Mauritus) Ltd 10
30 ABN Amro Multi-Manager Funds 9.8
31 Blackrock Global Funds-Pacific Equity Fund 9
32 William Blair Emerging Markets Small Cap Growth Collective Investment Fund 8.5
33 William Blair Emerging Markets Small Cap Growth Fund 8
34 Raiffeisen Kapitalanlage-Gesellschaft Mit Beschrankter Haftung 7.9
35 Iowa Public Employees Retirement System 7.8
36 Driehaus Emerging Markets Small Cap Growth Fund, A series of Driehaus Mutual Funds 6.6
37 Kingdon Mauritius Holding III Limited 6.4
38 DB International (Asia) Limited 6.4
39 William Blair Sicav 6.3
40 Mackenzie Global Small Cap Growth fund 6
41 Amp Capital Funds Management Limited 5.9
42 Mercer Emerging Markets Equity Fund 5
43 Mackenzie Universal Interational Stock Fund 4.7
44 Mackenzie Universal Global Future Capital Class 4.5
45 Sanlam Life and Pensions UK Limited 4.3
46 Wellington Management Portfolios (Dublin) Plc 4.3
47 Pioneer Global Equity Fund 4.2
48 Investec Asset Management Limited 4.2
49 Wellington Management Portfolios (Australia) 4.1
50 Government of Singapore Investment Corporation 4.1
51 Wellington Asset Management Company LLP 3.4
52 United Technologies Corporation Master Retirement Trust- Wellington Mgmt LLP 3.4
53 CLSA Global Markets Pte Ltd 3.3
54 Chennai 2007 3.3
55 Arch Reinsurance Ltd 3.1
56 Emerging Markets Equity Portfolio 3.1
57 VFM Emerging Markets Trust 2.8
58 Stitching Bedrijfstakpensioenfonds Voor Het Beroepsvervoer Over De Weg 2.8
59 Investec Asset Management Limited 2.5
60 Blackrock Strategic Funds- Blackrock Emerging Markets Absolute Return Fund 2.2
61 Russell Investment Company PLC 2.1
62 Hour-Glass Emerging Markets Shares Sector Trust 2
63 United Super Pty Ltd 2
64 DSP Blackrock Alternative Investment Fund 1.8
65 The Boeing Company Employer Retirement Plans Master Trust 1.7
66 Mackenzie Global Small Cap Growth Class 1.7
67 The Master Trust Bank of Japan Ltd As Trustee of Kokusal Emerging Equity Open Mother Fund 2.1
68 Wellington Trust Company 1.2
69 AMP Capital Investors Limited 1.2
70 Mackenzie Universal International Stock Class 0.7
Total 3,996.8
Amount in ₹ Cr
Addressing the Misinformation on Social Media [Sources of Equity Funds]

Parameters Before Sector Issues
[Aug 2018]
Current Period [21st Sep 2018 to 30th Jun 2019]
Money raised in Preceding 9 Months
[₹ Cr] 45,954 60,781
Spread [%] [Q1FY20] 3.23% 3.14%
Commercial Paper [%] [Q1FY20] 14.8% 0.8%
Net Gearing [Q1FY20] 7.0x 3.8x
CRAR [%] [Q1FY20] 21.8% 27.8%
PAT [₹ Cr] FY18: 3,658 FY19: 4,091
Gaining Strength Through the Liquidity Crisis: Elongated Liabilities, Low Gearing, High CRAR, AAA Ratings Reaffirmed
9

10
Projected Liquidity Framework Results Based on Draft RBI Circular dated May 24, 2019
30-day Liquidity Coverage Ratio
Liquidity Coverage Ratio [LCR] High Quality Liquid Assets
30-day Net Cash Outflows Stressed Outflows – Min. of [Stressed Inflow or 75% of Stressed Outflow]
Amount [₹ Cr]
High Quality Liquid Assets 8,713
Amount [₹ Cr]
A. Stressed Inflows [75% of Inflows] 7,855
B. Stressed Outflows [115% of Outflows] 6,310
30-day Net Outflows (Stressed Outflows [B]- Min. of Stressed Inflows [A], 75% of Stressed Outflows[B])
1,577
Liquidity Coverage Ratio as per RBI Circular dated May 24, 2019
552%
High Quality Liquid Assets
30-day Net Outflows
The LCR requirement shall be binding on NBFCs from April 01, 2020 with the minimum LCR to be held as 60%, against which IBH already holds 552%
From Minimum LCR
April 1, 2020 60%
April 1, 2021 70%
April 1, 2022 80%
April 1, 2023 90%
April 1, 2024 100%

Asset Quality: Conservative Provision Levels
11
• On total loan assets of ₹ 1,13,189 Cr, the loan assets in loan stage 1 & 2 are ₹ 1,11,527 Cr representing 98.53% of the total assets. The ECL provisions taken on assets in stage 1 & 2 are ₹ 953 Cr [As per Indian Accounting Standards [IndAS], all assets less than 90 dpd are standard assets classified in stage 1 & 2]
• On total loan assets of ₹ 1,13,189 Cr, the loan assets in stage 3 are ₹ 1,662 Cr representing 1.47% of the total loan assets. The ECL provision taken on loan assets in stage 3 are ₹ 416 Cr representing 25% of the loan assets in stage 3 [as per IndAS, all assets that are more than 90 dpd are impaired or non-performing assets and are classified as NPA].
Gross NPA: 1.47% Net NPA: 1.10%
Q1 FY20 Q4 FY19
Gross Stage 3 1,662 1,061
% Portfolio in Stage 3 1.47% 0.88%
ECL Provision Stage 3 416 228
Net Stage 3 1,246 832
Coverage Ratio % Stage 3 25% 22%
Gross Stage 1&2 1,11,527 1,19,464
% Portfolio in Stage 1&2 98.53% 99.12%
ECL Provision Stage 1&2 953 728 As per IND AS Amounts in ₹ Cr
dpd: days past due NPA: Non-Performing assets ECL: Expected Credit Loss

Diversified Liability Profile, Low Leverage
• Since Sep 18, IBH has raised ₹ 6,355 Cr in bonds which were subscribed by 12 Life/ General Insurance companies, Mutual Funds, Banks and Corporates
• Funding from CPs has been reduced from 15% levels to less than 1% levels. As an operating principle, the total 3-month CPs of the company will never exceed 5% of its funding.
• Amongst its lenders, the company now counts 698 strong relationships: 21 PSU banks, 26 Private and Foreign banks and 651 Mutual Funds, Provident Funds, Pension Funds, Insurance Companies and Corporates”
1,16,147 98,226
6.0
3.8 900
20,9 00
40,9 00
60,9 00
80,9 00
100 ,900
120 ,900
140 ,900
Jun 18 Jun 19
Borrowings
Net Gearing
12
Total Funding [₹ Cr] Net Incremental in 12 Months Jun 19 Jun 18
Bank Loans 44,139 43,353 786
Debentures and Securities 48,221 50,480 -2,259 Commercial Papers 1,060 19,228 -18,168
ECB 4,805 3,086 1,720 Total Borrowing 98,226 1,16,147 - 17,921
Sell Down 27,501 13,758 13,743
Total 1,25,727 1,29,905 -4,178
ECB: External Commercial Borrowing

Effective Pass Through: Spread Stay Strong
Cost of Funds Loan Assets [₹ Cr] Spreads
• Growth of on-balance sheet loan assets [7-year CAGR: 18%] is slower than growth in total loan assets [7-year CAGR: 21%] facilitating RoE expansion
8.25% 7.92%
8.91%
7.51% 7.88%
9.21%
Jun 17 Jun 18 Jun 19
Book Incremental
8.25% 7.92% 8.91%
11.63% 10.86% 12.05%
3.24% 3.23% 3.14%
Jun 17 Jun 18 Jun 19
CoF Yield Spread
85,140
112,679
86,389
9,310
12,948
26,801 94,450
1,25,628 1,13,189
Jun 17 Jun 18 Jun 19
Own Book Sell Down Total Loan Assets
Loan Assets 7-Yr CAGR: 21%
Own Book 7-Yr CAGR: 18%
13

14
Appendix

15
Financial and Operational Highlights

Business Summary
• Balance Sheet : ₹ 1.21 Lakh Cr
• Loans Outstanding : ₹ 1.13 Lakh Cr : [$ 16.40 Bn]
• Loan Assets CAGR [7 years] : 21% • Cumulative Loans to Retail Customers : 11,19,180 • Cumulative Loans Disbursed till date : ₹ 2.55 Lakh Cr [$ 36.94 Bn]
• Cost to Income Ratio [FY19] : 12.7%
• Profit After Tax CAGR [7 years] [FY19] : 22%
16 US $ amounts are converted based on the exchange rate of US $1 = ₹ 69

Balance Sheet Assets
17
71%
22%
7%
Loan Book
Cash & Cash Equivalents
Other Assets
Amount in ₹ Cr
Current Account Balance & Fixed Deposits 11,836
AMC Investments 6,872
Investment in Bank CDs 5,023
Liquid Quasi-Sovereign Bonds 3,581
Highly Rated Liquid Corporate Bonds 911
Highly Rated Commercial Paper 288
Total Cash and Cash Equivalents 28,511

Q1 FY 18-19
18
• Home loans, which form the majority of incremental disbursals, are disbursed at an average ticket size of ₹ 24 Lakhs; average LTV of 73% [at origination]
Corporate Mortgage Loans
79%
21%
84%
16%
Mortgage Loans
Asset Composition
Q1 FY 19-20

Particulars Total Q2FY20 Q3FY20 Q4FY20 Q1FY21 Q2FY21 Q3FY21 Q4FY21 Q1FY22
Cash & Cash Equivalents 28,511 28,511 27,017 25,560 26,826 27,321 25,309 24,949 24,302
Customer Repayments 86,389 4,725 4,641 5,517 4,736 4,647 4,147 4,215 4,248
Non Current Assets 1,643 - - - - - - - -
Total Inflows [A] 116,543 33,236 31,658 31,078 31,562 31,967 29,456 29,164 28,549
Cumulative Total Inflows 33,236 37,878 43,395 48,131 52,777 56,924 61,139 65,387
Repayments 97,962 6,219 6,098 4,251 4,241 6,658 4,508 4,862 4,186
Equity Capital, Reserves & Surplus 18,582 - - - - - - - -
Total Outflows [B] 116,543 6,219 6,098 4,251 4,241 6,658 4,508 4,862 4,186
Cumulative Total Outflows 6,219 12,317 16,569 20,810 27,468 31,976 36,837 41,023
Net Cash [A-B] 27,017 25,560 26,826 27,321 25,309 24,949 24,302 24,364
Amount in ₹ Cr
Micro ALM Details [Quarter-wise for next 10 years]
19

20
Particulars Q2FY22 Q3FY22 Q4FY22 Q1FY23 Q2FY23 Q3FY23 Q4FY23 Q1FY24
Cash & Cash Equivalents 24,364 19,527 17,741 17,154 14,746 15,881 15,135 16,256
Customer Repayments 3,942 4,050 3,705 3,644 3,390 3,037 3,188 2,470
Non Current Assets - - - - - - - -
Total Inflows [A] 28,306 23,577 21,446 20,798 18,136 18,918 18,323 18,726
Cumulative Total Inflows 69,329 73,379 77,084 80,728 84,118 87,155 90,343 92,813
Repayments 8,779 5,836 4,291 6,052 2,256 3,782 2,067 1,393
Equity Capital, Reserves & Surplus - - - - - - - -
Total Outflows [B] 8,779 5,836 4,291 6,052 2,256 3,782 2,067 1,393
Cumulative Total Outflows 49,802 55,638 59,930 65,981 68,237 72,019 74,087 75,480
Net Cash [A-B] 19,527 17,741 17,154 14,746 15,881 15,135 16,256 17,333
Micro ALM Details [Quarter-wise for next 10 years]
Amount in ₹ Cr

21
Particulars Q2FY24 Q3FY24 Q4FY24 Q1FY25 Q2FY25 Q3FY25 Q4FY25 Q1FY26
Cash & Cash Equivalents 17,333 15,400 16,479 18,423 19,957 21,246 22,484 23,906
Customer Repayments 2,180 2,285 2,809 2,188 1,553 1,288 1,752 1,194
Non Current Assets - - - - - - - -
Total Inflows [A] 19,513 17,686 19,288 20,611 21,510 22,534 24,236 25,101
Cumulative Total Inflows 94,993 97,278 100,087 102,275 103,827 105,116 106,867 108,062
Repayments 4,113 1,207 864 654 264 50 330 1,025
Equity Capital, Reserves & Surplus - - - - - - - -
Total Outflows [B] 4,113 1,207 864 654 264 50 330 1,025
Cumulative Total Outflows 79,593 80,799 81,663 82,317 82,581 82,631 82,961 83,986
Net Cash [A-B] 15,400 16,479 18,423 19,957 21,246 22,484 23,906 24,076
Micro ALM Details [Quarter-wise for next 10 years]
Amount in ₹ Cr

22
Particulars Q2FY26 Q3FY26 Q4FY26 Q1FY27 Q2FY27 Q3FY27 Q4FY27 Q1FY28
Cash & Cash Equivalents 24,076 24,183 24,944 25,628 24,835 23,489 23,777 24,917
Customer Repayments 414 1,036 859 334 311 289 268 249
Non Current Assets - - - - - - 872 -
Total Inflows [A] 24,490 25,219 25,803 25,962 25,146 23,777 24,917 25,166
Cumulative Total Inflows 108,476 109,512 110,370 110,704 111,015 111,304 112,443 112,692
Repayments 306 275 175 1,127 1,657 - - 260
Equity Capital, Reserves & Surplus - - - - - - - -
Total Outflows [B] 306 275 175 1,127 1,657 - - 260
Cumulative Total Outflows 84,293 84,568 84,743 85,870 87,527 87,527 87,527 87,786
Net Cash [A-B] 24,183 24,944 25,628 24,835 23,489 23,777 24,917 24,906
Micro ALM Details [Quarter-wise for next 10 years]
Amount in ₹ Cr

23
Particulars Q2FY28 Q3FY28 Q4FY28 Q1FY29 Q2FY29 Q3FY29 Q4FY29 Q1FY30 10+ Years
Cash & Cash Equivalents 24,906 22,788 22,820 18,330 18,416 17,537 16,698 16,147 16,285
Customer Repayments 232 215 200 186 173 161 149 38 1,625
Non Current Assets - - - - - - - -
772
Total Inflows [A] 25,138 23,003 23,020 18,516 18,589 17,698 16,847 16,285 18,682
Cumulative Total Inflows 112,924 113,140 113,340 113,526 113,699 113,860 114,009 114,146 116,543
Repayments 2,350 184 4,690 100 1,052 1,000 700 - 100
Equity Capital, Reserves & Surplus - - - - - - - -
18,582
Total Outflows [B] 2,350 184 4,690 100 1,052 1,000 700 - 18,682
Cumulative Total Outflows 90,136 90,320 95,010 95,110 96,162 97,162 97,862 97,862 116,543
Net Cash [A-B] 22,788 22,820 18,330 18,416 17,537 16,698 16,147 16,285 -
Micro ALM Details [Quarter-wise for next 10 years]
Amount in ₹ Cr

24
Liabilities Profile

15%
81%
4%
Shareholders' Funds Borrowings Other Liabilities
Liabilities
25

Funding Mix
ECB: External Commercial Borrowing
40% 39% 38%
12% 15%
1%
35% 34%
35%
10% 11%
22%
3% 2% 4%
Jun 17 Jun 18 Jun 19
Debentures and Securities Commercial Papers Bank Loans Sell Down ECB
26

27
Indian Home Loans Market

Indian Housing Landscape
28
10% 17% 26% 26% 29%
41%
81% 88%
India Thailand Korea China Malaysia Hong Kong USA UK
* Source: RBI Deputy Governor speech, 2014 # Source: Ministry of Statistics and Programme Implementation
Urbanization
Urbanization to rise to 40% of population by 2030 from the present
31%*
Improved affordability
Rising disposable incomes and low home loan interest rates
Fiscal Incentives
Tax incentives and subsidies for buyers and developers
Regulator
RERA has brought greater transparency and discipline
Government Push
Housing for All by 2022, PMAY, etc.
Easier Credit Flow Infrastructure status to housing; RBI, SEBI, IRDAI eased exposure norms to mortgage
financiers and funding for affordable housing construction
Favourable Demographics
66% of India’s population is under 35 years of age#: large sustained
demand for housing for several years
Households
Shift towards nuclear families
Low mortgage penetration in comparison with advanced and emerging economies implies vast opportunity for growth
DEMAND FOR HOUSING
Source: ICRA HFC Report, Jun 2017 and Mar 2018
PMAY: Pradhan Mantri Awas Yojana RERA: Real Estate Regulatory Act IRDAI: Insurance Regulatory and Development Authority of India
China’s individual mortgage loan market at $ 3.5 Tn is 14x that of India’s at $ 245 Bn, contrasted with respective GDPs, where China’s GDP is 5x that of India’s.
Effective Mortgage rates in India are the lowest in the world

Rising income/aspirations – per capita GDP growth at 9-10% p.a.
nominal
Demand for 40-50 Lakh houses p.a.
Housing Demand in India
• Estimated housing shortage: ~ 400 Lakh houses
• Drivers of incremental demand:
Current population growth
@ 1.3% p.a. Demand for 34 Lakh houses p.a.
• Total incremental demand for houses over 100 Lakhs p.a.
• Total opportunity over the next seven years expected to be ~700 Lakh houses
Ongoing nuclearisation
@ 0.9% p.a. Demand for 25 Lakh houses p.a.
Source: Census of India; Ministry of Statistics & Programme Implementation; National Sample Survey Office; CLSA
29

Housing: From Social Objective to Centrepiece Economic Policy
30
Housing sector has the ability to propel rural and urban economic activity
- Housing sector: Country’s 4th largest employment provider* employing both semi-skilled and unskilled labour
- Housing and the larger real estate sector has a high growth multiplier effect on the economy with linkages to over 250 ancillary industries
- Housing sector accounts for ~5% of GDP
* Source: National Council of Applied Economic Research
• Incentives from PMAY subsidy and tax deductions • Increase in carpet area of houses eligible for interest subsidy • Home loan rates in affordable housing at 0.59% • RERA in place: transparency and delivery visibility to buyers • 90% of government-run pension fund EPFO can be withdrawn for house purchase
Home Buyers
• Infrastructure status for affordable housing, easing access to institutional credit • RBI, SEBI and IRDAI have coordinated policies to ease access to funding • Reduction in risk weights and easing of LTV caps • Increased access to ECBs; ticket sizes to qualify as PSL lending for banks broadened
Housing Finance Companies
• 100% corporate tax exemption on profits from affordable housing construction • Quicker building permissions • RERA in place: transparency and delivery visibility to buyers will aid sales
Real Estate Developers
Coordinated policy measures aimed at all sections of the housing market
PMAY: Pradhan Mantri Awas Yojana RERA: Real Estate Regulatory Act EPFO: Employees’ Provident Fund Organization RBI: Reserve Bank of India SEBI: Securities and Exchange Board of India IRDAI: Insurance Regulatory and Development Authority of India LTV: Loan to Value

31
Years Opening Loan
Principal Interest Payment
[@ 8.80%]
Principal Repayment [pre-payment at least up till ₹ 150,000
p.a. to maximise tax benefit]
Tax Saved* Net Amount Paid [Net of Tax Savings]
1 2,169,844 189,293 150,000 105,860 233,434
2 2,019,844 175,548 150,000 101,571 223,977
3 1,869,844 161,802 150,000 97,282 214,520
4 1,719,844 148,057 150,000 92,994 205,063
5 1,569,844 134,311 150,000 88,705 195,606
6 1,419,844 120,565 150,000 84,416 186,149
7 1,269,844 106,820 150,000 80,128 176,692
8 1,119,844 93,074 150,000 75,839 167,235
9 969,844 79,328 151,605 71,550 159,383
10 818,240 65,436 165,497 67,216 163,717
11 652,742 50,270 180,663 62,484 168,449
12 472,079 33,714 197,219 57,319 173,614
13 274,860 15,642 215,291 51,680 179,253
14 59,569 916 59,569 18,871 41,613
Total 1,374,775 2,169,844 1,055,915 2,488,704
* Tax saved = 31.20% of [interest paid up to ₹ 250,000 + principal paid up to ₹ 150,000] Effective Interest Rate
on Home Loan 0.59% p.a.
Illustration for Indiabulls Housing’s average Home Loan at headline yield of 8.80%
- House value: ₹ 3,500,000 - Home loan amount: ₹ 2,400,000 [Loan to value of 70%] - PMAY subsidy : ₹ 230,156 - Net loan amount: ₹ 2,169,844
PMAY and Tax Incentives for Mid-Income Affordable Housing
• Interest subsidy benefit under PMAY scheme extended up till March 2020
PMAY: Pradhan Mantri Awas Yojana; [Amounts in ₹]

[Inverse Scale]
13.3 19.6
30.0 35.1
3.5 5.7 10.2
14.6
3.8 3.4 2.9
2.4
2005 2010 2015 2019
Price of House* Annual Income Affordability
3.4% 3.5%
2.3% 2.9%
4.0% 3.9%
2.6% 2.6%
5.0%
3.1% 3.4%
2.7% 3.2%
0.59%
Rental yield Effective Interest Rate on Home Loans with PMAY [0.59%]
32
• The effective home loan rate is only 0.59% against
rental yield of 3.2% in the top-12 Indian cities
• Home ownership is very lucrative and much cheaper than renting property
Rental Yield v/s Home Loan Cost
Increasing Affordability
* Source: NHB; Industry reports
Source: NHB; Industry reports
Affordability is defined as “Price of House” divided by the “Annual Income”
Amount in ₹ Lakhs
EMI Smaller than Rent Cheque: PMAY and Tax Incentive for Mid-Income Affordable Housing
EMI: Equated Monthly Installment. Equal monthly installments of a principal amortising loan PMAY: Pradhan Mantri Awas Yajana

1: Anarock, Jul 19 2: Anarock, Sep 18 3: JLL Report, Jan 19 4. ICRA Report, Dec 18 5: Knight Frank, Jul 19 6: Knight Frank, Dec 18
Growth Momentum in Residential Real Estate
• Moderate price correction of 3-4% in H1CY19 in cities like Mumbai, Pune and Chennai5
• Average price of housing units in most cities are now inching closer to or below the Knight
Frank Affordability Benchmark of 4.5 times the annual household income6
• In Q2CY19, new launches in the premium category grew by 60% QoQ1
• Sales in premium submarkets of South Mumbai and North Mumbai multiplied by more
than 1.5 times during CY183
• Share of higher ticket size loans up from 11% in FY16 to 13% in FY184
• Housing sales in H1CY19 remained resilient despite general elections and registered growth
of 34% YoY across seven key Indian cities 1
• Stock of unsold inventory has fallen 5% YoY to 0.67 Mn units in Q2CY19 1
• Over 147,000 units were sold in H1CY19 with NCR, Mumbai, Bengaluru and Pune together
accounting for 83% of the sales 1
• Launches up 67% YoY in H1CY19 across seven key Indian cities1
Pune – 210%, MMR – 125%, NCR – 66% 1
• 37% of launches in major cities in India during Q2CY19 were in the affordable segment1
• Housing for All by 2022 to attract $1.3 Tn investments into residential real estate by 20252 Launches
Premium Market Uptick
Increasing Affordability
Sales Pick-up
33

Commercial Office Space Absorption
1: Knight Frank, Jul 19 2: Colliers Repoort, Feb 19 3: JLL Report, Dec 18 4: Colliers Report, Jul 19 5: KPMG Report, Sep 18
• H1CY19 sees decadal high in leasing activity in top eight cities1
• 27.4 mn sq. ft. leased during H1CY19 across top eight cities, up 26% YoY1
‒ Mumbai, Bengaluru, Pune and NCR account for ~75% of leasing activity1
• 23.9 million sq. ft. of office space supply added during H1CY19, increase of 31% YoY1
‒ Hyderabad, Bengaluru and NCR accounted for ~75% of new office space supply1
• Grade-A office space to surpass 700 Mn sq. ft. by 2022 from the present 532 Mn sq. ft.3
• Average rental values across top eight cities grew 10% YoY during H1CY191
‒ Ahmedabad – 14.3%, Bengaluru – 13.5%, Hyderabad – 11.3%1
• Rentals to grow by ~5% YoY in high demand micro–markets2
• Vacancy down from 13.1% in 2018 to 12.7% in H1CY191
‒ Vacancy rates in key micro-markets of Bangalore, Pune and Hyderabad remains low at 4-7% in H1CY191
• Vacancy expected to be down by 1.5% YoY in 2019, amidst robust absorption2
• PE inflows in real estate in H1CY19 stood at $ 3.9 Bn, up by 26% YoY4
• PE inflows in real estate to grow to $100 Bn by 2026; commercial market to touch $1 Tn by 20305
Low Vacancy
Pick-up in Leasing
Addition in Supply
PE Funding
Increasing Rentals
34

Subsidy eligibility under Pradhan Mantri Awas Yojana [PMAY] covers up to ₹ 12 lakh of home loan – reduces effective home loan rates to 0.59% for mid-income affordable housing
Pradhan Mantri Awas Yojana [PMAY]
Tax Incentives Increased tax incentives and PMAY subsidies reduce effective home loan yields to 0.59% for a 8.80% home loan. Reduction in GST rates for under- construction properties to 5% and 1% for affordable housing will help boost sales. Additional deduction of ₹ 1.5 lakh per annum against interest payment announced for affordable housing loans 100% tax exemption on profits from construction of affordable housing will attract organized developers and increase supply
Budget 2016-17
Favorable Demographics
66% of India’s population is under 35 years of age. Urban housing requirement estimated to grow to 450 lakh units by 2022
Urbanisation to rise to 40% of population by 2030 from the present 31% Accelerating Urbanization
Improving Affordability
Rising disposable income, low housing loan interest rates and tepid property price inflation resulting in rapidly increasing affordability Housing for All by 2022; Smart cities plan; Atal Mission for Rejuvenation and Urban Transformation; Pradhan Mantri Awas Yojana [PMAY]
Government Policy Thrust
Funding Drivers RBI, SEBI and IRDAI – regulatory focus on increasing funding avenues to HFCs; Distribution tax on securitization abolished
Measures in the last 39 months: Boost to the Housing Sector
Key Structural Drivers of Housing Growth
PMAY projects to be out of purview of GST. Service tax exemption on construction of affordable housing projects will lead to reduction in prices, increasing affordability
Fiscal Incentives
Regulator Real Estate [Regulatory & Development] Act, 2016 enables a structured, transparent and disciplined sector
Strong Structural Drivers and Government Focus
EPF Corpus Withdrawal
Homebuyers can withdraw from their accumulated EPF corpus for both the down payment on their house as well as for paying their home loan EMIs
EPF: Employees’ Provident Fund SEBI: The Securities and Exchange Board of India GST: Goods and Services Tax IRDA:I Insurance Regulatory and Development Authority of India RBI: The Reserve Bank of India 35

36
Product Profiles

Home Loan Profile: Focus on Mid-Income Affordable Housing
37
Average Loan Size ₹ 24 Lakhs
Maximum Loan to Value 80%
Average Loan to Value 73% [at origination]
Average Loan Term 15 years
Average Customer Age 38 years
Primary Security Mortgage of property financed
Repayment Type Monthly amortizing
• PMAY covers Middle Income Group [MIG] - defined as households with annual income up to ₹ 18 Lakhs - for purchase of a house of carpet area of up to 2,153 sq. ft.
• Effective home loan rate for ₹ 24 Lakhs home loan, IBH’s average ticket size, is only 0.59%
PMAY: Pradhan Mantri Awas Yojana MIG: Middle Income Group

Minimum Loan Size ₹ 10 Lakhs
Average Loan Size ₹ 15 Lakhs
Maximum Loan Size ₹ 40 Lakhs
Maximum Loan to Value 80% [at origination]
Maximum Loan Term 20 years
Average Customer Age 39 years
Primary Security Mortgage of property financed
Repayment Type Monthly amortizing
• Smart City Home Loans rides on the eHome Loans infrastructure with lean spoke branches logging in digital/ scanned loan applications, these are underwritten at centralised regional credit hubs
• Smart City Home Loans is driving expansion into geographies with low competitive intensity, contributing better margins at low cost-to-income without dilution in credit standards
38
Smart City Home Loan: Technology-led cost-effective
Geographical Expansion through eHome Loans platform

Loan Against Property Product Profile
39
Average Loan Size ₹ 73 Lakhs
Maximum Loan to Value 65%
Average Loan to Value 49% [at origination]
Average Loan Term 7 years
Primary Security Mortgage of property financed
Repayment Type Monthly amortizing
Average Age of Business 7 years
Basis of Credit Appraisal Business cash flow analysis based
Cash flow based underwriting: Loan repayment is from underlying business cash flows and not from refinancing

•
•
•
•
•
•
•
•
•
•
• •
•
•
•
•
•
•
•
•
•
•
• •
•
•
•
•
• •
•
Smart City Branches
Service Centers
Branches
Master Service Centers [MSC]
Head office
• Core credit committee
• Loans above pre-defined limits go to the committee
• Regional credit hub
• Detailed credit analysis
• Underwrites high value cases
• Walk-in branches
• Customer interaction and service delivery
• Credit authority for low-ticket sizes
• Customer interaction and service delivery
• Recommends proposals
• No credit authority
Pan-India Brick-and-Mortar Branch Network
• Technology enabled lean branches with only sales staff
• Online loan application file completion
• Underwriting at ‘hub’ credit centres
Note: Map not as per scale. The branch locations shown are for representative purposes only and doesn’t reflect all branches of the company SAMMIE Awards
2018
Best Social Media Brand
Award for Branding
PRCI Corporate Collateral Awards
2018
Excellence in Cost
Management
ICAI 14th National Awards
2017
Best Digital Innovators in
Customer Experience
BW Digital India Summit
2017
Certificate for Risk Management
Golden Peacock Awards 2017
Excellence in Home Loan
Banking
My FM Stars of Industry
Awards 2017
Ranked #13 in the Forbes Global 2000 – Growth Champions 2018: World’s Largest Consumer Finance Company list for 2018. One of the only two Indian companies on the list.
Awards and Accolades
40
Certified as ‘Great Place To Work’ by the Great Place to Work® Institute

Basic information filled by one-click interactive options:
Online Processing fee payment options
Lead Sources
Website
App
Social Media
Chat bots
SMS Channel
Sales/ Branch
References
Partners
Aggregators
eHome Loan App and Portal
Application form Document upload
Income proof directly from bank’s system: using Perfios facility One click document upload from • Diglocker • Google Drive • Dropbox
e-sign
Digitally enabled e-signs replace 70+ physical signatures
IB Systems
Data directly flows to multiple systems of IB for action
Government certified document storage
Customer Toughpoints
• Loan Details • Property Details • Employment details
Email fraud detection
Automatically Triggers: • Decision Engine • Verification
reports
Financial data
IB
Online payment
Third party integrations
eHome Loans: Digitised Workflow, Analytics driven
Underwriting and Digital Payments Infrastructure
41

eHome Loans: Digitised Workflow, Analytics driven
Underwriting and Digital Payments Infrastructure
Parallel reports triggered: • Property legal
and technical checks
• Field verification
Post application the following are triggered automatically: • Detailed credit history from credit
bureaus • Bank statement analysis • Deduplication • Verification reports • Business Rule engine for scoring
Sanctioning
Verifications Automated Credit Decisioning
e-sign and instant Disbursement
Host -to-host integration with sponsor banks for direct and instant disbursement to customer/ builders • IMPS • RTGS • NEFT Provide instant digital insurance certificate of aggregator insurance companies
Third party integrations
Servicing
Self Service 65% of service requests can be instantly resolved on following multiple customer touch points • Facebook • Twitter • Customer app/ portal • Kiosk • AI enabled Chat BOT • Voice Recognition
Intimation of Payment demands raised by builder will come instantly to IB Remind and Follow up service to meet builder payment demands
On the go reports: Teams can file real time reports through the integrated app
Auto credit decision for majority applicants
All the above information goes into the decision engine for auto decision
IB
All reports and tracking on app
Email fraud detection Financial data analysis
On request for disbursement, customer can e-sign the complete loan kit
Digital mandate for auto debit for equated monthly installment for loan servicing
Digital mandate for debit
Builder on IB
platform
Instant Disbursal
42

Focus on prime, mid-income customer segment with steadily rising disposable incomes
Consumer focused scalable lending model
Focus on customer acquisition rather than single-loan relationship Strong fee generation opportunities through distribution of risk-cover and investment products
Product suite spanning home loans and other mortgage loans to individuals and businesses Demonstrated track of sustained 3%+ spreads and RoEs of 25%+
Technology leadership Analytics and technology-led innovation to deliver superior customer experience along with enhanced
earning opportunities and operating efficiencies
Unique Franchise in Indian Mortgage Market
Strengths similar to Banks
• Access to deep pools of capital: debt and equity • Funding efficiencies from highest AAA credit rating • Evolved regulations, processes and risk management practices
Scalability of Mortgage
• Focused on the most scalable and secure asset class: Home Loans • India’s mortgage-to-GDP of only 9.7% • China’s mortgage market is 14x that of India’s while its GDP is
only 5x
43

Conservative Loan Against Property Portfolio
44

Loan Against Property Product Profile
45
Average Loan Size ₹ 73 Lakhs
Maximum Loan to Value 65%
Average Loan to Value 49% [at origination]
Average Loan Term 7 years
Primary Security Mortgage of property financed
Repayment Type Monthly amortizing
Average Age of Business 7 years
Basis of Credit Appraisal Business cash flow analysis based
• IBH LAP loans are underwritten on a cash flow based appraisal model
• For over three years now IBH has been getting all of its incremental LAP loans graded by CRISIL [an S&P Global Company]
- CRISIL grades the loans on aspects such as financial strength; business and management; collateral strength quality and enforceability; and attributes of the loan itself
- Engagement with CRISIl was initiated inQ1FY16

6% 2% 16% 14% 14%
11%
3% 3% 7%
5% 2% 5%
19% 28%
21% 21% 25% 27% 22% 19% 23%
20% 21% 29%
2008 2009 2010 2011 2012 2013 2014 2015 2016 2017 2018 2019
Residential Price Inflation Total Annual Repayment
79% 72% 76% 71% 73% 74% 77% 79% 78% 81% 80% 81%
21% 28% 24% 29% 27% 26% 23% 21% 22% 19% 20% 19%
2008 2009 2010 2011 2012 2013 2014 2015 2016 2017 2018 2019
Full Pre- payment Accelerated+Regular Annual Repayment
Loan Against Property Myths
• Full pre-payment, a proxy for refinance, has been low • An average of 76% of repayments are from clients’
business cash flows, not from loans being refinanced
Residential price inflation is from NHB Residex weighed with population of constituent cities
LAP Myth 2: Asset inflation is mainly responsible for LAP portfolio quality
Fluctuation in property price inflation has no direct correlation with the repayment capability of LAP borrowers
LAP Myth 4: Refinance drives LAP repayment rates LAP Myth 3: Real Estate Price Deflation will Inflate LTVs
At Disbursal
2 Years Later
Property Value
100 70 Price deflation by 30% over 2 years
Loan Amount
50 32 Repayment of 20% per annum
LTV2 50% 46% Real LTV
• Assuming an extreme case 30% price deflation over a two year period, repayment rate of 20% per annum will mean that actual LTV will not rise
3-Year Amortization Experience for IBHFL
Contracted Amortization 23%
Actual Amortization 51%
NHB: National Housing Bank, sector regulator for housing finance institutions LTV: Loan to value 46

47
LAP Grading A Pioneering Initiative for Improved Risk Management and Greater Transparency

Loan Against Property Grading from CRISIL
48
• Sourcing quality sustained through transition to GST
• LAP grading engagement with CRISIL [an S&P Global Company] - CRISIL grades LAP loans on aspects such as past payment track record; nature of business and financial performance; nature
of property; and loan attributes like ticket size, lending scheme, loan tenure, etc.
- Engagement with CRISIL was initiated more than three years ago in Q1FY16
• Grading exercise is being built into a comprehensive risk model
- Learnings from the grading exercise is being used to develop an analytical credit scoring model
- Portfolio performance and delinquency is being tracked against loan grades
- Proactive customer management: retention, upsell/ cross-sell, delinquency management
- Learning is being fed back to improve loan underwriting and continuously upgrade lending policy
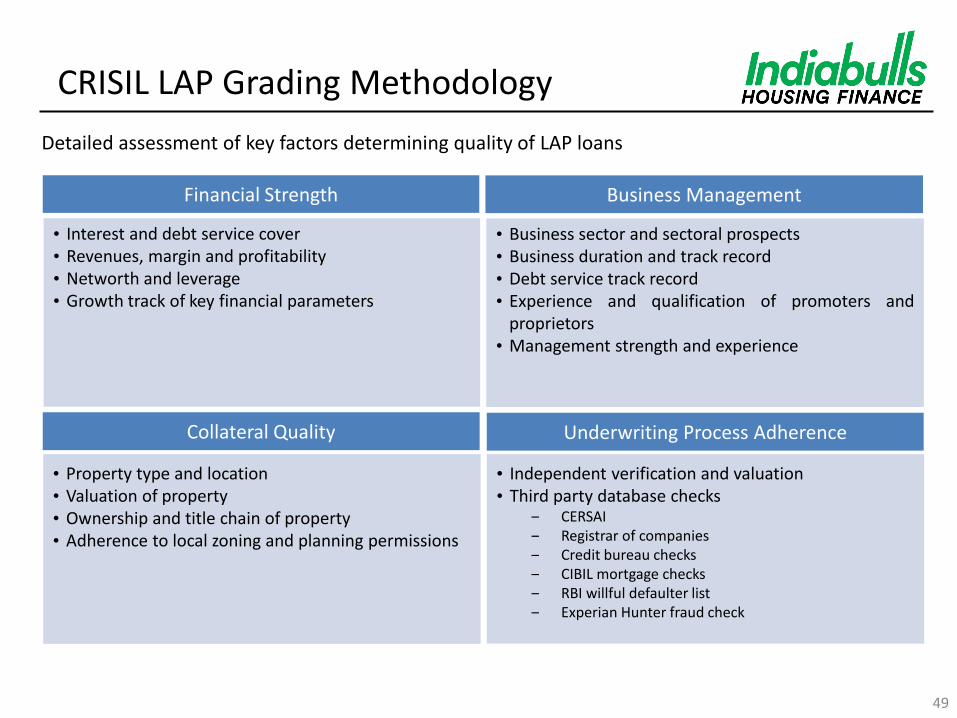
Detailed assessment of key factors determining quality of LAP loans
49
Financial Strength
• Interest and debt service cover • Revenues, margin and profitability • Networth and leverage • Growth track of key financial parameters
Collateral Quality
• Property type and location • Valuation of property • Ownership and title chain of property • Adherence to local zoning and planning permissions
Business Management
• Business sector and sectoral prospects • Business duration and track record • Debt service track record • Experience and qualification of promoters and
proprietors • Management strength and experience
Underwriting Process Adherence
• Independent verification and valuation • Third party database checks
‒ CERSAI ‒ Registrar of companies ‒ Credit bureau checks ‒ CIBIL mortgage checks ‒ RBI willful defaulter list ‒ Experian Hunter fraud check
CRISIL LAP Grading Methodology

50
• For the last three years, incremental LAP loans are graded by CRISIL Ratings
• Sourcing quality sustained through transition to GST
• Grading is based on customized scale developed by CRISIL Ratings for IBH’s LAP loans to small business owners
• CRISIL grades the loans on aspects such as financial strength; business and management; collateral; and underwriting process
Grading Segment Characteristics
Grading Scale
Quality of LAP Loans#
Disbursals Apr 15 –Feb
19
Interest Service
Coverage Ratio [ISCR]
Total Outstanding Liabilities/ Total Net
worth
Loan to Value [LTV]
EBITDA Margins
LAP1 Highest 8.30% 10.3 – 13.3 1.3 – 1.4 49% 15% – 19%
LAP2 High 81.91% 8.2 – 10.3 2.0 – 2.1 50% 12% – 16%
LAP3 Average 9.42% 7.6 – 9.6 2.8 – 3.0 53% 9% – 12%
LAP4 Below Average 0.17% 13.4 – 18.2 1.7 – 1.8 47% 13% – 16%
LAP5 Poor 0.21% 8.8 – 11.4 2.3 – 2.4 50% 12% - 16%
* The above table represents cumulative disbursements of one time LAP grading since Q1-FY16, , CRISIL had graded 86% of the disbursals since then # Adjudged by CRISIL in relation to other LAP loans extended to other borrowers
Over 99% of incremental LAP loans are within the top three grades
CRISIL LAP Grading

51
Static Credit Performance Analysis of LAP and HL Pools

52
Initial Pool Details of Initial POS
Loan Pool Type
Number of Pools
Disbursement [₹ Cr]
Average Ticket Size
[at disbursement] [₹ Lakh]
Sold Down Principal
[₹ Cr]
Months on Book
Pool Principal
[₹ Cr] Amortisation 90+ dpd %
180+ dpd %
HL Pools 108 34,662 24 27,645 27 17,634 47% 0.04% 0.01% LAP Pools 94 22,374 62 18,055 33 8,550 53% 0.07% 0.04% Total 202 57,036 32 45,700 29 26,184 52% 0.05% 0.02%
Retail Loan Book of Highest Quality
Portfolio performance of all sold down pools of ₹ 57,036 Cr
IBHFL has 23 ongoing relationships with banks for sell down
Axis Bank Bank of Baroda Bank of India Canara Bank
ICICI Bank Central Bank of India Corporation Bank Dena Bank
Deutsche Bank IDFC First Bank IDBI Bank Indian Bank
Indian Overseas Bank Kotak Mahindra Bank Oriental Bank of Commerce Punjab National Bank
State Bank of India RBL Bank Syndicate Bank UCO BANK
Union Bank of India Vijaya Bank HDFC Bank

MPS: Months post securitisation MCR: Monthly collection ratio # Amortisation is calculated on Disbursement CCR: Cumulative collection ratio QCR- Quarterly collection ratio dpd: days past due
53
Home Loans Pool Performance Factsheet: CRISIL Direct Assignments [Sold Down]
Data is for Mar 2019 payouts
Initial Pool Details of Initial POS
Sr. No Investor Sold Down
Date Disbursement
[₹ Cr]
Sold Down Principal
[₹ Cr] MPS
Pool Principal [₹ Cr]
Amortisa-tion#
90+ dpd % 180+ dpd % CCR MCR QCR
1 Bank 4 20-Mar-14 345.2 292.3 60 43.0 86% 0.00% 0.00% 100.0% 97.4% 100.3%
2 Bank 5 28-Mar-14 212.0 167.7 60 13.8 93% 0.00% 0.00% 100.0% 102.6% 100.5%
3 Bank 5 27-Jun-14 107.2 90.0 56 11.8 88% 0.00% 0.00% 100.0% 99.2% 101.3%
4 Bank 6 30-Jul-14 102.4 80.0 56 13.9 84% 0.00% 0.00% 99.9% 97.6% 101.7%
5 Bank 5 30-Sep-14 129.9 96.6 53 7.6 94% 0.00% 0.00% 100.0% 102.9% 100.0%
6 Bank 8 24-Sep-15 116.4 100.1 41 35.5 66% 0.27% 0.09% 99.9% 98.8% 100.2%
7 Bank 9 31-Dec-15 449.6 374.2 38 91.6 77% 0.11% 0.08% 100.0% 99.8% 100.1%
8 Bank 8 29-Feb-16 105.3 89.4 36 17.8 81% 0.00% 0.00% 100.0% 100.8% 99.8%
9 Bank 8 28-Mar-16 62.0 53.0 35 16.1 71% 0.00% 0.00% 99.9% 98.6% 99.6%
10 Bank 4 29-Oct-13 165.4 135.1 64 9.4 94% 0.00% 0.00% 100.0% 99.9% 99.9%
11 Bank 4 27-Dec-13 273.2 231.0 62 18.2 93% 0.00% 0.00% 100.0% 100.1% 100.3%
12 Bank 3 31-Dec-13 85.7 71.7 62 23.2 70% 0.00% 0.00% 99.9% 99.5% 99.5%
13 Bank 6 28-Mar-14 101.1 82.6 60 11.1 87% 0.00% 0.00% 99.9% 100.0% 100.6%
14 Bank 5 26-Dec-14 84.1 68.0 51 6.4 92% 0.00% 0.00% 100.0% 100.0% 99.0%
15 Bank 4 30-Dec-14 234.6 198.3 50 10.9 95% 0.00% 0.00% 100.0% 100.0% 103.3%
16 Bank 4 01-Mar-15 187.7 156.3 48 18.8 89% 0.04% 0.04% 100.0% 106.4% 101.4%
17 Bank 4 11-Jun-15 100.0 85.5 46 9.9 89% 0.00% 0.00% 100.0% 102.0% 100.7%
18 Bank 4 23-Jun-15 232.8 186.9 45 21.7 90% 0.11% 0.11% 99.9% 98.5% 99.7%
19 Bank 7 29-Jun-15 100.0 84.5 44 9.3 90% 0.10% 0.10% 99.9% 98.5% 99.7%
20 Bank 8 25-Aug-15 72.9 61.3 43 16.8 74% 0.00% 0.00% 100.0% 99.4% 100.0%
21 Bank 7 01-Sep-15 138.0 115.9 42 12.6 90% 0.00% 0.00% 100.0% 101.2% 100.6%
22 Bank 7 28-Sep-15 116.8 96.4 41 11.0 89% 0.00% 0.00% 100.0% 100.0% 99.1%
23 Bank 8 31-Dec-15 117.8 98.6 38 20.6 81% 0.00% 0.00% 100.0% 97.4% 100.3%
24 Bank 7 23-Dec-15 52.9 45.1 38 5.0 89% 0.00% 0.00% 100.0% 102.6% 100.5%
25 Bank 9 23-Mar-16 134.2 112.5 35 39.2 68% 0.17% 0.00% 100.0% 99.2% 101.3%
26 Bank 8 31-Mar-16 59.8 50.6 35 11.2 79% 0.00% 0.00% 99.9% 97.6% 101.7%
27 Bank 6 21-Mar-16 281.8 234.5 35 27.8 89% 0.00% 0.00% 100.0% 102.9% 100.0%
28 Bank 6 21-Mar-16 97.4 79.3 35 5.5 94% 0.00% 0.00% 99.9% 98.8% 100.2%
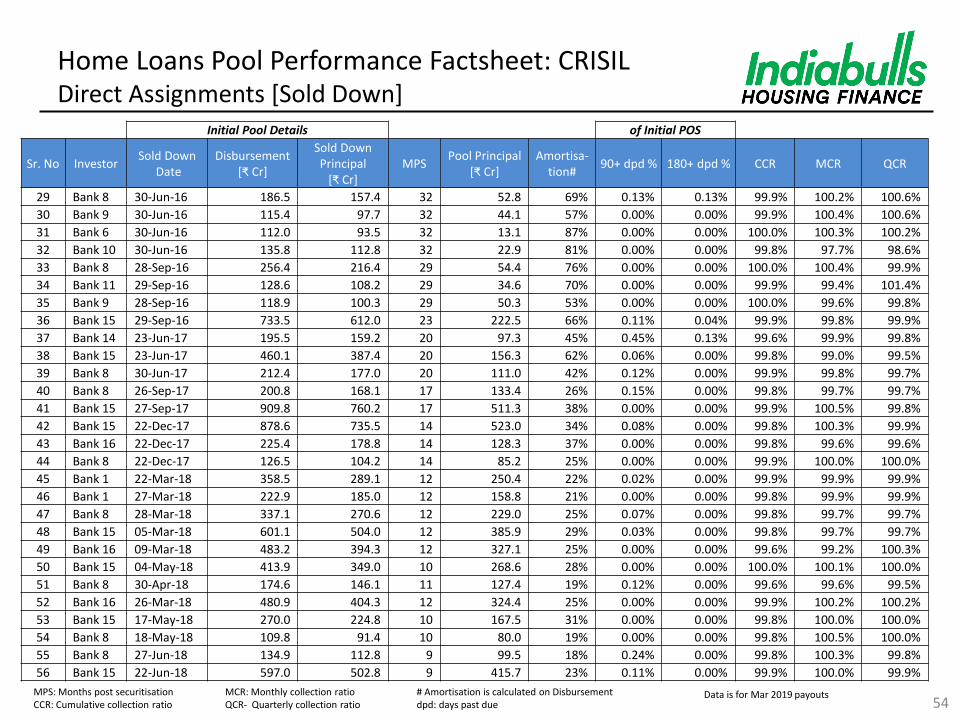
Home Loans Pool Performance Factsheet: CRISIL Direct Assignments [Sold Down]
Initial Pool Details of Initial POS
Sr. No Investor Sold Down
Date Disbursement
[₹ Cr]
Sold Down Principal
[₹ Cr] MPS
Pool Principal [₹ Cr]
Amortisa-tion#
90+ dpd % 180+ dpd % CCR MCR QCR
29 Bank 8 30-Jun-16 186.5 157.4 32 52.8 69% 0.13% 0.13% 99.9% 100.2% 100.6%
30 Bank 9 30-Jun-16 115.4 97.7 32 44.1 57% 0.00% 0.00% 99.9% 100.4% 100.6%
31 Bank 6 30-Jun-16 112.0 93.5 32 13.1 87% 0.00% 0.00% 100.0% 100.3% 100.2%
32 Bank 10 30-Jun-16 135.8 112.8 32 22.9 81% 0.00% 0.00% 99.8% 97.7% 98.6%
33 Bank 8 28-Sep-16 256.4 216.4 29 54.4 76% 0.00% 0.00% 100.0% 100.4% 99.9%
34 Bank 11 29-Sep-16 128.6 108.2 29 34.6 70% 0.00% 0.00% 99.9% 99.4% 101.4%
35 Bank 9 28-Sep-16 118.9 100.3 29 50.3 53% 0.00% 0.00% 100.0% 99.6% 99.8%
36 Bank 15 29-Sep-16 733.5 612.0 23 222.5 66% 0.11% 0.04% 99.9% 99.8% 99.9%
37 Bank 14 23-Jun-17 195.5 159.2 20 97.3 45% 0.45% 0.13% 99.6% 99.9% 99.8%
38 Bank 15 23-Jun-17 460.1 387.4 20 156.3 62% 0.06% 0.00% 99.8% 99.0% 99.5%
39 Bank 8 30-Jun-17 212.4 177.0 20 111.0 42% 0.12% 0.00% 99.9% 99.8% 99.7%
40 Bank 8 26-Sep-17 200.8 168.1 17 133.4 26% 0.15% 0.00% 99.8% 99.7% 99.7%
41 Bank 15 27-Sep-17 909.8 760.2 17 511.3 38% 0.00% 0.00% 99.9% 100.5% 99.8%
42 Bank 15 22-Dec-17 878.6 735.5 14 523.0 34% 0.08% 0.00% 99.8% 100.3% 99.9%
43 Bank 16 22-Dec-17 225.4 178.8 14 128.3 37% 0.00% 0.00% 99.8% 99.6% 99.6%
44 Bank 8 22-Dec-17 126.5 104.2 14 85.2 25% 0.00% 0.00% 99.9% 100.0% 100.0%
45 Bank 1 22-Mar-18 358.5 289.1 12 250.4 22% 0.02% 0.00% 99.9% 99.9% 99.9%
46 Bank 1 27-Mar-18 222.9 185.0 12 158.8 21% 0.00% 0.00% 99.8% 99.9% 99.9%
47 Bank 8 28-Mar-18 337.1 270.6 12 229.0 25% 0.07% 0.00% 99.8% 99.7% 99.7%
48 Bank 15 05-Mar-18 601.1 504.0 12 385.9 29% 0.03% 0.00% 99.8% 99.7% 99.7%
49 Bank 16 09-Mar-18 483.2 394.3 12 327.1 25% 0.00% 0.00% 99.6% 99.2% 100.3%
50 Bank 15 04-May-18 413.9 349.0 10 268.6 28% 0.00% 0.00% 100.0% 100.1% 100.0%
51 Bank 8 30-Apr-18 174.6 146.1 11 127.4 19% 0.12% 0.00% 99.6% 99.6% 99.5%
52 Bank 16 26-Mar-18 480.9 404.3 12 324.4 25% 0.00% 0.00% 99.9% 100.2% 100.2%
53 Bank 15 17-May-18 270.0 224.8 10 167.5 31% 0.00% 0.00% 99.8% 100.0% 100.0%
54 Bank 8 18-May-18 109.8 91.4 10 80.0 19% 0.00% 0.00% 99.8% 100.5% 100.0%
55 Bank 8 27-Jun-18 134.9 112.8 9 99.5 18% 0.24% 0.00% 99.8% 100.3% 99.8%
56 Bank 15 22-Jun-18 597.0 502.8 9 415.7 23% 0.11% 0.00% 99.9% 100.0% 99.9%
MPS: Months post securitisation MCR: Monthly collection ratio # Amortisation is calculated on Disbursement CCR: Cumulative collection ratio QCR- Quarterly collection ratio dpd: days past due 54
Data is for Mar 2019 payouts
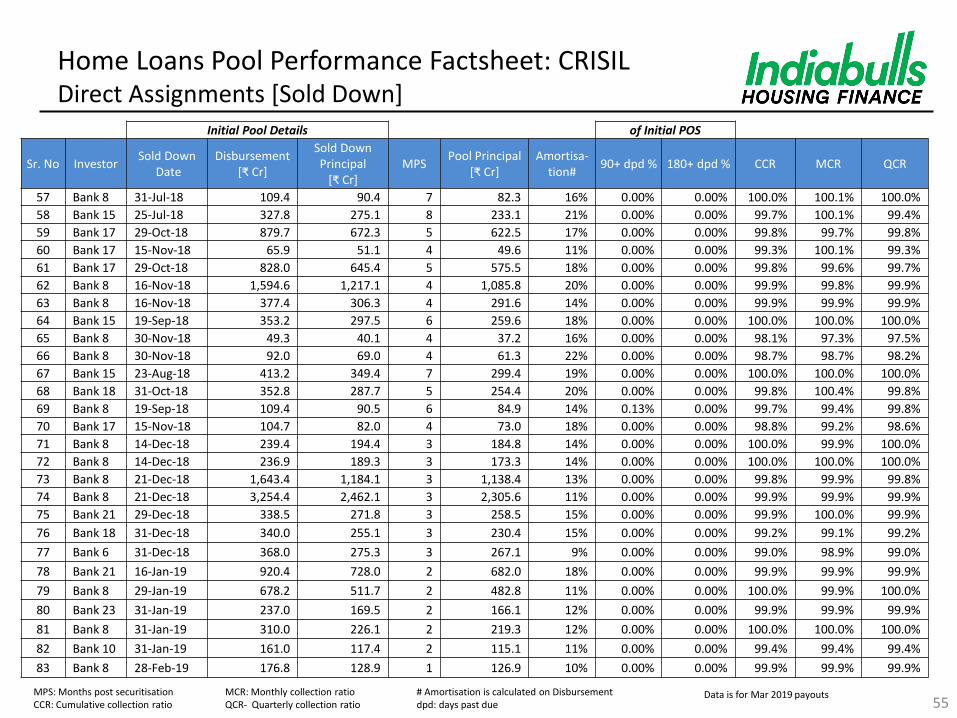
Home Loans Pool Performance Factsheet: CRISIL Direct Assignments [Sold Down]
Initial Pool Details of Initial POS
Sr. No Investor Sold Down
Date Disbursement
[₹ Cr]
Sold Down Principal
[₹ Cr] MPS
Pool Principal [₹ Cr]
Amortisa-tion#
90+ dpd % 180+ dpd % CCR MCR QCR
57 Bank 8 31-Jul-18 109.4 90.4 7 82.3 16% 0.00% 0.00% 100.0% 100.1% 100.0%
58 Bank 15 25-Jul-18 327.8 275.1 8 233.1 21% 0.00% 0.00% 99.7% 100.1% 99.4%
59 Bank 17 29-Oct-18 879.7 672.3 5 622.5 17% 0.00% 0.00% 99.8% 99.7% 99.8%
60 Bank 17 15-Nov-18 65.9 51.1 4 49.6 11% 0.00% 0.00% 99.3% 100.1% 99.3%
61 Bank 17 29-Oct-18 828.0 645.4 5 575.5 18% 0.00% 0.00% 99.8% 99.6% 99.7%
62 Bank 8 16-Nov-18 1,594.6 1,217.1 4 1,085.8 20% 0.00% 0.00% 99.9% 99.8% 99.9%
63 Bank 8 16-Nov-18 377.4 306.3 4 291.6 14% 0.00% 0.00% 99.9% 99.9% 99.9%
64 Bank 15 19-Sep-18 353.2 297.5 6 259.6 18% 0.00% 0.00% 100.0% 100.0% 100.0%
65 Bank 8 30-Nov-18 49.3 40.1 4 37.2 16% 0.00% 0.00% 98.1% 97.3% 97.5%
66 Bank 8 30-Nov-18 92.0 69.0 4 61.3 22% 0.00% 0.00% 98.7% 98.7% 98.2%
67 Bank 15 23-Aug-18 413.2 349.4 7 299.4 19% 0.00% 0.00% 100.0% 100.0% 100.0%
68 Bank 18 31-Oct-18 352.8 287.7 5 254.4 20% 0.00% 0.00% 99.8% 100.4% 99.8%
69 Bank 8 19-Sep-18 109.4 90.5 6 84.9 14% 0.13% 0.00% 99.7% 99.4% 99.8%
70 Bank 17 15-Nov-18 104.7 82.0 4 73.0 18% 0.00% 0.00% 98.8% 99.2% 98.6%
71 Bank 8 14-Dec-18 239.4 194.4 3 184.8 14% 0.00% 0.00% 100.0% 99.9% 100.0%
72 Bank 8 14-Dec-18 236.9 189.3 3 173.3 14% 0.00% 0.00% 100.0% 100.0% 100.0%
73 Bank 8 21-Dec-18 1,643.4 1,184.1 3 1,138.4 13% 0.00% 0.00% 99.8% 99.9% 99.8%
74 Bank 8 21-Dec-18 3,254.4 2,462.1 3 2,305.6 11% 0.00% 0.00% 99.9% 99.9% 99.9%
75 Bank 21 29-Dec-18 338.5 271.8 3 258.5 15% 0.00% 0.00% 99.9% 100.0% 99.9%
76 Bank 18 31-Dec-18 340.0 255.1 3 230.4 15% 0.00% 0.00% 99.2% 99.1% 99.2%
77 Bank 6 31-Dec-18 368.0 275.3 3 267.1 9% 0.00% 0.00% 99.0% 98.9% 99.0%
78 Bank 21 16-Jan-19 920.4 728.0 2 682.0 18% 0.00% 0.00% 99.9% 99.9% 99.9%
79 Bank 8 29-Jan-19 678.2 511.7 2 482.8 11% 0.00% 0.00% 100.0% 99.9% 100.0%
80 Bank 23 31-Jan-19 237.0 169.5 2 166.1 12% 0.00% 0.00% 99.9% 99.9% 99.9%
81 Bank 8 31-Jan-19 310.0 226.1 2 219.3 12% 0.00% 0.00% 100.0% 100.0% 100.0%
82 Bank 10 31-Jan-19 161.0 117.4 2 115.1 11% 0.00% 0.00% 99.4% 99.4% 99.4%
83 Bank 8 28-Feb-19 176.8 128.9 1 126.9 10% 0.00% 0.00% 99.9% 99.9% 99.9%
MPS: Months post securitisation MCR: Monthly collection ratio # Amortisation is calculated on Disbursement CCR: Cumulative collection ratio QCR- Quarterly collection ratio dpd: days past due 55
Data is for Mar 2019 payouts

LAP Pool Performance Factsheet: CRISIL Direct Assignments [Sold Down]
Initial Pool Details of Initial POS
Sr. No Investor Sold Down
Date Disbursement
[₹ Cr]
Sold Down Principal
[₹ Cr] MPS
Pool Principal [₹ Cr]
Amortisation#
90+ dpd % 180+ dpd % CCR MCR QCR
1 Bank 3 31-Dec-13 224.4 178.6 62 7.9 96% 0.00% 0.00% 100.0% 98.5% 97.6%
2 Bank 10 07-Feb-14 429.8 329.8 62 24.5 94% 0.00% 0.00% 99.9% 97.2% 101.3%
3 Bank 4 28-Mar-14 271.6 214.5 60 14.1 94% 0.00% 0.00% 100.0% 100.9% 103.0%
4 Bank 4 20-Jun-14 231.1 189.4 56 13.0 94% 0.07% 0.07% 99.8% 104.6% 99.9%
5 Bank 4 27-Jun-14 185.5 153.6 56 23.3 86% 0.11% 0.11% 99.9% 103.2% 101.0%
6 Bank 10 29-Dec-14 454.0 371.6 50 49.3 88% 0.12% 0.12% 99.9% 97.2% 97.1%
7 Bank 2 30-Mar-15 1,067.2 869.5 47 162.8 83% 0.17% 0.17% 99.9% 100.1% 99.5%
8 Bank 4 30-Jun-15 145.1 112.8 44 18.4 86% 0.09% 0.09% 99.9% 98.9% 97.8%
9 Bank 12 28-Sep-15 220.2 180.7 41 34.0 83% 0.00% 0.00% 100.0% 99.5% 100.0%
10 Bank 12 28-Sep-15 234.5 200.3 41 43.6 79% 0.00% 0.00% 99.9% 99.2% 102.4%
11 Bank 1 28-Sep-15 359.5 285.0 41 42.7 87% 0.00% 0.00% 99.9% 97.2% 99.9%
12 Bank 8 29-Sep-15 430.3 364.1 42 66.0 83% 0.17% 0.17% 99.9% 104.2% 102.2%
13 Bank 12 09-Dec-15 33.3 24.2 39 4.9 84% 0.00% 0.00% 99.9% 100.5% 100.4%
14 Bank 12 09-Dec-15 50.6 43.5 39 15.8 65% 0.00% 0.00% 100.0% 108.5% 101.1%
15 Bank 12 23-Dec-15 156.2 133.7 38 26.9 81% 0.00% 0.00% 99.9% 98.8% 98.3%
16 Bank 1 31-Dec-15 120.4 99.8 39 26.0 76% 0.00% 0.00% 99.9% 107.0% 102.4%
17 Bank 1 31-Dec-15 278.5 222.5 39 38.4 85% 0.00% 0.00% 99.9% 97.3% 103.0%
18 Bank 1 03-Mar-16 95.7 77.4 36 17.9 79% 0.00% 0.00% 99.9% 98.0% 99.8%
19 Bank 12 10-Mar-16 175.3 150.0 36 19.7 88% 0.00% 0.00% 99.9% 100.0% 100.5%
20 Bank 9 30-Jun-16 250.3 209.4 32 74.7 67% 0.28% 0.00% 99.8% 97.0% 102.6%
21 Bank 10 30-Jun-16 405.9 331.5 32 93.7 74% 0.14% 0.14% 99.9% 101.7% 101.0%
22 Bank 13 26-Sep-16 152.4 124.8 30 38.2 72% 0.00% 0.00% 99.6% 97.4% 98.3%
23 Bank 13 26-Sep-16 216.3 174.8 30 34.8 82% 0.00% 0.00% 100.0% 100.8% 100.7%
24 Bank 8 30-Sep-16 331.2 273.3 29 73.1 75% 0.08% 0.00% 99.8% 97.2% 97.9%
25 Bank 14 30-Mar-17 415.9 340.5 23 164.2 56% 0.00% 0.00% 99.7% 97.5% 98.7%
MPS: Months post securitisation MCR: Monthly collection ratio # Amortisation is calculated on Disbursement CCR: Cumulative collection ratio QCR- Quarterly collection ratio dpd: days past due 56
Data is for Mar 2019 payouts

LAP Pool Performance Factsheet: CRISIL Direct Assignments [Sold Down]
Initial Pool Details of Initial POS
Sr. No Investor Sold Down
Date Disbursement
[₹ Cr]
Sold Down Principal
[₹ Cr] MPS
Pool Principal [₹ Cr]
Amortisation#
90+ dpd % 180+ dpd % CCR MCR QCR
26 Bank 1 20-Mar-12 236.0 222.3 84 10.6 95% 0.00% 0.00% 100.0% 105.9% 100.0%
27 Bank 8 30-Jun-17 406.0 332.7 21 183.2 50% 0.29% 0.00% 99.4% 101.7% 100.8%
28 Bank 10 28-Jun-17 626.6 469.4 20 235.0 58% 0.00% 0.00% 99.8% 99.1% 101.4%
29 Bank 5 26-Sep-17 1,237.7 947.7 17 507.4 54% 0.12% 0.07% 99.8% 99.5% 99.8%
30 Bank 5 26-Sep-17 706.1 580.8 17 309.9 51% 0.32% 0.00% 99.4% 98.4% 98.0%
31 Bank 5 29-Dec-17 436.8 356.9 14 237.6 40% 0.00% 0.00% 99.3% 99.3% 99.0%
32 Bank 5 29-Dec-17 444.6 354.0 14 254.9 36% 0.00% 0.00% 99.2% 99.5% 99.8%
33 Bank 12 29-Dec-17 160.6 129.8 14 82.8 43% 0.00% 0.00% 99.8% 100.0% 100.0%
34 Bank 12 29-Dec-17 217.1 172.0 14 81.7 58% 0.00% 0.00% 99.7% 101.4% 100.2%
35 Bank 12 01-Mar-18 136.6 115.4 12 71.3 42% 0.00% 0.00% 99.8% 101.2% 99.7%
36 Bank 12 01-Mar-18 89.5 71.4 12 49.1 39% 0.00% 0.00% 99.6% 103.7% 99.0%
37 Bank 15 29-Jun-18 515.3 428.1 9 338.3 27% 0.00% 0.00% 99.7% 100.8% 99.9%
38 Bank 12 29-Jun-18 196.0 166.3 9 143.1 19% 0.00% 0.00% 99.9% 99.9% 99.9%
39 Bank 12 29-Jun-18 182.6 147.7 9 122.0 26% 0.00% 0.00% 99.5% 99.9% 99.3%
40 Bank 8 28-Jun-18 112.8 86.5 9 66.2 35% 0.00% 0.00% 99.8% 99.9% 99.6%
41 Bank 8 27-Sep-18 108.4 81.1 6 68.3 30% 0.00% 0.00% 99.2% 99.3% 99.3%
42 Bank 15 19-Sep-18 284.2 237.5 6 198.4 22% 0.00% 0.00% 99.3% 99.8% 99.7%
43 Bank 12 23-Aug-18 121.7 102.2 7 86.1 21% 0.00% 0.00% 99.7% 99.6% 99.9%
44 Bank 12 31-Oct-18 64.6 53.3 5 50.1 14% 0.00% 0.00% 100.0% 99.8% 100.6%
45 Bank 12 23-Aug-18 96.2 83.2 7 75.4 13% 0.00% 0.00% 99.8% 99.9% 99.8%
46 Bank 12 31-Oct-18 64.1 53.5 5 50.8 12% 0.00% 0.00% 99.2% 97.7% 99.0%
47 Bank 15 26-Sep-18 404.0 334.4 6 271.0 25% 0.63% 0.00% 99.2% 98.7% 98.8%
48 Bank 15 31-Oct-18 153.8 131.0 5 121.0 13% 0.00% 0.00% 100.0% 100.0% 100.0%
49 Bank 12 16-Nov-18 25.2 19.5 4 16.5 27% 0.00% 0.00% 99.6% 98.9% 99.6%
50 Bank 15 27-Dec-18 308.8 260.3 3 243.5 12% 0.00% 0.00% 99.4% 99.3% 99.4%
MPS: Months post securitisation MCR: Monthly collection ratio # Amortisation is calculated on Disbursement CCR: Cumulative collection ratio QCR- Quarterly collection ratio dpd: days past due 57
Data is for Mar 2019 payouts

LAP Pool Performance Factsheet: CRISIL Direct Assignments [Sold Down]
Initial Pool Details of Initial POS
Sr. No Investor Sold Down
Date Disbursement
[₹ Cr]
Sold Down Principal
[₹ Cr] MPS
Pool Principal [₹ Cr]
Amortisa-tion#
90+ dpd % 180+ dpd % CCR MCR QCR
51 Bank 15 27-Dec-18 462.3 354.6 3 335.8 9% 0.00% 0.00% 99.1% 99.0% 99.1%
52 Bank 22 31-Dec-18 52.2 40.2 3 38.3 8% 0.00% 0.00% 100.0% 100.0% 100.0%
53 Bank 15 22-Jan-19 182.2 139.8 2 136.4 6% 0.00% 0.00% 99.7% 99.7% 99.7%
54 Bank 12 16-Nov-18 74.9 64.1 4 59.0 12% 0.00% 0.00% 99.4% 100.0% 99.4%
55 Bank 20 28-Feb-19 105.9 62.1 1 61.4 23% 0.00% 0.00% 100.0% 100.0% 100.0%
56 Bank 19 31-Dec-18 99.6 70.9 3 49.3 38% 0.00% 0.00% 100.0% 100.0% 100.0%
57 Bank 19 31-Jan-19 25.1 16.2 2 14.6 28% 0.00% 0.00% 100.0% 100.0% 100.0%
58 Bank 19 30-Nov-18 44.4 37.1 4 36.5 9% 0.00% 0.00% 100.0% 100.0% 100.0%
59 Bank 19 30-Nov-18 55.5 40.1 4 37.3 16% 0.00% 0.00% 100.0% 100.0% 100.0%
60 Bank 19 30-Nov-18 76.0 57.7 4 49.6 28% 0.00% 0.00% 100.0% 100.0% 100.0%
61 Bank 20 12-Dec-18 96.2 50.7 3 42.2 48% 0.00% 0.00% 100.0% 100.0% 100.0%
62 Bank 19 31-Dec-18 18.9 14.9 3 10.0 34% 0.00% 0.00% 100.0% 100.0% 100.0%
63 Bank 19 30-Nov-18 79.8 67.0 4 60.4 16% 0.00% 0.00% 100.0% 100.0% 100.0%
64 Bank 15 24-Jan-19 128.3 108.9 2 108.5 6% 0.00% 0.00% 99.1% 99.1% 99.1%
65 Bank 15 21-Dec-18 117.4 100.3 3 95.3 10% 0.00% 0.00% 100.0% 100.0% 100.0%
66 Bank 20 12-Dec-18 42.1 28.9 3 17.4 51% 0.00% 0.00% 100.0% 100.0% 100.0%
67 Bank 19 30-Nov-18 81.4 67.7 4 62.2 15% 0.00% 0.00% 100.0% 100.0% 100.0%
68 Bank 15 30-Nov-18 245.7 205.4 4 192.0 13% 0.00% 0.00% 100.0% 100.0% 100.0%
69 Bank 18 31-Dec-18 45.4 37.8 3 32.1 22% 0.00% 0.00% 100.0% 100.0% 100.0%
70 Bank 19 31-Jan-19 48.4 35.4 2 34.3 11% 0.00% 0.00% 100.0% 100.0% 100.0%
71 Bank 19 31-Dec-18 162.8 121.2 3 91.0 30% 0.00% 0.00% 100.0% 100.0% 100.0%
72 Bank 19 30-Nov-18 43.0 29.2 4 29.0 16% 0.00% 0.00% 100.0% 100.0% 100.0%
73 Bank 19 31-Dec-18 40.5 31.5 3 31.5 3% 0.00% 0.00% 100.0% 100.0% 100.0%
74 Bank 20 28-Feb-19 25.2 13.9 1 13.9 8% 0.00% 0.00% 97.0% 97.0% 97.0%
75 Bank 20 28-Feb-19 11.7 8.2 1 8.1 19% 0.00% 0.00% 100.0% 100.0% 100.0%
MPS: Months post securitisation MCR: Monthly collection ratio # Amortisation is calculated on Disbursement CCR: Cumulative collection ratio QCR- Quarterly collection ratio dpd: days past due 58
Data is for Mar 2019 payouts

Home Loans and LAP Pool Performance Factsheet Pass-Through Certificates HL Pools
Initial Pool Details of Initial POS
Sr No Investor Sold Down
Date Disbursement
[₹ Cr]
Sold Down Principal [₹ Cr]
MPS Pool Principal
[₹ Cr] Amortis-ation#
90+ dpd %
180+ dpd %
CCR MCR QCR Outstanding Rating from
1 Bank 2 20-Mar-14 335.4 315.2 60 107.3 68% 0.00% 0.00% 100.0% 99.8% 99.8% ICRA
2 Bank 9 29-Jun-17 354.5 330.0 20 221.0 38% 0.00% 0.00% 99.3% 100.0% 100.7% ICRA
3 Bank 2 30-Dec-13 109.6 99.3 63 25.8 76% 0.00% 0.00% 100.0% 101.6% 99.9% CRISIL
4 Bank 14 04-Mar-15 294.1 272.4 49 89.9 69% 0.00% 0.00% 100.0% 100.2% 100.2% CRISIL
5 Bank 3 31-Dec-12 128.7 118.6 75 22.8 82% 0.00% 0.00% 99.9% 99.2% 99.2% CRISIL
6 Bank 3 28-Mar-13 114.6 107.1 72 29.3 74% 0.00% 0.00% 100.0% 98.9% 99.5% CRISIL
7 Bank 14 27-Sep-13 311.9 286.4 66 71.8 77% 0.00% 0.00% 99.9% 100.4% 100.1% CRISIL
8 Bank 18 30-Nov-18 107.4 89.2 4 83.0 23% 0.00% 0.00% 100.0% 100.0% 100.0% CRISIL
Initial Pool Details of Initial POS
Sr No Investor Sold Down
Date Disbursement
[₹ Cr]
Sold Down Principal [₹ Cr]
MPS Pool Principal
[₹ Cr] Amortis-
ation# 90+
dpd % 180+
dpd % CCR MCR QCR
Outstanding Rating from
1 Bank 9 27-Sep-17 664.0 609.7 17 466.7 30% 0.00% 0.00% 99.8% 99.6% 99.9% ICRA
2 Bank 2 30-Dec-13 111.4 98.6 63 10.7 90% 0.00% 0.00% 99.8% 100.0% 117.9% CARE
3 Bank 2 20-Mar-14 440.3 385.0 60 34.1 92% 0.00% 0.00% 99.8% 101.4% 102.2% CARE
4 Bank 3 31-Mar-16 228.0 209.1 35 73.4 68% 0.00% 0.00% 99.8% 103.3% 102.0% CARE
5 Bank 14 30-Sep-16 143.7 136.0 29 44.5 69% 0.00% 0.00% 99.6% 98.8% 101.3% CRISIL
6 Bank 9 30-Dec-16 545.8 512.7 26 272.9 50% 0.00% 0.00% 99.8% 100.7% 100.2% CRISIL
7 Bank 9 27-Mar-17 310.1 292.4 23 182.2 41% 0.00% 0.00% 99.9% 99.9% 99.9% CRISIL
LAP Pools
MPS: Months post securitisation MCR: Monthly collection ratio # Amortisation is calculated on Disbursement CCR: Cumulative collection ratio QCR- Quarterly collection ratio dpd: days past due 59 Data is for Mar 2019 payouts

Corporate Social Responsibility
60

Kumud - Free quality sanitary napkins distributed to
over 5,218 women and adolescent girls - Hygiene & awareness sessions were also
conducted in this quarter. - 1,50,438 women benefitted since inception
JanSwasthya Kalyan Vahika - Free primary healthcare facility provided at
doorsteps for the underprivileged - 2 vans added to existing fleet of 38 - 2,87,252 patients diagnosed this quarter - 30,16,552 patients benefitted since inception
Free Charitable Medical Clinic - 73,035 patients have benefitted from 15
clinics this quarter; 5,29,931 beneficiaries since inception
Free Dialysis Treatment - 4,725 dialysis done this quarter - 21,556 beneficiaries since inception
Health Check up Camps - 10,603 people benefitted this quarter - 1,01,878 beneficiaries since inception
Free Cataract Surgeries - 87 cataract surgeries sponsored this quarter;
757 beneficiaries since inception
Smile Train- Cleft and Palate Surgeries - 550 children benefitted this quarter - 4,350 beneficiaries since inception
Indiabulls Foundation: Corporate Social Responsibility
Transforming Mokhada, Shahapur & Trimbakeshwar - Medical vans, clinics, health camps, nutrition
supplements, sanitary napkins, awareness, etc. provided to the above mentioned districts of Maharashtra
- 2,17,599 people benefitted this quarter - 12,87,548 people benefitted since inception
Water Wheel Project - Fetching water became easier for 12,151 rural
underprivileged people by the distribution of 2,500 water wheel barrows.
- Since inception 35,090 people have benefitted by the distribution of 6,739 water wheels
`
Scholarship Program - 96 underprivileged students awarded
scholarship for higher education in this quarter - 1,229 beneficiaries since inception
Paushtik Aahar - Free nutrition supplements distributed to the
underprivileged and malnourished - 1,50,000 individuals benefitted in this quarter - 11,19,582 individuals benefitted since
inception
Sanitation
`
Health
Rural Development
Transforming Talukas
Education Nutrition
61

Board of Directors, Ratings, Business Value Proposition, Key Ratios, Valuations, and
Shareholding
62
Eminent and Experienced Board of Directors
• Mr. Sameer Gehlaut : Executive Chairman
• Mr. Gagan Banga : Vice Chairman, Managing Director and CEO
• Mr. S.S. Mundra : Former Deputy Governor, The Reserve Bank of India
• Dr. K.C. Chakrabarty : Former Deputy Governor, The Reserve Bank of India
• Justice Gyan Sudha Misra : Retired Justice, Supreme Court of India
• Mr. Satish Chand Mathur : Ex-Director General of Police, Maharashtra
• Mr. Samsher Singh Ahlawat : 20 years of banking experience in senior management positions
• Mr. Prem Prakash Mirdha : Business background with expertise in SME sector
• Mr. Ashwini Kumar Hooda : Deputy Managing Director
• Mr. Ajit Kumar Mittal : Executive Director, Ex-Reserve Bank of India
• Mr. Sachin Chaudhary : Chief Operating Officer
Board of Directors with pre-eminence and experience in diverse fields
63

Rating Agency Long Term Credit Rating
CRISIL [an S&P Global Company] AAA
ICRA [a Moody’s Investors Service Company] AAA
CARE Ratings AAA
Brickwork Ratings AAA
Credit Ratings and Auditors
64
Auditors
Statutory Auditor S R Batliboi & Co. [Indian Member firm of Ernst & Young]
Internal Auditor Grant Thornton
Stock Auditor for Lenders Deloitte Haskins & Sells LLP

Productivity Ratios
FY 2011 FY 2012 FY 2013 FY 2014 FY 2015 FY 2016 FY 2017 FY 2018 FY 2019
No. of Employees
4,512 4,243 4,072 4,099 4,840 5,453 6,388 8,111 8,676
Profit per employee [₹ Cr]
0.17 0.24 0.31 0.38 0.39 0.43 0.46 0.47 0.47
Asset per employee [₹ Cr]
3.71 5.85 8.09 10.84 11.82 14.02 16.23 16.26 15.00
Cost-to-Income Ratio
21.0% 18.7% 18.0% 17.1% 16.4% 14.3% 13.3% 12.5% 12.7%
65

Key Financial Metrics
66
# Adjusted for mutual fund investments
FY 2011 FY 2012 FY 2013 FY 2014 FY 2015 FY 2016 FY 2017 FY 2018 FY 2019
Pre Tax RoAA [%]
5.5% 4.9% 4.9% 4.8% 4.9% 4.9% 4.6% 4.3% 4.2%
Post Tax RoAA [%]
4.1% 3.7% 3.8% 3.8% 3.7% 3.7% 3.6% 3.3% 3.0%
RoE [%] 17.2% 22% 26% 27% 29% 26% 26% 30% 24%
Capital Adequacy [%]#
23.87% 19.96% 18.58% 20.47% 19.60% 23.38% 20.91% 20.82% 26.49%
- Tier I# 23.63% 19.27% 15.05% 16.10% 16.28% 20.36% 17.25% 15.07% 19.81%
- Tier II# 0.24% 0.69 % 3.53% 4.37% 3.32% 3.02% 3.66% 5.76% 6.68%
RoAA: Return on Average Assets RoE: Return on Equity

67
Valuations and Returns
Mar-11 Mar-12 Mar-13 Mar-14 Mar-15 Mar-16 Mar-17 Mar-18 Mar-19 Jun-19
Market Price per Share [₹]
155 207 272 286 558 674 998 1,194 744 476*
Dividend per Share [₹] 10 13 20 29 35 36 36 42 40 8
Dividend Yield [%] 6.5% 6.3% 7.4% 10.2% 6.3% 5.3% 3.6% 3.5% 5.4% 6.7%
Market Capitalisation [₹ ‘000 Cr]
4.8 6.5 8.5 9.5 19.8 28.4 42.3 50.9 31.8 20.4
Price-to-Book [times] 1.1 1.3 1.6 1.7 3.0 2.7 3.4 3.3 1.7 1.1
PE Ratio [times] 6.5 6.5 6.8 6.0 10.2 11.3 14.5 13.2 7.8 6.4
Foreign Institutional Shareholding [%]
43.5% 38.7% 45.2% 41.1% 51.8% 58.9% 63.6% 53.9% 56.5% 52.7%
Domestic Institutional Shareholding [%]
3.3% 2.4% 3.6% 3.4% 3.3% 2.7% 4.8% 14.3% 13.0% 13.2%
*As on 5th Aug, 2019 PE: Price to Earnings [12 months trailing]
IBH is a part of Nifty 50, MSCI India and FTSE4Good indices

Shareholding Pattern
68 MF: Mutual Funds; IFI: Indian Financial Institutions
21.5%
52.7%
13.2%
12.6%
Founder Foreign Institutional Shareholding MFs/Banks/IFI Public
As on 30th June, 2019

69
Detailed Financials

70
Consolidated Balance Sheet
The company had cash, cash equivalents and investments in liquid debt instruments of ₹ 28,511 Cr as at 30th Jun, 2019. The company receives income from its cash, cash equivalents and investments in liquid debt instruments through the quarter, most of which appears in ‘Other Income’
Amount in ₹ Cr
Current Account Balance & Fixed Deposits
11,836
AMC Investments 6,872
Investment in Bank CDs 5,023
Liquid Quasi-Sovereign Bonds 3,581
Highly Rated Liquid Corporate Bonds 911
Highly Rated Commercial Paper 288
Total Cash and Cash Equivalents 28,511
Consolidated Income Statement
71
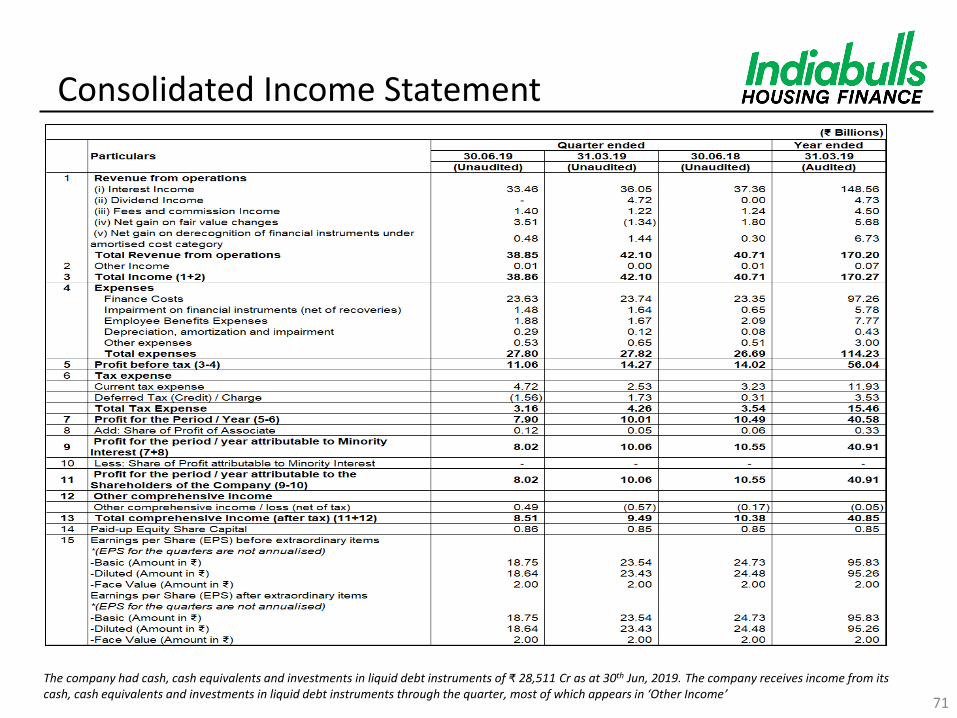
The company had cash, cash equivalents and investments in liquid debt instruments of ₹ 28,511 Cr as at 30th Jun, 2019. The company receives income from its cash, cash equivalents and investments in liquid debt instruments through the quarter, most of which appears in ‘Other Income’

Update on OakNorth Bank
• In Q1 CY19, OakNorth closed equity round with total capital raise of £335 Mn ($440 Mn), in primary from Softbank and £35 Mn ($45 Mn) in secondary from Clermont
• IBHFL’s share of ~15.24%* is now valued at $401 Mn (IBHFL realised $117 Mn in Nov-17 through a part sale of its shareholding) multiplying the investment 5.0x in 3 years (IBHFL bought 40% stake in OakNorth Bank for $100 Mn in Nov-15)
• Within four years of operations OakNorth Bank’s deposits have risen to $1,990 Mn, lending facilities to $3,535 Mn and loan assets stand at $2,149 Mn
• The loan book has a gross yield of 8.1%, cost of funds of 1.9% and NIM of 6.0%
72
22 464
908
1,990
Jun-16 Jun-17 Jun-18 Jun-19
Deposits [$ Mn]
*on a fully diluted basis (excluding A shares) as at 30th Jun-19, based on closings till date
136 722
1,706
3,535
Jun-16 Jun-17 Jun-18 Jun-19
Lending Facilities [$ Mn]

This document contains certain forward-looking statements based on current expectations of Indiabulls Housing Finance Ltd.’s [CIN: L65922DL2005PLC136029] management. Actual results may vary significantly from the forward-looking statements in this document due to various risks and uncertainties. These risks and uncertainties include the effect of economic and political conditions in India, and outside India; volatility in interest rates and in the securities markets; new regulations and accounting standards, and government policies that might impact the business of Indiabulls Housing Finance Ltd.; the general state of the Indian economy; and the management’s ability to implement the company’s strategy. Indiabulls Housing Finance Ltd. doesn’t undertake any obligation to update these forward-looking statements. Some numbers in the document, especially regulatory reporting numbers, may be for the standalone entity, while other numbers may be at the consolidated level. Some numbers are at the end of the reporting quarter, while others may be as on date of the document. It may also be noted that Indian Accounting Standards [IndAS] have been adopted with effect from April 1, 2017. Thus all restated numbers in this document pertaining to period from March 31, 2017 are unaudited. There is a possibility that these financial results for the current and previous periods may require adjustments due to changes in financial reporting requirements arising from new standards, modifications to the existing standards, guidelines issued by Ministry of Corporate Affairs and NHB / RBI or changes in the use of one or more optional assumptions from full retrospective application of certain Ind AS permitted under Ind AS 101.
This document does not constitute an offer or recommendation to buy or sell any securities of Indiabulls Housing Finance Ltd. or any of its subsidiaries or associate companies. This document also doesn’t constitute an offer or recommendation to buy or sell any financial products offered by Indiabulls Housing Finance Ltd.
Investor Contact Media Contact
Ramnath Shenoy Rahat Ahmed
[email protected] [email protected]
+91 22 6189 1444 +91 22 6189 1155
73
Safe Harbour Statement

Thank you