Embed Size (px)
Citation preview

Pilot’s GuideEngine Data Management
EDM-900
Copyright 2003 J.P. Instruments, Inc.
All Rights Reserved
J . P . I N S T R U M E N T S I N C .J . P . I N S T R U M E N T S I N C .
Information: P. O. Box 7033Huntington Beach, CA 92646
Factory: 3185 B AirwayCosta Mesa, CA 92626
(714) 557-5434 Fax (714) 557-9840
www.jpinstruments.com
(PG EDM-900H.doc)
Printed in the United States of America Rev A 5/2003

Table of Contents
Section 1 - Introduction 1Product Features Chart 1
Section 2 - Getting Started 2Fueling the Aircraft 2Display Screen 2RPM and MAP Section Display 3Bar Graphs Section Display 3Basic Scanner Operation 4
Section 3 - Interpreting Data 6Operation for each Phase of Flight 6Typical Normal Measurements 9Engine Diagnosis Chart 10
Section 4 - LeanFind 12LeanFind Mode—Leaning "Rich of Peak" Method 12LeanFind Procedure—Detailed Explanation 15Lean Find Mode—"Lean of Peak" Method, GAMI injectors 17Turbocharged Engines 18
Section 5 - Alarms 18Alarm Priority 19Pre-Ignition and Detonation 20
Section 6 - Displays and Controls 20RPM and MAP Displays 20Scanner Displays 21Bar Graph Displays 24Buttons 25
Section 7 - Operation 27Modes 27Automatic Mode 27Manual Mode 28LeanFind Mode 28
Section 8 - Fuel Flow Features 28Fuel Management 30Measurement Scan 30
Section 9 - Memory and Data Download 31Downloading data to the Palm handheld 32Transferring Data from the EDM-900 to the Palm Handheld 33Transferring Data from the EDM-900 to a Laptop PC 35
Section 10 - First Time Setup and Customization 36Factory Program Submenus 39

Customizing the Bar Graph Display 51Programming Alarm Limits 51
Section 11 - Troubleshooting the EDM 52Common Misapplications 52Diagnostic Testing on Startup and During Flight 53Diagnostic Messages 53
Section 12 - Appendices 55Features and Benefits 55Shock Cooling 58Navigation Data Formats 58Connector Pin Assignments 59Navigation Data Ports for GPS Comm 60
Section 13 - Technical Support 61Limited Warranty 61Index 62

47
37
26.0
NRM
ALERT F
F
F
230023.5
F
1 2 3 4 5 6 T
I 80 42
25.3 32.3
I 2.3 27.4
57
I340 370
O-P
R P M
MAP
%HP
E-
F-
E-
F-
EGT CHT
JJPPIIEDM 900
450
350
250
----
----
°F
In Hg O-T F-P
VDC AMPS OAT
LEFT RIGHTFLWGALLONS
FUELSTEP LF GMT EGT/FF
GPH
1650-

Section 1 - Introduction
Product Features Chart
Hands-free, automatic scanningAll programming done from the Front PanelLeanFind finds the first and last cylinder to peak with true peak detect—eliminates false peaksDisplays both leaned temperature below peak and peakBattery voltage with alarmAmperes (load or charge/discharge meter)Programmable alarm limitsNormalize viewExhaust Gas Temperatures (EGTs) to stable 1°F resolutionDIF low to high EGT with alarmShock cooling monitored on every cylinderUser selectable scan indexing rateFast response probesNon-volatile long term memory
Records and stores data up to 30 hoursPost-flight data retrievalDownload to Palm™ ComputerData retrieval software
Oil pressureOil temperatureTurbine inlet temperature (optional)Outside air temperatureCompressor discharge temperature (optional)Carburetor temperature or induction temperature (optional)Fuel pressure (optional)Fuel levelFuel Flow
Solid-state rotor fuel flow transducerFuel quantity in gallons, kilograms, liters, or poundsLow fuel quantity alarmLow fuel time alarmGPS interfaceInstantaneous fuel flow rateTotal amount of fuel consumedTotal fuel remaining
Page 2 Engine Data Management
Time to empty at the current fuel flow rateRPM and manifold pressureAutomatically calculates percent horsepowerHistory of extreme values during previous flightHobbs® timer
Section 2 - Getting Started
This is a summary of the basic operation. The last two pages of thismanual are a Quick Reference Guide describing how to perform the mostcommonly used functions. Detailed descriptions of all operations appearlater in this Pilot’s Guide.
To change the factory settings of your EDM-900 for first time use, seeSection 10 - First Time Setup and Customization on page 36. You willwant to do this to change the fuel tank capacity, K-factor, alarm limits,display indexing rate, or other custom settings.
The word tap is used to denote pressing a button momentarily. The wordhold is used to denote pressing and holding a button for five secondsor longer.
Fueling the Aircraft
1. At power up you will see FILL? N. Tap LF to see FILL 75 (or whateverthe capacity of your tanks or tabs are).
2. With auxiliary tanks or tabs, tap LF again to see FILL I20 (orwhatever the capacity of your tanks-plus-auxiliary or full tanks are).
3. Tap STEP to accept the displayed value and exit.
See page 28 for a more detailed description.
The EGT/FF button selects which measurements are displayed duringscan: EGT (temperatures, voltage), ALL measurements, or FF (fuel flowrelated).
Display Screen
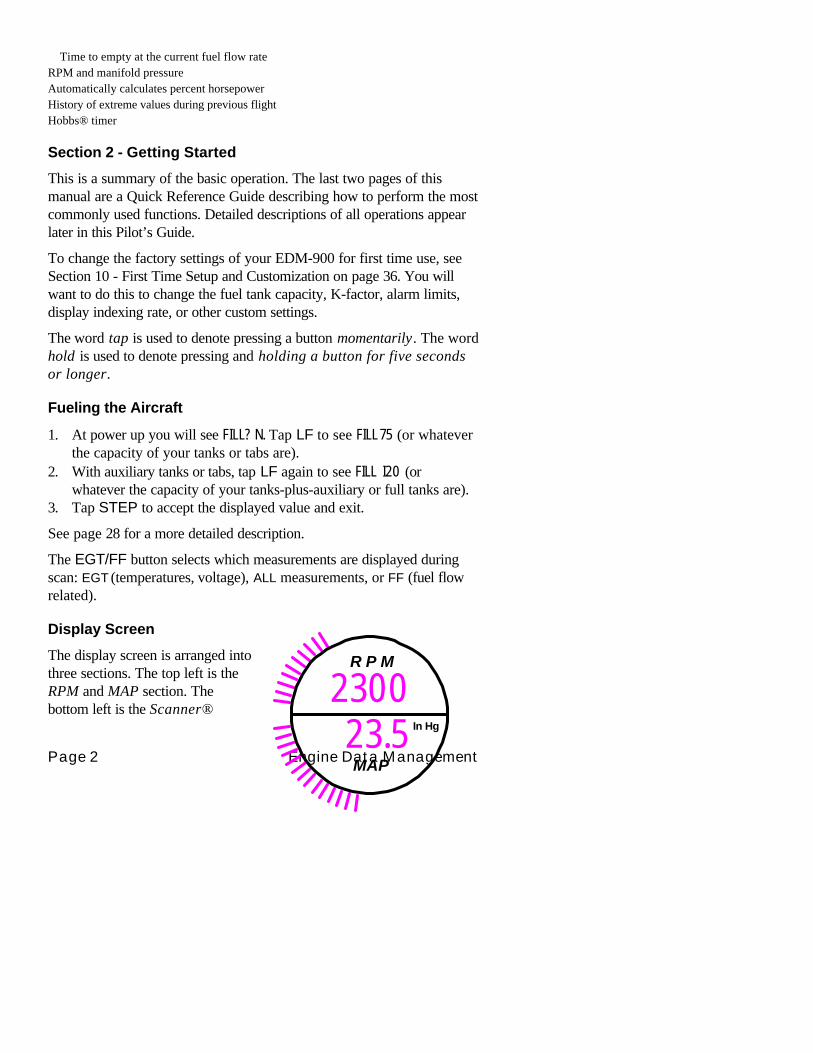
The display screen is arranged intothree sections. The top left is theRPM and MAP section. Thebottom left is the Scanner®
R P M
MAP
230023.5 In Hg

For Your Safe Flight Page 3
section. And the right side is the Bar Graphs section.
RPM and MAP Section Display
The upper semicircular bar graph shows the RPM (Revolutions perMinute) and the lower semicircular bar graph shows the MAP (ManifoldPressure). These are shown both graphically and digitally. Power settingsentering red line are displayed by flashing the ALERT icon and flashing amessage on the bottom left scanner section of the screen.
Percent horsepower is displayed digitally underneath the MAP arc.
Bar Graphs Section Display
The Bar Graphs section containsnine dedicated 12 segment bargraphs with digital display. Thedefault displays are (left to right,top to bottom):
• Oil temperature
• Oil pressure
• Fuel pressure
• Bus voltage
• Amps load or charge/discharge
• Outside air temperature (orowner selectable *)
• Fuel flow, units per hour
• Left fuel quantity (or ownerselectable *)
• Right fuel quantity (or ownerselectable *)
* A interchangeable screen overlay isprovided with no labels for where the OAT and left and right fuel levels are. These 3graphs can be customized. See Customizing the Bar Graph Display on page 51.
47
37
26.0
F
F
I 80 42
25.3 32.3
I 2.3 27.4
O-P
E-
F-
E-
F-
O-T F-P
VDC AMPS OAT
LEFT RIGHTFLWGALLONS
FUEL
GPH
Page 4 Engine Data Management
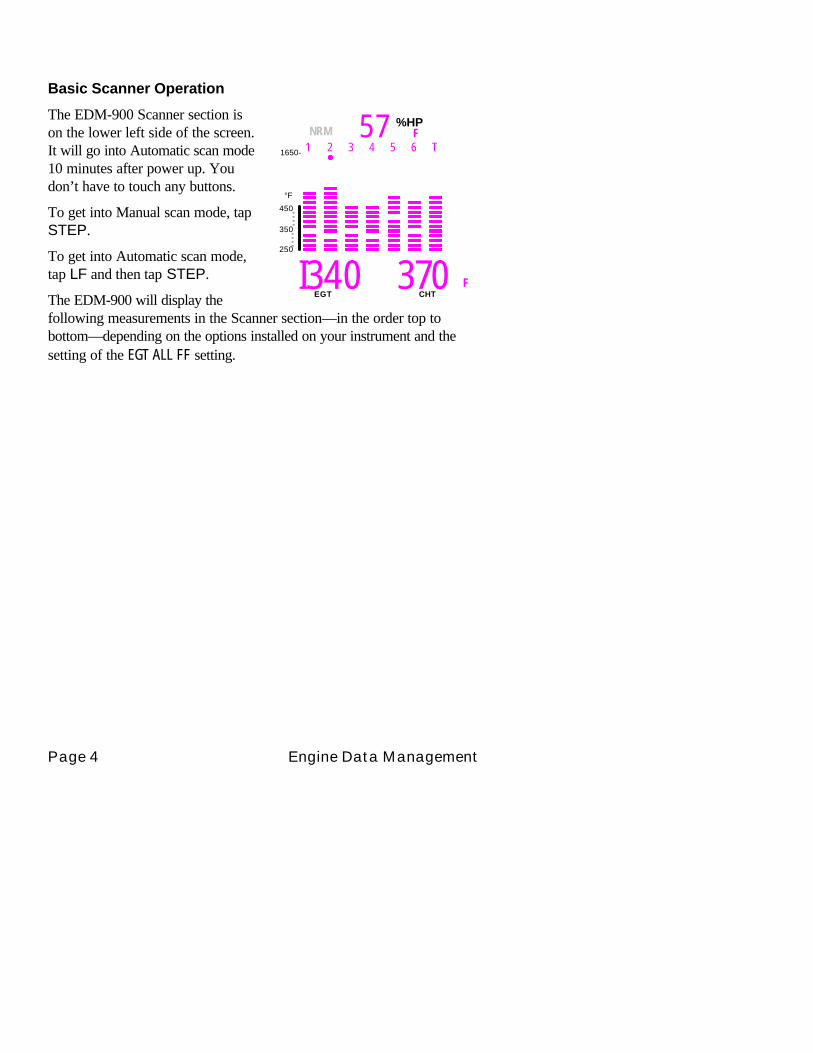
Basic Scanner Operation
The EDM-900 Scanner section ison the lower left side of the screen.It will go into Automatic scan mode10 minutes after power up. Youdon’t have to touch any buttons.
To get into Manual scan mode, tapSTEP.
To get into Automatic scan mode,tap LF and then tap STEP.
The EDM-900 will display thefollowing measurements in the Scanner section—in the order top tobottom—depending on the options installed on your instrument and thesetting of the EGT ALL FF setting.
NRM F1 2 3 4 5 6 T
57 %HP
1650-
FI340 370EGT CHT
450
350
250
----
----
°F

For Your Safe Flight Page 5
E G TE G T A L LA L L F FF F Display Discriptionx x I340 376 EGT left, CHT rightx x I370 T I T Turbine Inlet Temperaturex x -30 CLD Rate of shock coolingx x I4.2 BAT Avionics bus voltagex x 8 I OAT Outside air temperature optionx x 300 CDT Compressor discharge optionx x I 25 I AT Induction air optionx x I32 C- I Compressor minus induction differencex x -22 CRB Carburetor optionx x 80 DIF Difference between hottest and coldest EGT
x x 37.2 REM Fuel remainingx x 25.9 REQ Fuel required to wpt (GPS connected)x x I I.3 RES Fuel reserve at wpt (GPS connected)x x I 3.0 MPG Miles per gallon (GPS connected)x x 02.45 H.M Fuel time to emptyx x I3.5 GPH Gallons per hourx x 38 USD Fuel used since fill or reset
EGTEGT is shown on the first four or six Scanner bar graph columns. Theseare labeled 1 through 4 or 1 through 6 above the columns. The lower limitof the graph range represents half of the TIT alarm red line (default is825°F) and the top of the range represents alarm red line (default1650°F). The numerical value of the EGT is shown on the left side of thedigital display for each cylinder when there is a dot under one of thecylinder numbers above the column—cylinder 2 in this example.
There are two views: Normalize view levels the EGT columns andincreases the sensitivity of the Scanner bar graph columns to 10° persegment. To enter the Normalize view, hold the LeanFind button forthree seconds. The NRM icon will be displayed above the Scannersection. Hold the LeanFind button for three seconds to return to thePercentage view. See page 21 for a more detailed description.
CHTThe Cylinder Head Temperature—CHT—is represented by a missingsegment in the Scanner bar graph column. If the EGT is too low for thereto be a missing segment, the CHT is represented by a lone segment inthat column. The scale is shown to the left side of the columns. The
Page 6 Engine Data Management
numerical value of the CHT is shown on the right side of the digitaldisplay for each cylinder when there is a dot under one of the cylindernumbers above the column.
TIT displayIf you have TIT, it will be shown on the right-most Scanner bar graphcolumn and will be labeled with a T above it.
LeanFindSimply pre-lean, tap the LF button and begin leaning. The EDM-900 willassist you in finding the first cylinder to peak. See page 12 for a moredetailed description of leaning.
1. Establish cruise at approximately 65 to 75% power.
2. Pre-lean the mixture to 50°F estimated rich of peak EGT on anycylinder.
3. Wait about 30 to 60 seconds.
4. Tap the LF button.
5. Lean the mixture aggressively—approx. 10°/second withoutstopping—while observing the display. When there is a 25°F rise inEGT, LeanFind mode becomes active, indicated by the dot flashingabove the hottest EGT column.
6. Stop leaning when a column begins flashing. You will see LEANEST fortwo seconds, followed by—for example— I520 I3.8. The left numberis the current temperature of the first EGT to peak and the rightnumber is the current fuel flow.
7. If you hold LF, peak EGT will be displayed while the LF button isheld down. Release the button for the next step.
8. Slowly enrich the mixture. The temperature will increase, returning topeak. Stop enriching at the desired EGT.
Section 3 - Interpreting Data
Operation for each Phase of Flight
Engine Run-Up (you can add this to your run-up checklist.)
For Your Safe Flight Page 7
Suggested setup:• Set engine to runup RPM• Normalize view• Manual mode
Verify:• uniform rise of about 50°F in all EGTs in single magneto operation.• uniform rise of EGTs with application of the mixture control.
Be alert for:• unusually low voltage (less than nominal battery voltage)• cold OIL and normal oil pressure• abnormally high CHT• large drop in EGT on one cylinder in single magneto operation—may be fouled
spark plug.

Page 8 Engine Data Management
Take-Off, Climb, and Full Throttle OperationsSuggested setup:
• Percentage view• Automatic mode
Verify:• EGTs and CHTs consistent with past climbs. EGTs should be in the 1100 to
1300°F range (100° to 300°F cooler than cruise) due to fuel cooling.
Be alert for:• high EGT in one cylinder, 300°F above the others may indicate plugged injector
or leaking manifold gasket on a carbureted engine.• If all EGT columns go off scale to the top of the column, be sure you are not in
Normalize view, as indicated by the symbol NRM to the left of the horsepowerdisplay.
At high density altitude an overly rich mixture can significantly reduce engine power.
CruiseAfter the engine is warmed up, use LeanFind to lean the mixture.
Suggested setup:• Normalize view• Automatic mode
Be alert for:• uneven EGTs (injected engines). Make fine adjustments to throttle, then RPM,
then mixture to level the display columns.• abnormal patterns of EGTs and CHT. (see “Engine Diagnosis Chart” on page
10).
DescentSuggested setup:
• Percentage view• Manual mode
Be alert for:• CLD: shock cooling alarm is set to -60°F. Average cool rates of -40°F/minute to
–60°F/minute are normal, depending on the engine size.
For Your Safe Flight Page 9
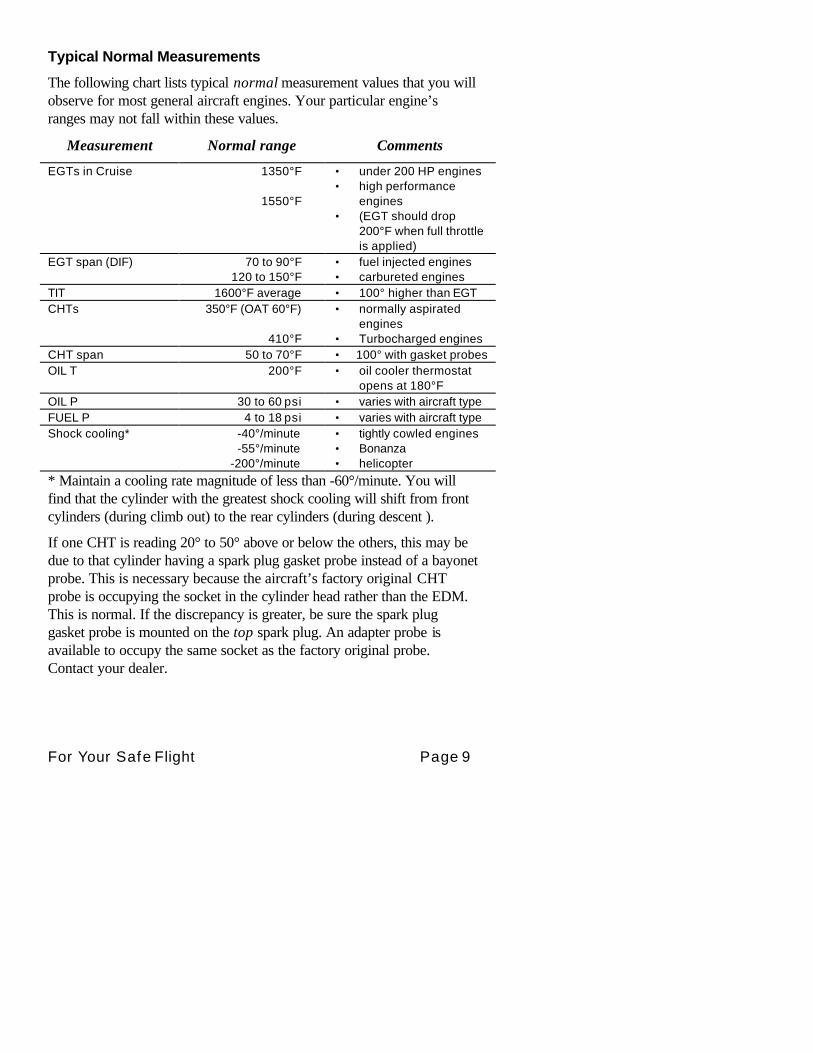
Typical Normal Measurements
The following chart lists typical normal measurement values that you willobserve for most general aircraft engines. Your particular engine’sranges may not fall within these values.
Measurement Normal range Comments
EGTs in Cruise 1350°F
1550°F
• under 200 HP engines• high performance
engines• (EGT should drop
200°F when full throttleis applied)
EGT span (DIF) 70 to 90°F120 to 150°F
• fuel injected engines• carbureted engines
TIT 1600°F average • 100° higher than EGTCHTs 350°F (OAT 60°F)
410°F
• normally aspiratedengines
• Turbocharged enginesCHT span 50 to 70°F • 100° with gasket probesOIL T 200°F • oil cooler thermostat
opens at 180°FOIL P 30 to 60 psi • varies with aircraft typeFUEL P 4 to 18 psi • varies with aircraft typeShock cooling* -40°/minute
-55°/minute-200°/minute
• tightly cowled engines• Bonanza• helicopter
* Maintain a cooling rate magnitude of less than -60°/minute. You willfind that the cylinder with the greatest shock cooling will shift from frontcylinders (during climb out) to the rear cylinders (during descent ).
If one CHT is reading 20° to 50° above or below the others, this may bedue to that cylinder having a spark plug gasket probe instead of a bayonetprobe. This is necessary because the aircraft’s factory original CHTprobe is occupying the socket in the cylinder head rather than the EDM.This is normal. If the discrepancy is greater, be sure the spark pluggasket probe is mounted on the top spark plug. An adapter probe isavailable to occupy the same socket as the factory original probe.Contact your dealer.

Page 10 Engine Data Management
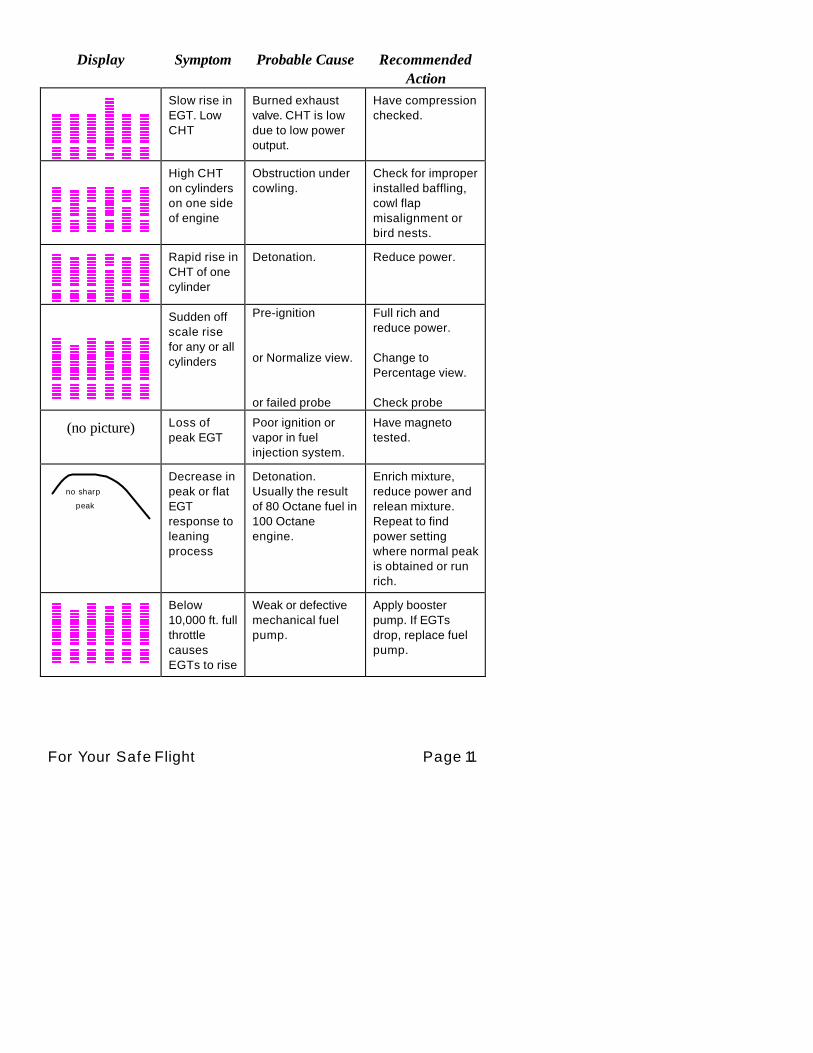
Engine Diagnosis Chart
The following chart will help you diagnose engine problems in your aircraft. Views arePercentage views.
Display Symptom Probable Cause Recommended Action
75° to 100°EGT rise forone cylinderduring flight
Spark plug notfiring due tofouling, faulty plug,wire or distributor.
Enrich mixture toreturn EGT tonormal. Have plugschecked.
EGT Increaseor decreaseafter ignitionsystemmaintenance
Improper timing:high EGT →retarded ignition;low EGT →advanced ignition.
Check EGT for eachmagneto todetermine anyuneven timing.
Loss of EGTfor onecylinder.Engine rough
Stuck valve. Othercylinders are okay.
Have valve trainchecked.
Loss of EGTfor onecylinder; nodigital EGT
Failed probeorfailed wireharness.
Swap probes todetermine if probeor wire harness isbad.
Decrease inEGT for onecylinder
Intake valve notopening fully; faultyvalve lifter.
Have valve lifter orrocker arm checked.
Increase inDIF at lowRPM
Low compression(blow by) incylinder
Checkcompression.
EGT and CHTnot uniform
Dirty fuel injectorsor fouled plugs.
Check injectors andplugs. Non-uniformity is normalfor carburetedengines
Decrease inEGT for allcylinders
Decrease in airflowinto the inductionsystem. Carb orinduction ice.
Check for change inmanifold pressure.
For Your Safe Flight Page 11
Display Symptom Probable Cause RecommendedAction
Slow rise inEGT. LowCHT
Burned exhaustvalve. CHT is lowdue to low poweroutput.
Have compressionchecked.
High CHTon cylinderson one sideof engine
Obstruction undercowling.
Check for improperinstalled baffling,cowl flapmisalignment orbird nests.
Rapid rise inCHT of onecylinder
Detonation. Reduce power.
Sudden offscale risefor any or allcylinders
Pre-ignition
or Normalize view.
or failed probe
Full rich andreduce power.
Change toPercentage view.
Check probe
(no picture) Loss ofpeak EGT
Poor ignition orvapor in fuelinjection system.
Have magnetotested.
no sharp
peak
Decrease inpeak or flatEGTresponse toleaningprocess
Detonation.Usually the resultof 80 Octane fuel in100 Octaneengine.
Enrich mixture,reduce power andrelean mixture.Repeat to findpower settingwhere normal peakis obtained or runrich.
Below10,000 ft. fullthrottlecausesEGTs to rise
Weak or defectivemechanical fuelpump.
Apply boosterpump. If EGTsdrop, replace fuelpump.
Page 12 Engine Data Management
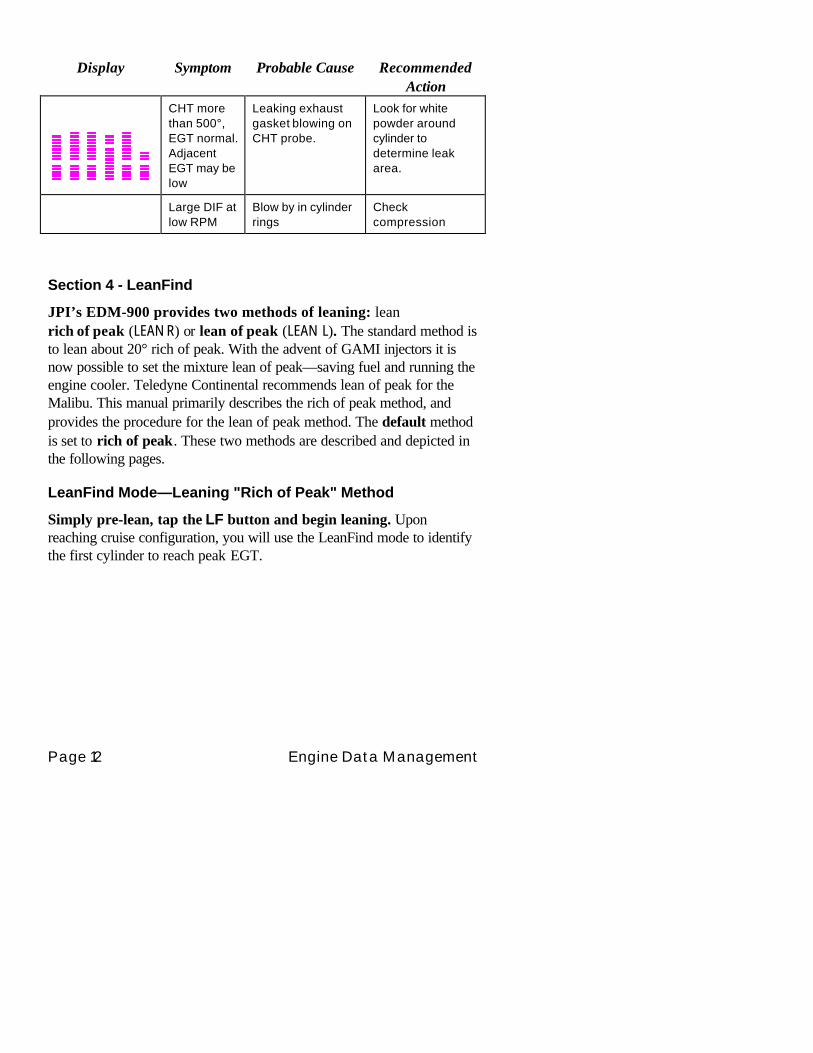
Display Symptom Probable Cause RecommendedAction
CHT morethan 500°,EGT normal.AdjacentEGT may below
Leaking exhaustgasket blowing onCHT probe.
Look for whitepowder aroundcylinder todetermine leakarea.
Large DIF atlow RPM
Blow by in cylinderrings
Checkcompression
Section 4 - LeanFind
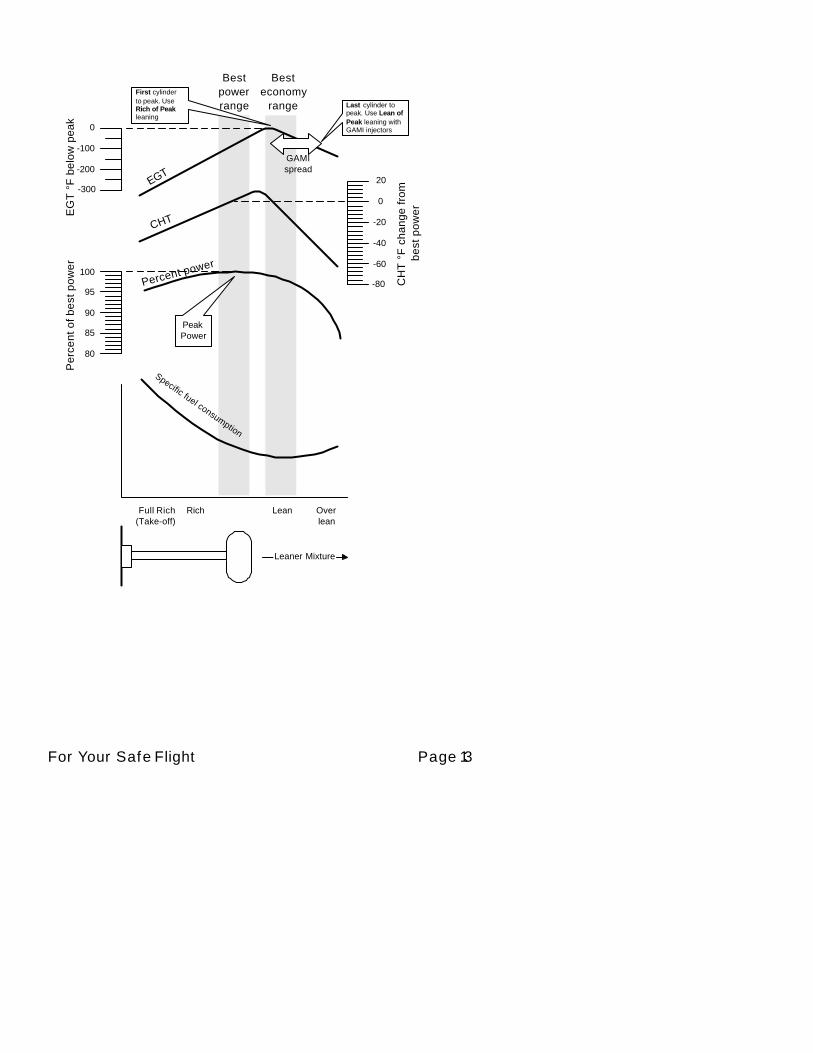
JPI’s EDM-900 provides two methods of leaning: leanrich of peak (LEAN R) or lean of peak (LEAN L). The standard method isto lean about 20° rich of peak. With the advent of GAMI injectors it isnow possible to set the mixture lean of peak—saving fuel and running theengine cooler. Teledyne Continental recommends lean of peak for theMalibu. This manual primarily describes the rich of peak method, andprovides the procedure for the lean of peak method. The default methodis set to rich of peak. These two methods are described and depicted inthe following pages.
LeanFind Mode—Leaning "Rich of Peak" Method
Simply pre-lean, tap the LF button and begin leaning. Uponreaching cruise configuration, you will use the LeanFind mode to identifythe first cylinder to reach peak EGT.
For Your Safe Flight Page 13
EG
T °F
bel
ow p
eak
Per
cent
of b
est p
ower
CH
T °F
cha
nge
from
best
pow
er
Besteconomy
range
Bestpowerrange
0
-200
-100
-300
-20
20
-60
-40
0
-80100
85
90
95
80
EGT
CHT
Percent power
Specific fuel consumption
Overlean
LeanRichFull Rich(Take-off)
Leaner Mixture
PeakPower
First cylinderto peak. UseRich of Peakleaning
Last cylinder topeak. Use Lean ofPeak leaning withGAMI injectors
GAMIspread

Page 14 Engine Data Management
LeanFind Procedure—Step-by-Step
Procedure Example Comments1 Establish cruise at approx.
65 to 75% power.2 Pre-lean the mixture to 50°F
estimated rich of peak EGTon any cylinder: _____°
I490 370 *For your first flight with theEDM, use the method shownbelow.
3 Wait one minute Let engine stabilize.
4 Tap the LF button LEAN R Start LeanFind. (Optionally,after starting Leanfind, tochange to “lean of peak”method, hold both STEP andLF simultaneously.)
5 Lean the mixture—approx.10°/second withoutpausing—while observingthe display. When there is a15°F rise in EGT, LeanFindmode becomes active.
I520 I3.8 Flashing cylinder DOTindicates hottest cylinder andthat LeanFind mode is active.
6 Stop leaning whena column begins flashing.You will see LEANEST for twoseconds, followed by:
I545 I 2.4
Flashing cylinder dot &column indicates leanestcylinder. Due to thermalinertia this will usually beabout -15°F lean of peak.
7 If you hold LF, peak EGT willbe displayed while the LFbutton is held down.
I560 I 2.4 Captured peak EGT value isdisplayed.
8 Slowly enrich the mixture.The temperature willincrease, returning to peak.Stop enriching at the desiredEGT.
Best economy
Best power
I560 I 3.8
I560 I 3.8I460 I4.2
• Peak EGT for besteconomy
• 100° rich of peak for bestpower
Bestpower
Temperature whencolumn flashes
best economy
leanerricher
9 If you have chosen the Leanof Peak method, at step 5continue leaning until the lastcylinder has peaked. Seepage 17 for Lean of Peak.
-I5 I2.3 Only for GAMI injectedengines. When each cylinderreaches peak, the cylindernumber will begin flashing.
For Your Safe Flight Page 15
*Determining the pre-lean value: while in cruise at under 65 percentpower, choose any cylinder and lean that cylinder to peak EGT in theManual mode or to engine roughness, whichever occurs first. Note thepeak, subtract 50° and write the resulting number in the space provided instep 2.
LeanFind Procedure—Detailed Explanation
Lycoming and Continental engines have established specificrestrictions on leaning that must be followed, such aspercentage of power, climb leaning, and TIT limits. Lycomingrecommends operation at peak EGT for power settings of 75%or lower, while Continental recommends operation at peakEGT for power settings of 65% or lower. This guide is notmeant to supersede any specific recommendations of theengine manufacturer or airframe manufacturer.
It is your responsibility to know your aircraft’s limitations.
Pre-lean the mixture to about 50° below peak. After pre-leaning, wait forone minute for the temperatures to stabilize. Next, begin the leaningprocess by tapping the LF button. This tells the EDM-900 to begin lookingfor a 15° rise in EGT for any cylinder. Begin leaning the mixture withoutpausing. When a 15° rise occurs, eliminating false peaks, the LeanFindmode becomes activated shown when the cylinder dot above the columnof the hottest cylinder begins flashing. The LeanFind mode is notactive until a cylinder dot is blinking.
You will see numerical fuel flow rate during the leaning process on theright side of the Scanner digital display, for example I2.4. This allows youto observe the EGT rise and at the same time watch the fuel flow ratedecrease.
To show the progress of the leaning process, the EDM-900 selects thehottest cylinder for reference in the digital display. In the example below,the I340 is the current temperature of the hottest cylinder.

Page 16 Engine Data Management
Continue leaning slowly without stopping. With a vernier mixturecontrol, turn the knob about a quarter turn every second. With a non-vernier or quadrant mixture control, lean slowly and smoothly about 1/16inch every five seconds. Eventually, one cylinder will reach peak beforeany of the other cylinders. The EDM-900 will determine thisautomatically. Notice that this cylinder is not necessarily the hottest.
The EDM-900 will indicate success in finding a peak by displaying thewords LEANEST for two seconds, followed by flashing the column anddisplaying the value of the EGT of the cylinder that peaked first. Thecurrent fuel flow rate will be displayed on the right side of the digitaldisplay. The flashing cylinder will be locked—or set—into the digitaldisplay during the remainder of the LeanFind procedure to allow you toset the final mixture. The peak EGT value is remembered by the EDM-900 and will be displayed as long as you hold the LF button.
You may now enrichen the mixture to operate at peak or continueenriching to 100° rich of peak, or a value of your choice, consistent withthe procedures defined in your aircraft engine manual.
If you lean too much, the EGT will drop and the engine will be operatinglean of peak.
I360 I 6.2
1 2 3 4 5 6 T
dot of hottestcylinder flasheswhen EGT rises25°
dotindicateshottestcylinder
temperatureand fuel flowdisplayed
When LF is activated:

For Your Safe Flight Page 17
I340 I 6.2
1 2 3 4 5 6 T_
LEANESTLEANESTdisplayed fortwo secondsbelow bargraph whenpeak is found
Leaning Rich of Peak
250
350
450CHT
Cylindernumber of theLEANESTcylinderflashes
Dot indicatesLEANESTcylinder
Column of theLEANESTcylinderflashes
Lean Find Mode—"Lean of Peak" Method, GAMI injectors
To use the “lean of peak” method, tap LF and then immediately hold bothSTEP and LF until you see LEAN L. You may toggle back to LEAN R byholding both buttons again. Once you begin leaning (flashing dot) youcannot change leaning method. Upon power up, the EDM-900 alwaysdefaults to Rich of Peak mode.
250
350
450CHT
Leaning Lean of Peak
-5 7.3
7 37 3 HP
1 2 3 4 5 6 T
_
Cylinder numberflashes when thecylinder peaks
Temperaturebelow peak oflast cylinder topeak
Shortestcolumn isthe lastcylinder topeak
Current fuelflow rate
First cylinder topeak haslargest column
Hold LF to seepeaktemperature oflast cylinder topeak (e.g. I340)
Hold LF to seeGAMI spread(delta fuel flow)
Page 18 Engine Data Management
In the “lean of peak” method the columns will invert with the first topeak progressing down from the top of the display. The inverted columnscale is 5° per segment below peak. As you continue to lean past peakthe dot of the each successive cylinder will flash as it peaks. The peakswill be shown as an inverted Scanner bar graph column; when the lastcylinder peaks its column will flash. The analog display is an inverted bargraph showing where each cylinder peaked. When the LF button is heldthe display will show the delta fuel flow between the first and last to peak(GAMI Spread), as well as the richest peak EGT.
Turbocharged Engines
The leaning process for turbocharged engines is by reference to the firstcylinder or TIT to reach peak. However, the TIT factory red line maylimit the leaning process. TIT red line is generally 1650°F, and up to1750°F in some installations. In the LeanFind mode the T column—TIT—is included in the procedure. If during leaning the TIT exceeds redline by less than 100° for less than one minute, the LeanFind procedurewill continue to operate, allowing you to complete the leaning process.Otherwise the digital display will show, for example, I650 TIT and TIT willflash. You may notice that in some cases the TIT reads 100°F hotterthan the hottest EGT. This is caused by unburned fuel in the exhaustand igniting.
J P IJ P I Hastaloy-X-tip probes produces faster response and are moreaccurate than the massive factory installed probe. Therefore J P IJ P I probesmay read as much as 100°F higher than the factory installed probe.However, note that the engine was certified with the factory-installedprobe and gauge, and this gauge reading is the limiting factor whenadjusting your engine.
Section 5 - Alarms
The EDM-900 has programmable alarms. When a measurement fallsoutside of its normal limits, the ALERT icon will flash and the digitaldisplay will flash with the value and abbreviation of the alarming item. Ifthe condition triggering the alarm returns to within normal limits, theALERT icon and the display will stop flashing. The pressure alarms

For Your Safe Flight Page 19
become enabled when any EGT exceeds 500°F or the RPM exceeds theHobbs RPM enable value.
The DIF measurement is the difference between the hottest and coolestEGTs. DIF—or span—is the important measurement—and associatedalarm—for monitoring the EGTs. See “Factory Set Default Limits” onpage 51 for a list of the alarms and their factory default settings.
To disable alarm for 10 minutes: when an alarm is displayed, tappingthe STEP button will temporarily disable the alarm digital indication forthe next ten minutes.
To disable alarm for the remainder of the flight: when an alarm isdisplayed, holding the STEP button until the word OFF appears willdisable that alarm digital indication for the remainder of the flight, or untilthe unit is turned off and on again. See “Alarm Limits” on page 51.
Alarm Priority
If multiple alarms occur simultaneously, the higher priority alarm willtemporarily “mask” the lower priority alarm(s). When an alarm occurs,note the cause of the alarm and tap the STEP button to clear the alarmindication so that you will be notified of any other alarm that might haveoccurred. The alarm priorities are as follows:
Highest priority C H TC H T High CHTO I LO I L High OIL temperatureT I TT I T High TITO I LO I L Low OIL temperature
O - PO - P Low oil pressureO - PO - P High oil pressureC L DC L D Excessive CHT cooling rateD I FD I F Excessive EGT span
B A TB A T High battery voltageB A TB A T Low battery voltageM A PM A P Overboost Manifold pressure
L OL OF U E LF U E L
Low fuel quantity remaining
Lowest priority L OL OT I M ET I M E
Low fuel endurance remaining
Page 20 Engine Data Management
Pre-Ignition and Detonation
Combustion that is too rapid leads to detonation and possibly pre-ignition.Detonation is abnormally rapid combustion where the fuel-air mixtureexplodes instead of burning uniformly. It causes the EGT to decrease andthe CHT to increase, and can appear during the leaning process. Itoccurs under high compression from fuel with too low an octane rating, orfrom avgas contaminated by jet fuel. Fuel additives, such as lead, boostthe octane rating and slow down the combustion process, producing aneven pressure to the piston.
Pre-ignition is caused by hot spots in the cylinder. Ignition occurs priorto the spark plug firing. The EDM-900 depicts pre-ignition as a suddenred line of the EGT on the analog display. This may occur in one or morecylinders. The affected cylinder column(s) will flash while the digitaldisplay will show an EGT higher than 2000°F. At this temperature pre-ignition will destroy your engine in less than a minute unless youtake immediate corrective action.
Section 6 - Displays and Controls
The EDM-900 monitors engine temperatures and voltages, assists inadjusting the fuel/air mixture, and helps diagnose engine malfunctions.There are multiple components of the user interface:
• RPM and MAP display in the upper left corner of the display• Scanner® analog display including cylinder number and index dot in
the lower left corner of the display• Scanner digital display for numeric readouts and messages at the
bottom left• Bar graph displays on the right half of the display• Four front panel operating
buttons below the bottom of thedisplay.
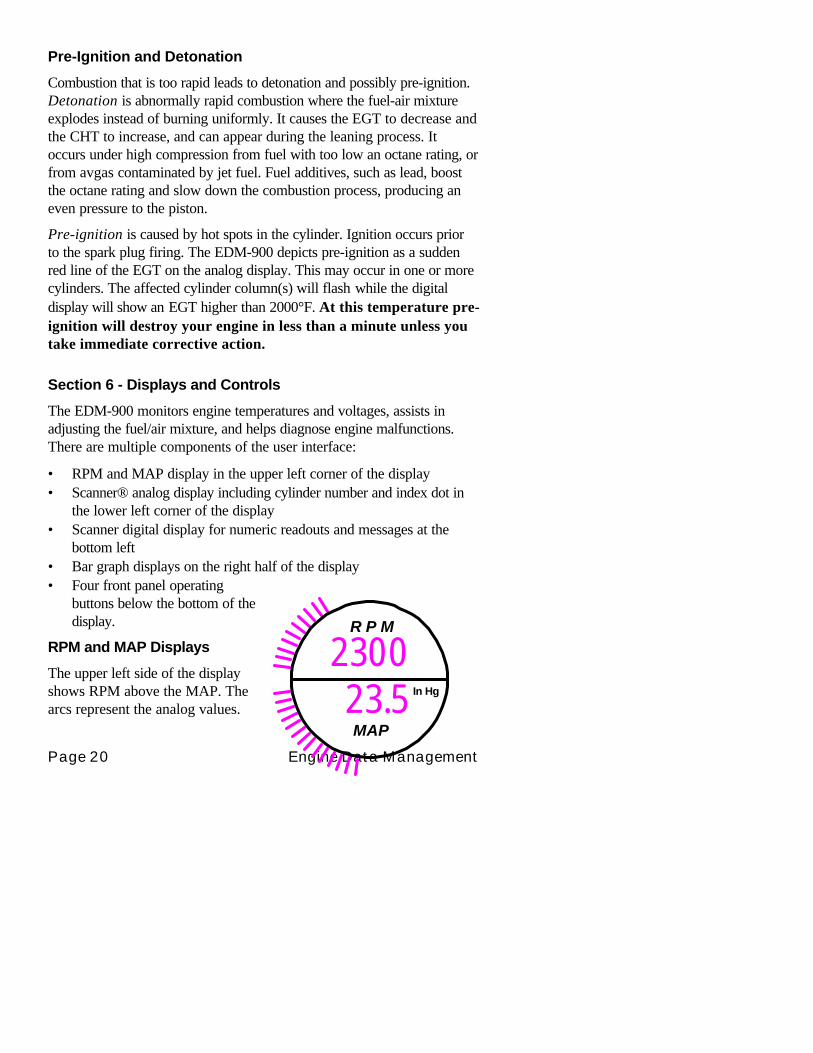
RPM and MAP Displays
The upper left side of the displayshows RPM above the MAP. Thearcs represent the analog values.
R P M
MAP
230023.5 In Hg
For Your Safe Flight Page 21
Below the arcs is shown the percent horsepower.
Scanner Displays
1 2 3 4 5 6 T
I340 I 6.2
57NRM
F
�
�
�
�
�
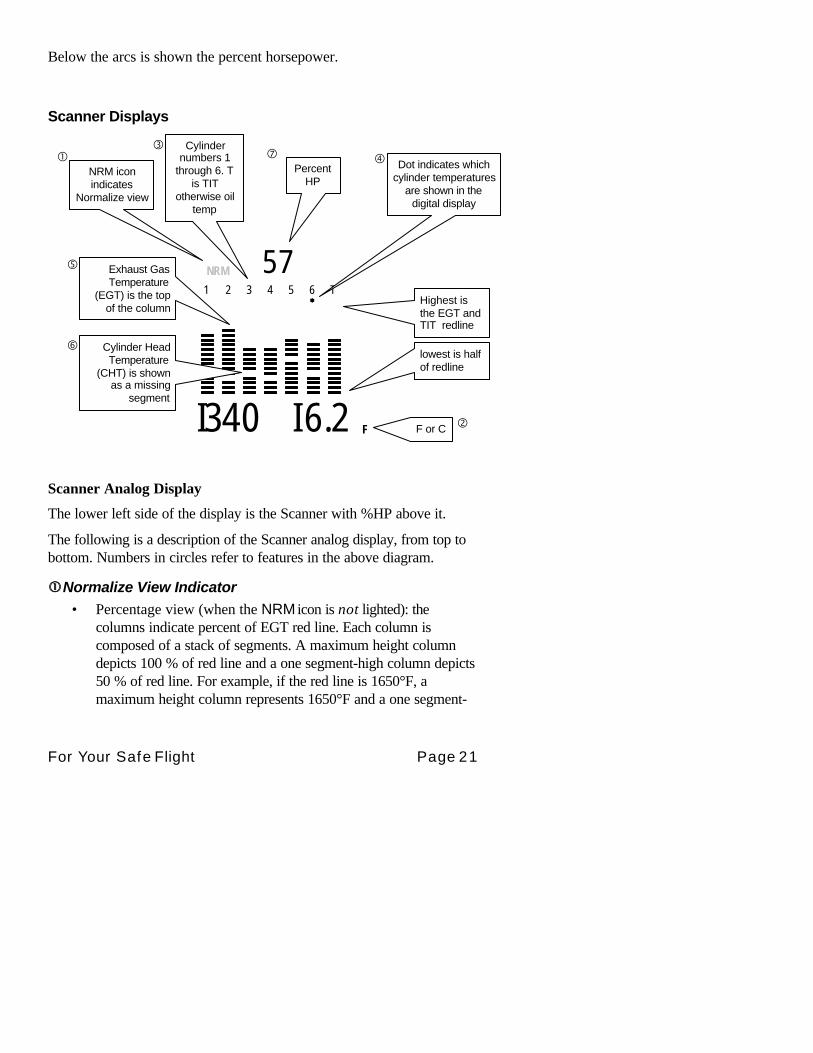
�NRM iconindicates
Normalize view
Cylindernumbers 1
through 6. Tis TIT
otherwise oiltemp
Exhaust GasTemperature
(EGT) is the topof the column
PercentHP
Dot indicates whichcylinder temperatures
are shown in thedigital display
Cylinder HeadTemperature
(CHT) is shownas a missing
segment
Highest isthe EGT andTIT redline
lowest is halfof redline
�
F or C
Scanner Analog Display
The lower left side of the display is the Scanner with %HP above it.
The following is a description of the Scanner analog display, from top tobottom. Numbers in circles refer to features in the above diagram.
��Normalize View Indicator
• Percentage view (when the NRM icon is not lighted): thecolumns indicate percent of EGT red line. Each column iscomposed of a stack of segments. A maximum height columndepicts 100 % of red line and a one segment-high column depicts50 % of red line. For example, if the red line is 1650°F, amaximum height column represents 1650°F and a one segment-

Page 22 Engine Data Management
high column represents half that value, or 825°F. ThePercentage view permits comparison of EGTs across allcylinders. Hotter cylinders display higher columns than coolercylinders.
• Normalize view (when the NRM icon is lighted): the EGTcolumns are displayed normalized. When you change to theNormalize view, all columns are initially set to the same half-height level for trend analysis. Any changes are shown as anincrease or decrease in column height. A one-segment changein column height represents a 10°F change . The Normalizeview permits rapid visualization of EGT trends, rather than apercentage of red line. You can use normalize in level cruise andrun-up.
To toggle between Percentage and the Normalize views, hold theLF button for three seconds until the NRM icon toggles. Theanalog display becomes half height and the display changes to theNormalize view. Selecting the Normalize view does not affect the digitaldisplay nor alter the measurement sequence. The scale of the CHTdisplay—described later—is not affected by the Normalize or Percentageview.
You may select the Normalize view in either the Manual or Automaticmode. Normalize view is most helpful for engine trend monitoring of eachcylinder’s operation during cruise. When using the Normalize view duringengine run-up, a fouled spark plug will appear as a higher column.
A common misapplication is to be in the Normalize view and then changeyour power setting, causing all columns to go off scale, high or low.Select the Percentage view before adding or reducing power. Alwaysselect Percentage View when beginning your descent.
��Temperature Units (°F or °C)
• °F temperatures in the digital display are in Fahrenheit degrees.• °C temperatures in the digital display are in Celsius degrees.
The bar graph scale remains the same. To change the display of enginetemperatures see “Factory Program Submenus” on page 39.

For Your Safe Flight Page 23
����Cylinder Numbers and Dot IndexA row of numbers 1 through 6 are the column labels for the analogdisplay. The 1 through 6 are the cylinder numbers. If the TIT function isinstalled, it will be displayed in the last column under the letter T. A rounddot under the numbers 1 through 6 indicates that particular column isshown numerically in the EGT and CHT digital display.
�� �� Scanner Bar Graph EGT and CHTEach bar in the Scanner bar graph is composed of a column of segments.The total height of each column represents the EGT and the missingsegment in the column represents the CHT.
• In the Percentage view, the EGT and TITtemperature resolutions depend on theprogrammed red line limits.
• CHT is displayed by a missing segmentand should be interpreted as follows: a missing segmentcorresponds to the CHT in 25 F° increments, starting at250°F at the bottom. In the example shown here, the CHT is350°F. If the EGT Scanner bar column is lower than themissing CHT segment, then the CHT will be indicated by asingle isolated lighted segment.
The CHT missing segment display is the not affected by mode or view.
��Percent HPDisplays percent of rated HP.
Scanner Digital DisplayBeneath the Scanner bar graph is the alphanumeric display.
EGT and CHTWhen the index dot is beneath a cylinder number, 1 through 6, the digitaldisplay shows the EGT on the left (four digits) and the CHT on the right(three digits).
450
350
250
----
----
°F

Page 24 Engine Data Management
digitaldisplayof CHT
digitaldisplayof EGT
I340 376Display DimmingThe entire display panel features automatic dimming. Allow ten secondsfor the display to adjust toambient lighting conditions.
Bar Graph Displays
There are nine bar graphsshown on the right side of thedisplay. The defaultmeasurements displayed are(left to right, top to bottom):
• Oil temperature,• Oil pressure,• Fuel pressure,• Bus voltage,• Amps load or
charge/discharge,• OAT *,• Fuel flow,• Left tank fuel level *, and• Right tank fuel level *.
* A interchangeable screen overlay isprovided with no labels for where theOAT and left and right fuel levels are.These 3 graphs can be customized. See Customizing the Bar Graph Display on page 51.
The top of the bar is redline and the bottom of the bar is zero for O-T, O-P, F-P, amps load. For amps charge/discharge the center of the bar iszero and the top and bottom is redline charge and discharge, respectively.
47
37
26.0
F
F
I 80 42
25.3 32.3
I 2.3 27.4
O-P
E-
F-
E-
F-
O-T F-P
VDC AMPS OAT
LEFT RIGHTFLWGALLONS
FUEL
GPH

For Your Safe Flight Page 25
For volts the top of the bar is high redline and the bottom of the bar is lowredline. The top of the bar for FLW is set by the MAXFF parameter. Thewhite horizontal line indicates freezing for OAT.
The ranges and alarm values are user settable and are described later insection Section 10 - First Time Setup and Customization on page 36.
Buttons
Buttons, Front PanelFour operating buttons control all functions of the EDM.
STEP LF GMT EGT/FF
The term tap is used to denote pressing a button momentarily. The termhold is used to denote pressing and holding a button for five seconds orlonger.
STEP Button
• In the Automatic mode, tapping the STEP button will stopand change to the Manual mode. Then each tap of theSTEP button will display the next measurement in thesequence. Holding the STEP button will continuouslysequence in reverse order.
• In the LeanFind mode tapping the STEP button willterminate the LeanFind mode and change to the Automaticmode.
• In the Program mode tapping the STEP button will advanceto the next item.
LF (NRM) Button
• In Automatic or Manual modes, tapping the LF button willchange to the LeanFind mode.
Page 26 Engine Data Management
• In Automatic or Manual modes holding the LF button forthree seconds will toggle between Percentage and Normalize(NRM) views.
• In the LF mode holding the LF button after peak EGT isfound will display peak EGT.
STEP and LF Buttons
• Holding both the STEP and LF buttons simultaneously forfive seconds will enter the pilot programming and othermodes.
• Holding both the STEP and LF buttons simultaneously forfive seconds after entering LeanFind mode but beforebeginning to lean will toggle between leaning “rich of peak”and “lean of peak.”
• Tapping both the STEP and LF buttons simultaneously inManual mode toggles to include or exclude the displayedmeasurement from the Automatic mode (except USED). Ithas no affect on the displayed measurements in the Manualmode.
EGT/FF ButtonIn the Automatic or Manual modes, this button affects the Scannerdisplay and selects what measurements are viewed during scan. Seepage 4 for detailed description of which measurements are shown.
• In the FF selection only fuel flow measurements aredisplayed.
• In the ALL selection, both installed temperature and fuel flowmeasurements are displayed.
• In the EGT selection only the installed temperature (andbattery voltage) measurements are displayed.
Any alarm warning will appear regardless of the scan select setting.Selected scan measurements are displayed in the digital display in eitherthe Automatic or Manual modes.

For Your Safe Flight Page 27
Section 7 - Operation
Modes
The EDM-900 has four different operating modes: Automatic, Manual,Program and LeanFind. When you first turn on the power the EDM-900starts in the Manual mode, but will enter the Automatic mode after a fewminutes. The Automatic mode provides you with engine monitoringinformation for the majority of flight conditions. To adjust the mixture, usethe LeanFind mode. And to display specific measurements, use theManual mode. In both the Automatic and Manual modes the analogdisplay shows a Scanner bar graph of EGT and CHT for each cylinderand the TIT.
Automatic Mode
Just tap the LF button, then tap the STEP button. In the Automaticmode the EDM-900 displays the measurement sequence at a user-selected rate.
Individual measurements can be excluded from the Automatic mode: tapSTEP to enter the Manual mode. Tap STEP to index to themeasurement you want to exclude. Then tap both the STEP and LFbuttons simultaneously. Excluded measurements display a decimal pointbefore the measurement name. For example:
Included: I 540 T I T Excluded: I 540 .T I T
Tapping the STEP and LF buttons simultaneously will toggle back andforth between include and exclude.
• Every time you turn on the EDM, all measurements are reset to beincluded.
• All installed measurements are always displayed in the Manual mode.Exclusion only applies to the Automatic mode.
• All measurements are checked for alarm conditions every secondregardless of their included or excluded status.

Page 28 Engine Data Management
Manual Mode
Just tap the STEP button. Use the Manual mode when you want tomonitor one specific measurement such as shock cooling during descent,or a particular cylinder temperature during climbs. To change to theManual mode, tap the STEP button once. Subsequent taps will index thedigital display through the measurement sequence. To exit the Manualmode and return to the Automatic mode, either tap the LF button andthen tap the STEP button or wait 5 minutes. You may disable theAutomatic mode by setting “0” for scan rate.
LeanFind Mode
This was described in Section 4 - LeanFind, beginning on page 12.
Section 8 - Fuel Flow Features
Start Up FuelAfter initial self-test, you will be asked to inform the EDM-900 of start upfuel. The EDM-900 will display FUEL for one second, and then flash FILL?N until any button is pressed. If your aircraft has tank fill tabs and noauxiliary tanks, you can use the auxiliary tank feature to select eitherfilling to the tank tabs or topping the tank. See page 41 to program theEDM-900 for this feature. The EDM-900 does not differentiate fuel flowbetween the main and auxiliary tanks; it considers only total fuel in theaircraft. During flight you may also inform the EDM-900 of startupfuel using the pilot program mode display if you forgot to do so atstart up. The EDM-900 will retroactively calculate the fuel consumed.
auxiliary tank
main tank with tabtab
Aux capacity
Main capacityMain tank
For Your Safe Flight Page 29
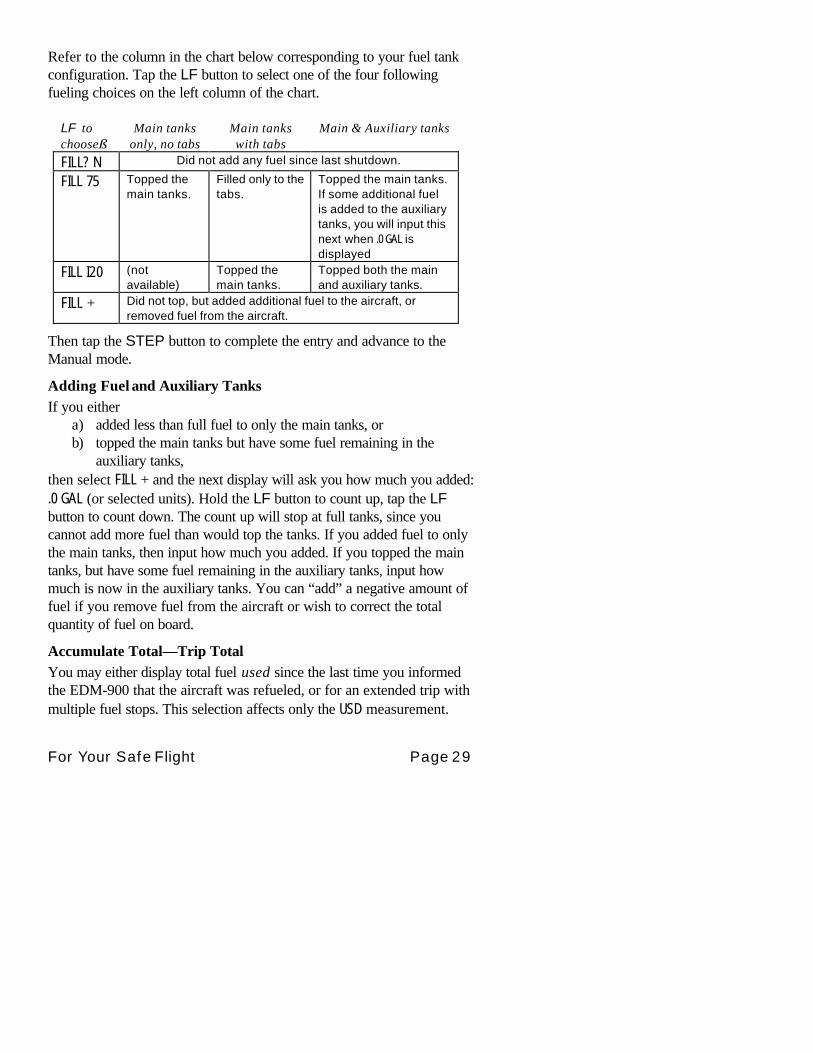
Refer to the column in the chart below corresponding to your fuel tankconfiguration. Tap the LF button to select one of the four followingfueling choices on the left column of the chart.
LF tochoose⇓
Main tanksonly, no tabs
Main tankswith tabs
Main & Auxiliary tanks
FILL? N Did not add any fuel since last shutdown.
FILL 75 Topped themain tanks.
Filled only to thetabs.
Topped the main tanks.If some additional fuelis added to the auxiliarytanks, you will input thisnext when .0 GAL isdisplayed
FILL I20 (notavailable)
Topped themain tanks.
Topped both the mainand auxiliary tanks.
FILL + Did not top, but added additional fuel to the aircraft, orremoved fuel from the aircraft.
Then tap the STEP button to complete the entry and advance to theManual mode.
Adding Fuel and Auxiliary TanksIf you either
a) added less than full fuel to only the main tanks, orb) topped the main tanks but have some fuel remaining in the
auxiliary tanks,then select FILL + and the next display will ask you how much you added:.0 GAL (or selected units). Hold the LF button to count up, tap the LFbutton to count down. The count up will stop at full tanks, since youcannot add more fuel than would top the tanks. If you added fuel to onlythe main tanks, then input how much you added. If you topped the maintanks, but have some fuel remaining in the auxiliary tanks, input howmuch is now in the auxiliary tanks. You can “add” a negative amount offuel if you remove fuel from the aircraft or wish to correct the totalquantity of fuel on board.
Accumulate Total—Trip TotalYou may either display total fuel used since the last time you informedthe EDM-900 that the aircraft was refueled, or for an extended trip withmultiple fuel stops. This selection affects only the USD measurement.

Page 30 Engine Data Management
Resetting “USED”Every time you inform the EDM-900 that the aircraft is refueled, theamount of fuel used is set to zero, unless the instrument is programmed toaccumulate or you are in flight. The display of fuel used pertains only tothe fuel used since the last time you informed the EDM-900 that theaircraft was refueled. To reset to zero the amount of fuel used at anypoint in time, manually STEP to display USD and hold both STEP and LFbuttons for five seconds until the display shows .0 USD.
Fuel Management
For fuel calculations to be accurate, it is imperative that youinform the EDM-900 of the correct amount of fuel aboard theaircraft. Do not rely on fuel flow instruments to determine fuellevels in tanks. Refer to original fuel flow instrumentation forprimary information
The EDM-900 Fuel Flow monitor uses a small, turbine transducer thatmeasures the fuel flowing into the engine. Higher fuel flow causes thetransducer turbine to rotate faster which generates a faster pulse rate.Because the transducer turbine generates thousands of pulses per gallonof fuel, it can measure the amount of fuel that flows into the engine withhigh resolution. Prior to engine start you inform the EDM-900 Fuel Flowmonitor of the known quantity of fuel aboard, and it will keep track of allfuel delivered to the engine. During flight you may also inform theEDM-900 of startup fuel using the pilot program mode display ifyou forgot to do so at start up.
Measurement Scan
Listed below is the sequence, measurement description and example ofthe digital display.
SELECTFF/EGT
Measurement
DescriptionExample Comments
E, A Voltage, System Bus I4.2 BAT Battery voltage

For Your Safe Flight Page 31
E, A CompressorDischargeTemperature
300 CDT Into intercooler
E, A Induction AirTemperature
I25 IAT Out of intercooler
E, A CDT-IAT I32 C - I Difference of CDT and IATE, A Carburetor
Temperature-22 CRB Not available when CDT is
installedE, A Difference between
hottest and coldestEGT
80 DIF Dot indicates most widelydeviating cylinder
F, A Fuel Remaining 37.2 REM In gallons, liters or pounds orkilograms
F, A Fuel required to nextGPS WPT orDestination
25.9 REQ Present with GPS interfaceValid signal and way point
F, A Fuel Reserve at nextGPS WPT orDestination
I I.3 RES Present with GPS interfaceValid signal and way point
F, A Nautical Miles perGal
I3.0 MPG Present with GPS interface andvalid signal or MPK, MPL, MPP
F, A Time to Empty 02.45 H.M. Hours. Minutes Remaining atcurrent fuel burn
F, A Total Fuel Used 38 USD Since last refueling or trip total.E, A EGT, CHT I340 376 EGT, left, CHT, right. Dot
indicates cylinderE, A TIT, Turbine Inlet
TemperatureI370 T I T Turbine #1
E, A Shock Cooling -30 CLD Dot indicates fastest coolingcylinder
Section 9 - Memory and Data Download
The EDM-900 Long Term Data Memory will record and store alldisplayed measurements once every six seconds (or at the programmedinterval of between 2 to 500 seconds). At a later time it will transfer themto a PC using a Palm™ handheld as a intermediate courier, or directly toa laptop PC.
When you retrieve recorded data to your handheld or laptop PC you canchoose to retrieve all the data in stored in the EDM, or only the new data

Page 32 Engine Data Management
recorded since your last retrieval. In either case, no data in the EDM-900is erased. The retrieved data will be saved in the Palm handheld or PC ina file in a compressed format. The PC program supplied with the LongTerm Data Memory will decompress the data for display and use byother programs, such a MS Excel.
The amount of total data that the EDM-900 can store will vary dependingon how rapidly the measurements change. The typical storage is 20hours at a 0.1 minute interval (1600 hours at 8 minuteinterval), but may vary depending on which options areinstalled. When the memory becomes full, the oldest datawill be discarded to make room for the newest. You may place a mark atthe next data record by tapping the TIME button twice. You will see theword SNAP at the next record snapshot, indicating a data record has beenmarked. Tap the STEP button to return to the Automatic mode.Recording begins when EGTs are greater than 500°F or “snap” isrequested.
All data are time-stamped. The EDM-900 Long Term Data Memorycontains a real-time clock that may be reset to local time when youinitially program your instrument. You may also program an aircraft idthat will appear in the output data file. The aircraft id can be your aircraftregistration number or your name. Initially the aircraft ID is set to theEDM's serial number.
You may change the record interval from 2 to 500 seconds, even in flight.When you change the interval in flight, the current flight file is closed, anda new flight file is created with the new record interval.
At power on, the EDM-900 will execute its self test and then display thedate (e.g., I I. I2.0 I), the time (I3.26), the percentage of memory filled sincethe last save (FULL 24), and the Aircraft ID.
Downloading data to the Palm handheld
The examples shown here are specifically for the Palm™ handheld and aPC running Windows® 98. J. P. Instruments provides an optional cable tointerface to the Palm cradle cable or travel cable. J. P. Instruments has adownloadable data transfer application program for the Palm series calledEzPalm™.
EzPalm 2JPI

For Your Safe Flight Page 33
Downloading the EzPalm Program from the InternetGo to our web page www.jpinstruments.com, go to the downloads page.Double click on EZPALM2.ZIP. When the File Download windowappears select Save this file to disk . Save the file to folder C:\EZSAVE.If it doesn’t exist, create it.
Using Windows Explorer, go to the folder C:\EZSAVE and double clickon the file name EZPALM2.ZIP. In the new Windows Explorer windowthat opened, double-click on EZSAVEP.EXE. Select Extract All. Acceptthe default directory C:\EZSAVE and select Next. Answer Yes andselect Finish.
Installing EzPalm on the Palm handheldUsing Windows Explorer, go to directory C:\EZSAVE and double-clickon EzPalm.prc. Click Done, Click OK.
HotSync® your Palm handheld. The EzPalm icon should now appear onyour applications screen.
Memory Data Capture & Import
With the Palm handheld you can transfer memory data into a file andthen later HotSync the data into your PC and import it into EzSaveP™.Here are the steps used to perform these two operations.
Transferring Data from the EDM-900 to the Palm Handheld
To transfer recorded data to your Palm handheld, proceed as follows:
1. Connect the Palm handheldcradle or travel cable option(available from PalmComputing) to the JPI PalmDownload cable (gray).Insert the small round plug ofthe JPI cable into the dataconnector on your aircraftinstrument panel, and thecradle or travel cable to the Palm handheld.
I3.8 27.4 26.0
SELECT DATA
FF/ALL/EGT

Page 34 Engine Data Management
2. Simultaneously hold the STEP and LF buttons for five seconds. Youwill see the word PROGRAM for two seconds. Tap the STEP buttonuntil you see the question DUMP? N. Tap LF to select DUMP NEW orDUMP ALL.
3. On the Palm handheld, tap the EzPalm icon.
4. Tap the EzCapture™ button. The Palm handheld will wait afew seconds for you.
5. Tap the STEP button to begin the transfer process. The displayshows the percentage of memory remaining to be transferred. Whenthis number reaches zero, the transfer is complete. If you want toterminate the transfer before it is complete, simultaneously hold theSTEP and LF buttons for five seconds. You will see ABORT.
6. The Palm handheld will close the file named with today’s date. TapExit to end EzPalm or tap Explorer to view the file list.
Transferring Data from the Palm handheld to your PC in Excelcompatible format1. Place the Palm handheld in the cradle and begin a HotSync. Your file
will be placed in the folder C:\Palm\YourName\Backup whereYourName is the folder corresponding to your Palm handheld username. The file will have a name similar to P010318a.PDBcorresponding in this example to the date 2001, March 18.
2. Using MS Explorer, move the file P010318a.PDB to the foldercontaining the EzSAVEP.exe application—such as C:\EZSAVE.
3. To run EzSAVEP on the PC, go to directory C:\EZSAVE and runEXSAVEP.EXE. From the main menu use the up and down arrowkeys to select De-Compress Palm Pilot Data. Use the up anddown arrow keys to select the file to decompress. Press the <Enter>key.
EzSAVEP will create one or more files, each of which corresponds toone flight.
EzPalm 2JPI

For Your Safe Flight Page 35
Transferring Data from the EDM-900 to a Laptop PC
Go to our web page www.jpinstruments.com, go to the downloads page.Double click on EZSAVE.ZIP. When the File Download windowappears select Save this file to disk . Save the file to folder C:\EZSAVE.If it doesn’t exist, create it.
Install EzSave™ on your laptop PC, following the instructions includedwith the EzSave program or download EXSAVE.pdf. Connect to thecomputer serial port using the supplied serial cable or to the USB portusing an optional Keyspan USB Serial Adapter (available from JPI; installthe serial adapter driver). Insert the small round plug into the dataconnector on the EDM-900, and the other end into the computer serialport or to the USB port using the Keyspan adapter. Both types ofconnections are shown below.
On the Windows desktop double click EzSave icon. Click on theDownload and decompress data button. You may also tab to thedesired button and press the spacebar to select a menu item.
Follow the instructions on the screen. After the data is downloaded DONEwill be displayed. EzSave program will decompress the data file that wasdownloaded, and produce individual Flight files.

Page 36 Engine Data Management
- OR -
Keyspan U
SB
Adapter
US
A-19Q
W
Laptop
DATA PORT
EDM-900
DATA PORT
EDM-900
USB port1
6
5
9
serial port
Section 10 - First Time Setup and Customization
Pilot Program
To start the Pilot Program procedure, simultaneously hold the STEP andLF buttons for five seconds. You will see the word PROGRAM for twoseconds and then the sequence shown in the chart below.
Tap the STEP button to advance to the next item in the list. Hold theSTEP button to step back to the previous item. Tap the LF button toselect alternate values of that item. Simultaneously hold both STEP andLF to exit.

For Your Safe Flight Page 37
STEPadvancesnext item
LFsequencesthrough
these valuesComments
PROGRAM Stays on for two seconds.
FUEL N FILL ? N Tap LF to change fuel status. See page28à Exits program mode when done.
DUMP? N DUMP? NàDUMPNEWàDUMP ALL
Dump data to a Palm or laptop computer.See page 31à
RATE 4 0 … 9 Index rate (pause time in seconds) in theAutomatic Mode. 0 disables the AutomaticMode.
OAT F OAT F ⇔OAT C
To calibrate the OAT ±10°, hold both theSTEP and LF buttons simultaneously forfive seconds, which will proceed to thenext step. Otherwise the next step will beskipped.
OAT+0 OAT-I0 …OAT+I0
This step will be normally be skipped.
Adjust the indicated temperature up ordown by up to 10°. For example, OAT+3adjust the OAT 3° higher.
EGT I?N EGT I?N ⇔EGT I?Y
Y—Yes—sets the digital display to one-degree resolution; N—No—sets 10°. (10°resolution is easier to interpret the EGTs.)
HPC= I25 70 HP
HPC= I25
%HP display will change when HPconstant is adjusted. Hold STEP and LFfor 5 seconds until you see ADJUST to setthe HP calibration. Tap STEP to continueto the next step. See page 38à
TR IP? N TR IP? N ⇔TR IP? Y
N—No—Upon informing the EDM that yourefueled the aircraft, reset total fuel used to0.Y—Yes—accumulate total fuel used ratherthan reset to 0 at each refueling. See page38à

Page 38 Engine Data Management
HOBS VAL 2424ENG⇔25 EDM⇔3567 FRM
Displays the engine hours and airframehours.
END? Y END? Y STEP exits the pilot programming mode.LF reenters pilot programming mode.
Programming the Horsepower ConstantYou must adjust the HP Constant once for your aircraft. You mustperform this adjustment in the air while the aircraft is in flight
1. At full take off power at sea level, view the reading in the %HPdisplay and see how close it is to 100 percent. If the value in thedisplay is not 100 percent, then go to the next steps.
2. Enter the pilot program mode by simultaneously holding the STEPand LF buttons for five seconds.
3. Tap STEP repeatedly until you see—for example— HPC = I25. Thenhold both the STEP and LF buttons display until you see ADJUST,followed by HPC= I25. The adjustment range for the HP Constant is45 to 180.
4. Change the HP reading by adjusting the HP constant in the lowerdisplay by holding or tapping the LF button..
5. Keep adjusting the HP constant until the HP window displays 100 asthe current engine percent HP.
6. Tap the STEP button to proceed to the next step.
Programming Accumulate Trip TotalAccumulate—default is OFF: resets the fuel used to 0 every time youinform the EDM-900 that the aircraft was refueled. With accumulate ONfuel used will not be reset to 0 when you inform the EDM-900 that theaircraft was refueled.
Select “No” if you wish to display total fuel used since the last time youinformed the EDM-900 that the aircraft was refueled. Select “Yes” todisplay total fuel used for an extended trip with multiple fuel stops. Thisselection affects only the USD measurement.

For Your Safe Flight Page 39
During normal operation, to reset the accumulated fuel used display atany time, tap STEP until you see USD. Hold both STEP and LF until thedisplay shows .0 USD.
Factory Program Submenus
A Windows based program called EzCfg is as an alternative to the stepsshown below. See the www.jpinstruments.com web site to download.
To enter the factory programming submenus:
• Simultaneously hold the STEP and LF buttons for five seconds. Youwill see FUEL N.
• Again, release and simultaneously hold the STEP and LF buttons forfive seconds. You will see FACTORY followed by RESET? N.
Tap the STEP button to advance to the next item in the list. Hold theSTEP button to step back to the previous item. Tap LF to enter thedesired submenu. When you exit the last item on a submenu the displaywill show ++++ +++ for a second and then display the next item. Toimmediately exit the Factory Program mode, hold the STEP and LFbuttons for five seconds.
The name of the submenu that you are currently stepping through isdisplayed on the upper left side of the screen. Initially the display will beFAC MENU.
SubmenusSTEP LF enters this submenu
R E S E T ?R E S E T ?NN
Tap STEP to skip this step. Warning: tapping LF at this pointwill reset all programming to the factory defaults.
T E M P ?T E M P ?NN
Sets the engine temperature units, calibrates TIT and thermocoupletype. See page 40à
A L R M ?A L R M ?NN
Sets the alarm limits for battery voltages, engine temperatures, fuel andother parameters. See page 40à
F F L W ?F F L W ?NN
Sets the tank capacities and other constants for the fuel flow transducersystem. See page 41à
R P M ? NR P M ? N Sets the number of cylinders for the RPM sensor and the Hobbs enable

Page 40 Engine Data Management
RPM. See page 45à
R E C D ?R E C D ?NN
Sets the data recording time interval. See page 45à
M A P ? NM A P ? N Sets the manifold pressure calibration. See page 45à
F L V L ?F L V L ?NN
Sets the fuel level parameters. See page 47à
U S E RU S E RI D NI D N
Sets the aircraft ID, registrations number, or owner into the EDM forinitial startup and for use in reports. See page 50à
T I M E ?T I M E ?NN
Sets the time and date. See page 50à
E N D ?E N D ?YY
STEP exits the Factory Limit mode.LF reenters factory programming mode.
Tap LF to enter the desired submenu. Within each submenu there are anumber of choices. Choose an item within a submenu by tapping theSTEP button to step through the list. Tap or hold LF to choose a valuefor that item. Use the STEP button to advance to the next item.
T E M P M E N UT E M P M E N USets the engine temperature units, calibrates TIT and thermocouple type
STEP LFEGT - CHT ENG F ⇔ENG C Select F or C degrees for all engine
temperatures. Same bar graph scale.
ORIG T I T ORIG T N ⇔ORIG T Y Original TIT, Y will enter TIT calibrationmode, next step
T I T –975 ⇔ 975 For example, if the EDM reads 100less than the aircraft’s TIT gauge, setthe display to read T I T +I 00
TYPE K TYPE K ⇔ TYPE J Toggles CHT between thermocoupletype K and type J (type K is JPIstandard)
A L R M M E N UA L R M M E N USets the alarm limits for battery voltages, engine temperatures, fuel andother measurements.

For Your Safe Flight Page 41
STEP LFBATTERY H BAT I0.0 à 35.0 High battery voltage limit (volts)
L BAT 8.5 à 30.0 Low battery voltage limit (volts)
EGT D I F DIF 30 à 990 EGT difference limit (°F or °C)
CHT H I H CHT 90 à 500 High CHT limit (°F or °C)
COOL CHT CLD 5 à 200 Shock cooling limit (°F or °C)
TIT H I T I T 650 à 2000 TIT and EGT limits (°F or °C)
OIL TMP HO -T 40à 500 High oil temperature limit (°F or °C)
LO - T I0 à 250 Low oil temperature limit (°F or °C)
OIL PRS HO-P 0à I 50 High oil pressure limit (psi)
LO-P 0 à I 00 Low oil pressure limit (psi)
MAP H I MAP 25.0 à 60.0 High manifold pressure limit (in Hg)
LO FUEL REM = 0 à200 Low fuel amount remaining limit (gal)
LO T I ME M I N = 0 à 60 Low time fuel alarm limit (minutes)
FUEL PRS HF - P 0à I 00 High fuel pressure limit (psi)
LF – P 0 à I 00 Low fuel pressure limit (psi)
MAX RPM RPM 2000 à 3600 High RPM limit (rev. per minute)
MAX AMP AMP= 0 à 300 High amp load limit
MAX AMP2 AMP2= 0 à 300 High amp load limit for second amps(set to 0 to disable)
TBO HRS TBO 0 à 2000 TBO limit (hours)
F F L W M E N UF F L W M E N USets the tank capacities and other constants for the fuel flow transducersystem.
STEP LFUN I TS FUEL GAL à KGS à
LTR à LBSUnits for all fuel relatedmeasurements
MAIN TK MAIN 0 à 999 Main tank capacity. See belowàAUX AUX 0 à 250 Auxiliary tank capacity. See belowàCARB ? N CARB ? N ⇔ Y
CARB ? YY—Yes—carbureted engine, enablessmoothing filter (next item)

Page 42 Engine Data Management
F I LTER CARB F = I à CARBF = 2 à CARB F =3
Smoothing filter. Higher number issmoother
GPS – C = 2 GPS – C = 0 à 6 Sets the EDM serial data outputformat to the GPS. See belowà
KF = 29.90 KF = 00. I 0 à 99.99 See K factor belowàMAX FF MAX = I à 999 Maximum scale for FLW bar graph
Fuel Capacity
Main Tank CapacityEnter the total capacity of the main tanks in the fuel flow units selected.If you have tank tabs (but no auxiliary tanks) and sometimes fill only tothe tabs, set the main tank capacity to the capacity up to the tabs.
Auxiliary Tanks
If you do not have auxiliary tanks or tank tabs, leave AUX set to 0.Otherwise input the capacity of the auxiliary tanks in the fuel flow unitsselected. If you have tank tabs and sometimes fill only to the tabs, set theauxiliary tank capacity to the difference between full tank capacity andtab capacity. The EDM-900 does not differentiate fuel flow between themain and auxiliary tanks; it tracks only total fuel in the aircraft.
Setting GPS-C Fuel Flow Communications FormatGPS-C Input to GPS; output of EDM
0 No fuel data output1 Garmin (Shadin Miniflow format)2 Allied Signal (format B)3 Arnav/EI fuel data4 Allied Signal (format C) *5 (Not used)6 UPS/Garmin fuel/air data

For Your Safe Flight Page 43
K factor
The K factor is shown on the fuel flow transducer as a four-digit number,which is the number of pulses generated per gallon of fuel flow. Beforeinstalling the transducer, write down the K factor here_________. To enter the number, move the decimal point three places tothe left. For example if the K factor on the fuel flow transducer is 29,123,enter 29.12 in the K factor parameter.
If the K factor is increased, the indicated fuel flow will decrease, andvice-versa. When the K factor is changed during a trip, calculationsof fuel used, fuel remaining and time to empty are not retroactivelyrecalculated.
Fine Tuning the K factor
The K factor shown on the fuel flow transducer does not take intoaccount your aircraft’s particular installation. Fuel hose diameters andlengths, elbows, fittings and routing can cause the true K factor to bedifferent from that shown on the fuel flow transducer.
You must use the following procedure to fine tune the K factor.
1. Make at least three flights of about two to three hours each. Note theactual fuel used (as determined by topping the tanks) and the EDM-900 calculation of the fuel used for each flight USD.
FlightFuel USED shown by EDM
(total tank - REM) Actual fuel used by toppingtanks
123
Total � �
2. Total � the EDM-900 calculated fuel used and � the actual fuelused.
Page 44 Engine Data Management
3. Record the current K factor here �____________________ and inthe table below.
4. Calculate the New K factor as follows:
New K factor = (�EDM fuel used) x (�Current K factor)(�actual fuel used)
New K factor = (� ) x (� )(� )
Every time you fine tune the K factor, record the measurements here:
Date�EDM
fuel used�actualfuel used
�CurrentK factor
New K factor= �x�/�
Pilot’sinitials
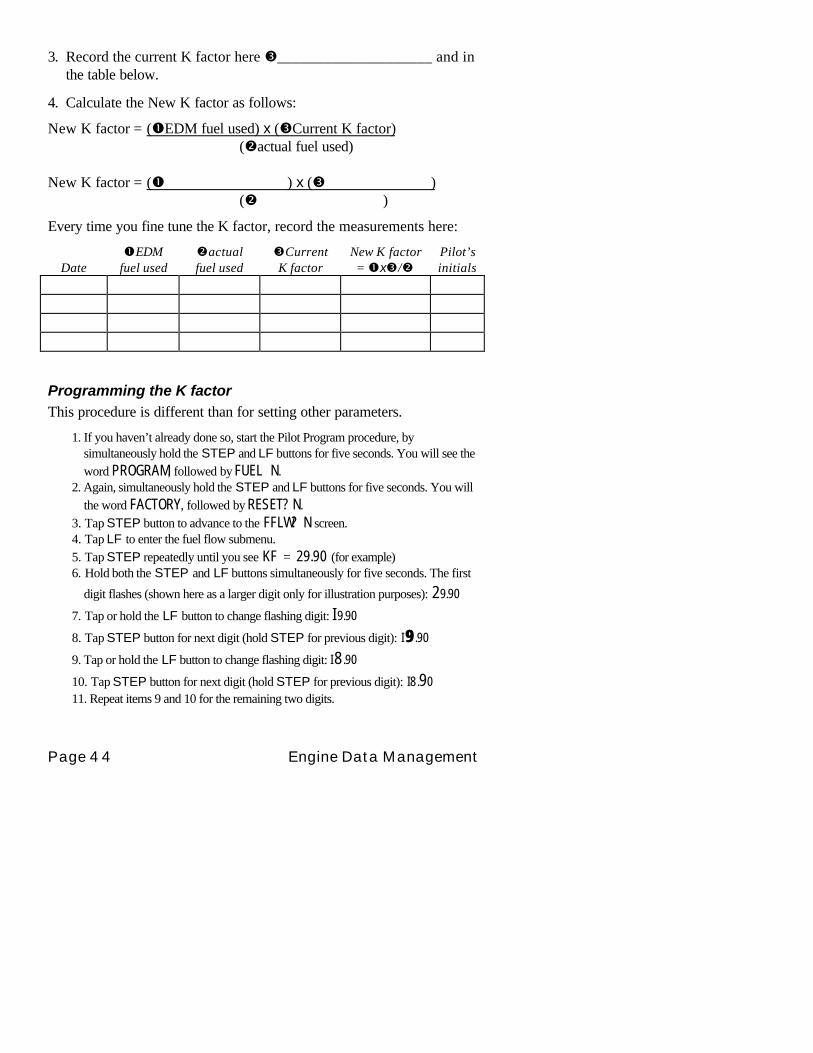
Programming the K factorThis procedure is different than for setting other parameters.
1. If you haven’t already done so, start the Pilot Program procedure, bysimultaneously hold the STEP and LF buttons for five seconds. You will see theword PROGRAM, followed by FUEL N.
2. Again, simultaneously hold the STEP and LF buttons for five seconds. You willthe word FACTORY, followed by RESET? N.
3. Tap STEP button to advance to the FFLW? N screen.4. Tap LF to enter the fuel flow submenu.5. Tap STEP repeatedly until you see KF = 29.90 (for example)6. Hold both the STEP and LF buttons simultaneously for five seconds. The first
digit flashes (shown here as a larger digit only for illustration purposes): 29.90
7. Tap or hold the LF button to change flashing digit: I 9.90
8. Tap STEP button for next digit (hold STEP for previous digit): I 99 .90
9. Tap or hold the LF button to change flashing digit: I 8.90
10. Tap STEP button for next digit (hold STEP for previous digit): I8.9011. Repeat items 9 and 10 for the remaining two digits.

For Your Safe Flight Page 45
12. Hold STEP and LF buttons simultaneously for five seconds to exit the K factorparameter setup.
13. Tap STEP repeatedly until you see END ? Y, then Tap STEP once more toexit the factory setup mode.
R P M M E N UR P M M E N USets the number of cylinders for the RPM sensor and the Hobbs enableRPM.
STEP LFRF = 6 RF = 4 à I2 RPM Factor = number of pulses per
revolution
HOBS ON RPM 800 à I 500 Minimum RPM to enable to Hobbscounter
RPM Factor (RF)
Set the RPM Factor, RF = 4 or 6, depending on your engine. Exceptions:
• 4 cylinder engine with dual (all-in-one) magnetos set to RF = 8.• 4 cylinder Laser ignition set to RF =8.• 6 cylinder Laser ignition set to RF = I 2.
R E C D M E N UR E C D M E N USets the data recording time interval.
STEP LFRATE RATE 2 à 5 I 0 Record time interval, in seconds
M A P M E N UM A P M E N USets the manifold pressure calibration (an sets the oil pressure and fuelpressure zero points.
STEP LFMAP MAP 20 à 32 Manifold pressure calibration
Do this one time and only if the MAP on your manifold pressuregauge doesn't match the MAP shown on the EDM-900
You must do this on the ground with the engine turned off.
Page 46 Engine Data Management
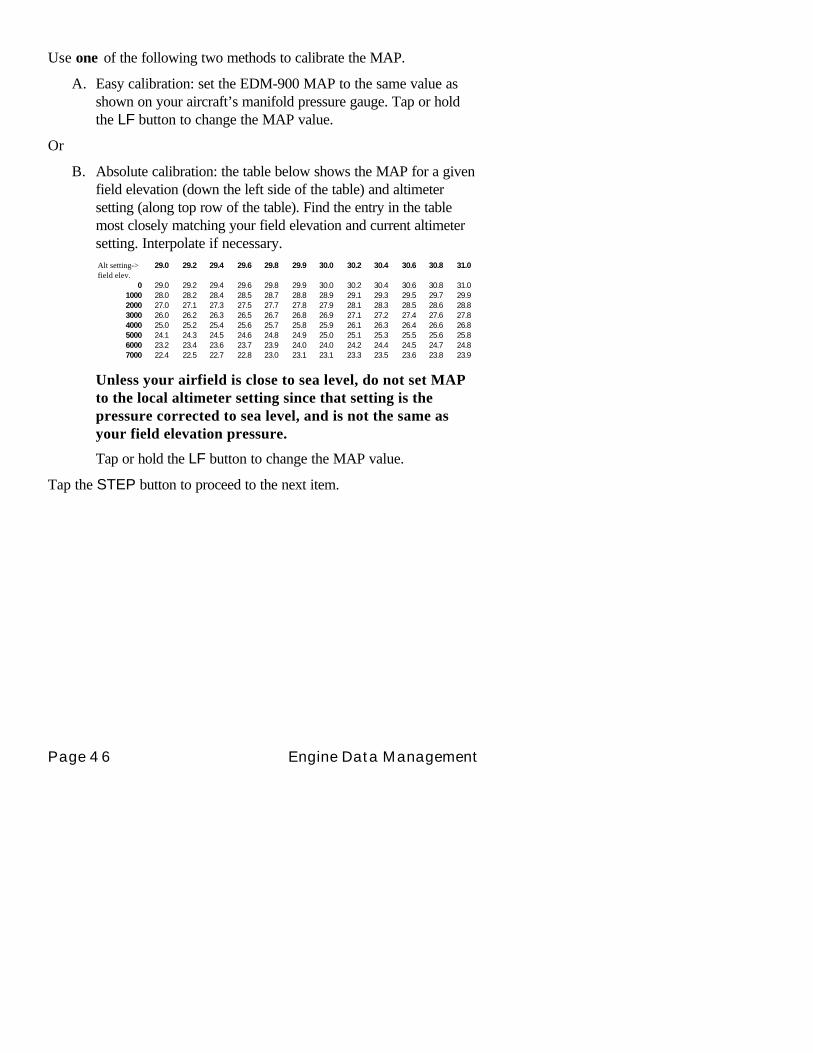
Use one of the following two methods to calibrate the MAP.
A. Easy calibration: set the EDM-900 MAP to the same value asshown on your aircraft’s manifold pressure gauge. Tap or holdthe LF button to change the MAP value.
Or
B. Absolute calibration: the table below shows the MAP for a givenfield elevation (down the left side of the table) and altimetersetting (along top row of the table). Find the entry in the tablemost closely matching your field elevation and current altimetersetting. Interpolate if necessary.Alt setting->field elev.
29.0 29.2 29.4 29.6 29.8 29.9 30.0 30.2 30.4 30.6 30.8 31.0
0 29.0 29.2 29.4 29.6 29.8 29.9 30.0 30.2 30.4 30.6 30.8 31.01000 28.0 28.2 28.4 28.5 28.7 28.8 28.9 29.1 29.3 29.5 29.7 29.92000 27.0 27.1 27.3 27.5 27.7 27.8 27.9 28.1 28.3 28.5 28.6 28.83000 26.0 26.2 26.3 26.5 26.7 26.8 26.9 27.1 27.2 27.4 27.6 27.84000 25.0 25.2 25.4 25.6 25.7 25.8 25.9 26.1 26.3 26.4 26.6 26.85000 24.1 24.3 24.5 24.6 24.8 24.9 25.0 25.1 25.3 25.5 25.6 25.86000 23.2 23.4 23.6 23.7 23.9 24.0 24.0 24.2 24.4 24.5 24.7 24.87000 22.4 22.5 22.7 22.8 23.0 23.1 23.1 23.3 23.5 23.6 23.8 23.9
Unless your airfield is close to sea level, do not set MAPto the local altimeter setting since that setting is thepressure corrected to sea level, and is not the same asyour field elevation pressure.
Tap or hold the LF button to change the MAP value.
Tap the STEP button to proceed to the next item.
For Your Safe Flight Page 47
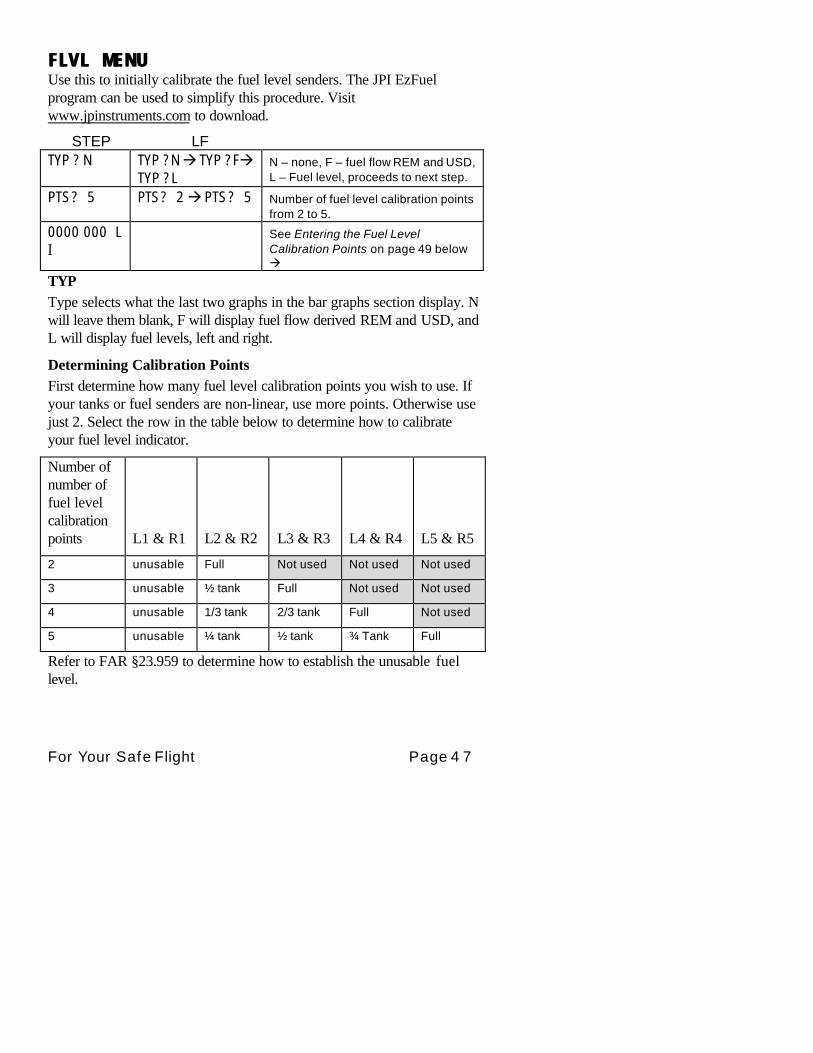
F L V L M E N UF L V L M E N UUse this to initially calibrate the fuel level senders. The JPI EzFuelprogram can be used to simplify this procedure. Visitwww.jpinstruments.com to download.
STEP LFTYP ? N TYP ?N à TYP ?Fà
TYP ?LN – none, F – fuel flow REM and USD,L – Fuel level, proceeds to next step.
PTS ? 5 PTS ? 2 à PTS ? 5 Number of fuel level calibration pointsfrom 2 to 5.
0000 000 LI
See Entering the Fuel LevelCalibration Points on page 49 belowà
TYPType selects what the last two graphs in the bar graphs section display. Nwill leave them blank, F will display fuel flow derived REM and USD, andL will display fuel levels, left and right.
Determining Calibration PointsFirst determine how many fuel level calibration points you wish to use. Ifyour tanks or fuel senders are non-linear, use more points. Otherwise usejust 2. Select the row in the table below to determine how to calibrateyour fuel level indicator.
Number ofnumber offuel levelcalibrationpoints L1 & R1 L2 & R2 L3 & R3 L4 & R4 L5 & R5
2 unusable Full Not used Not used Not used
3 unusable ½ tank Full Not used Not used
4 unusable 1/3 tank 2/3 tank Full Not used
5 unusable ¼ tank ½ tank ¾ Tank Full
Refer to FAR §23.959 to determine how to establish the unusable fuellevel.

Page 48 Engine Data Management
The following is the procedure to initially calibrate your fuel senders. Youshould only have to do this once. You will determine the 2 to 5 fuel levelcalibration points for each tank and write them in the chart below. Thesevalues will be entered using the procedure, Entering the Fuel LevelCalibration Points, in the next subsection.
Left fuel level calibration point Right fuel level calibration point
Left Cal Left Fuel Right Cal Right Fuel
L1 [ ] [ ] [ ] [ ] [ 0] [ 0].[ 0]* R1 [ ] [ ] [ ] []
[ 0] [ 0].[ 0]*
L2 [ ] [ ] [ ] [ ] [ ] [ ].[ ] R2 [ ] [ ] [ ] []
[ ] [ ].[ ]
L3 [ ] [ ] [ ] [ ] [ ] [ ].[ ] R3 [ ] [ ] [ ] []
[ ] [ ].[ ]
L4 [ ] [ ] [ ] [ ] [ ] [ ].[ ] R4 [ ] [ ] [ ] []
[ ] [ ].[ ]
L5 [ ] [ ] [ ] [ ] [ ] [ ].[ ] R5 [ ] [ ] [ ] []
[ ] [ ].[ ]
* unusable fuel level is entered as 00.0
You may choose to do this procedure totally on one tank, then the othertank, rather than moving the fuel hose back and forth between the leftand right tanks.
NEVER add or remove fuel from the aircraft when the masterswitch is turned on.
Turn OFF the aircraft master switch
Empty left and right tanks and fill each to the unusable level (firstfuel level calibration point)
Hold EGT/FF button while turning ON master switch, see F U E L F U E L D S PD S P
With the left and right tanks empty, write down the displayedcalibration values (L1 is on top, R1 is on the bottom). This is theempty (0) fuel level.
Turn OFF the aircraft master switch
Add fuel to the left and right tanks and bring it up to the secondfuel level calibration point level (or full for a two point calibration)
Hold EGT/FF button while turning ON master switch, see F U E L F U E L D S PD S P

For Your Safe Flight Page 49
With the left and right tanks at the second calibration point, writedown the displayed calibration values (L2 is on top, R2 is on thebottom) and the amount of fuel now in each tank. For a 2 pointcalibration, stop here.
Turn OFF the aircraft master switch
Add fuel to the left and right tanks and bring it up to the third fuellevel calibration point level (or full for a three point calibration)
Hold EGT/FF button while turning ON master switch, see F U E L F U E L D S PD S P
With the left and right tanks at the third calibration point, writedown the displayed calibration values (L3 is on top, R3 is on thebottom) and the amount of fuel now in each tank. For a 3 pointcalibration, stop here.
Turn OFF the aircraft master switch
Add fuel to the left and right tanks and bring it up to the fourth fuellevel calibration point level (or full for a four point calibration)
Hold EGT/FF button while turning ON master switch, see F U E L F U E L D S PD S P
With the left and right tanks at the fourth calibration point, writedown the displayed calibration values (L4 is on top, R4 is on thebottom) and the amount of fuel now in each tank. For a 4 pointcalibration, stop here.
Turn OFF the aircraft master switch
Add fuel to the left and right tanks and bring it up to full for the fifthfuel level point calibration point level.
Hold EGT/FF button while turning ON master switch, see F U E L F U E L D S PD S P
With the left and right tanks at the fifth calibration point, write downthe displayed calibration values (L5 is on top, R5 is on the bottom)and the amount of fuel now in each tank (fuel tanks).
Proceed to the next step below to enter the fuel level calibration points.
Entering the Fuel Level Calibration PointsThis procedure is used to enter the fuel level calibration points (2 to 5points for each tank) into the EDM-900. This procedure assumes thatyou have determined the calibration points from the proceduredescribed in the Determining Calibration Points section, above.
Each fuel level calibration point is a seven digit number: the left four digitsare the internal EDM-900 calibration constant, and the right three digits

Page 50 Engine Data Management
are the corresponding fuel level in fuel units (gallons, kilograms, liters, orpounds).
In the F L V L M E N U F L V L M E N U , first select the number of fuel calibration points: 2through 5, using LF, then tap STEP. You will see the first point as0000 00.0 or some other number if calibration points have beenpreviously entered. To the right of this display you will see the pointnumber (L I thru L5, R I thru R5). To change each fuel level calibrationpoint, hold both STEP and LF for five seconds until the first digit flashes.Tap or hold LF to set the first digit. Tap STEP to advance to the nextdigit (hold STEP to go back to the previous digit). Hold both STEP andLF when you are finished entering this fuel level calibration point. Thedigit will stop flashing.
Tap STEP to advance to the next fuel level calibration point. Repeat thesteps in the preceding paragraph for each fuel level calibration point. For2 point calibration there will be a total of 4 constants, up to a 5 pointcalibration of 10 constants.
Tap STEP to exit the procedure.
I D M E N UI D M E N USets the aircraft ID, registrations number, or owner into the EDM forinitial startup and for use in reports.
00000 àZZZZZ (1st
char flashes)
Current aircraft ID. To change aircraftID, hold both STEP and LF until thefirst character flashes.
00000 àZZZZZ (2nd
char flashes, etc.)
LF the character, STEP moves to thenext character. To save, hold bothSTEP and LF.
T I M E M E N UT I M E M E N USets the time and date.
STEP LFDATE MONTH I à I2 Month
DAY I à 3 I Day
YEAR 0 I à 99 Year

For Your Safe Flight Page 51
T I ME HOUR 00 à 23 Time of day, hours, 24-hour time
M I N 00 à 59
Customizing the Bar Graph Display
The bar graph display has 9 stations, 3 of which can bereconfigured to display any of the measurements thatcan appear in the scanner section. Stations 6, 8 and 9can be reconfigured. JPI provides a configurationprogram that runs on an MSWindows PC, calledEzConfig. Follow the instructions in the EzConfigdocumentation to change these assignments.
Programming Alarm Limits
Factory Set Default Limits—Non-Primary
J P IJ P I conservatively sets the default alarm limits below Lycoming andContinental recommendations.
Measurement Default LowLimit
Default High Limit Alarm Example
CHT 450°F* 230°C 4 6 5 4 6 5 C H TC H TOIL T 90°F 32°C 230°F* 110°C 2 8 0 O I L T2 8 0 O I L TOIL P 15 psi 100 psi I 2 0 O I L PI 2 0 O I L PTIT 1650°F* 900°C I 7 2 0 T I TI 7 2 0 T I TCLD -60°F/min. -
33°C/min.- 6 5 - 6 5 C L DC L D
EGT DIF 500°F 280°C 5 2 5 5 2 5 D I FD I FBAT, 24 V 24V 36V 2 2 . 4 B A T2 2 . 4 B A TBAT, 12 V 12V 18V I 7 . 6 B A TI 7 . 6 B A TAMPS 4 0 A M P4 0 A M PMAP 40 inHg 4 6 . 3 M A P4 6 . 3 M A PLO FUEL 45 min 0 0 . 2 0 0 0 . 2 0 H . MH . MLO TIME 10 gal, kg, ltr,
lbs7 . 2 7 . 2 R E M `R E M `
FP 15 psi 60 psi 7 . 2 F P7 . 2 F PRPM RL 2700 2 5 0 02 5 0 0REM 10 gal I 0 I 0 R E MR E MH . M 45 minutes 4 5 H . M4 5 H . M
If you change the display between Fahrenheit and Celsius, alarm limitswill automatically change also. The bar graph scale will remain the same.
1
987
654
32

Page 52 Engine Data Management
When an alarm is displayed, tapping the STEP button will temporarilyignore that alarm from the sequence for the next ten minutes. Or holdingthe STEP button until the word OFF appears will ignore that alarm for theremainder of the flight.
Section 11 - Troubleshooting the EDM
Common Misapplications
Some of the more common misapplications made by first-time EDM-900users are presented here in an attempt to help you avoid similar problems.
Problem Situation CorrectionLeanFind finds a“peak” too soon.
Failure to pre-lean beforeperforming LeanFind orpausing while leaning.
Continue to lean withoutpausing. False peak will bereset and LeanFind willcontinue.
Leaning too slowly. Lean more quickly.
Peak not found Lean Find not activatedor stopping while leaning
Lean at the speed ofapproximately 10°F persecond.
Off-scale EGT columns,too high or low
You forgot that you setthe EDM-900 in theNormalize view and laterobserve off-scale EGTcolunn readings.
The higher sensitivity (10°per segment) of theNormalize view can quicklygo too high or low off-scalewith only small changes inEGT.
No display of %HP Fuel flow not reading,OAT not reading
Fuel Flow reading and OATis required for HP.
RPM reads 2/3 ofcorrect value
4 cylinder engine but setto 6 cylinder.
In Pilot Program change 6 to 4cylinder.
First cylinder to peak isnot the hottest
This is normal. The first to cylinder peak is notnecessarily the hottest.
EGTs rise duringsingle magneto check
This is normal, due to incomplete combustion persistinglonger.

For Your Safe Flight Page 53
EGTs not uniformduring low poweroperation
This is normal. Fuel and air distribution is not optimal atlow power settings.
Diagnostic Testing on Startup and During Flight
When your EDM-900 is first turned on, all digits light up for a fewseconds, permitting you to check for non-functional segments. Then eachcolumn is self-tested in sequence while the EDM-900 tests internalcomponents, calibration and integrity of the probes.
During the startup sequence, the following will be seen on the scannerdigital display: EDM-900, MM.DD.YY, HH.MM GMT, USD MEM, XX PCT, aircraftregistration number (defaults to FACTORY if new or reset), VER X.XX, BLDXXX.
During flight, probes are constantly checked for inconsistent orintermittent signals. A faulty channel or probe encountered during start-upor during flight will be deleted from the sequence, producing a missingcolumn or blank digital data.
Diagnostic Messages
Startup and Operational DiagnosticsThe following displays indicate a malfunction in the probes, wiring orinstrument:
MEM ON Not an error. Memory on. Recording is enabled whenEGT exceeds 500°F or the RPM exceeds the HobbsRPM enable value.
HOBS ON Not an error. Hobbs on. RPM exceeds the HobbsRPM enable value.
TEST I NG LF tapped during self test. Tap LF again later.0.0 GPH Zero’s indicate Fuel flow is too low to register--- GPH Dashes indicate No fuel flow transducer signals--- H.M Dashes indicate No fuel flow transducer signalsOPEN PRB Open probe. Wiring to probe is open circuit. Check

Page 54 Engine Data Management
wiring and crimps. Swap probes to troubleshoot.BAD-PRB Bad probe. Erratic reading. May be poor electrical
connection. Swap probes to troubleshoot.H I XX High. Measurement over range.LO XX Low. Measurement under range.CAL ERR Calibration error. Return unit to factory.DSP XXX Internal communication error. Return unit to factory.COMM ERR Internal communication error. Return unit to factory.NO XX V Calibration error. Return unit to factory.
GPS Interface DiagnosticsMeasurements REQ, RES, & MPG are allmissing from the scan.
No communications from GPS receiver toEDM. Possibly no connection or aircraftGPS is off.
NO - COM message and measurementsREQ, RES, & MPG are missing.
Communications are received by EDM-900and the Auto-Protocol setup is in process.Verify correct output format setup in GPSreceiver; check GPS connections.
NO - SIG message and measurementsREQ, RES, & MPG are missing.
GPS receiver has insufficient signal for validdata.
NO - WPT message and measurementsREQ & RES, are missing.
No waypoints are programmed into theaircraft GPS receiver.
- - - REQ or - - - RES message Your ground track is more than ±70° fromyour course to the next GPS waypoint.
History DisplayUpon power up you can see the history of extreme values during previousflight. To do this, hold the STEP button during initial power up of theEDM-900. The bar graph section of the display will show the extremevalue of each measurement for 30 seconds or until you tap the STEPbutton. History cannot be displayed other than at power up. It will remainin the display until RPM exceeds Hobbs On RPM value or the EGT isabove 500°F.
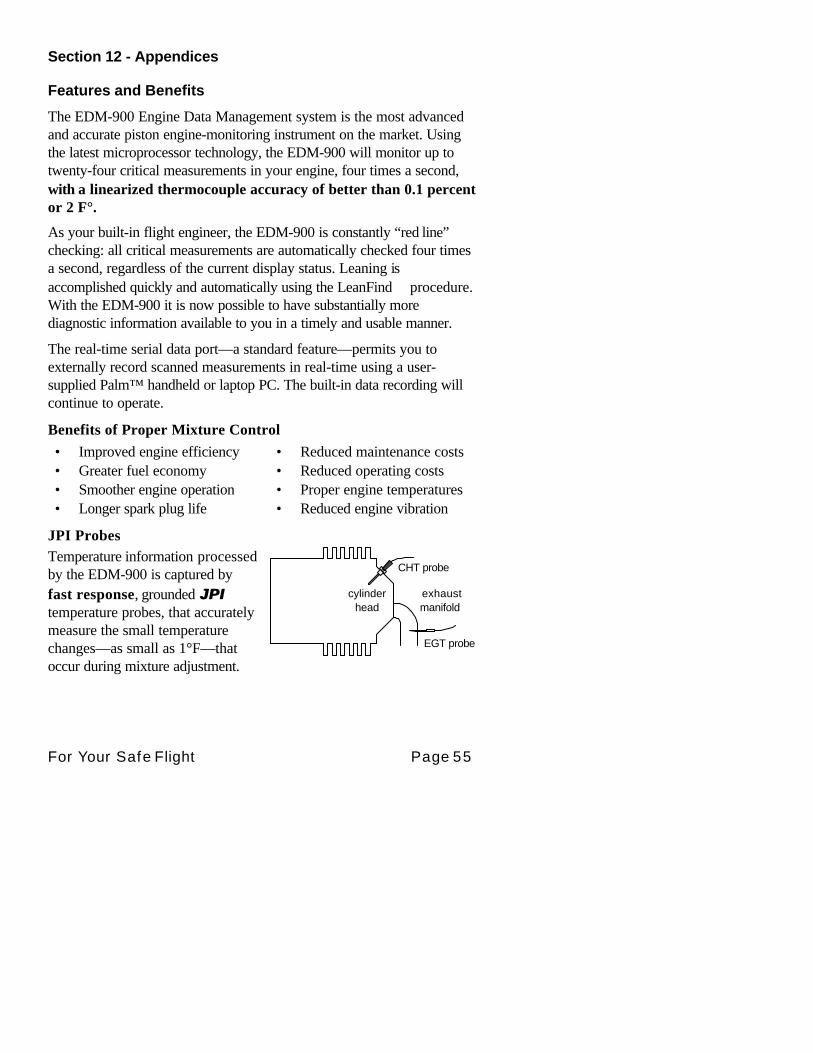
For Your Safe Flight Page 55
Section 12 - Appendices
Features and Benefits
The EDM-900 Engine Data Management system is the most advancedand accurate piston engine-monitoring instrument on the market. Usingthe latest microprocessor technology, the EDM-900 will monitor up totwenty-four critical measurements in your engine, four times a second,with a linearized thermocouple accuracy of better than 0.1 percentor 2 F°.
As your built-in flight engineer, the EDM-900 is constantly “red line”checking: all critical measurements are automatically checked four timesa second, regardless of the current display status. Leaning isaccomplished quickly and automatically using the LeanFind procedure.With the EDM-900 it is now possible to have substantially morediagnostic information available to you in a timely and usable manner.
The real-time serial data port—a standard feature—permits you toexternally record scanned measurements in real-time using a user-supplied Palm™ handheld or laptop PC. The built-in data recording willcontinue to operate.
Benefits of Proper Mixture Control
• Improved engine efficiency • Reduced maintenance costs• Greater fuel economy • Reduced operating costs• Smoother engine operation • Proper engine temperatures• Longer spark plug life • Reduced engine vibration
JPI ProbesTemperature information processedby the EDM-900 is captured byfast response, grounded J P IJ P Itemperature probes, that accuratelymeasure the small temperaturechanges—as small as 1°F—thatoccur during mixture adjustment.
CHT probe
EGT probe
cylinderhead
exhaustmanifold
Page 56 Engine Data Management
Temperature and MixtureIn a piston engine only a small portion of the energy from combustionproduces movement of the piston during the power stroke. The majorityof energy passes into the exhaust pipe as hot gasses. By monitoring thetemperature of these exhaust gasses you will have an indication of thequality of the combustion process. Low compression, non-uniform fueldistribution, faulty ignition, and clogged injectors diminish the efficiency ofthe combustion process that generates power.
From the cockpit you can adjust the fuel/air ratio by a process calledleaning. Retarding the mixture control changes the fuel/air ratio andhence the resulting Exhaust Gas Temperature (EGT).
The following figure depicts the mixture and temperature relationship.
As the mixture is leaned, EGT rises to a peak temperature, and thendrops as the mixture is further leaned. Peak power occurs at a mixtureusing more fuel than at peak EGT. Best economy occurs at peak EGT.Accurate leaning yields optimal engine temperatures. By being able toprecisely adjust the mixture, your engine can produce either the best fueleconomy or maximum power, whichever you choose.

For Your Safe Flight Page 57
A single EGT gauge merely gives you an average of each cylinder’stemperature: some cylinders can be too rich, while others too lean.Variations produced by differences in fuel distribution, ignition, andcompression will cause each cylinder to follow its own mixture andtemperature relationship such that one cylinder will reach peak beforeanother.
EG
T °F
bel
ow p
eak
Per
cent
of b
est p
ower
CH
T °F
cha
nge
from
best
pow
er
Besteconomy
range
Bestpowerrange
0
-200
-100
-300
-20
20
-60
-40
0
-80100
85
90
95
80
EGT
CHT
Percent power
Specific fuel consumption
Overlean
LeanRichFull Rich(Take-off)
Leaner Mixture
PeakPower
First cylinderto peak. UseRich of Peakleaning
Last cylinder topeak. Use Lean ofPeak leaning withGAMI injectors
GAMIspread
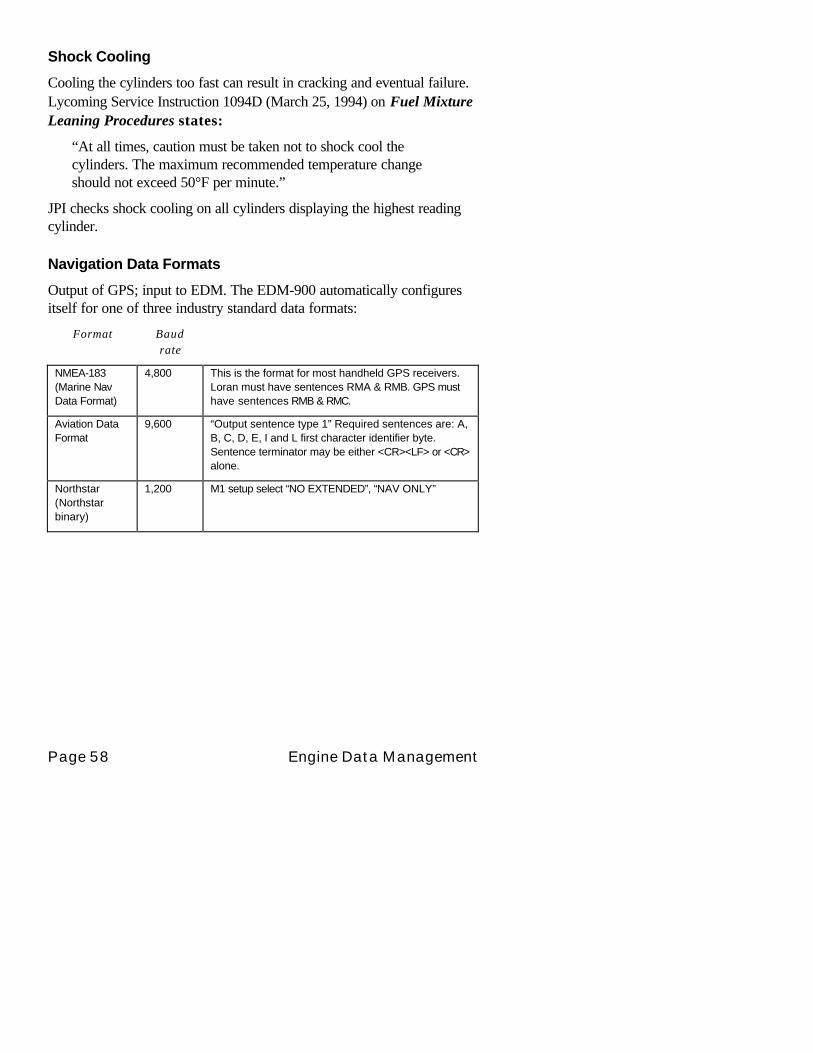
Page 58 Engine Data Management
Shock Cooling
Cooling the cylinders too fast can result in cracking and eventual failure.Lycoming Service Instruction 1094D (March 25, 1994) on Fuel MixtureLeaning Procedures states:
“At all times, caution must be taken not to shock cool thecylinders. The maximum recommended temperature changeshould not exceed 50°F per minute.”
JPI checks shock cooling on all cylinders displaying the highest readingcylinder.
Navigation Data Formats
Output of GPS; input to EDM. The EDM-900 automatically configuresitself for one of three industry standard data formats:
Format Baudrate
NMEA-183(Marine NavData Format)
4,800 This is the format for most handheld GPS receivers.Loran must have sentences RMA & RMB. GPS musthave sentences RMB & RMC.
Aviation DataFormat
9,600 “Output sentence type 1” Required sentences are: A,B, C, D, E, I and L first character identifier byte.Sentence terminator may be either <CR><LF> or <CR>alone.
Northstar(Northstarbinary)
1,200 M1 setup select “NO EXTENDED”, “NAV ONLY”

For Your Safe Flight Page 59
Connector Pin Assignments
P1 Options 25-pin connector P3 MAP-RPM 9-pinconnector
P4 Fuel Flow 15-pinconnector
Pinno.
Pinno.
Probe orfunction
Pinno.
Function/sensor pin
Pinno.
Function
yel 1 red 2 OIL grn 1 RPM sig /1 1 data out toGPS
yel 3 red 4 IND blk 2 RPM grd /2 2 data in fromGPS
yel 5 red 6 CARB (orCDT)*
red 3 RPM pwr /3 3
yel 14 red 15 OAT red 4 MAP pwr /3 wht 4 FF signal
yel 16 red 17 TIT-1 blk 5 MAP grd /1 red 5 FF power
yel 18 red 19 TIT-2(2nd TIT)
6 OIL P sig blk 6 FF ground
gry 12 Remotealert T,V
7 OIL P grd 11 remote FFalarm
red 13 + Power wht 8 MAP sig+ /2 wht 12 FF2 signal
wht 11wht 24
data indata out
grn 9 MAP sig- /4 red 13 FF2 power
blk 25 Engineground
1415
AMPS 2 +AMPS 2 -
*Displays as CRB if IAT probe is not present; displays as CDT is IAT if present.
6
1
9
5
14
1
25
13
9
1
15
8
14
1
25
13
9
1
15
8
P3
P2
P1
P5
P4
Options, power
EGT / CHT
FP / FQ / Amps
FF / GPS
RPM / MAP / OP
View facing rear of instrument
female connector
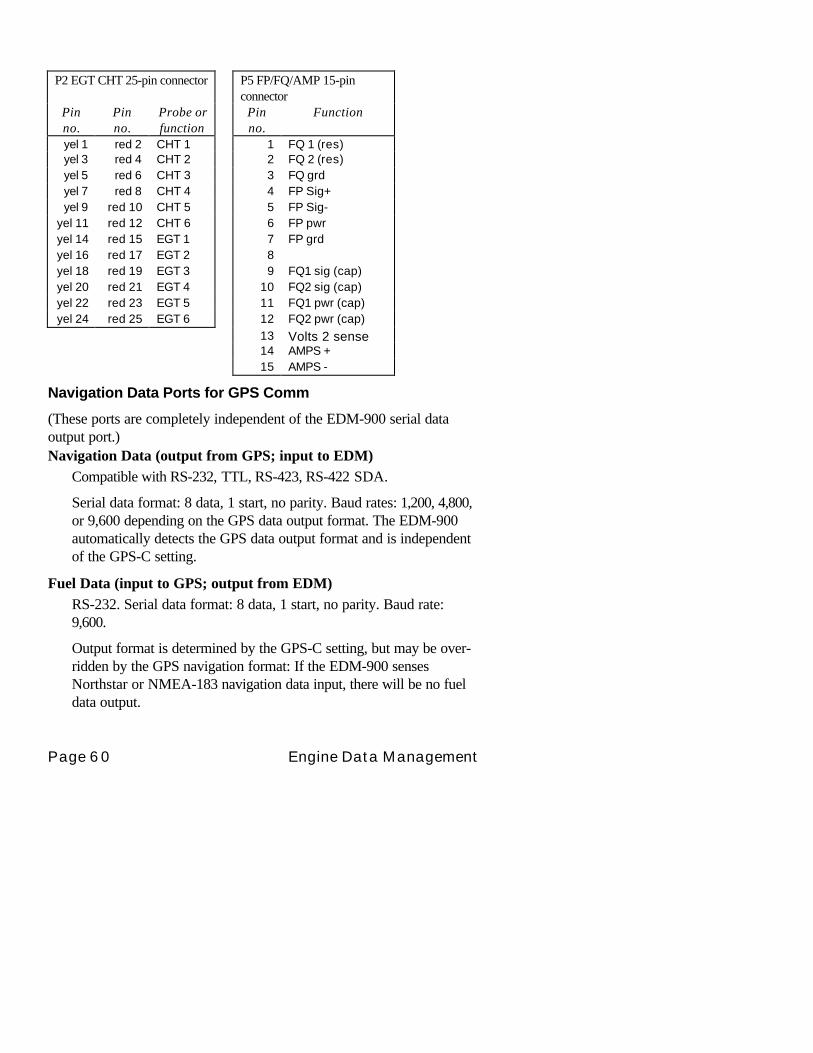
Page 60 Engine Data Management
P2 EGT CHT 25-pin connector P5 FP/FQ/AMP 15-pinconnector
Pinno.
Pinno.
Probe orfunction
Pinno.
Function
yel 1 red 2 CHT 1 1 FQ 1 (res)yel 3 red 4 CHT 2 2 FQ 2 (res)yel 5 red 6 CHT 3 3 FQ grdyel 7 red 8 CHT 4 4 FP Sig+yel 9 red 10 CHT 5 5 FP Sig-
yel 11 red 12 CHT 6 6 FP pwryel 14 red 15 EGT 1 7 FP grdyel 16 red 17 EGT 2 8yel 18 red 19 EGT 3 9 FQ1 sig (cap)yel 20 red 21 EGT 4 10 FQ2 sig (cap)yel 22 red 23 EGT 5 11 FQ1 pwr (cap)yel 24 red 25 EGT 6 12 FQ2 pwr (cap)
13 Volts 2 sense14 AMPS +15 AMPS -
Navigation Data Ports for GPS Comm
(These ports are completely independent of the EDM-900 serial dataoutput port.)Navigation Data (output from GPS; input to EDM)
Compatible with RS-232, TTL, RS-423, RS-422 SDA.
Serial data format: 8 data, 1 start, no parity. Baud rates: 1,200, 4,800,or 9,600 depending on the GPS data output format. The EDM-900automatically detects the GPS data output format and is independentof the GPS-C setting.
Fuel Data (input to GPS; output from EDM)RS-232. Serial data format: 8 data, 1 start, no parity. Baud rate:9,600.
Output format is determined by the GPS-C setting, but may be over-ridden by the GPS navigation format: If the EDM-900 sensesNorthstar or NMEA-183 navigation data input, there will be no fueldata output.
For Your Safe Flight Page 61
Section 13 - Technical Support
J P IJ P I offers both e-mail and telephone technical support. Have your modeland serial number ready when you call. Call J P I J P I for a returnauthorization number before returning any equipment.
J . P . I N S T R U M E N T S I n c .J . P . I N S T R U M E N T S I n c .3185 B AirwayCosta Mesa, CA 92626800 345-4574 [email protected]
Limited Warranty
J.P. Instruments Inc. (JPI) warrants all parts in your new EDM-900 to be free fromdefects in material and workmanship under normal use. Our obligation under thiswarranty is limited to repair or exchange of any defective part of this unit if the part isreturned, shipping prepaid, within two years for electronics and one year for probes fromthe date of original purchase. Installation labor is the responsibility of the aircraft owner.Homebuilt aircraft warranty starts when the aircraft is certified for flight. Replacementparts carry a warranty for the balance of the warranty period.
Under this warranty, JPI is not responsible for any service charges, including removal,installation, nor any other consequential damages. JPI incurs no obligation under thiswarranty unless a Warranty Registration Certificate describing the warranted product hasbeen completed and mailed to JPI with all information requested.
This warranty is void on any product which has been subject to misuse, accident, damagecaused by negligence, damage in transit, handling or modification which, in the opinion ofJPI, has altered or repaired the product in any way that effects the reliability or detractsfrom the performance of the product, or any product whereon the serial number has beenaltered, defaced, effaced or destroyed.
This warranty is in lieu of all other warranties expressed or implied and other obligationsof liability on JPI’s part, and it neither assumes nor authorizes any other person toassume for JPI any other liability in connection with the sale of JPI products.
To initiate this warranty, the aircraft owner must submit a completed Data LoggingWorksheet to JPI. Upon receiving a completed worksheet, JPI will initiate the warrantyfrom the date of original purchase. Any replacement parts carry a warranty that extendsfor the balance of the period of the original warranty. For homebuilt aircraft the warrantystarts when the aircraft is certificated for flight and noted on the warranty card.
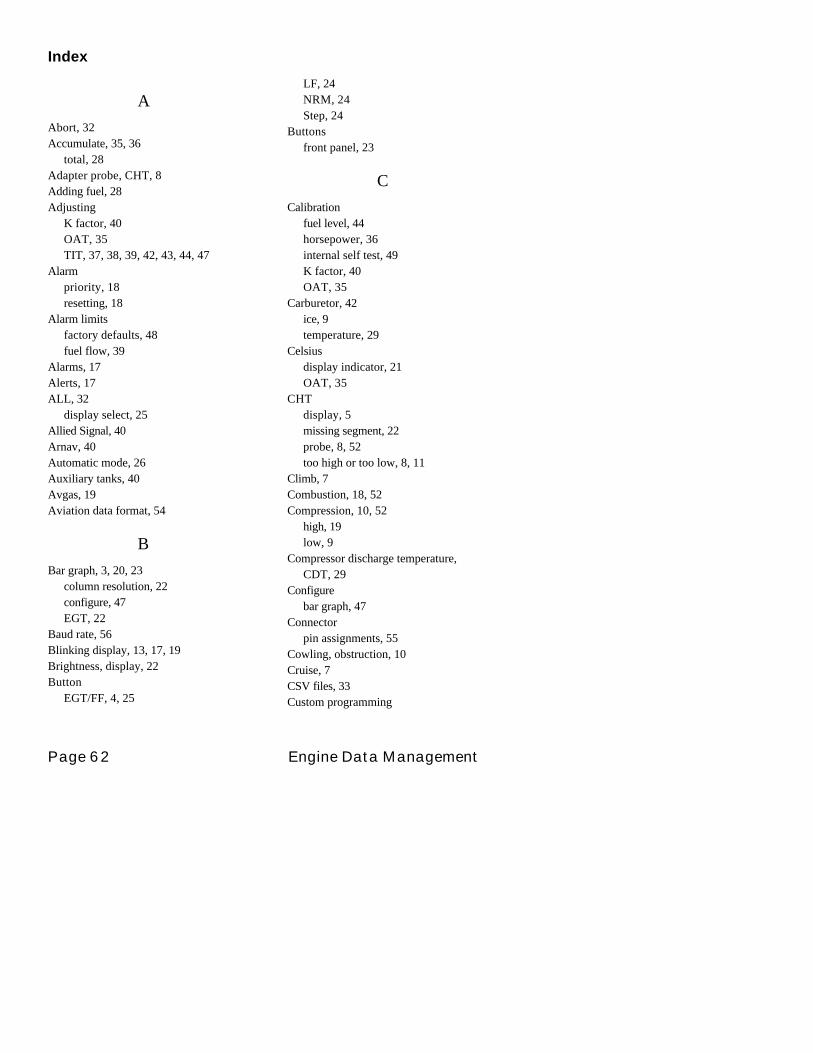
Page 62 Engine Data Management
Index
A
Abort, 32Accumulate, 35, 36
total, 28Adapter probe, CHT, 8Adding fuel, 28Adjusting
K factor, 40OAT, 35TIT, 37, 38, 39, 42, 43, 44, 47
Alarmpriority, 18resetting, 18
Alarm limitsfactory defaults, 48fuel flow, 39
Alarms, 17Alerts, 17ALL, 32
display select, 25Allied Signal, 40Arnav, 40Automatic mode, 26Auxiliary tanks, 40Avgas, 19Aviation data format, 54
B
Bar graph, 3, 20, 23column resolution, 22configure, 47EGT, 22
Baud rate, 56Blinking display, 13, 17, 19Brightness, display, 22Button
EGT/FF, 4, 25
LF, 24NRM, 24Step, 24
Buttonsfront panel, 23
C
Calibrationfuel level, 44horsepower, 36internal self test, 49K factor, 40OAT, 35
Carburetor, 42ice, 9temperature, 29
Celsiusdisplay indicator, 21OAT, 35
CHTdisplay, 5missing segment, 22probe, 8, 52too high or too low, 8, 11
Climb, 7Combustion, 18, 52Compression, 10, 52
high, 19low, 9
Compressor discharge temperature,CDT, 29
Configurebar graph, 47
Connectorpin assignments, 55
Cowling, obstruction, 10Cruise, 7CSV files, 33Custom programming
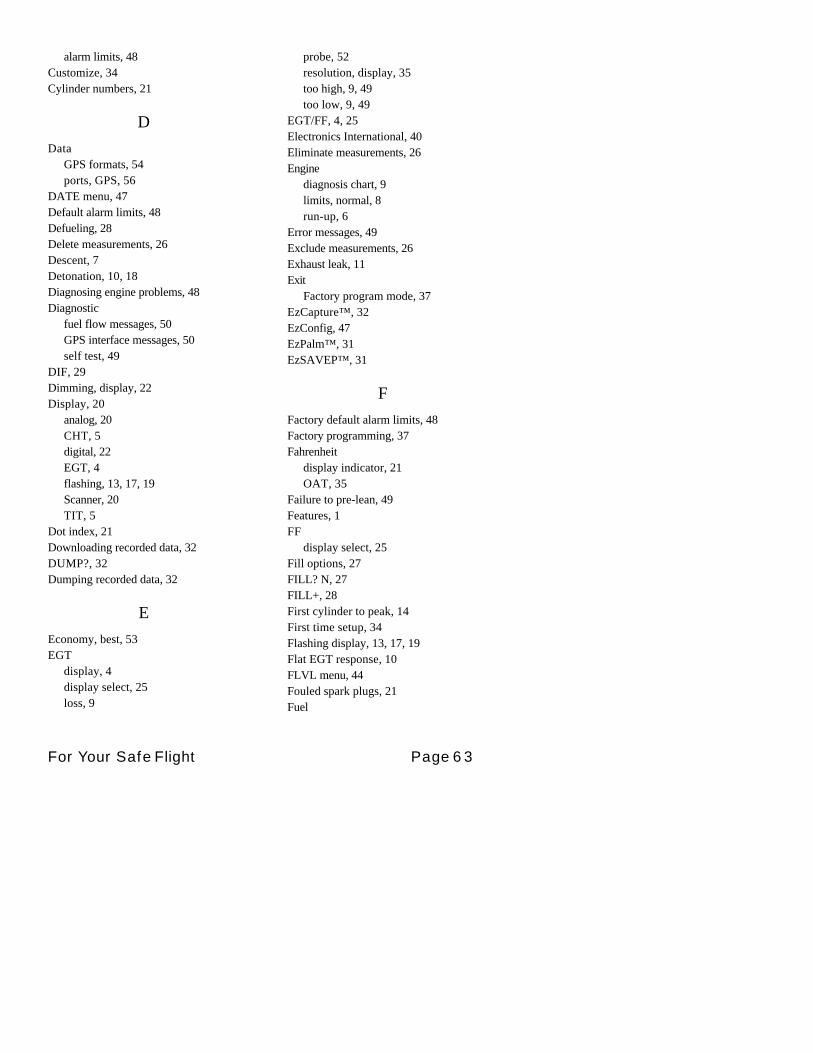
For Your Safe Flight Page 63
alarm limits, 48Customize, 34Cylinder numbers, 21
D
DataGPS formats, 54ports, GPS, 56
DATE menu, 47Default alarm limits, 48Defueling, 28Delete measurements, 26Descent, 7Detonation, 10, 18Diagnosing engine problems, 48Diagnostic
fuel flow messages, 50GPS interface messages, 50self test, 49
DIF, 29Dimming, display, 22Display, 20
analog, 20CHT, 5digital, 22EGT, 4flashing, 13, 17, 19Scanner, 20TIT, 5
Dot index, 21Downloading recorded data, 32DUMP?, 32Dumping recorded data, 32
E
Economy, best, 53EGT
display, 4display select, 25loss, 9
probe, 52resolution, display, 35too high, 9, 49too low, 9, 49
EGT/FF, 4, 25Electronics International, 40Eliminate measurements, 26Engine
diagnosis chart, 9limits, normal, 8run-up, 6
Error messages, 49Exclude measurements, 26Exhaust leak, 11Exit
Factory program mode, 37EzCapture™, 32EzConfig, 47EzPalm™, 31EzSAVEP™, 31
F
Factory default alarm limits, 48Factory programming, 37Fahrenheit
display indicator, 21OAT, 35
Failure to pre-lean, 49Features, 1FF
display select, 25Fill options, 27FILL? N, 27FILL+, 28First cylinder to peak, 14First time setup, 34Flashing display, 13, 17, 19Flat EGT response, 10FLVL menu, 44Fouled spark plugs, 21Fuel

Page 64 Engine Data Management
accumulate, 28adding or filling, 27, 28auxiliary tank capacity, 40capacity, 39injectors, 10injectors, clogged, 7, 9, 52management, 28Octane, 10pump, 10remaining, 29removing, 28required, 29reserve, 29resetting fuel used, 28start up, 2, 27tabs, tank, 40tank capacity, 39used, 30
FUEL DSP, 45Fuel flow, 27
alarm limits, 39connector, 55diagnostics messages, 50
Full throttle, 7
G
GAMI, 11, 13, 16, 17Gasket probe, 8Gasket, manifold, 11Getting started, 2GPS
constant, 40data formats, 54data ports, 56interface diagnostics, 50
H
H.S, 29Hastaloy, 17History, 51
Hobbs®reading, 35set turn-on RPM, 42
Holding a button, 2, 24Horsepower
constant setting, 36Horsepower constant, 36
I
Ice, carburetor or induction, 9Ignition, 10
timing, 9Include measurements, 26Index dot, 21Indexing
scan rate, 35sequence, 29
Induction, 9air temperature, IAT, 29
Informing the EDM-900startup fuel, 27
Injectors. See Fuel, injectorsInstalling
EzPalm™, 31Intake valve, 9Interpreting
data, 6display, 9
Intervalrecord, 42
K
K factordeterming, 40
L
Leakmanifold, 11
Lean of Peak, 16

For Your Safe Flight Page 65
Lean of Peak Leaning, 16Leanest cylinder, 13LeanFind
button, 24mode, 11procedure, 5, 11, 13, 14
Leaning, 52. See also, LeanFindby TIT, 17pre-leaning, 14too quickly, 49
LF. See LeanFindLong Term Memory Option
mark, 30operation, 30
Lotus 123, 30
M
Magneto check, 6Management
fuel, 28Manual mode, 26MAP
display, 3, 19Mark, 30Measurement
indexing, 29Menu
DATE, 47FLVL, 44RECD, 42RPM, 42TEMP, 37, 38, 39, 42, 43, 44, 47TIME, 47USER IDN, 47
Menus, 37Methods
leaning, 11Miles per gallon, 29Misapplications, 48Missing
column, 9
segment, 22Mixture, 14, 52
best economy, 53best power, 53
Modes, 25MPG, MPK, MPL, MPP, 29MS Excel, 30
N
Nautical miles per gallon, 29Navigation data formats, 54NEW, 32NMEA-183, 54NO COM, 51NO SIG, 51NO WPT, 51Normal engine limits, 8Normalize view, 21Northstar binary format, 54NRM, 20
button, 24
O
OATcalibration, 35F or C, 35
Octane, 10OFF, 18, 48Off-scale EGT bars, 49OPEN PRB, 50Operation, 19, 25
fuel flow monitor, 27Option connector, 55
P
Palm handheld, 31Peak EGT, 14PEAK EGT, 13, 15Percent HP, 22

Page 66 Engine Data Management
Percentage view, 20Pilot programming, 34
alarm limits, 48Pin assignments
option connector, 55Power, best, 53Pre-ignition, 10, 18Pre-leaning. See Leaning, pre-leaningPriority
alarm, 18Product support, 57Programming, 34, 37
alarm limits, 48
R
Range, normal temperature, 8Rate
baud, 56fuel flow, 29indexing, 35shock cooling, 7
RECD menu, 42Record interval, 42Recording. See Long Term Memory
OptionRed line, 8REM, 29Remove measurements, 26Removing fuel, 28REQ, 29RES, 29Reset
alarms, 18fuel used, 28
Resolution, EGT display, 35RF, 42Rich of Peak, 11Rough engine, 9RPM, 49
alarm, 39display, 3, 19
menu, 42RS-232, 56Run-up, 6
S
Scannerdisplays, 20
Scanner®, 4Scanning. See IndexingSelf-test, 49. See also DiagnosticSetup, 34
alarm limits, 48Shadin Miniflow, 40Shock cooling, 7, 8, 26, 54SNAP, 30Spark plug
fouling, 6, 9, 21Startup
diagnostics, 49fuel, 2, 27
STEPbutton, 24
Stuck valve, 9
T
Tabs, tank, 40Tachometer. See RPMTake-off, 7Tanks, fuel
capacity, 39tabs, 27, 40
Tapping a button, 2, 24Technical support, 57TEMP menu, 37, 38, 39, 42, 43, 44, 47Test, self, 49TIME menu, 47Time to empty, 29Timing, ignition, 9TIT, 17
display, 5
For Your Safe Flight Page 67
Toggle, N, P, 21Top fuel tanks. See FillTotal
fuel, 28fuel used, 30, 36
Transducer, fuel flow, 29Transferring recorded data, 32Trip total, 28, 36Troubleshooting
engine, 9GPS, 50instrument, 48
Trouibleshootingfuel flow, 50
Turbocharged Engines, 17
U
Uniform, CHT, EGT not, 9Unusable, 44USB adapter, 33USD, 30
reset, 28USER IDN menu, 47
V
Valvelifter, 9stuck, 9
Vapor, 10View
change diagram, 24normalize, percentage, 20
Voltage, 29
W
Warnings, 17Warranty, 57
Z
Zeroing fuel used, 28

Page 68 Engine Data Management
Quick Reference Guide
Normalize View• Hold LF for three seconds.
Percentage View• Hold LF for three seconds.
Automatic Scan1. Tap LF.2. Tap STEP.
Exclude Measurement in AutomaticScan (toggle)1. Tap STEP to index to the
measurement to exclude.2. Tap both STEP and LF.3. See decimal point before
measurement name to exclude.
Change Indexing Rate1. Hold both STEP and LF until
the display shows PROGRAM,followed by FUEL N .
2. Tap STEP, see RATE 4.3. Tap LF to change the number: 1
through 9 is the pause time duringautomatic indexing.0 sets to never index.
4. Tap STEP until you see END Y,then tap STEP to exit
Reset Fuel Used1. Tap STEP and see USD.2. Hold both STEP and LF until
the display shows .0 USD
Transfer Data in Memory1. Connect Palm Computer to the
EDM-900 serial port.2. Hold both STEP and LF until
the display shows PROGRAM,followed by FUEL N .
3. Tap STEP a few times until yousee DUMP? N.
4. Tap LF until you see DUMP NEW orDUMP ALL.
5. On the Palm Computer tapEzPalm, then tap EzCapture.
6. On the EDM-900 tap STEP totransfer. (to abort hold STEP andLF for 5 seconds).
7. On the Palm Computer close thefile with today’s date.
8. Tap STEP to exit.
Totalize Fuel Used1. Hold both STEP and LF until
the display shows PROGRAM,followed by FUEL N .
2. Tap STEP a few times until yousee TR I P ? N.
3. If you want accumulate the fuelused, tap LF and see TR I P ? Y.
4. Tap STEP until you see END Yand tap STEP once more to exit.

For Your Safe Flight Page 69
Filled TanksIn flight, do this first (on power up,skip to step 3):1. Hold both STEP and LF until
the display shows PROGRAM,followed by FUEL N .
2. Tap LF to see F I LL followed byFUEL ? N .
3. Tap LF to see F I LL 75*4. With aux tanks or tabs, tap LF
again to see F I LL I20*5. Tap STEP to exit.
Added or Removed FuelIn flight, do this first (on power up,skip to step 4):1. Hold both STEP and LF until
the display shows PROGRAM,followed by FUEL N .
2. Tap LF 2 or 3 times to seeF I LL +.
3. Tap STEP and see .0 GAL.4. Hold LF to increase or tap LF to
decrease the amount of fueldisplayed.
5. Tap STEP to exit.
Reset Alarm• Temporary reset (next 10
minutes): tap STEP.• Reset for remainder of flight:
hold STEP until the word OFFappears.
Leaning Rich of Peak1. Pre-lean mixture and wait 1
minute.
2. Tap LF and see LEAN R .3. Lean mixture until you see a
column flash and the wordsLEANEST followed by (e.g.,)I545 I 35*
4. Hold LF and see LEANESTfollowed by I560 I3.5*, the peakEGT of the first cylinder to peakand fuel flow.
5. Enrich mixture to set desiredtemperature.
Leaning Lean of Peak1. Pre-lean mixture and wait 1
minute.2. Tap LF and see LEAN R .3. Hold both STEP and LF until
you see LEAN L4. Lean mixture until inverted
columns.5. Continue leaning until you see a
column flash. You will see thetemperature below peak of the lastcylinder to peak and the fuel flow.
6. Hold LF to see RICHEST followedby (e.g.) I 560 I.0* to see peakEGT of the first cylinder to peakand the delta fuel flow (GAMIspread).
7. Enrich mixture to set desiredtemperature.
* Values will vary depending onyour individual installation.