Embed Size (px)
Citation preview
Pay Survey Headline Statistics 2017
Research & Policy Support Fran Boag-Munroe
R011/2017
1
Research and Policy Support Report
R011/2017
PFEW Pay and Morale Survey 2017
Headline Statistics July 2017
Author: Dr Fran Boag-Munroe
Security classification ☒ Not protectively marked May be published openly / immediately
☐ Protected Review whether broader publication
☐ Restricted Not for open publication. Restricted to: …………..
☐ Confidential
Pay Survey Headline Statistics 2017
Research & Policy Support Fran Boag-Munroe
R011/2017
2
Contents
Executive Summary .................................................................................................................... 3
Introduction ............................................................................................................................... 5
Overall Findings .......................................................................................................................... 5
Demographics ........................................................................................................................ 5
Pay and Remuneration .......................................................................................................... 6
Morale .................................................................................................................................. 12
Workload and Responsibilities ............................................................................................ 21
Professional Development ................................................................................................... 22
Pay Survey Headline Statistics 2017
Research & Policy Support Fran Boag-Munroe
R011/2017
3
Executive Summary
Sample and Respondents
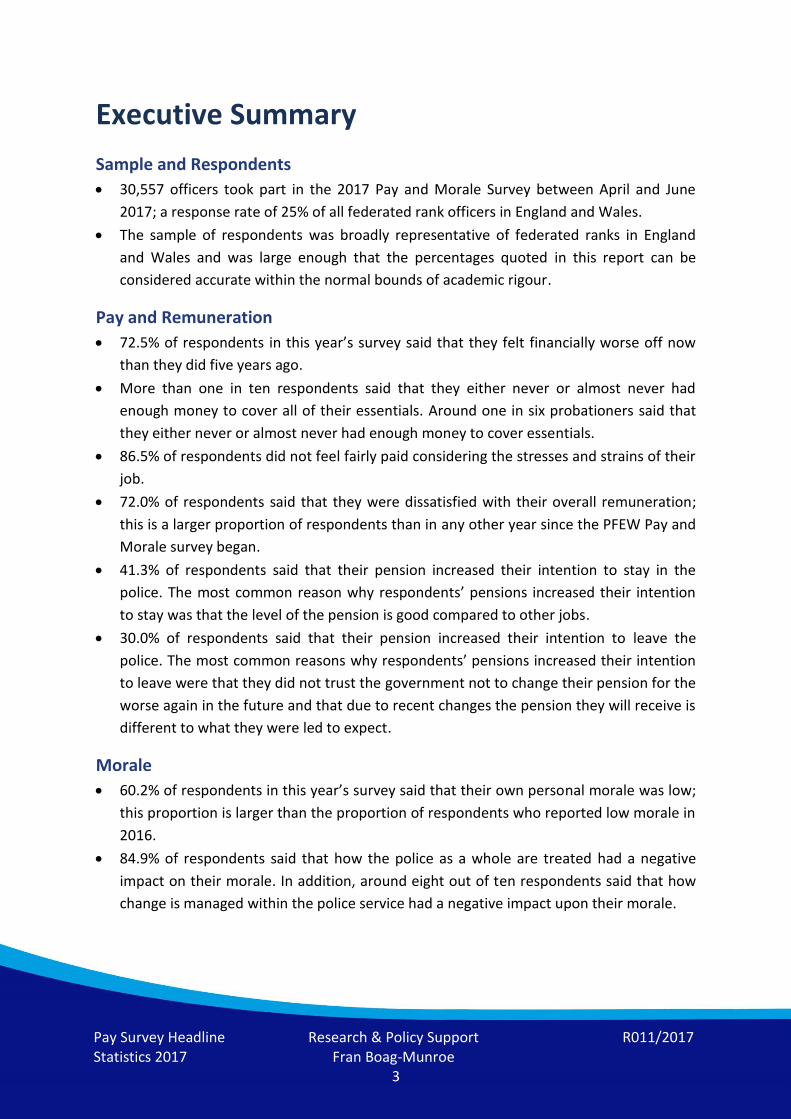
30,557 officers took part in the 2017 Pay and Morale Survey between April and June
2017; a response rate of 25% of all federated rank officers in England and Wales.
The sample of respondents was broadly representative of federated ranks in England
and Wales and was large enough that the percentages quoted in this report can be
considered accurate within the normal bounds of academic rigour.
Pay and Remuneration
72.5% of respondents in this year’s survey said that they felt financially worse off now
than they did five years ago.
More than one in ten respondents said that they either never or almost never had
enough money to cover all of their essentials. Around one in six probationers said that
they either never or almost never had enough money to cover essentials.
86.5% of respondents did not feel fairly paid considering the stresses and strains of their
job.
72.0% of respondents said that they were dissatisfied with their overall remuneration;
this is a larger proportion of respondents than in any other year since the PFEW Pay and
Morale survey began.
41.3% of respondents said that their pension increased their intention to stay in the
police. The most common reason why respondents’ pensions increased their intention
to stay was that the level of the pension is good compared to other jobs.
30.0% of respondents said that their pension increased their intention to leave the
police. The most common reasons why respondents’ pensions increased their intention
to leave were that they did not trust the government not to change their pension for the
worse again in the future and that due to recent changes the pension they will receive is
different to what they were led to expect.
Morale
60.2% of respondents in this year’s survey said that their own personal morale was low;
this proportion is larger than the proportion of respondents who reported low morale in
2016.
84.9% of respondents said that how the police as a whole are treated had a negative
impact on their morale. In addition, around eight out of ten respondents said that how
change is managed within the police service had a negative impact upon their morale.
Pay Survey Headline Statistics 2017
Research & Policy Support Fran Boag-Munroe
R011/2017
4
More than two thirds of respondents said that they did not feel valued in the police and
would not recommend joining the police to others; however 65% of respondents felt
proud to be in the police.
The proportion of respondents who said that they were not treated fairly has increased
in the last year, from 23.6% of respondents in 2016 to 31.6% of respondents in 2017.
12.3% of respondents said that they planned to leave the police either as soon as
possible or within the next two years; respondents’ morale was the factor most likely to
have a major effect on their intention to leave.
Workload and Responsibilities
72.2% of respondents in this year’s survey said that their workload had increased in the
last year; 71.5% said that their responsibilities had increased.
62.2% of respondents said that their workload had been too high in the last 12 months;
this proportion is slightly higher than seen in last year’s survey.
Professional Development
More than a quarter of respondents said that they had not had a Performance and
Development Review (PDR) in the last year and a majority of respondents were
dissatisfied with the PDR process.
79.5% of respondents said that they have not applied for promotion to a higher rank;
the most common reason for not applying for promotion was that it would not be worth
it for the responsibilities and pressures of the role.
More than three quarters of respondents said that “Direct Entry” schemes would have a
negative impact upon policing; most substantially, 82.4% said that Direct Entry at
Inspector would have a negative impact.
34.6% of respondents said that the introduction of Advanced Practitioners would have a
positive impact upon policing, however respondents were more likely to feel that the
introduction of Advanced Practitioners would have a positive rather than a negative
impact.
A majority of respondents said that they would never want to do one of the roles
classified by the National Police Chiefs Council as “hard-to-fill”, including firearms,
custody, public protection (including CSE and domestic violence) or detective role.
More than one in ten respondents currently in a Public Protection role and around one
in five respondents in a Custody role said that they would like to be redeployed as soon
as possible.
Pay Survey Headline Statistics 2017
Research & Policy Support Fran Boag-Munroe
R011/2017
5
Introduction The PFEW Pay and Morale Survey 2017 opened on 18th April 2017, and closed on 9th June
2017. During that time we had responses from 30,557 officers, which were reduced to
30,209 after data cleansing.1 The response rate for the Pay and Morale Survey 2017 was
therefore approximately 25% of all federated rank officers in England and Wales.
Statistically, the sample size was large enough that the percentages quoted in this report
can be considered to be accurate within the normal bounds of academic rigour.2
The following are some key headline findings. Data are still being analysed for the Police
Remuneration Review Body (PRRB) in 2018. More detailed analysis will be provided with the
full report to the PRRB, and will include comparisons of groups such by rank and role; as well
as more complex analysis to determine the factors that best predict officers’ morale and
intention to stay in or leave the police service.
Overall Findings
Demographics Comparison of survey respondents against the police service as a whole in terms of
characteristics including rank, role, gender, ethnicity and region (using Home Office and
HMIC data) indicated that the survey sample was broadly representative of federated ranks
in England and Wales3.
Respondents’ average length of service was 15 years and their average age was 41 years.
11.8% of respondents had worked either as a PCSO or member of police staff prior to
becoming a police officer and 15.8% had been a Special Constable. Overall 30.7% of
respondents were educated to degree level of above and 6.4% had some form of pre-join
policing training prior to becoming a police officer.
60.8%% of respondents said that they had some form of carer responsibilities (including
caring for children, a spouse or relatives); 5.7% of respondents said that they worked part-
time.
1 Data were removed where the respondent gave implausible answers: e.g. said they had been at the top of
their pay scale since 1980; length of time in role exceeded length of service etc. 2 Margin of error of ±1% with a 99% confidence level
3 No statistically significant differences were observed between the survey sample and the federated ranks
population for any of these characteristics. Consequently data were not weighted prior to analysis.
Pay Survey Headline Statistics 2017
Research & Policy Support Fran Boag-Munroe
R011/2017
6
Pay and Remuneration
Cost of living
72.5% of respondents said that they felt financially worse off now than they did five years
ago and 70.5% of respondents who lived in their force area said that the overall cost of
living in that area was either expensive or very expensive. 45.6% of respondents who did not
live in their force area said that the main reason for this was the cost of living in that area.
6.3% of respondents said that they had a second job, however respondents were not asked
what this job was or their main reasons for having a second job.
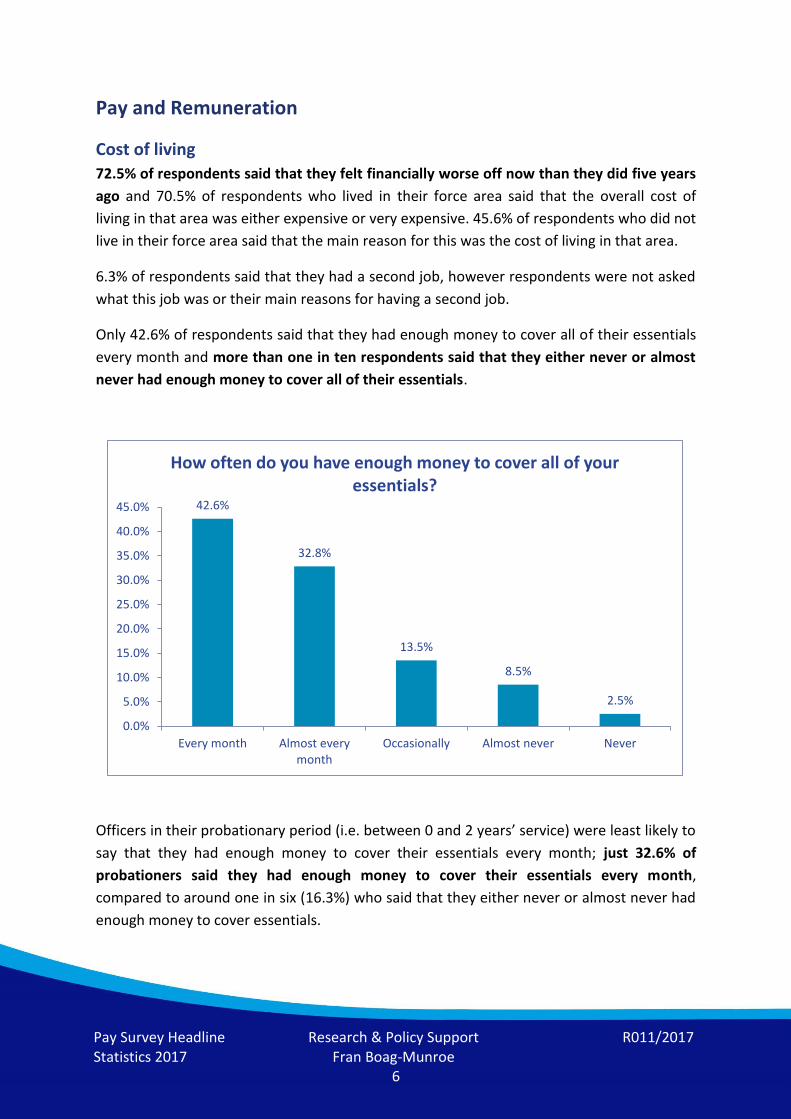
Only 42.6% of respondents said that they had enough money to cover all of their essentials
every month and more than one in ten respondents said that they either never or almost
never had enough money to cover all of their essentials.
Officers in their probationary period (i.e. between 0 and 2 years’ service) were least likely to
say that they had enough money to cover their essentials every month; just 32.6% of
probationers said they had enough money to cover their essentials every month,
compared to around one in six (16.3%) who said that they either never or almost never had
enough money to cover essentials.
42.6%
32.8%
13.5%
8.5%
2.5%
0.0%
5.0%
10.0%
15.0%
20.0%
25.0%
30.0%
35.0%
40.0%
45.0%
Every month Almost everymonth
Occasionally Almost never Never
How often do you have enough money to cover all of your essentials?
Pay Survey Headline Statistics 2017
Research & Policy Support Fran Boag-Munroe
R011/2017
7
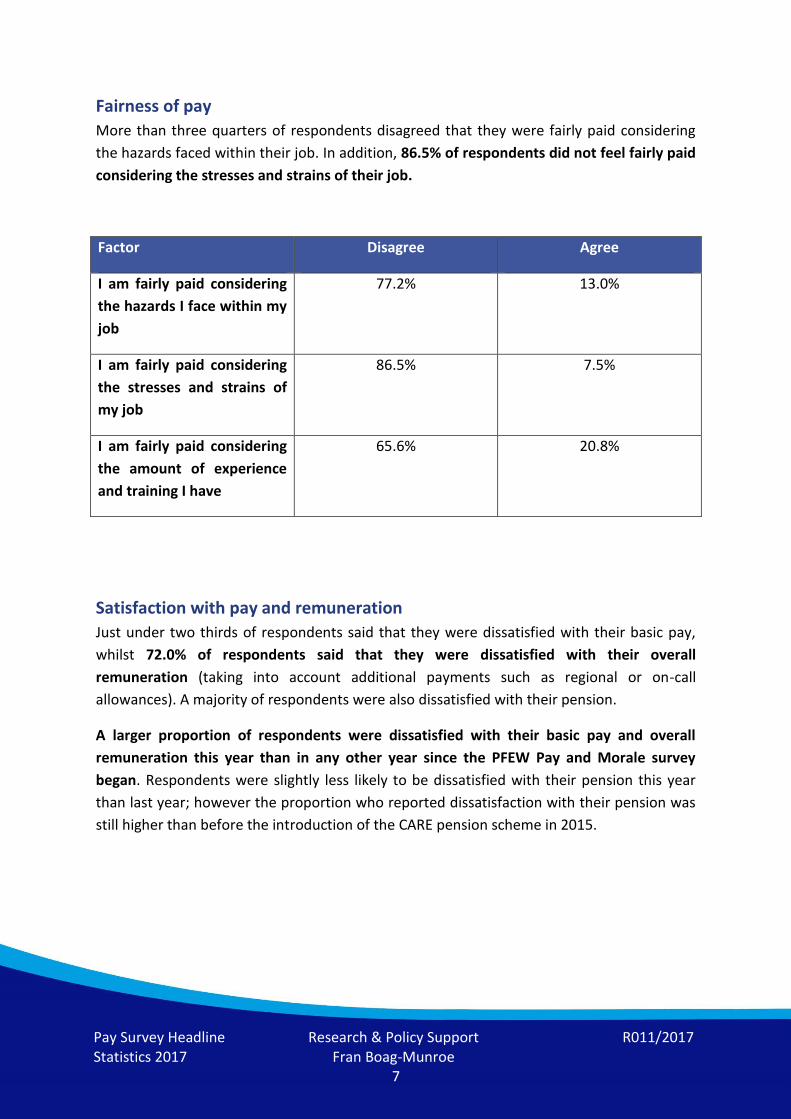
Fairness of pay
More than three quarters of respondents disagreed that they were fairly paid considering
the hazards faced within their job. In addition, 86.5% of respondents did not feel fairly paid
considering the stresses and strains of their job.
Factor Disagree Agree
I am fairly paid considering
the hazards I face within my
job
77.2% 13.0%
I am fairly paid considering
the stresses and strains of
my job
86.5% 7.5%
I am fairly paid considering
the amount of experience
and training I have
65.6% 20.8%
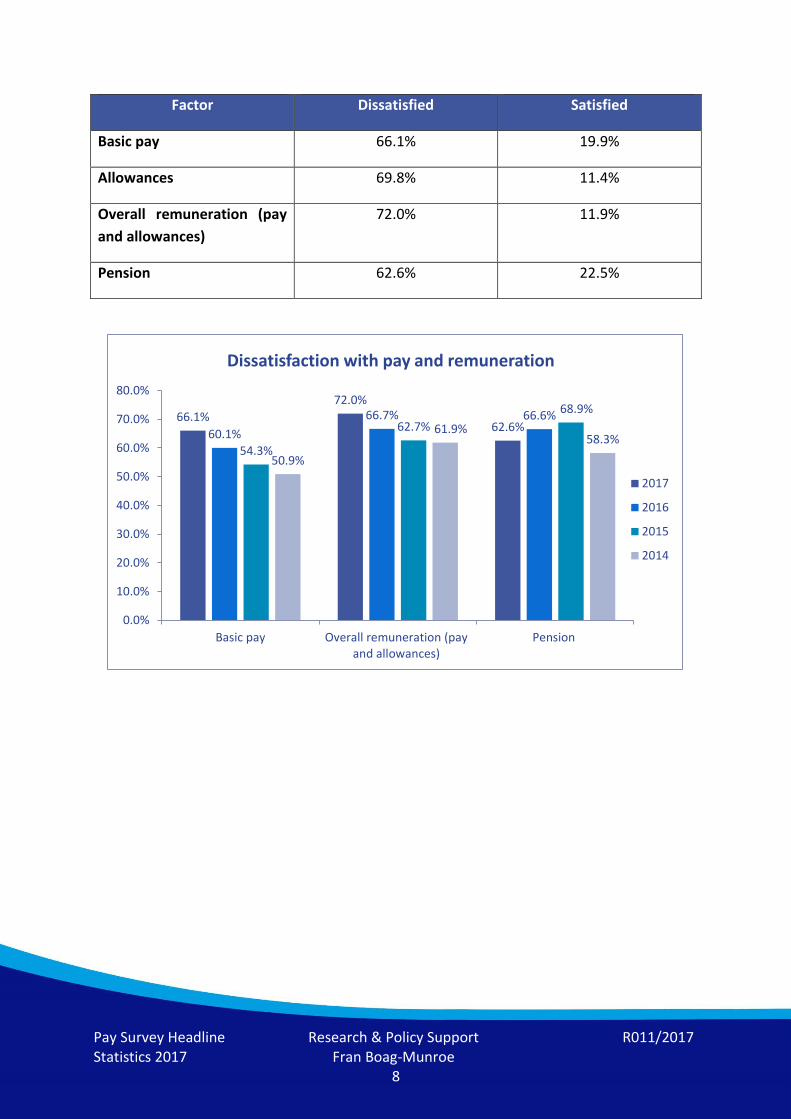
Satisfaction with pay and remuneration
Just under two thirds of respondents said that they were dissatisfied with their basic pay,
whilst 72.0% of respondents said that they were dissatisfied with their overall
remuneration (taking into account additional payments such as regional or on-call
allowances). A majority of respondents were also dissatisfied with their pension.
A larger proportion of respondents were dissatisfied with their basic pay and overall
remuneration this year than in any other year since the PFEW Pay and Morale survey
began. Respondents were slightly less likely to be dissatisfied with their pension this year
than last year; however the proportion who reported dissatisfaction with their pension was
still higher than before the introduction of the CARE pension scheme in 2015.
Pay Survey Headline Statistics 2017
Research & Policy Support Fran Boag-Munroe
R011/2017
8
Factor Dissatisfied Satisfied
Basic pay 66.1% 19.9%
Allowances 69.8% 11.4%
Overall remuneration (pay
and allowances)
72.0% 11.9%
Pension 62.6% 22.5%
66.1%
72.0%
62.6% 60.1%
66.7% 66.6%
54.3%
62.7%
68.9%
50.9%
61.9% 58.3%
0.0%
10.0%
20.0%
30.0%
40.0%
50.0%
60.0%
70.0%
80.0%
Basic pay Overall remuneration (payand allowances)
Pension
Dissatisfaction with pay and remuneration
2017
2016
2015
2014
Pay Survey Headline Statistics 2017
Research & Policy Support Fran Boag-Munroe
R011/2017
9
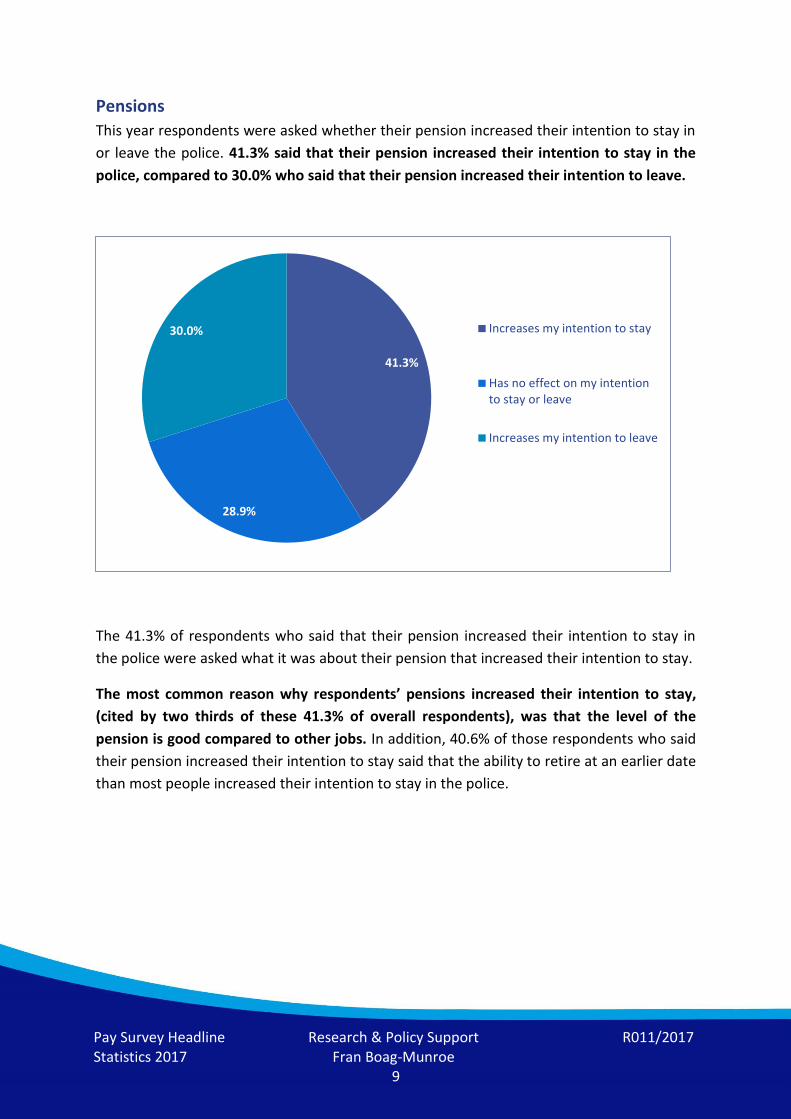
Pensions
This year respondents were asked whether their pension increased their intention to stay in
or leave the police. 41.3% said that their pension increased their intention to stay in the
police, compared to 30.0% who said that their pension increased their intention to leave.
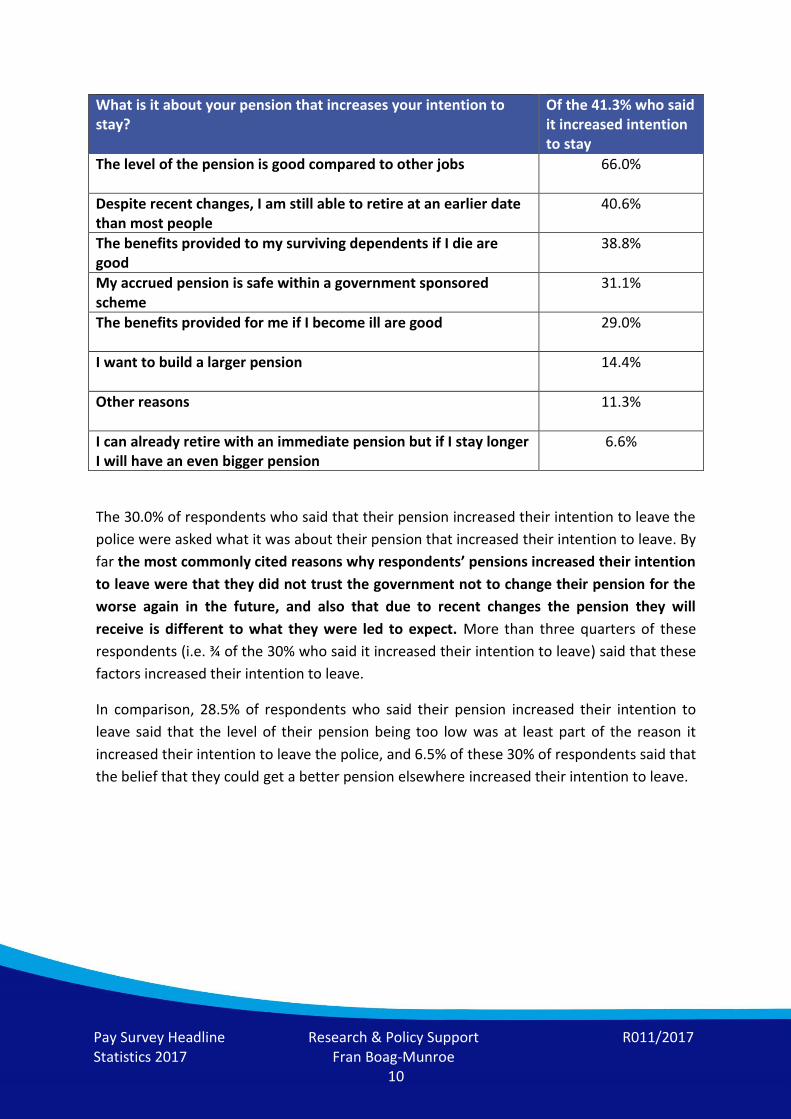
The 41.3% of respondents who said that their pension increased their intention to stay in
the police were asked what it was about their pension that increased their intention to stay.
The most common reason why respondents’ pensions increased their intention to stay,
(cited by two thirds of these 41.3% of overall respondents), was that the level of the
pension is good compared to other jobs. In addition, 40.6% of those respondents who said
their pension increased their intention to stay said that the ability to retire at an earlier date
than most people increased their intention to stay in the police.
41.3%
28.9%
30.0% Increases my intention to stay
Has no effect on my intentionto stay or leave
Increases my intention to leave
Pay Survey Headline Statistics 2017
Research & Policy Support Fran Boag-Munroe
R011/2017
10
What is it about your pension that increases your intention to stay?
Of the 41.3% who said it increased intention to stay
The level of the pension is good compared to other jobs
66.0%
Despite recent changes, I am still able to retire at an earlier date than most people
40.6%
The benefits provided to my surviving dependents if I die are good
38.8%
My accrued pension is safe within a government sponsored scheme
31.1%
The benefits provided for me if I become ill are good
29.0%
I want to build a larger pension
14.4%
Other reasons
11.3%
I can already retire with an immediate pension but if I stay longer I will have an even bigger pension
6.6%
The 30.0% of respondents who said that their pension increased their intention to leave the
police were asked what it was about their pension that increased their intention to leave. By
far the most commonly cited reasons why respondents’ pensions increased their intention
to leave were that they did not trust the government not to change their pension for the
worse again in the future, and also that due to recent changes the pension they will
receive is different to what they were led to expect. More than three quarters of these
respondents (i.e. ¾ of the 30% who said it increased their intention to leave) said that these
factors increased their intention to leave.
In comparison, 28.5% of respondents who said their pension increased their intention to
leave said that the level of their pension being too low was at least part of the reason it
increased their intention to leave the police, and 6.5% of these 30% of respondents said that
the belief that they could get a better pension elsewhere increased their intention to leave.

Pay Survey Headline Statistics 2017
Research & Policy Support Fran Boag-Munroe
R011/2017
11
What is it about your pension that increases your intention to leave?
Of the 30% who said it increased their intention to leave
I don’t trust the government not to change our pensions for the worse again in the future
83.1%
Due to recent changes the pension I will receive is different to what I was led to expect
77.2%
I can’t get an accurate forecast of the pension I can expect to receive when I retire
47.5%
The contributions I have to pay are too high/unaffordable
34.0%
The level of my pension is too low
28.5%
I can’t access the money I pay into a pension if I need to before I retire
12.3%
Other reasons
11.1%
I believe I can get a better pension elsewhere
6.5%
I have reached pension age so can leave with an immediate pension
6.3%
I have to pay too much pension tax (annual allowance)
3.9%
Pay Survey Headline Statistics 2017
Research & Policy Support Fran Boag-Munroe
R011/2017
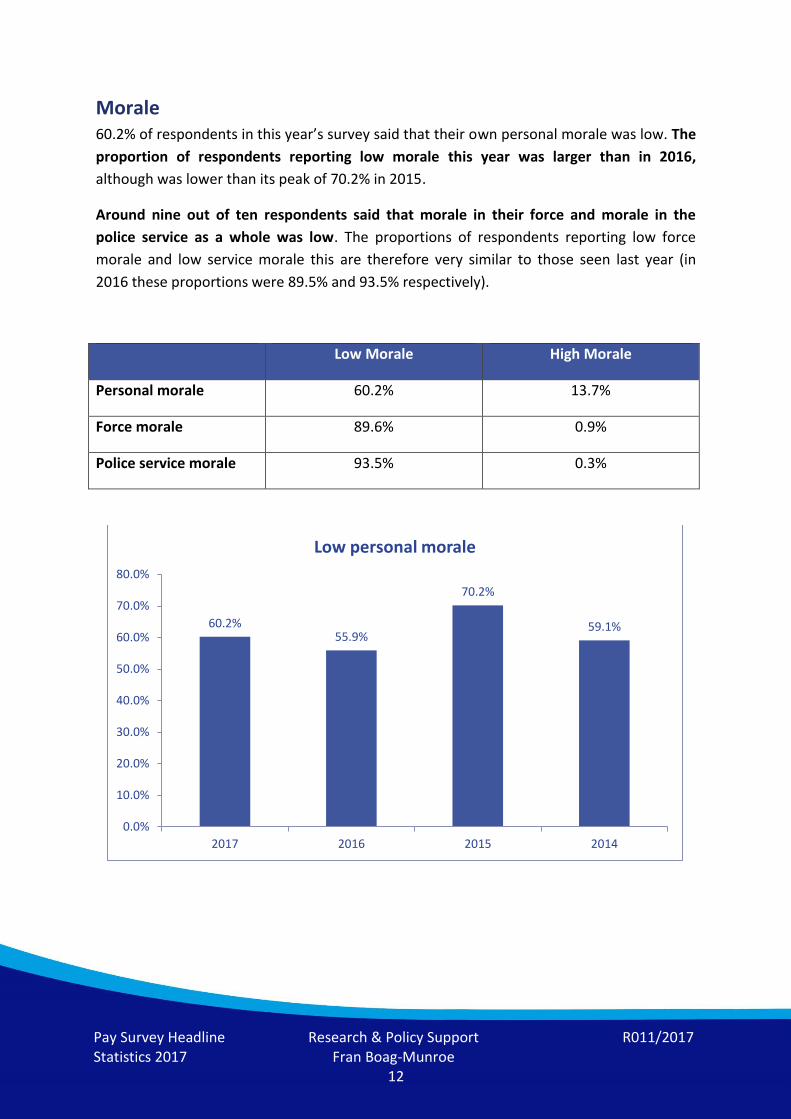
12
Morale 60.2% of respondents in this year’s survey said that their own personal morale was low. The
proportion of respondents reporting low morale this year was larger than in 2016,
although was lower than its peak of 70.2% in 2015.
Around nine out of ten respondents said that morale in their force and morale in the
police service as a whole was low. The proportions of respondents reporting low force
morale and low service morale this are therefore very similar to those seen last year (in
2016 these proportions were 89.5% and 93.5% respectively).
Low Morale High Morale
Personal morale 60.2% 13.7%
Force morale 89.6% 0.9%
Police service morale 93.5% 0.3%
60.2% 55.9%
70.2%
59.1%
0.0%
10.0%
20.0%
30.0%
40.0%
50.0%
60.0%
70.0%
80.0%
2017 2016 2015 2014
Low personal morale
Pay Survey Headline Statistics 2017
Research & Policy Support Fran Boag-Munroe
R011/2017
13
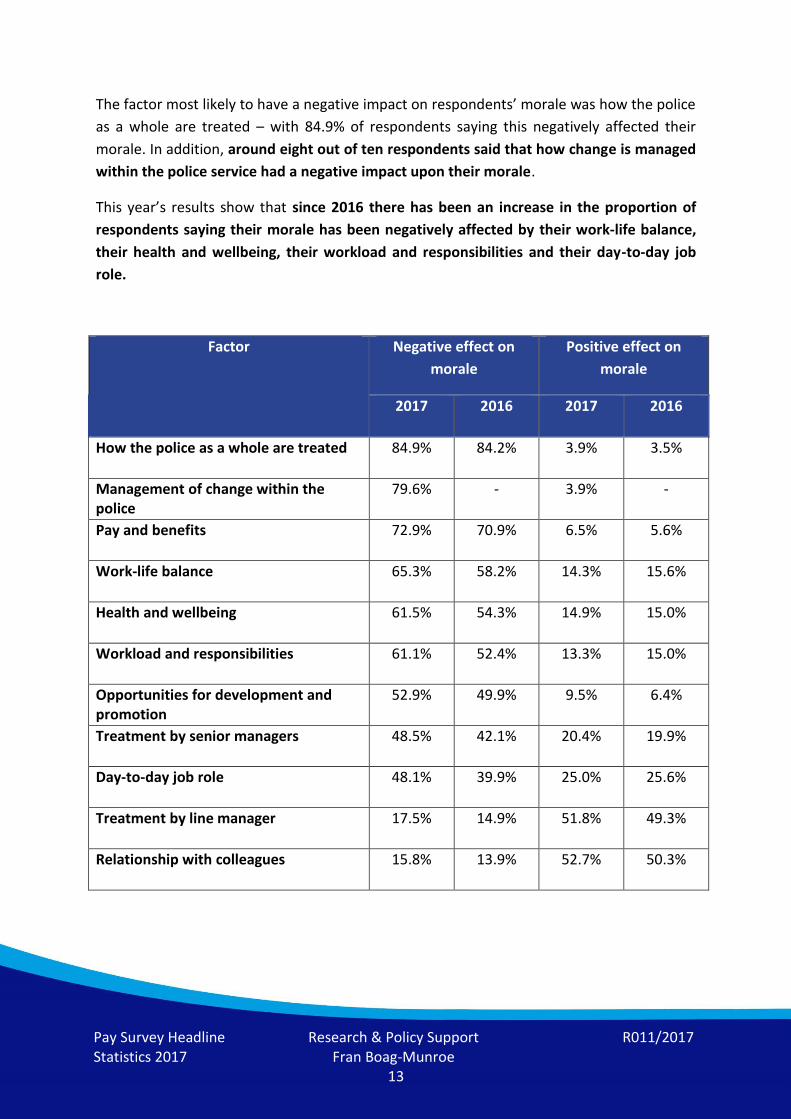
The factor most likely to have a negative impact on respondents’ morale was how the police
as a whole are treated – with 84.9% of respondents saying this negatively affected their
morale. In addition, around eight out of ten respondents said that how change is managed
within the police service had a negative impact upon their morale.
This year’s results show that since 2016 there has been an increase in the proportion of
respondents saying their morale has been negatively affected by their work-life balance,
their health and wellbeing, their workload and responsibilities and their day-to-day job
role.
Factor Negative effect on
morale
Positive effect on
morale
2017 2016 2017 2016
How the police as a whole are treated 84.9% 84.2% 3.9% 3.5%
Management of change within the police
79.6% - 3.9% -
Pay and benefits 72.9% 70.9% 6.5% 5.6%
Work-life balance 65.3% 58.2% 14.3% 15.6%
Health and wellbeing 61.5% 54.3% 14.9% 15.0%
Workload and responsibilities 61.1% 52.4% 13.3% 15.0%
Opportunities for development and promotion
52.9% 49.9% 9.5% 6.4%
Treatment by senior managers 48.5% 42.1% 20.4% 19.9%
Day-to-day job role 48.1% 39.9% 25.0% 25.6%
Treatment by line manager 17.5% 14.9% 51.8% 49.3%
Relationship with colleagues 15.8% 13.9% 52.7% 50.3%
Pay Survey Headline Statistics 2017
Research & Policy Support Fran Boag-Munroe
R011/2017
14
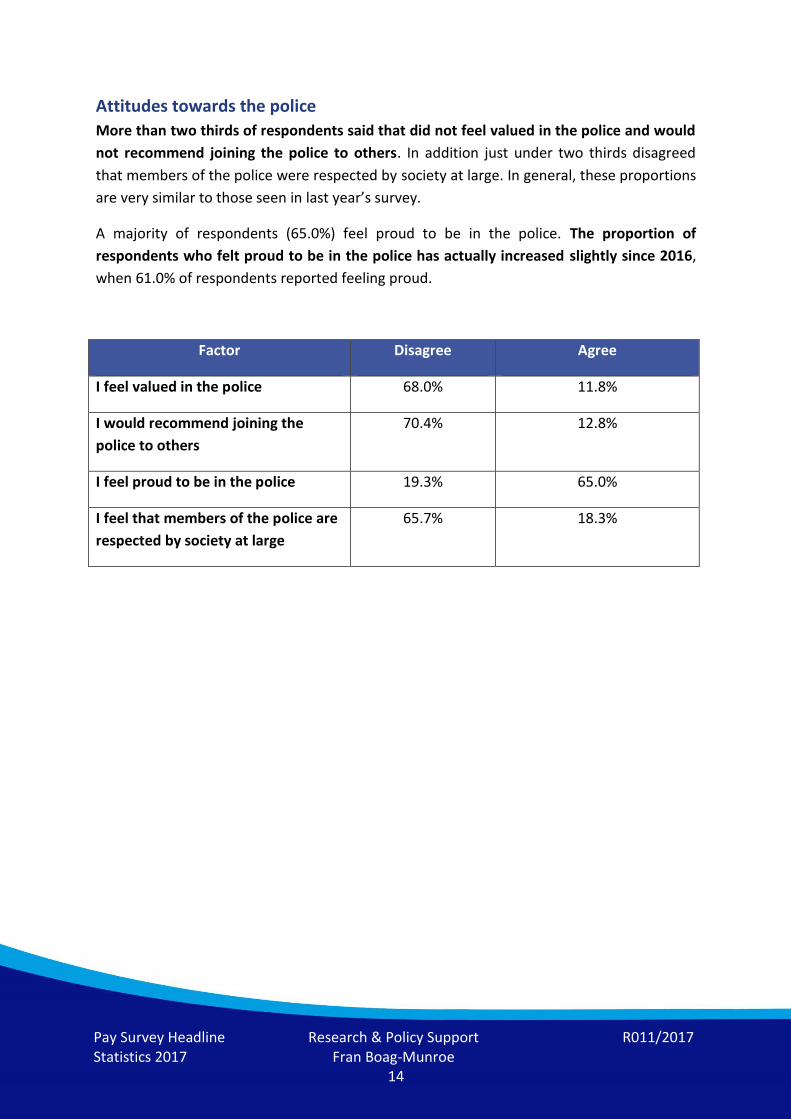
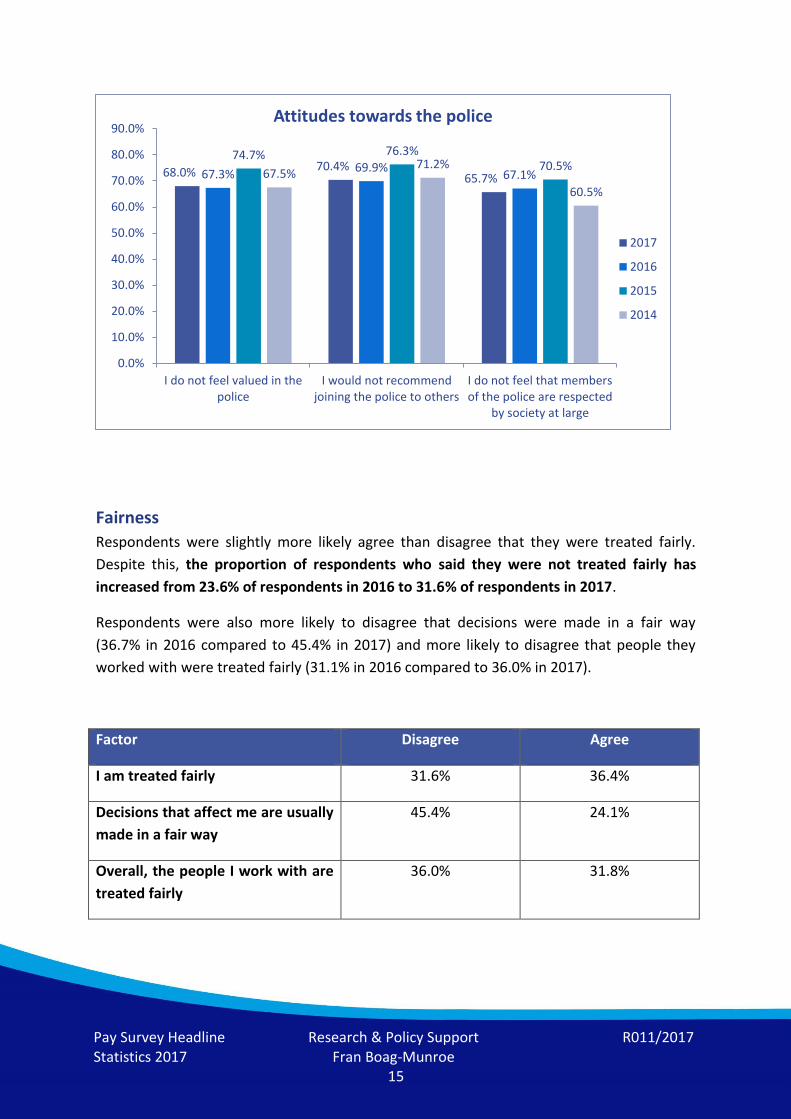
Attitudes towards the police
More than two thirds of respondents said that did not feel valued in the police and would
not recommend joining the police to others. In addition just under two thirds disagreed
that members of the police were respected by society at large. In general, these proportions
are very similar to those seen in last year’s survey.
A majority of respondents (65.0%) feel proud to be in the police. The proportion of
respondents who felt proud to be in the police has actually increased slightly since 2016,
when 61.0% of respondents reported feeling proud.
Factor Disagree Agree
I feel valued in the police 68.0% 11.8%
I would recommend joining the
police to others
70.4% 12.8%
I feel proud to be in the police 19.3% 65.0%
I feel that members of the police are
respected by society at large
65.7% 18.3%
Pay Survey Headline Statistics 2017
Research & Policy Support Fran Boag-Munroe
R011/2017
15
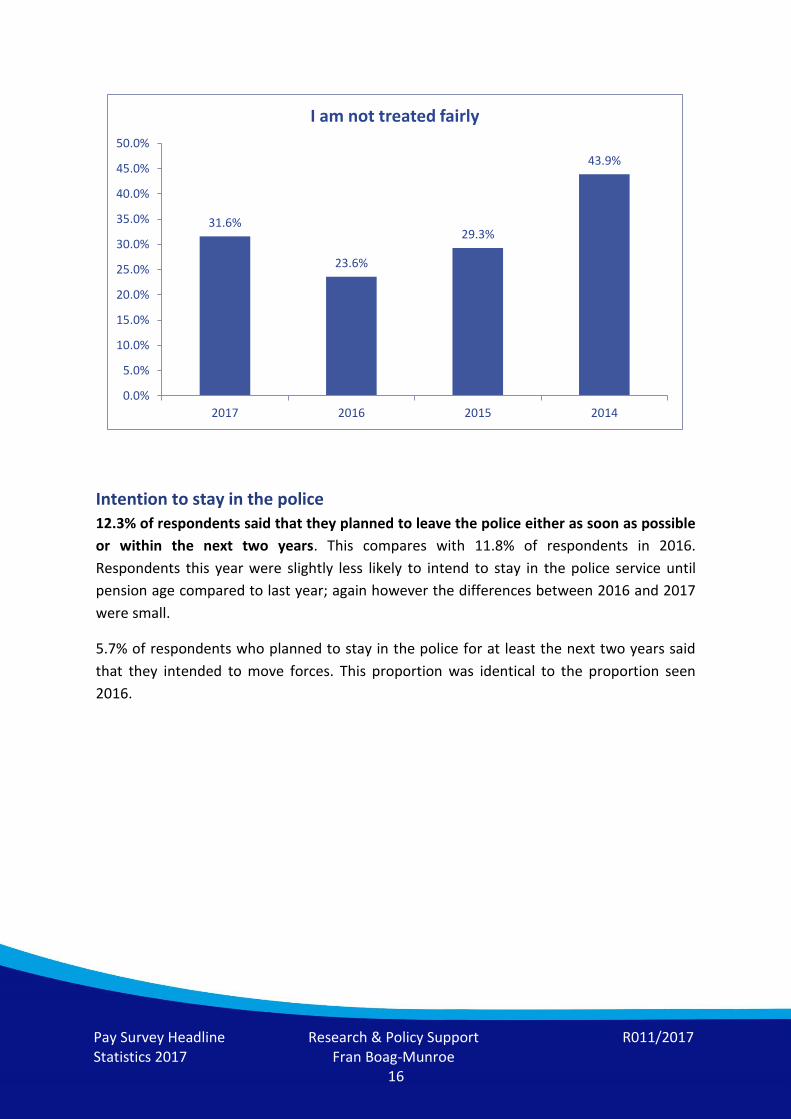
Fairness
Respondents were slightly more likely agree than disagree that they were treated fairly.
Despite this, the proportion of respondents who said they were not treated fairly has
increased from 23.6% of respondents in 2016 to 31.6% of respondents in 2017.
Respondents were also more likely to disagree that decisions were made in a fair way
(36.7% in 2016 compared to 45.4% in 2017) and more likely to disagree that people they
worked with were treated fairly (31.1% in 2016 compared to 36.0% in 2017).
Factor Disagree Agree
I am treated fairly 31.6% 36.4%
Decisions that affect me are usually
made in a fair way
45.4% 24.1%
Overall, the people I work with are
treated fairly
36.0% 31.8%
68.0% 70.4% 65.7% 67.3%
69.9% 67.1%
74.7% 76.3% 70.5%
67.5% 71.2%
60.5%
0.0%
10.0%
20.0%
30.0%
40.0%
50.0%
60.0%
70.0%
80.0%
90.0%
I do not feel valued in thepolice
I would not recommendjoining the police to others
I do not feel that membersof the police are respected
by society at large
Attitudes towards the police
2017
2016
2015
2014
Pay Survey Headline Statistics 2017
Research & Policy Support Fran Boag-Munroe
R011/2017
16
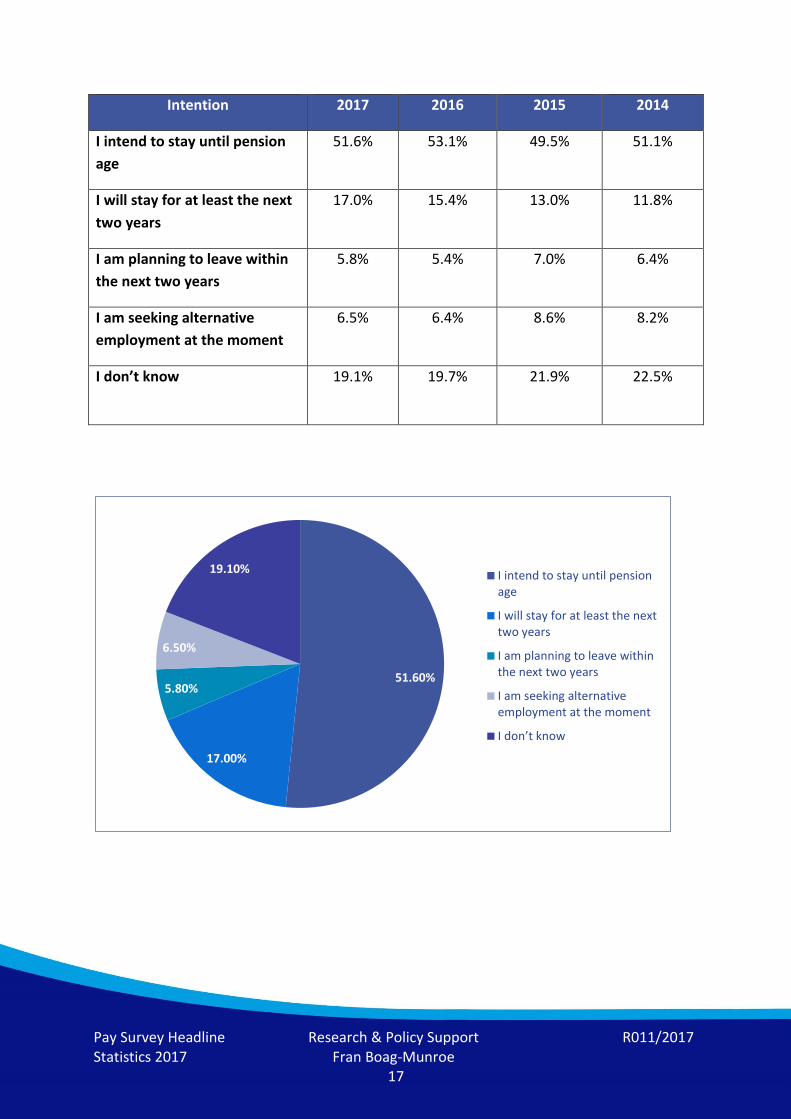
Intention to stay in the police
12.3% of respondents said that they planned to leave the police either as soon as possible
or within the next two years. This compares with 11.8% of respondents in 2016.
Respondents this year were slightly less likely to intend to stay in the police service until
pension age compared to last year; again however the differences between 2016 and 2017
were small.
5.7% of respondents who planned to stay in the police for at least the next two years said
that they intended to move forces. This proportion was identical to the proportion seen
2016.
31.6%
23.6%
29.3%
43.9%
0.0%
5.0%
10.0%
15.0%
20.0%
25.0%
30.0%
35.0%
40.0%
45.0%
50.0%
2017 2016 2015 2014
I am not treated fairly
Pay Survey Headline Statistics 2017
Research & Policy Support Fran Boag-Munroe
R011/2017
17
Intention 2017 2016 2015 2014
I intend to stay until pension
age
51.6% 53.1% 49.5% 51.1%
I will stay for at least the next
two years
17.0% 15.4% 13.0% 11.8%
I am planning to leave within
the next two years
5.8% 5.4% 7.0% 6.4%
I am seeking alternative
employment at the moment
6.5% 6.4% 8.6% 8.2%
I don’t know 19.1% 19.7% 21.9% 22.5%
51.60%
17.00%
5.80%
6.50%
19.10% I intend to stay until pensionage
I will stay for at least the nexttwo years
I am planning to leave withinthe next two years
I am seeking alternativeemployment at the moment
I don’t know
Pay Survey Headline Statistics 2017
Research & Policy Support Fran Boag-Munroe
R011/2017
18
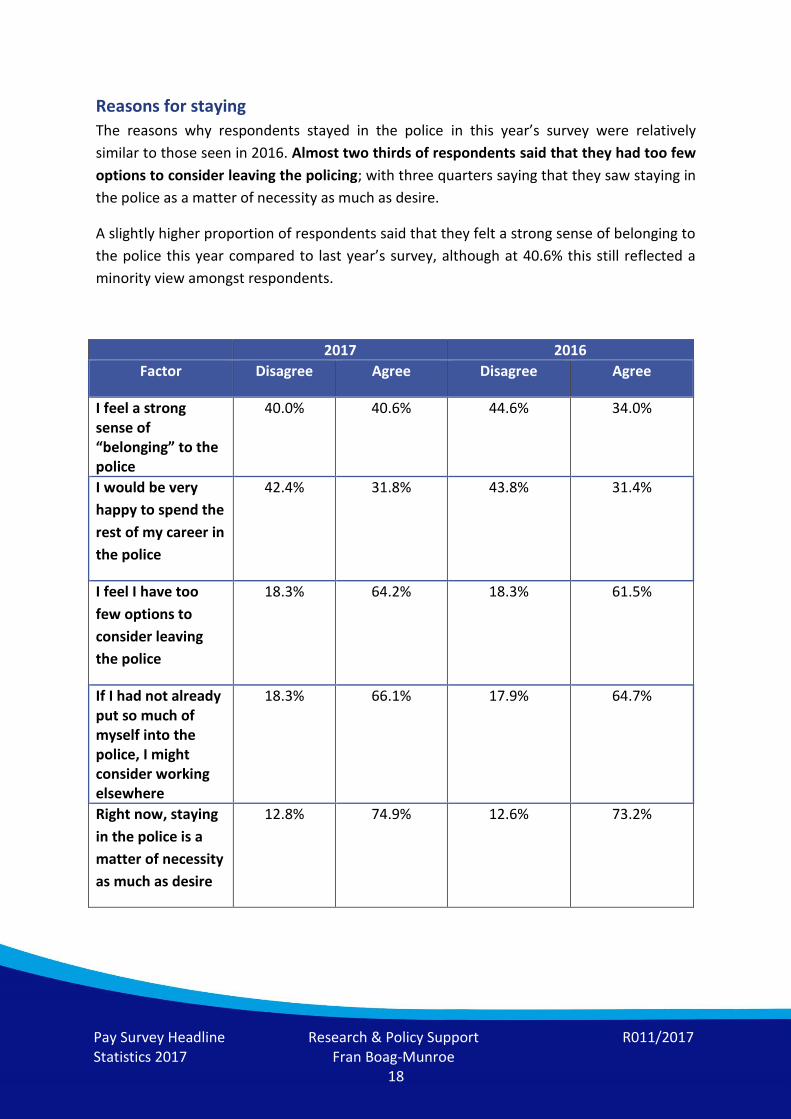
Reasons for staying
The reasons why respondents stayed in the police in this year’s survey were relatively
similar to those seen in 2016. Almost two thirds of respondents said that they had too few
options to consider leaving the policing; with three quarters saying that they saw staying in
the police as a matter of necessity as much as desire.
A slightly higher proportion of respondents said that they felt a strong sense of belonging to
the police this year compared to last year’s survey, although at 40.6% this still reflected a
minority view amongst respondents.
2017 2016
Factor Disagree Agree Disagree Agree
I feel a strong sense of “belonging” to the police
40.0% 40.6% 44.6% 34.0%
I would be very
happy to spend the
rest of my career in
the police
42.4% 31.8% 43.8% 31.4%
I feel I have too
few options to
consider leaving
the police
18.3% 64.2% 18.3% 61.5%
If I had not already put so much of myself into the police, I might consider working elsewhere
18.3% 66.1% 17.9% 64.7%
Right now, staying
in the police is a
matter of necessity
as much as desire
12.8% 74.9% 12.6% 73.2%
Pay Survey Headline Statistics 2017
Research & Policy Support Fran Boag-Munroe
R011/2017
19
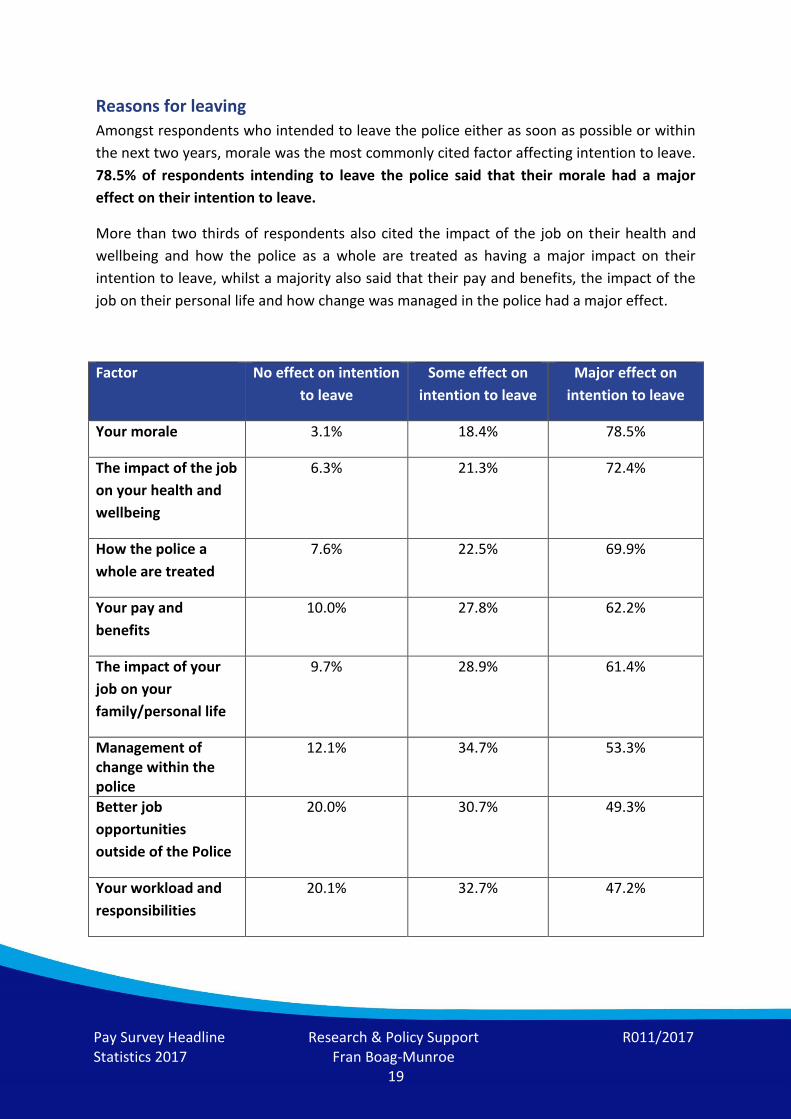
Reasons for leaving
Amongst respondents who intended to leave the police either as soon as possible or within
the next two years, morale was the most commonly cited factor affecting intention to leave.
78.5% of respondents intending to leave the police said that their morale had a major
effect on their intention to leave.
More than two thirds of respondents also cited the impact of the job on their health and
wellbeing and how the police as a whole are treated as having a major impact on their
intention to leave, whilst a majority also said that their pay and benefits, the impact of the
job on their personal life and how change was managed in the police had a major effect.
Factor No effect on intention
to leave
Some effect on
intention to leave
Major effect on
intention to leave
Your morale 3.1% 18.4% 78.5%
The impact of the job
on your health and
wellbeing
6.3% 21.3% 72.4%
How the police a
whole are treated
7.6% 22.5% 69.9%
Your pay and
benefits
10.0% 27.8% 62.2%
The impact of your
job on your
family/personal life
9.7% 28.9% 61.4%
Management of change within the police
12.1% 34.7% 53.3%
Better job
opportunities
outside of the Police
20.0% 30.7% 49.3%
Your workload and
responsibilities
20.1% 32.7% 47.2%

Pay Survey Headline Statistics 2017
Research & Policy Support Fran Boag-Munroe
R011/2017
20
Your opportunities
for development and
promotion
26.4% 28.5% 45.1%
Dissatisfaction with
your day-to-day job
role
20.5% 35.3% 44.2%
Your treatment by senior managers
23.9% 34.9% 41.2%
Your treatment by
your line manager
59.1% 24.5% 16.4%
Your relationship
with your colleagues
67.3% 23.5% 9.2%
Respondents were slightly less likely to say that their morale, the treatment of the police as
a whole and their pay and benefits had a major effect on their intention to leave in this
year’s survey. However, overall there has been limited change in the last year in the factors
most likely to affect respondents’ intention to leave the police, and the four most common
reasons for leaving are unchanged since 2016.
78.5%
69.9% 72.4%
62.2%
81.7% 77.6%
69.4% 67.6%
82.9% 79.8%
69.8%
58.6%
0.0%
10.0%
20.0%
30.0%
40.0%
50.0%
60.0%
70.0%
80.0%
90.0%
Your morale How the police awhole are treated
The impact of the jobon your health and
wellbeing
Your pay andbenefits
Major impact on intention to leave
2017
2016
2015
Pay Survey Headline Statistics 2017
Research & Policy Support Fran Boag-Munroe
R011/2017
21
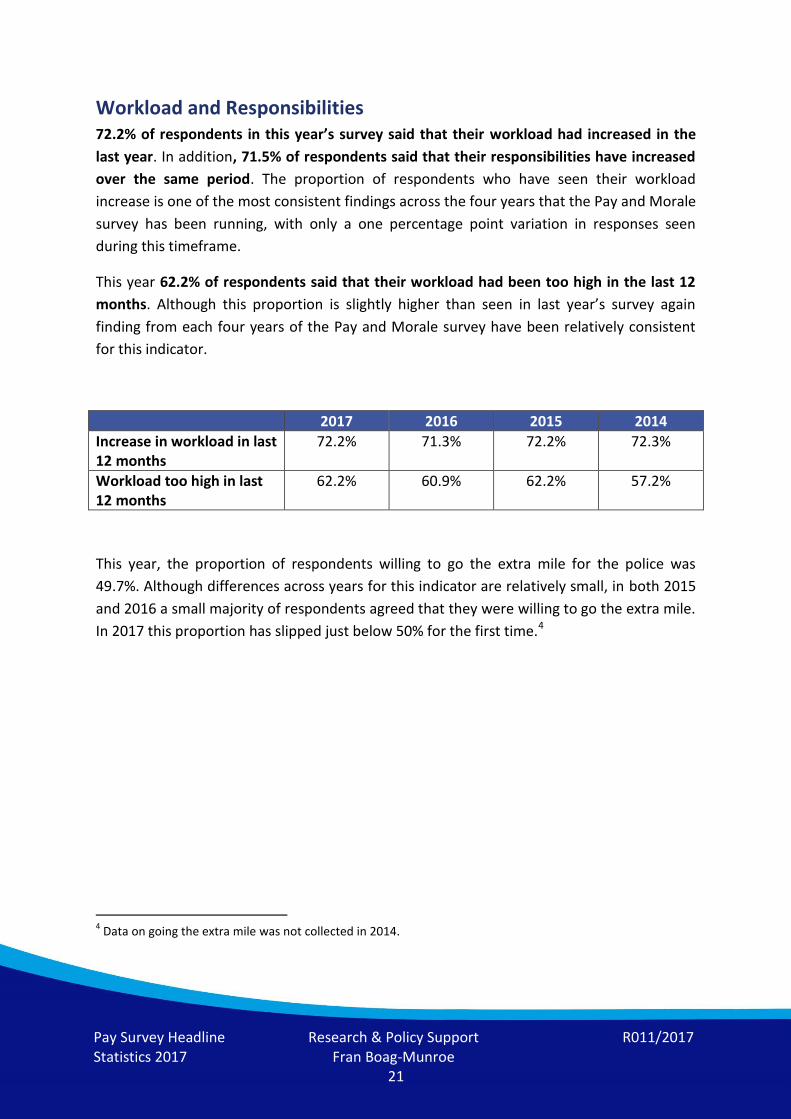
Workload and Responsibilities 72.2% of respondents in this year’s survey said that their workload had increased in the
last year. In addition, 71.5% of respondents said that their responsibilities have increased
over the same period. The proportion of respondents who have seen their workload
increase is one of the most consistent findings across the four years that the Pay and Morale
survey has been running, with only a one percentage point variation in responses seen
during this timeframe.
This year 62.2% of respondents said that their workload had been too high in the last 12
months. Although this proportion is slightly higher than seen in last year’s survey again
finding from each four years of the Pay and Morale survey have been relatively consistent
for this indicator.
2017 2016 2015 2014
Increase in workload in last 12 months
72.2% 71.3% 72.2% 72.3%
Workload too high in last 12 months
62.2% 60.9% 62.2% 57.2%
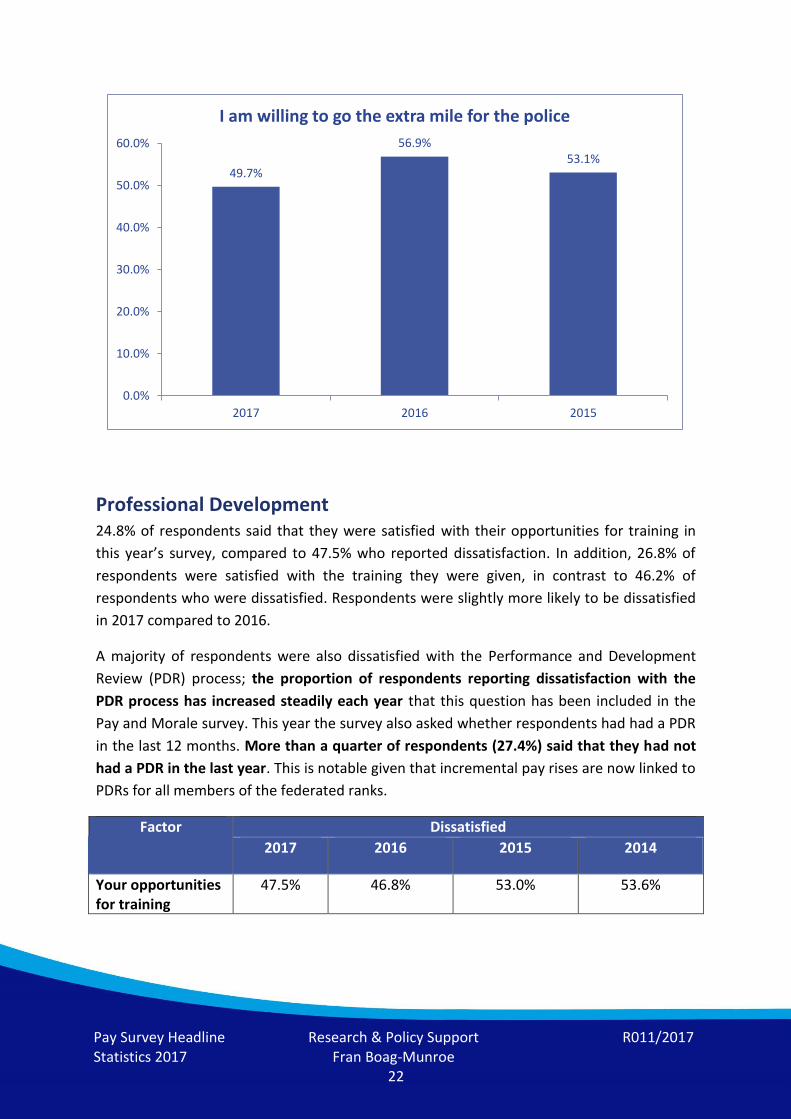
This year, the proportion of respondents willing to go the extra mile for the police was
49.7%. Although differences across years for this indicator are relatively small, in both 2015
and 2016 a small majority of respondents agreed that they were willing to go the extra mile.
In 2017 this proportion has slipped just below 50% for the first time.4
4 Data on going the extra mile was not collected in 2014.
Pay Survey Headline Statistics 2017
Research & Policy Support Fran Boag-Munroe
R011/2017
22
Professional Development 24.8% of respondents said that they were satisfied with their opportunities for training in
this year’s survey, compared to 47.5% who reported dissatisfaction. In addition, 26.8% of
respondents were satisfied with the training they were given, in contrast to 46.2% of
respondents who were dissatisfied. Respondents were slightly more likely to be dissatisfied
in 2017 compared to 2016.
A majority of respondents were also dissatisfied with the Performance and Development
Review (PDR) process; the proportion of respondents reporting dissatisfaction with the
PDR process has increased steadily each year that this question has been included in the
Pay and Morale survey. This year the survey also asked whether respondents had had a PDR
in the last 12 months. More than a quarter of respondents (27.4%) said that they had not
had a PDR in the last year. This is notable given that incremental pay rises are now linked to
PDRs for all members of the federated ranks.
Factor Dissatisfied
2017 2016 2015 2014
Your opportunities for training
47.5% 46.8% 53.0% 53.6%
49.7%
56.9% 53.1%
0.0%
10.0%
20.0%
30.0%
40.0%
50.0%
60.0%
2017 2016 2015
I am willing to go the extra mile for the police
Pay Survey Headline Statistics 2017
Research & Policy Support Fran Boag-Munroe
R011/2017
23
The training you are given
46.2% 42.6% 50.0% 46.7%
Performance and Development Review (PDR) process
56.6% 51.1% 48.3% -5
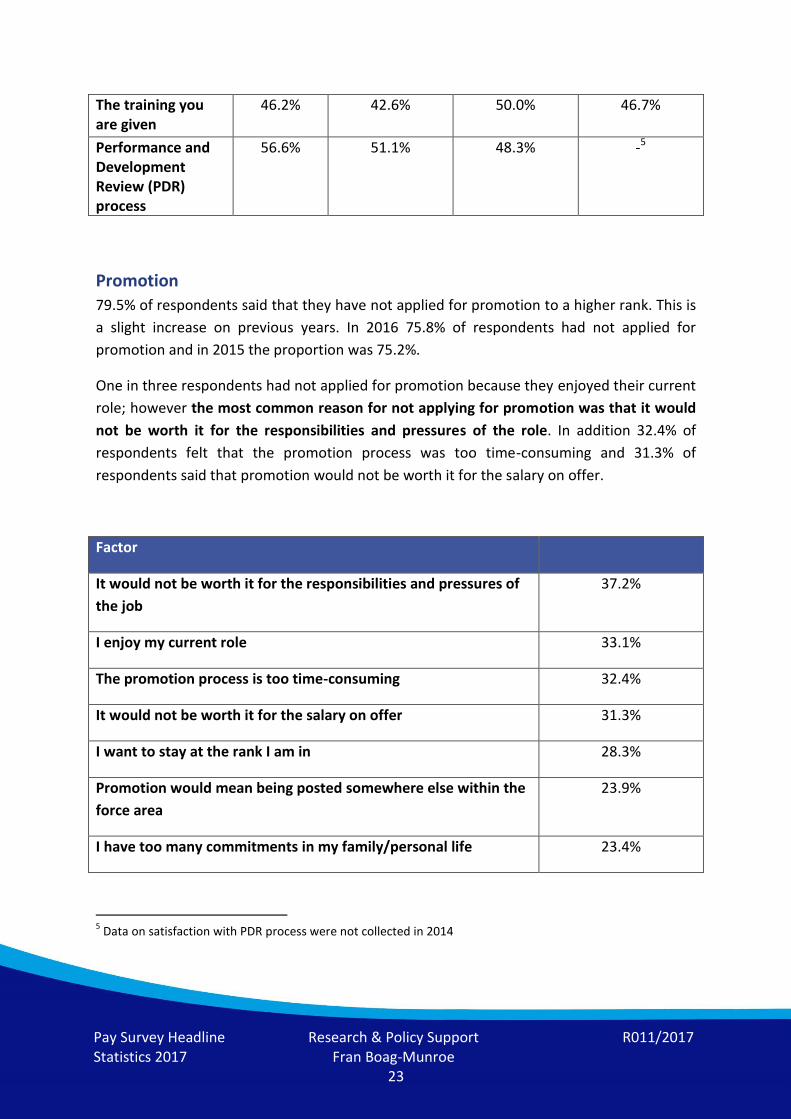
Promotion
79.5% of respondents said that they have not applied for promotion to a higher rank. This is
a slight increase on previous years. In 2016 75.8% of respondents had not applied for
promotion and in 2015 the proportion was 75.2%.
One in three respondents had not applied for promotion because they enjoyed their current
role; however the most common reason for not applying for promotion was that it would
not be worth it for the responsibilities and pressures of the role. In addition 32.4% of
respondents felt that the promotion process was too time-consuming and 31.3% of
respondents said that promotion would not be worth it for the salary on offer.
Factor
It would not be worth it for the responsibilities and pressures of
the job
37.2%
I enjoy my current role 33.1%
The promotion process is too time-consuming 32.4%
It would not be worth it for the salary on offer 31.3%
I want to stay at the rank I am in 28.3%
Promotion would mean being posted somewhere else within the
force area
23.9%
I have too many commitments in my family/personal life 23.4%
5 Data on satisfaction with PDR process were not collected in 2014
Pay Survey Headline Statistics 2017
Research & Policy Support Fran Boag-Munroe
R011/2017
24
I am more interested in pursuing other roles at my current rank 22.3%
I do not believe there is any point in applying, as there are not
enough positions at the next rank
19.4%
I would have to leave my current specialism if I were promoted 16.9%
I plan on retiring or resigning soon 15.8%
I intend to apply within the next year 7.6%
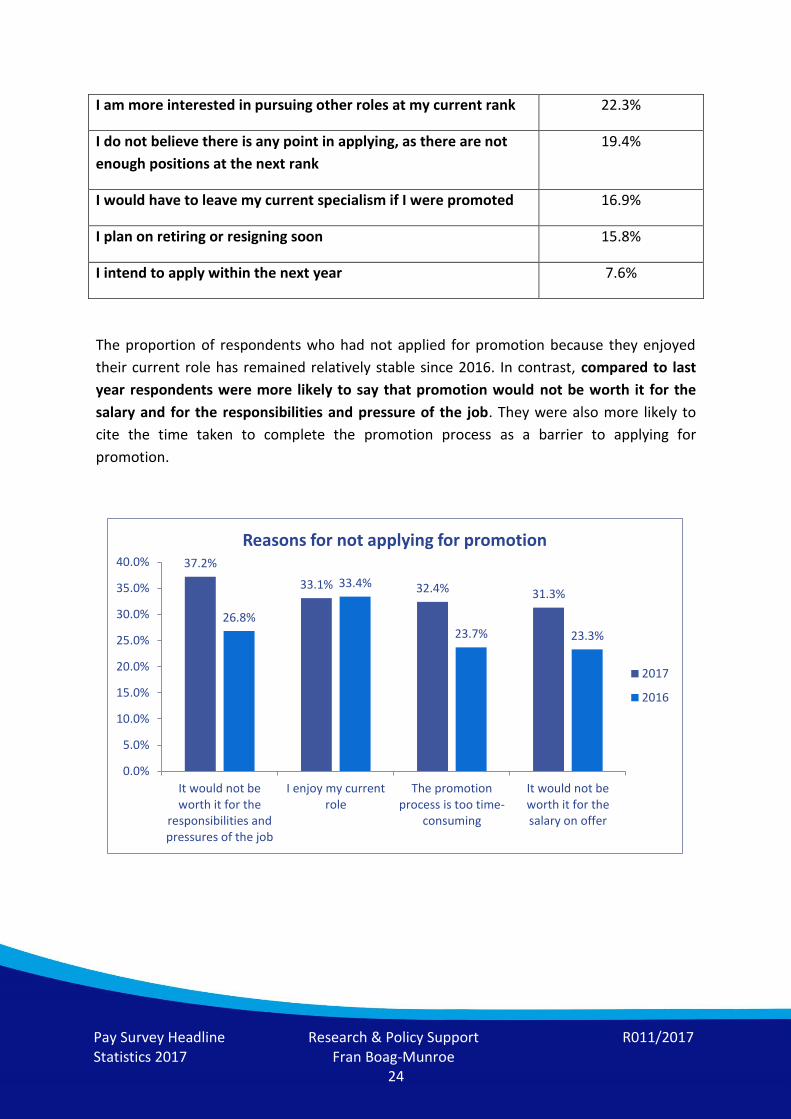
The proportion of respondents who had not applied for promotion because they enjoyed
their current role has remained relatively stable since 2016. In contrast, compared to last
year respondents were more likely to say that promotion would not be worth it for the
salary and for the responsibilities and pressure of the job. They were also more likely to
cite the time taken to complete the promotion process as a barrier to applying for
promotion.
37.2%
33.1% 32.4% 31.3%
26.8%
33.4%
23.7% 23.3%
0.0%
5.0%
10.0%
15.0%
20.0%
25.0%
30.0%
35.0%
40.0%
It would not beworth it for the
responsibilities andpressures of the job
I enjoy my currentrole
The promotionprocess is too time-
consuming
It would not beworth it for thesalary on offer
Reasons for not applying for promotion
2017
2016
Pay Survey Headline Statistics 2017
Research & Policy Support Fran Boag-Munroe
R011/2017
25
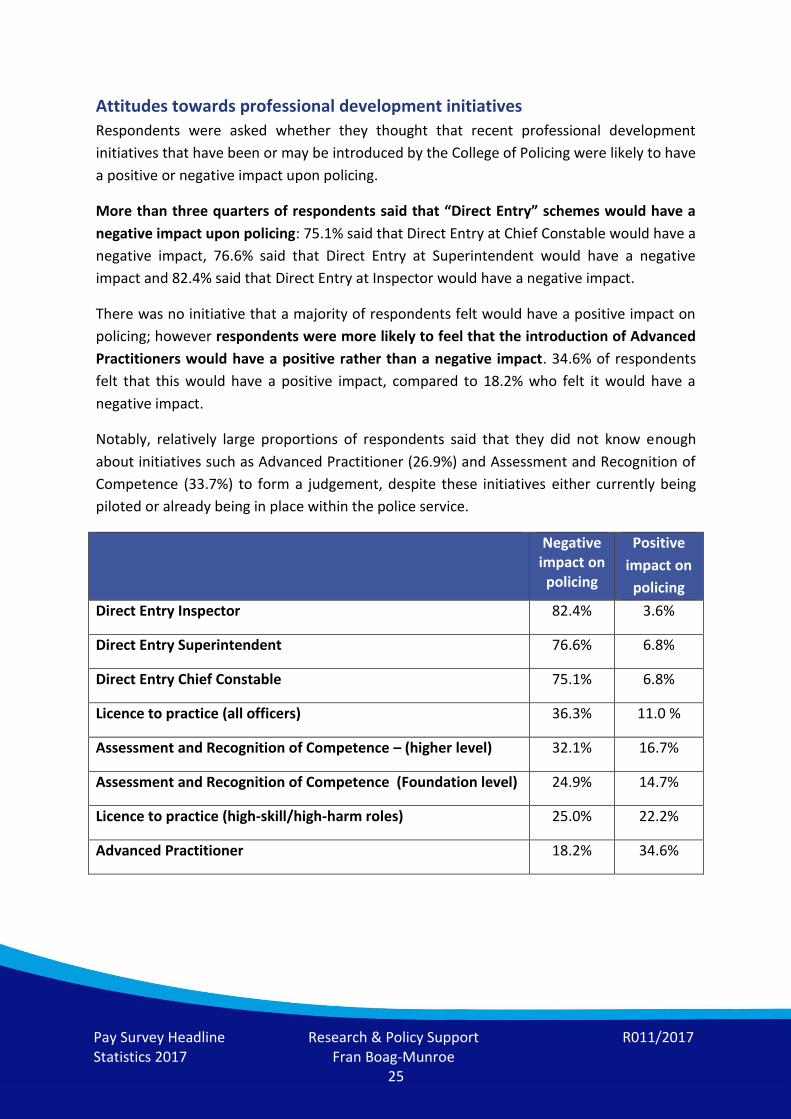
Attitudes towards professional development initiatives
Respondents were asked whether they thought that recent professional development
initiatives that have been or may be introduced by the College of Policing were likely to have
a positive or negative impact upon policing.
More than three quarters of respondents said that “Direct Entry” schemes would have a
negative impact upon policing: 75.1% said that Direct Entry at Chief Constable would have a
negative impact, 76.6% said that Direct Entry at Superintendent would have a negative
impact and 82.4% said that Direct Entry at Inspector would have a negative impact.
There was no initiative that a majority of respondents felt would have a positive impact on
policing; however respondents were more likely to feel that the introduction of Advanced
Practitioners would have a positive rather than a negative impact. 34.6% of respondents
felt that this would have a positive impact, compared to 18.2% who felt it would have a
negative impact.
Notably, relatively large proportions of respondents said that they did not know enough
about initiatives such as Advanced Practitioner (26.9%) and Assessment and Recognition of
Competence (33.7%) to form a judgement, despite these initiatives either currently being
piloted or already being in place within the police service.
Negative impact on
policing
Positive
impact on
policing
Direct Entry Inspector 82.4% 3.6%
Direct Entry Superintendent 76.6% 6.8%
Direct Entry Chief Constable 75.1% 6.8%
Licence to practice (all officers) 36.3% 11.0 %
Assessment and Recognition of Competence – (higher level) 32.1% 16.7%
Assessment and Recognition of Competence (Foundation level) 24.9% 14.7%
Licence to practice (high-skill/high-harm roles) 25.0% 22.2%
Advanced Practitioner 18.2% 34.6%
Pay Survey Headline Statistics 2017
Research & Policy Support Fran Boag-Munroe
R011/2017
26
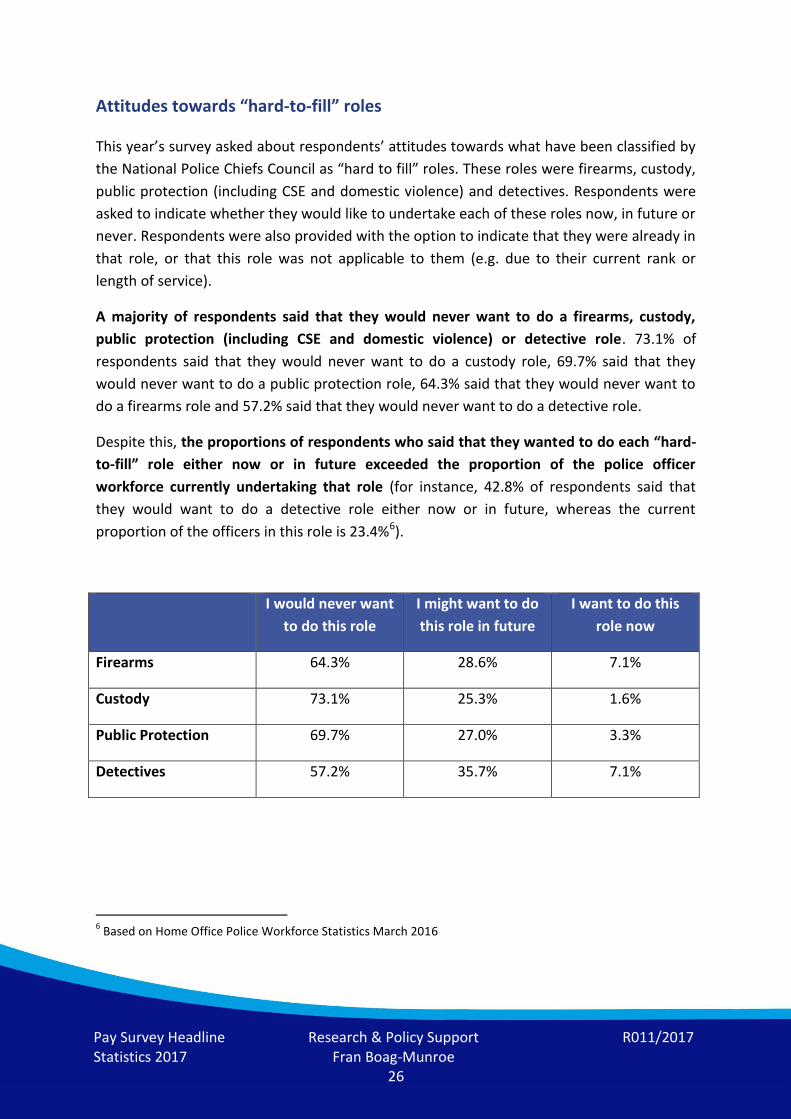
Attitudes towards “hard-to-fill” roles
This year’s survey asked about respondents’ attitudes towards what have been classified by
the National Police Chiefs Council as “hard to fill” roles. These roles were firearms, custody,
public protection (including CSE and domestic violence) and detectives. Respondents were
asked to indicate whether they would like to undertake each of these roles now, in future or
never. Respondents were also provided with the option to indicate that they were already in
that role, or that this role was not applicable to them (e.g. due to their current rank or
length of service).
A majority of respondents said that they would never want to do a firearms, custody,
public protection (including CSE and domestic violence) or detective role. 73.1% of
respondents said that they would never want to do a custody role, 69.7% said that they
would never want to do a public protection role, 64.3% said that they would never want to
do a firearms role and 57.2% said that they would never want to do a detective role.
Despite this, the proportions of respondents who said that they wanted to do each “hard-
to-fill” role either now or in future exceeded the proportion of the police officer
workforce currently undertaking that role (for instance, 42.8% of respondents said that
they would want to do a detective role either now or in future, whereas the current
proportion of the officers in this role is 23.4%6).
I would never want
to do this role
I might want to do
this role in future
I want to do this
role now
Firearms 64.3% 28.6% 7.1%
Custody 73.1% 25.3% 1.6%
Public Protection 69.7% 27.0% 3.3%
Detectives 57.2% 35.7% 7.1%
6 Based on Home Office Police Workforce Statistics March 2016
Pay Survey Headline Statistics 2017
Research & Policy Support Fran Boag-Munroe
R011/2017
27
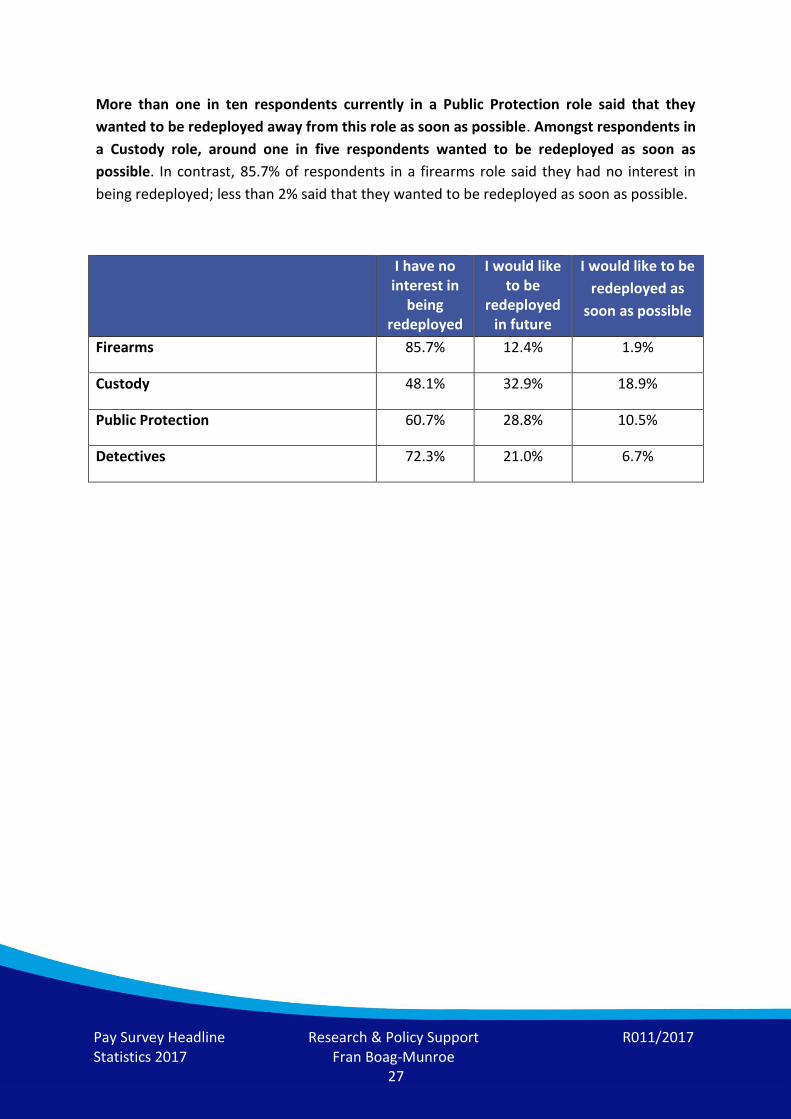
More than one in ten respondents currently in a Public Protection role said that they
wanted to be redeployed away from this role as soon as possible. Amongst respondents in
a Custody role, around one in five respondents wanted to be redeployed as soon as
possible. In contrast, 85.7% of respondents in a firearms role said they had no interest in
being redeployed; less than 2% said that they wanted to be redeployed as soon as possible.
I have no interest in
being redeployed
I would like to be
redeployed in future
I would like to be
redeployed as
soon as possible
Firearms 85.7% 12.4% 1.9%
Custody 48.1% 32.9% 18.9%
Public Protection 60.7% 28.8% 10.5%
Detectives 72.3% 21.0% 6.7%