Embed Size (px)
Citation preview

96 Accelerators
3 PF Ring
3-1 Summary of Machine Operation
The operation statistics of the PF ring for FY2003 are tabulated in Table 1. Fig. 1 shows the ring operation time, scheduled user time and actual user time since 1982. Although the total operation time for FY2003 of 5,200 hours is slightly longer than that for FY2002, the opera-tion time has not yet recovered to those values recorded in FY1999-2001. In FY2003, scheduled user time and actual user time excluding time losses due to machine trouble and daily injections were 4,224 and 4,131 hours, respectively. The ratio of actual user time to scheduled time has been maintained at 96-98% over the past four years.
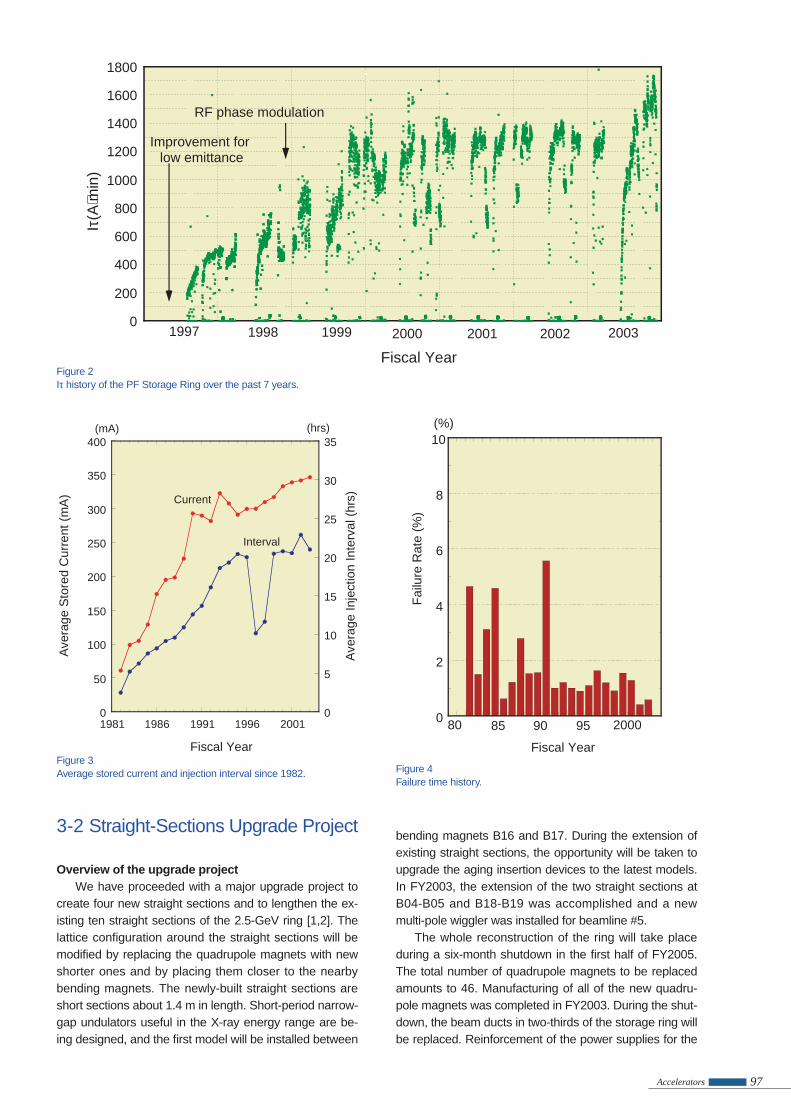
Fig. 2 shows the trend of the product Iτ of the beam current I and the beam lifetime τ over the past 7 years. In FY 2003, it can be seen that Iτ was low following the summer shutdown, during which the vacuum systems in a number of the straight sections of the ring were re-mod-elled. This low Iτ necessitated twice-a-day injection until 7 October 2003. The Iτ product gradually recovered, and reached 1500-1700 A⋅min in January 2004, appreciably higher than the corresponding values for FY2002.
This overall improvement in Iτ was probably due to the installation of a new insertion device in the straight
sections between the B04 and B05 bending magnets, as described in the next section.
Throughout FY2003 the ring was injected with elec-trons at 9 am everyday, and the initial stored beam cur-rent of 450 mA was unchanged from FY2002.
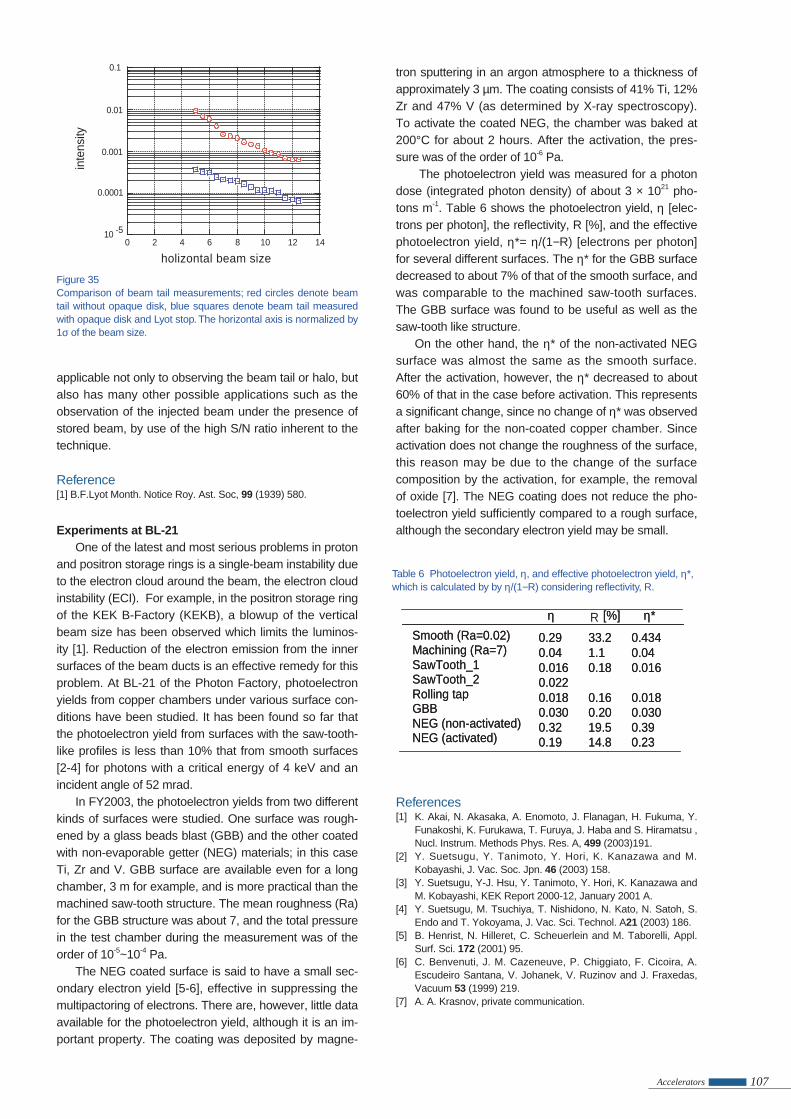
Fig. 3 shows the history of the average stored beam current over the period FY1982 - FY2003. Although the initial beam current has not been changed for several years, a gradual increase in the average beam current corresponding to an increase in the Iτ product is notice-able. A change in the failure rate, defi ned as the failure time to the total operation time, is shown in Fig. 4. Over the past 10 years failure rate has been kept to around 1%, and about 0.5% over the past 2 years. This high reli-ability is realized by the ceaseless efforts of the staff of the light source division and the operators to keep the machine in good condition. However, old components are still in use in several areas. For example, it is becoming very diffi cult to maintain the old computer systems that are widely used in beamline interlocks. Renewal of them is a matter of great urgency.
We have proceeded with an upgrade project of the straight sections of the PF ring. Progress of the project in FY2003 is described in detail in the following sections.
0
1000
2000
3000
4000
5000
6000
82 83 84 85 86 87 88 89 90 91 92 93 94 95 96 97 98 99 2000 2001 2002 2003
Operation Time
cheduled User Time
Time
Wiggler Operation Time
ngle Bunch User Time
Fiscal Year
Ope
ratio
nT
ime
(hrs
)
Figure 1Operation time history of the PF Storage Ring.
Multi-bunch Single-bunch Total
Ring Operation Time (hours) 4768.0 432.0 5200.0 Scheduled user time (hours) 3792.0 432.0 4224.0 Actual user time T (hours) 3715.6 415.3 4130.9 Time used for injection (hours) 47.9 15.3 63.2 Integrated current in T (A⋅hours) 1287.9 18.3 1306.2 Average current in T (mA) 346.6 44.1 -- Number of injections 177 56 233 Average interval between injections (hours) 21.0 7.4 --
Table 1 Statistics of the PF Storage Ring operation during FY2003.
97Accelerators
Figure 2 Iτ history of the PF Storage Ring over the past 7 years.
Figure 3Average stored current and injection interval since 1982. Figure 4
Failure time history.
0
50
100
150
200
250
300
350
400
0
5
10
15
20
25
30
35
1981 1986 1991 1996 2001
Ave
rage
Sto
red
Cur
rent
(m
A)
Ave
rage
Inje
ctio
n In
terv
al (
hrs)
Fiscal Year
Current
Interval
(mA) (hrs)
0
2
4
6
8
10
Fai
lure
Rat
e (%
)
80 85 90
(%)
Fiscal Year
95 2000
0
200
400
600
800
1000
1200
1400
1600
1800
Iτ(A
⋅min
)
Fiscal Year
7
1997 1998 1999 2000 2001
Improvement for low emittance
RF phase modulation
2002 2003
3-2 Straight-Sections Upgrade Project
Overview of the upgrade projectWe have proceeded with a major upgrade project to
create four new straight sections and to lengthen the ex-isting ten straight sections of the 2.5-GeV ring [1,2]. The lattice confi guration around the straight sections will be modifi ed by replacing the quadrupole magnets with new shorter ones and by placing them closer to the nearby bending magnets. The newly-built straight sections are short sections about 1.4 m in length. Short-period narrow-gap undulators useful in the X-ray energy range are be-ing designed, and the fi rst model will be installed between
bending magnets B16 and B17. During the extension of existing straight sections, the opportunity will be taken to upgrade the aging insertion devices to the latest models. In FY2003, the extension of the two straight sections at B04-B05 and B18-B19 was accomplished and a new multi-pole wiggler was installed for beamline #5.
The whole reconstruction of the ring will take place during a six-month shutdown in the fi rst half of FY2005. The total number of quadrupole magnets to be replaced amounts to 46. Manufacturing of all of the new quadru-pole magnets was completed in FY2003. During the shut-down, the beam ducts in two-thirds of the storage ring will be replaced. Reinforcement of the power supplies for the

98 Accelerators
tance can be adjusted by the horizontal phase advance of the normal cell in the arc sections. The relationship between the horizontal emittance and the phase advance is shown in Fig. 6. The minimum horizontal emittance on the calculation is less than 23 nm⋅rad, but the achievable emittance may be about 27 nm⋅rad from a practical point of view. The reason for this is that the dynamic aperture is rather reduced for the optics with a smaller emittance than 27 nm⋅rad. The beam sizes (σx, σy) and divergences (σ'x, σ'y) at the center of the straight sections for optics with an emittance of 27 nm⋅rad are listed in Table 3.
Table 2 Principal beam parameters after the modifi cation.
New OpticsBeam Energy E (GeV) 2.5(3.0)Circumference C (m) 187Number of Straight Sections
8.93 m×25.41 m×45.29 m×24.63 m×21.41 m×4
Superperiodicity Ns 2
Bending Radius ρ (m) 8.663Energy Loss/turn U0 (keV) 399Lattice Type FODONatural Emittance εx (nmrad) 27.2X-Y coupling κ <0.01
Natural Energy Spread σε 0.000728
Momentum Comp. Factor
α 0.00513
Betatron Tune (x/y) νx / νy10.22/5.28
Radi. Damp. Time (x/y/z) τx/τy/τz
(msec)
7.8/7.8/3.9
RF Voltage VRF(MV) 1.7RF Frequency fRF (MHz) 500.1
Revolution Frequency frev(MHz) 1.60293Harmonic Number h 312RF Bucket Height ∆p/p 0.0133Synchrotron Tune νx
0.0129Natural Bunch Length σz(mm) 8.57Bending Angle θ(deg) 12.857Number o f Bend ing Magnets
28
quadrupoles is another important matter of this upgrade project. All of the required beam ducts and power sup-plies will be manufactured in FY2004. For the rearrange-ment of quadrupoles, replacement of a lot of beamline front ends is inevitable. The installations of redesigned front ends was started in FY2002. Thirteen beamlines are related to this project and most of them will be replaced before the reconstruction of the storage ring.
References[1] S. Asaoka, K. Haga, K. Harada, T. Honda, Y. Hori, M. Izawa,
T. Kasuga, M. Kobayashi, Y. Kobayashi, H. Maezawa, Y. Minagawa, A. Mishina, T. Mitsuhashi, T. Miyajima, H. Miyauchi, S. Nagahashi, T. Nogami, T. Obina, C.O. Pak, S. Sakanaka, Y. Sato, T. Shioya, M. Tadano, T. Takahashi, Y. Tanimoto, K. Tsuchiya, T. Uchiyama, A. Ueda, K. Umemori, and S. Yamamoto, AIP Conf. Proc. 705 (2004)
[2] Photon Factory Activity Report 2002 #20 (2003) A82.
New optical functions and beam parametersDue to the modifi cation of the lattice confi guration
for the straight-section upgrade project [1], the optical functions and beam parameters will also be modifi ed. Fig. 5 shows the new optical functions of the ring. The dispersion (ηx) and beta functions (βx, βy) are optimized to be as low as possible for the insertion device and the RF cavities which are installed in the straight sections. In particular, the vertical beta function (βy) in the short straight section of 1.4 m is reduced to 0.4 m for the short-period undulators. The principal beam parameters after the modifi cation are listed in Table 2. The horizontal emit-
0
5
10
15
20
25
30
0 40 80 120 160
βx
βy
β x, β y
(m)
beta
func
tions
0.0
0.2
0.4
0.6
0.8
1.0
0 40 80 120 160
η x (m
)
Path Length (m)
disp
ersi
on
Figure 5New optical functions for the upgrade project.
Figure 6Horizontal emittance as a function of phase advance.
20
25
30
35
40
45
90 100 110 120 130
Horizontal Emittance vs Phase Advance
Hor
izon
tal e
mitt
ance
(nm
rad)
Horizontal phase advance /one cell (deg)

99Accelerators
Table 3 Beam sizes and divergences at the center of the straight sections in the new optics with an emittance of 27 nm⋅rad.
InsertionDevice
σx (mm) σ'x (mrad) σy (mm) σ'y (mrad)
ID02 0.571 0.048 0.037 0.007
ID03 0.582 0.072 0.010 0.026
ID04 0.518 0.088 0.033 0.008
ID05 0.642 0.071 0.039 0.008
ID13 0.632 0.075 0.021 0.015
ID14 0.474 0.100 0.043 0.006
ID15 0.582 0.072 0.010 0.026
ID16 0.571 0.048 0.037 0.007
ID17 0.582 0.072 0.010 0.026
ID18 0.518 0.088 0.033 0.008
ID19 0.642 0.071 0.039 0.008
ID26 0.632 0.075 0.021 0.015
ID28 0.474 0.100 0.043 0.006
ID01 0.582 0.072 0.010 0.026
Magnet systemForty-six quadrupole magnets for the upgrade proj-
ect of the straight sections have been newly produced. The specifi cations of the magnets are listed in Table 4. The magnets were designed so as to both meet the re-quirements of the new optics and be compatible with the existing and future beamlines. Thus, the magnet design consists of an iron steel core with a non-iron steel core support shaped to avoid interference with the vacuum ducts of each beamline. A cross-sectional view of the magnets is shown in Fig. 7. Two types of magnets were produced due to the requirements of the lattice confi gu-ration; one with a length of 300 mm (QD-type), and one with a length of 400 mm (QE-type). In addition, all mag-nets have auxiliary coils to compensate for the fi eld gra-dient produced by the insertion devices. Fig. 8 shows a
side view of the magnet which has already been installed in the short straight section between B15 and B16.
In order to investigate possible interference between the magnets and the vacuum ducts, a test bench consist-ing of the new magnets and vacuum duct was installed in the power supply building. A photograph of the test bench is shown in Fig. 9. Although the space between the mag-nets and the duct was quite limited, we confi rmed that there were no un-avoidable problems.
Figure 7Cross sectional view of new quadrupole magnets. unit (mm).
φ70 21.7 60.0Less than30.0
435
100
200
275
315
375
60
40
450
75
60
20
15
Main CoilQD-Type QE-type
Core length mm 300 400Bore radius mm 35.0Maximum Gradiant T/m 30.0
Maximum Current A 780Number of coil turn Turn/pole 23
Coil resistance mΩ 23.1 26.3Coil inductance mH 10.5 15.2
Auxiliary Coil
Maximum Gradiant T/m 1.0
Maximum Current A 17Number of coil turn Turn/pole 30
Table 4 Specifi cations of the new quadrupole magnets installed in the straight sections.
Figure 8Side view of the quadrupole magnets placed between B15 and B16.
Q161 Q162 Q163 Q164
SGU
Figure 9Photograph of the test bench installed in the power supply building.

100 Accelerators
Field measurementWe have measured the magnetic fi eld of the new
quadrupole magnets using a harmonic coil. The optimum numbers of end-shims for fi eld correction were attached to each magnet before the measurement. End-shims with a thickness of 6 mm are attached for all QE type magnets, and those with a thickness of 4 mm, 6 mm and 8 mm are attached for the QD type magnets. Fig. 10 shows the averaged excitation curves for twenty-two QE type and eighteen QD type quadrupole magnets, and Table 5 lists the statistics of the measured results. The standard deviations of ∆B/B at an excitation current of 800 A for QE type and QD type magnets are 0.075% and 0.136%. This is higher than the manufacturer’s stated accuracy of 0.1% for the QE type, but lower for the QD type, although the accurcy of our measurements may have been affected by changes in ambient temperature. The magnets, power supplies and measurement system are located in an un-airconditioned room, resulting in room temperature varying by several degrees over the course of a day. Due to several interruptions for system maintenance these measurements took place over a pe-riod of two months, during which time room temperature varied by about 10 degrees. Although the temperature
of the cooling water for the magnet coil is stabilised, it is expected that room temperature changes cannot be ig-nored.
Orbit and optics corrections will be simulated using the measured magnetic errors.
Production of the fi rst bend chamber for the straight-sections upgrading
As the fi rst of twelve bend chambers, the B16 cham-ber has been manufactured, and will be installed down-stream of the insertion device MPW#16. The synchrotron radiation (SR) produced by the insertion device passes through the B16 chamber and its SR port to the experi-mental hall. The design concept is described in the 2002 Activity Report. Fig. 11 shows an outline of the cham-ber. The body of the chamber is made of aluminium alloy. Some parts, such as the bellows and fl anges are made of stainless steel. The intense SR is turned down fi rst by a crotch absorber and next by an SR mask, both made from a heat-resistant copper alloy. The distributed ion pump (DIP) installed in the chamber is of the anode-ground type, and is exchangeable without processing the chamber. Its pumping speed is estimated at about 200 l/s at 1×10⁻⁸ Pa. After an evacuation test, the chamber was installed in the new magnet arrangement in order to examine any interference with the peripheral equipment. Also, two Q-chambers were fabricated and installed with new magnets in the ring during the summer shutdown period.
The basic design is the same for the remaining eleven bend chambers except for the SR port. Each SR port is designed according the masking conditions of the SR required at downstream at each beamline. All of the necessary beam chambers including ones for the straight sections will be manufactured in FY2004.
Figure 10Excitation Curves for QD type and QE type quadrupole magnets. The curve "QE" shows the average curves of twenty-two QE-type magnets and the curve "QD" that of eighteen QD-type magnets.
0
5
10
15
20
25
30
35
0 100 200 300 400 500 600 700 800
Current [A]
Eff
ecti
veM
agne
tic
Fiel
d[T
/m] QE (40cm)
QD (30cm)
Table 5 Statistics of the measured results.
CurrentAveragedMagnetic
field
Dispersion of ∆ B/B
Standarddeviationof ∆ B/B
Minimumvalue ofdeviation
Maximumvalue ofdeviation
I [A] B' [T/m] σ 2 [%2] σ [%] ∆B/B [%] ∆B/B [%]100 5.145 0.010 0.099 -0.248 0.181200 10.237 0.013 0.113 -0.241 0.271300 15.250 0.018 0.134 -0.295 0.346400 20.189 0.022 0.149 -0.305 0.405500 24.693 0.014 0.116 -0.227 0.307600 27.666 0.007 0.083 -0.214 0.170700 29.631 0.006 0.078 -0.213 0.132800 30.954 0.006 0.075 -0.184 0.146100 5.309 0.038 0.195 -0.407 0.309200 10.547 0.033 0.182 -0.322 0.306300 15.699 0.035 0.186 -0.367 0.310400 20.765 0.035 0.186 -0.357 0.347500 25.204 0.019 0.139 -0.220 0.254600 27.975 0.016 0.126 -0.226 0.295700 29.797 0.015 0.124 -0.220 0.287800 31.038 0.019 0.136 -0.220 0.319
QE(22)
QD(18)
Figure 11Drawing of the chamber.
Q-magQ-mag
B-mag
bellowsbellows
BPM crotch absorberSR mask
pumping port/BA gauge/TSP/SIP
(DIP)
DIP port/electrode
steering-mag
SR
1m
3-3 Research and Development
Construction of a new multipole wiggler (MPW#05) for a protein crystallography beamline
In the 2.5 GeV Photon Factory (PF) storage ring there are six insertion devices that have been under continuous use over the past ten years. Only one straight section remained available for a new device, that between bend-ing magnets B04 and B05. This section was previously

101Accelerators
used for various machine studies for developing light-source components including a beam diagnosis system. To increase the number of straight sections available for insertion devices, an upgrade project is currently under-way. As a fi rst step of this project, the PF lattice has been improved to allow for the elongation of the straight sec-tions at B04-B05 and B18-B19, and a new multipole wig-gler (MPW#05) constructed for the B04-B05 section.
The required photon energy range for protein crys-tallography is predominantly 10-15 keV. The length of the straight section B04-B05 which is available for the magnets of MPW#05 is 2.6 m, and the gap of the magnet arrays is limited to 26 mm due to the 20 mm allowed ap-erture for the electron beam in this section. Under these restrictions, the parameters of MPW#05 have been opti-mized for maximum photon fl ux density in the 10-15 keV energy range, and the attractive magnetic force between the magnet arrays have been minimised with no degrada-tion of fi eld quality. Fig. 12 shows the calculated photon fl ux densities as functions of photon energy and param-eters for several optimised magnetic confi gurations.
A period length of 12 cm has been chosen since this gives the highest value of photon fl ux density in the 10-15 keV energy region. The number of magnetic periods is 21, and a hybrid magnet arrangment has been adopted, using NdFeB for the permanent magnet (NEOMAX44H: remanent fi eld Br=13 kG, coercivity iHc=16 kOe, Sumito-
mo Special Metal Co.) and vanadium-Permendur for the iron core. The maximum K value is 15.8 at the minimum gap of 26 mm. The calculated spectra of MPW#05 for these specifi cations are shown in Fig. 13.
Fig. 14 shows a schematic view of the arrangement of the magnetic poles and the magnet blocks. To increase the number of periods as much as possible with mini-mum space used for end corrections an anti-symmetric arrangement for the magnetic fi eld has been adopted. With this arrangement the fi rst fi eld integral becomes very small, but the second fi eld integral remains non-zero. To correct for the second integral, fi xed-gap electromagnets located at both ends of the magnet arrays are used.
In order to reduce the size of the magnet holders for the poles of MPW#05, particularly in the transverse direc-tion, each single magnetic pole is decomposed into three units: a pole-piece unit and two side units. These mag-netic units can be interchanged to adjust the magnetic fi eld, and additional magnet chips can be attached to the pole-piece unit to further adjust the fi eld. The degree of fi eld-strength control afforded by these chips is about 1%.
The magnetic poles are mounted on a pair of I-beams supported by a mechanical frame with a “C”-type struc-ture. The gap between the magnetic poles can be varied from 26 to 220 mm using a translation system compris-ing ball screws and linear guides. Positional accuracy is 10 µm, and the degree of parallelism is within 30 µm/m in the transverse direction with a maximum attractive magnetic force of 7.1 tons-force. The scanning speed of the magnet gap is 30 mm/min, and the control-system for MPW#05 has been developed using EPICS (Experimen-tal Physics and Industry Contol System).
The vacuum chamber for MPW#05 consists of a beam passage section and a pumping section. The in-ner sizes of the beam section are 20 mm vertically and 88 mm horizontally, with a wall thickness of 2 mm. The pumping section contains two sputter ion pumps with a combined pumping speed of 180 litre/sec and eight subli-mation pumps.
By referring to measured data the magnetic fi eld was adjusted to optimise the defl ection of the electron beam at the individual magnetic poles. The adjustment procedure consists of fi rst exchanging the magnetic units where the defl ection is large, followed by the insertion of magnetic chips in the pole-piece holder. Prior to adjustment it was found that a small amount of demagnetization (less than
0
5×10¹⁴
1×10¹⁵
1.5×10¹⁵
2×10¹⁵
2.5×10¹⁵
3×10¹⁵
0 5000 1×10⁴ 1.5 ×10⁴ 2 ×10⁴ 2.5×10 4
Energy (KeV)
Flu
x D
ensi
ty (
phs/
s/m
rad2 /0
.1%
bw)
PFE=2.5GeVI=400mAε
0=36nm
κ=1%coupling
σE/E=7.3×10-4
βx=8mβy=6mη=0.6m
λu(mm) N K εc(keV) @gap=26mm 100 27 10.6 4.7 120 22 15.6 5.8 140 19 20.7 6.5 160 16 25.4 7.1 180 15 29.4 7.3
λu=100mm
120mm
140mm
160mm
180mm
Figure 12Calculated photon fl ux densities for several period lengths. The total length of the magnet array is held constant.
Figure 13The spectral properties of MPW#05 in the PF ring. As well as for the wiggler mode, spectra for the undulator mode are also shown.
1014
1015
1016
1017
1018
10 100 1000 104 105
PFE=2.5GeVI=400mAε
0=36nm
κ=1%coupling
σE/E=7.3×10-4
MPW mode:λu=12cm, Bmax=1.4Tε
c=5.8keV
L=2.6m, gap=26mmPt=8.18kW
U mode@B04-05λu=12cm, L=2.6m
Kmax=5
βx=8mβy=6mη=0.6m
Energy (KeV)
Bri
llia
nce
(phs
/s/m
m2 /m
rad2 /0
.1%
bw)
Figure 14Schematic views of (a) part of the magnet arrangment, (b) a pole-piece unit, and (c) a side unit.

102 Accelerators
1%) occurred in both pole-pieces and side magnet units. All the magnet units were stabilised under the same de-magnetizing conditions before adjustment.
The main operation mode of MPW#05 is as a high-fi eld wiggler, and the magnetic gap should be set at its minimum value of 26 mm in ordinary operation. The fi eld has been adjusted, however, over the entire magnetic gap range so that MPW#05 can also act as a light source for the VUV energy region. Fig. 15 shows typical electron orbit results from fi eld adjustments at different gap values. The defl ection and deviation of the orbit are satisfactorily small in both the horizontal and vertical directions.
MPW#05 was completed and installed in the PF ring in summer 2003, following the lattice improvements. A photograph of the installed device is shown in Fig. 16, and protein crystallography studies using MPW#05 have already begun.
Upgrade of the klystron power supplyIn the RF system for the PF storage ring, four power
supplies are used to provide the high voltages required by the klystrons. Since these power supplies were fab-ricated 16-24 years ago, future maintenance diffi culties are anticipated. In an effort to ensure reliable storage-ring operations in the future, one of the power supplies was upgraded during the summer of 2003.
To achieve high stability, low ripples and good reli-ability, a modern design was adopted for the new power supply, a block diagram of which is shown in Fig. 17.
The input voltage of 6.6 kV is stepped down with a trans-former and regulated using thyristors. Next, the voltage is stepped up and rectifi ed. The resulting DC high voltage is then provided to the klystron through a noble solid-state switch made up of 40 packages of Insulated Gate Bipolar Transistors (IGBT) connected in series. When the klys-tron experiences a spark, this switch can turn the high voltage off very quickly. It is expected that this switch will prove more reliable than the Crowbar circuit convention-ally used for klystron protection.
The new klystron power supply was installed dur-ing the summer shutdown of 2003. A photograph taken during the installation work is shown in Fig. 18. The new power supply has been working well since September 2003 without any trouble.
Low-emittance optics studyThe horizontal emittance in the present optics is
35.7 nm⋅rad at an energy of 2.5 GeV. By increasing the horizontal phase advance of the normal cell from 105° to 125°, the emittance can be reduced to 28.0 nm⋅rad, and a stored current of 450 mA has already been obtained in this confi guration.
The low-emittance optics, however, often result in a 20% reduction in injection effi ciency, and several at-tempts have been made to understand and reduce this loss.
Firstly, optics and tune corrections were made by ad-justing the strength of the quadrupole magnets. The cor-rected chromativities are shown in Fig. 19 and measured dispersion functions are shown in Fig. 20. The horizontal
Figure 16A photograph of MPW#05 as installed in the 2.5 GeV PF storage ring.
-100
0
100
200
300
-2000 -1500 -1000 -500 0 500 1000 1500 2000
rela
tive
disp
lace
men
t (µm
)
Z (mm)
gap=90mm
gap=50mm
gap=26mm
Figure 15Electron orbits after fi eld adjustment at different gap values. The solid line shows the horizontal electron orbit, and the dotted line thevertical electron orbit.
Figure 17Block diagram of the new klystron power supply for the PF storage ring.
CONTROLPANEL
STEP-UP TRANS.& RECTIFIER
RECEIVINGTERMINAL
VOLTAGEREGULATOR
HV CABINET
IGBT
HEATER P.S.
AC6.6KV3φ
A V
TRIG.
HV SWITCH
ANODE P.S.
TO KLY.
-40kV LSTEPDOWN
TRANS.
THYRISTORPANEL
440VVCB
H
HK
A
CT
C
C=10µF, L=10mH
200V
Figure 18Installing the high-voltage cabinet for the new klystron power supply.

103Accelerators
and vertical chromativities were culculated to be +0.397 and +1.104, suffi cient to suppress head-tail instabilities.
Despite these corrections, the injection effi ciency was not totally recovered. A possible reason for this is that the beam injection aperture which for the low-emittance optics is about half that of the currently used optics. More studies are required before the low-emittance optics is suitable for user operation.
Study of ion trapping phenomena in the KEK-PF and PF-AR storage rings
We have observed the change in the vertical beta-tron tune of the beam current, and found that the vertical tune shows a characteristic dependence on the beam current in single-bunch operation under low beam cur-rent (<1 mA) conditions. It is well known that the vertical tune in general tends to increase linearly as the beam current decreases due to wake fi eld effect [1]. However, from precise measurements of the vertical tune in single-bunch operation of KEK-PF, we have found that the verti-cal tune tends to deviate from a linear correlation with the beam current at currents below 1 mA. The experimental results are shown in Fig. 21. As can be seen in the fi gure, the vertical tune linearly increases as the beam current decreases down to about 1.5 mA, however the depen-dence clearly changes at currents below 1.5 mA.
We have also performed the same experiment at the PF-AR in single-bunch operation with a beam energy of
3 GeV, and found that at low beam currents the depen-dence of the vertical tune on the beam current shows the same behavior as for the KEK-PF. The results from the PF-AR are shown in Fig. 22. As can be seen in the fi g-ure, the dependence of the vertical tune on the beam cur-rent changes at currents below 1 mA, similar to the result for KEK-PF.
This change in the vertical tune dependense on beam current is interpreted as being due to the effect of residual gas ions [2,3]. Gas ions created in scattering between the residual gas molecules and the electrons in the beam can be attracted to the electron beam, and can become stably trapped around the beam under some conditions. When the ions are trapped by the electron beam, the re-sulting electrostatic forces produce a shift of the betatron tune of the beam. The ion trapping phenomenon [2,3] tends to become prominent when the beam current is high because the change in the betatron tune is propor-tional to the ion density in the electron beam. Therefore, it has until now been supposed that the ion trapping phe-nomenon can hardly be seen under single-bunch and low
-991
-990
-989
-988
-987
-986
-985
-984
-8 -6 -4 -2 0 2 4 6 8
∆fRF
- ∆f β
αh[k
Hz]
Hor
izon
tal(
red)
-874
-872
-870
-868
-866
-864
-862
-860
- ∆f β
αh[k
Hz]
Ver
tica
l(gr
een)
horizontalvertical
Figure 19Meausred chromaticities. The linear coeffi cients obtained from polynomial fi tting to the measured curves given horizontal and vertical chromaticities of +0.397 and +1.104, respectively.
Figure 20Measured dispersion functions in the low emittance optics.
-200
0
200
400
600
800
1000
1200
0 10 20 30 40 50 60 70
No. of BPMs
disp
ersi
onfu
nctio
n[m
m]
horizontalvertical
Figure 21Change in the vertical tune on the beam current in the single-bunch condition in the KEK-PF. Blue circles are the experimental results and red line is the calculated one.
Figure 22Change in the vertical tune on the beam current in the single-bunch condition in the PF-AR (3 GeV). Blue circles are the experimental results and red line is the calculated one.

104 Accelerators
totally-refl ected pulse from the short end. The magnetic pulse duration of the 6.25 Ω kicker magnet was mea-sured with a single-turned search coil [1]. A sample result of magnetic pulse duration measurement is shown in Fig. 24. From this magnetic fi eld measurement pulse duration time of 1.25 µsec was obtained.
The performance of the pulse bump with the new kicker system was investigated by the use of an opti-cal SR monitor. The optical layout of the SR monitor is shown in Fig. 25. The light from the synchrotron radiation source magnet in the injection bump follows an 8 m path to the underground optical dark room where the focusing system and the gated camera are installed. A doublet lens with focal length of 1000 mm is used as an objec-tive lens and a magnifying lens is installed in front of the gated camera.
In order to investigate the pulse shape of the injection bump, we have measured the beam position using the focusing system by scanning the kicker magnet timing. A result of the pulse shape of the injection bump is shown in Fig. 26. From this optical measurement, we obtained
beam current conditions.However, this work shows that considerable numbers
of residual gas ions can be trapped even with extremely low beam currents [4], and remarkable changes in the vertical tune observed. From the linear theory of ion trap-ping [2,3] a threshold current below which the gas ions can be trapped stably in the electron beam can be esti-mated. For single-bunch conditions, the threshold current Ithres for ions with atomic number A in charge state Z is given by,
where q is the electron charge, c is the speed of light, σx,y are the horizontal(x) and vertical(y) beam sizes, rp is the classical proton radius and C is the circumference of the ring. It is expected that below the threshold current ions can be trapped and the change in the vertical tune becomes prominent. The threshold current for trapping of CO+ ions one of the main residual gas molecules in the KEK-PF and the PF-AR, is estimated to be 1.8 mA for KEK-PF and 1.0 mA for the PF-AR, roughly correspond-ing to the beam currents at which the dependence of the vertical tune on the beam current changes as described above.
It is expected that the threshold current depends strongly on ring circumference, and we are now planning to perform the same beam diagnostic experiment in an-other storage ring that has a smaller circumference than either KEK-PF or PF-AR. Measurements of the depen-dence of the threshold current and the tune shift on beam size are also planned.
References[1] A. Chao, Physics of Collective Instabilities in High Energy
Particle Accelerators, (Wiley, New York, 1993). [2] R. D. Kohaupt, DESY Interner Bericht No. H1-71/2(1971)
(unpublished).[3] Y. Baconnier, G. Brianti, CERN Internal Report No. CERN/
SPS/80-2 (DI) (1980) (unpublished).[4] A. Mochihashi, M, Katoh, M. Hosaka, K. Hayashi, J. Yamazaki,
Y. Takashima and Y. Hori, submitted to Jpn. J. Appl. Phys.
Investigation of injection for the low-emittance lattice with new 6.25 Ω kicker magnet system
A new kicker magnet system was installed in 2002 in the Photon Factory (PF) to realize full-aperture injection for the low-emittance lattice [1]. The new kicker magnet is based on a travelling-wave kicker magnet with a char-acteristic impedance of 6.25 Ω. In order to investigate the performance of the pulse injection bump with the new system, we have used an optical observation method with a high-speed gated camera. The motion of the injected beam is also investigated by the same optical observa-tion method. A photograph of the kicker magnet installed in the PF ring is shown in Fig. 23.
We apply a short end for the output lead of the mag-net to excite the magnet with the input pulse and the
( )Z
A
Cr
qcI
p
yxythres 2
2σσσ +
=
Figure 23Photograph of the kicker magnet installed in the PF ring. The kicker magnet is covered with a shield box made of aluminum.
Figure 24Magnetic pulse duration of kicker magnet measured with single turned search coil.

105Accelerators
In the fi rst stage, we regulate kicker magnet No. 4 to fi nd a closed bump condition. In the next stage, we add a regulation of kicker magnet No. 3 together with No. 4. The results of this regulation are shown in Fig. 28(a) and (b). The coherent oscillation in the horizontal and the ver-tical directions becomes smaller. Only the injected beam directs from septum magnet appears to the left-hand and later turns oscillate in the right side like as a bulk. This result shows that the injection pulse bump is reproved by the time of the next turn of the injected beam.
The coherent oscillation of the injected beam in the fi rst 15 turns of low-emittance lattice is shown in Fig. 29.
In this case, we found a better condition for the in-jection bump and the observed coherent oscillation is smaller. The coherent oscillation of the injected beam is observed by measuring the position of the injected beam
a pulse duration time of 1.25 µsec, in agreement with the results of the magnetic fi eld measurement. Considering the bump orbit is exited by four independent kicker mag-nets, this result indicates that the timing errors in the four kicker magnets are negligibly small.
A turn-by-turn image of the injected beam can be ob-served with the same optical observation method. At the beginning of the observation, we set the design intensi-ties for the four kicker magnets. Fig. 27 shows images from the fi rst 15 turns of the injected beam superimposed in one frame of CCD. The beam image separated on the left-hand side is the beam directly after leaving the sep-tum magnet. On the right hand side, we can see the fi rst 15 turns of the injected beam. The amplitude of coherent motion under these conditions is about ±5 mm.
A vertical coherent oscillation is also observed, as can be seen from Fig. 27. By using this observation system, we can optimize the intensity balance of the four kicker magnets to realize a closed bump. Fig. 28 shows two im-ages of the fi rst 15 turns of the injected beam observed in two stages of regulation of the kicker magnets.
Magnifier
camera
K1 B26 K2
K3 B27
K4
SR
Injection point
Objective lens
Figure 25Arrangement of kicker magnets and optical layout of the SR monitor. K1,2,3,4 denote kicker magnet No.1,2,3,4. B26,27 denotes bending magnet No.26,27.
-5.0
0.0
5.0
10.0
15.0
20.0
-0.5 0 0.5 1 1.5 2 2.5
Bum
p he
ight
(m
m)
time (µsec)Figure 26Duration of injection bump measured by optical observation.
Figure 27Result of coherent motion of fi rst 15 turns of the injected beam. The images a re superimposed in one frame of CCD.
Figure 28Two images of the fi rst 15 turns of the injected beam observed in the two stages of regulation of two kicker magnets. (a):Regulate K4 only, (b):regulate K3 and K4.
Figure 29Coherent oscil lation of the injected beam over the fi rst 15 turns in the low-emittance lattice.
Figure 30Coherent oscillation of the injected beam in the fi rst 25 turns in the horizontal direction.
-10.0
-5.0
0.0
5.0
10.0
0 5 10 15 20 25
x (m
m)
Turn Number

106 Accelerators
profi le and results for the fi rst 25 turns of coherent oscil-lation in the horizontal direction are shown in Fig. 30. From Fig. 30, the amplitude of the coherent oscillation is determined to be about ±3 mm. After 25 turns, the beam profi le is deformed due to strong nonlinear effects and it becomes diffi cult to evaluate the beam position. Fig. 31 shows two examples of deformed beam profi les at the 50th-turn and 80th-turn.
Reference[1] A. Ueda, T. Ushiku and T. Mitsuhashi, PAC, Chicago, USA
(2001), 4050.
Design and construction of a coronagraph for obser-vation of the beam halo
The beam tail and halo will be a signifi cant problem in future Linac-based machines such as the Linear Collider (LC) and Energy Recovery Linac (ERL). To develop ap-paratus to observe the beam tail or halo, we have applied the concept of a coronagraph. The coronagraph is a spa-tial telescope used to observe the sun-corona by creating an artifi cial eclipse [1]. The concept of this apparatus is to block the glare of the central image and to observe hid-den images such as that of the sun-corona. We have ap-plied this concept for the observation of the surrounding structure (halo, tail) of the beam. Since the background is mainly due to scattered light from the objective lens, the key point for operation of the coronagraph is to reduce scattered light from the objective lens. We used a very well polished objective lens, and managed to obtain a sig-nal to background ratio of better than 10-5. As a test, we tried to observe the tail of the beam by using the corona-graph at the Photon Factory storage ring. We succeeded in observing the tail of beam which has an intensity range of 1/104 of the peak intensity.
The optical layout of the coronagraph is illustrated in Fig. 32. The fi rst lens (objective lens) makes a real im-age of the object (beam image) on a blocking disk which makes an artifi cial eclipse. The second lens (fi eld lens) which is located just after the blocking disk makes a real image of the objective lens onto a mask (Lyot Stop). The diffraction fringes are re-diffracted by the fi eld lens aperture, making a diffraction ring on the focal plane of the fi eld lens. Lyot’s genius idea of the coronagraph is to remove these diffraction rings by using a mask, and to relay the hidden image with a third lens onto the fi nal ob-servation plane [1]. The background light on the fi nal ob-servation plane is now mainly due to the scattering of the
input light by the objective lens. By using well polished lens for the objective, we can reduce the background light less than 10-6 of the main image. With this coronagraph, we can observe a hidden image seperate from the bright main image.
To investigate the performance of the coronagraph, we used it to observe the beam tail at the Photon Factory. We then observed an image of the beam tail by using an opaque disk to block the central beam image and a Lyot stop. Since the image of the beam tail is very weak, we increased the exposure time of the CCD camera. The re-sulting beam tail image is shown in Fig. 34. The exposure time used was 10 msec. Considering the difference in exposure time, the intensity scale in Fig. 34 is 1000 times smaller than the intensity scale in Fig. 33.
A comparison of beam tails measured with and with-out the opaque disk and Lyot stop is given in Fig. 35. Both intensities are normalized to the peak intensity of the central beam image. The intensity of beam tail image with diffraction taken without the opaque disk and Lyot stop is in the range of 10-2 of the peak. With opaque disk and Lyot stop, we succeeded in observing the tail of the beam which has an intensity range of 1/104 of the peak intensity.
In conclusion, we have developed and constructed a coronagraph for the observation of the beam halo or tail surrounding the main beam. We succeeded in obtaining a signal to background ratio better than 10-5. To investi-gate the performance of the coronagraph, we measured the beam tail at the Photon Factory, and succeeded in observing the tail of the beam which has an intensity range of 1/104 of the peak intensity. The coronagraph is
Figure 31Deformed beam profi les at 50th-turn (a) and 80th-turn (b).
Figure 33Image beam profi le without the opaque disk. Exposure time of CCD camera is 10 µsec.
Figure 32Layout of optical system of the coronagraph.
Objective
Field lens
Lyot stop
Relay
Opaque disc
lens
lens
Figure 34Image of beam tail with the opaque d isk . Transverse magnifi cation is same as in Fig. 33. Exposure time of CCD camera is 10 msec.
107Accelerators
applicable not only to observing the beam tail or halo, but also has many other possible applications such as the observation of the injected beam under the presence of stored beam, by use of the high S/N ratio inherent to the technique.
Reference[1] B.F.Lyot Month. Notice Roy. Ast. Soc, 99 (1939) 580.
Experiments at BL-21One of the latest and most serious problems in proton
and positron storage rings is a single-beam instability due to the electron cloud around the beam, the electron cloud instability (ECI). For example, in the positron storage ring of the KEK B-Factory (KEKB), a blowup of the vertical beam size has been observed which limits the luminos-ity [1]. Reduction of the electron emission from the inner surfaces of the beam ducts is an effective remedy for this problem. At BL-21 of the Photon Factory, photoelectron yields from copper chambers under various surface con-ditions have been studied. It has been found so far that the photoelectron yield from surfaces with the saw-tooth-like profi les is less than 10% that from smooth surfaces [2-4] for photons with a critical energy of 4 keV and an incident angle of 52 mrad.
In FY2003, the photoelectron yields from two different kinds of surfaces were studied. One surface was rough-ened by a glass beads blast (GBB) and the other coated with non-evaporable getter (NEG) materials; in this case Ti, Zr and V. GBB surface are available even for a long chamber, 3 m for example, and is more practical than the machined saw-tooth structure. The mean roughness (Ra) for the GBB structure was about 7, and the total pressure in the test chamber during the measurement was of the order of 10-5~10-4 Pa.
The NEG coated surface is said to have a small sec-ondary electron yield [5-6], effective in suppressing the multipactoring of electrons. There are, however, little data available for the photoelectron yield, although it is an im-portant property. The coating was deposited by magne-
tron sputtering in an argon atmosphere to a thickness of approximately 3 µm. The coating consists of 41% Ti, 12% Zr and 47% V (as determined by X-ray spectroscopy). To activate the coated NEG, the chamber was baked at 200°C for about 2 hours. After the activation, the pres-sure was of the order of 10-6 Pa.
The photoelectron yield was measured for a photon dose (integrated photon density) of about 3 × 10²¹ pho-tons m-1. Table 6 shows the photoelectron yield, η [elec-trons per photon], the refl ectivity, R [%], and the effective photoelectron yield, η*= η/(1−R) [electrons per photon] for several different surfaces. The η* for the GBB surface decreased to about 7% of that of the smooth surface, and was comparable to the machined saw-tooth surfaces. The GBB surface was found to be useful as well as the saw-tooth like structure.
On the other hand, the η* of the non-activated NEG surface was almost the same as the smooth surface. After the activation, however, the η* decreased to about 60% of that in the case before activation. This represents a signifi cant change, since no change of η* was observed after baking for the non-coated copper chamber. Since activation does not change the roughness of the surface, this reason may be due to the change of the surface composition by the activation, for example, the removal of oxide [7]. The NEG coating does not reduce the pho-toelectron yield suffi ciently compared to a rough surface, although the secondary electron yield may be small.
Figure 35Comparison of beam tail measurements; red circles denote beam tail without opaque disk, blue squares denote beam tail measured with opaque disk and Lyot stop. The horizontal axis is normalized by 1σ of the beam size.
10 -5
0.0001
0.001
0.01
0.1
0 2 4 6 8 10 12 14
holizontal beam size
inte
nsity
R [%] η*
Smooth (Ra=0.02)Machining (Ra=7)
Rolling tap
SawTooth_1SawTooth_2
GBBNEG (non-activated)NEG (activated)
0.29 33.2 0.4340.04 1.1 0.040.016 0.18 0.0160.022 0.018 0.16 0.0180.030 0.20 0.0300.32 19.5 0.390.19 14.8 0.23
η [%] η*
Smooth (Ra=0.02)Machining (Ra=7)
Rolling tap
SawTooth_1SawTooth_2
GBBNEG (non-activated)NEG (activated)
0.29 33.2 0.4340.04 1.1 0.040.016 0.18 0.0160.022 0.018 0.16 0.0180.030 0.20 0.0300.32 19.5 0.390.19 14.8 0.23
η
Table 6 Photoelectron yield, η, and effective photoelectron yield, η*, which is calculated by by η/(1−R) considering refl ectivity, R.
References[1] K. Akai, N. Akasaka, A. Enomoto, J. Flanagan, H. Fukuma, Y.
Funakoshi, K. Furukawa, T. Furuya, J. Haba and S. Hiramatsu , Nucl. Instrum. Methods Phys. Res. A, 499 (2003)191.
[2] Y. Suetsugu, Y. Tanimoto, Y. Hori, K. Kanazawa and M. Kobayashi, J. Vac. Soc. Jpn. 46 (2003) 158.
[3] Y. Suetsugu, Y-J. Hsu, Y. Tanimoto, Y. Hori, K. Kanazawa and M. Kobayashi, KEK Report 2000-12, January 2001 A.
[4] Y. Suetsugu, M. Tsuchiya, T. Nishidono, N. Kato, N. Satoh, S. Endo and T. Yokoyama, J. Vac. Sci. Technol. A21 (2003) 186.
[5] B. Henrist, N. Hilleret, C. Scheuerlein and M. Taborelli, Appl. Surf. Sci. 172 (2001) 95.
[6] C. Benvenuti, J. M. Cazeneuve, P. Chiggiato, F. Cicoira, A. Escudeiro Santana, V. Johanek, V. Ruzinov and J. Fraxedas, Vacuum 53 (1999) 219.
[7] A. A. Krasnov, private communication.

![INDEX [korea.kyocera.com] · CM03 (0201) Rated Voltage(Vdc) Capacitance 16 25 50 1R0 1.0 pF 1R5 1.5 pF 2R0 2.0 pF 3R0 3.0 pF 4R0 4.0 pF 5R0 5.0 pF 6R0 6.0 pF 7R0 7.0 pF 8R0](https://img.pdfslide.us/doc/110x75/5f468f04b73716507c2277fc/index-korea-cm03-i0201i-rated-voltageivdci-capacitance-16-25-50-1r0.jpg)