Embed Size (px)
Citation preview
1
PEV Integration ProjectNYISO – Markets Issues Working Group
August 20th, 2009
Ken Fell: Project Manager and ITC DirectorRalph Masiello: Technical lead - KEMA
2
Project Charter• IRC Sponsor: Gordon Van Welie,
Chief Executive Officer, ISO New England
• Responsible Oversight Committee: Information Technology Committee
• Project Manager: Ken Fell, New York ISO
• Project Budget: $223,000(shared equally by 10 ISO/RTOs)
3
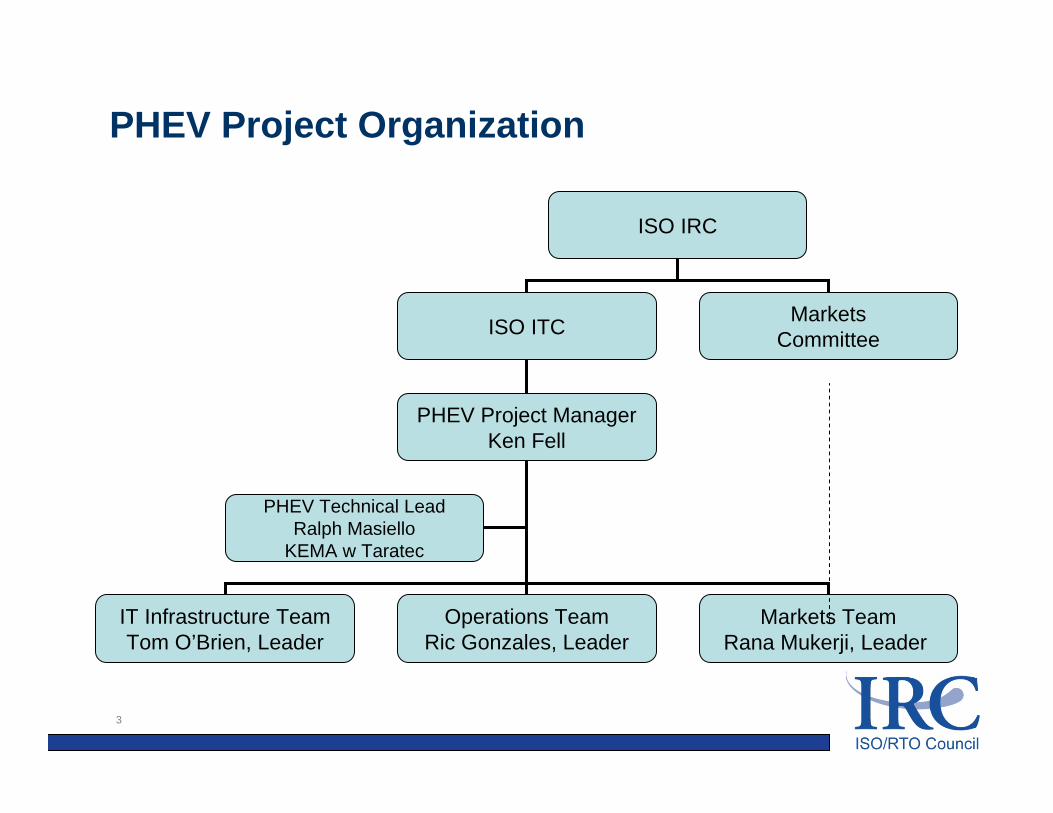
PHEV Project Organization
ISO IRC
ISO ITC
PHEV Project ManagerKen Fell
IT Infrastructure TeamTom O’Brien, Leader
Operations TeamRic Gonzales, Leader
Markets TeamRana Mukerji, Leader
PHEV Technical LeadRalph Masiello
KEMA w Taratec
MarketsCommittee
4
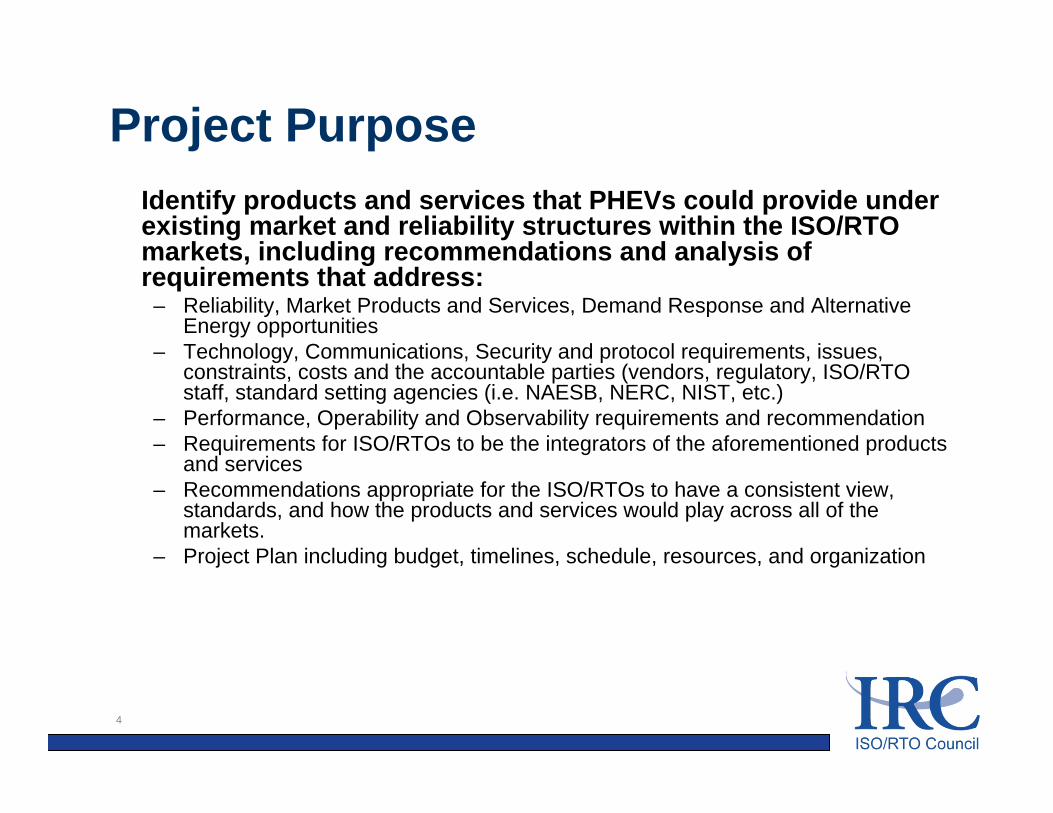
Project PurposeIdentify products and services that PHEVs could provide under existing market and reliability structures within the ISO/RTO markets, including recommendations and analysis of requirements that address:
– Reliability, Market Products and Services, Demand Response and Alternative Energy opportunities
– Technology, Communications, Security and protocol requirements, issues, constraints, costs and the accountable parties (vendors, regulatory, ISO/RTO staff, standard setting agencies (i.e. NAESB, NERC, NIST, etc.)
– Performance, Operability and Observability requirements and recommendation– Requirements for ISO/RTOs to be the integrators of the aforementioned products
and services– Recommendations appropriate for the ISO/RTOs to have a consistent view,
standards, and how the products and services would play across all of the markets.
– Project Plan including budget, timelines, schedule, resources, and organization
5
Project Goal
Provide specific conclusions and recommendations as follows:– Proposed market design and operational requirements– Recommendations for the operational and market infrastructure
development considering V2G, Demand Response and alternative Energy
– Results of detailed modeling and analysis as appropriate to demonstrate feasibility of recommendations and time lines
– Recommendations for development of operational and market infrastructure that provided for visibility to the system operator in real time and integration with EMS systems and pricing algorithms.
– Address Cyber Security, Field Safety, Vehicle Plug and Play Requirements, and the Uniform Grid Code
6
PHEV/EV Integration ProjectScope of Work
Scope of work1. Characterization of the PHEV / EV as grid storage devices – assessment of technical
capabilities.2. Identification services that a PHEV / EV is capable of performing.3. Mapping of possible services to ISO market products and adaptations required.4. Identification of Possible new PHEV / EV products.5. Identifying likely modes of EV / PHEV interaction with the ISO.6. Identifying Communications / IT Infrastructure needs.7. Identifying Settlements and Scheduling Issues associated with Vehicle to Grid products and
services.8. Identifying commonality and variations across the different ISO markets today and how
these may affect Vehicle to Grid products and services.9. Assessing the integration capabilities of currently proposed SAE and IEEE standards.10. Identifying integration technology requirements.11. Developing recommended first stage products and services for implementation.12. Developing requirements for first stage infrastructure implementation.13. Development of high level cost estimates of first stage infrastructure.14. Development of potential timelines and participation levels.15. Final Report and Presentation.
7
PHEV/EV Integration ProjectHigh Level Project Schedule
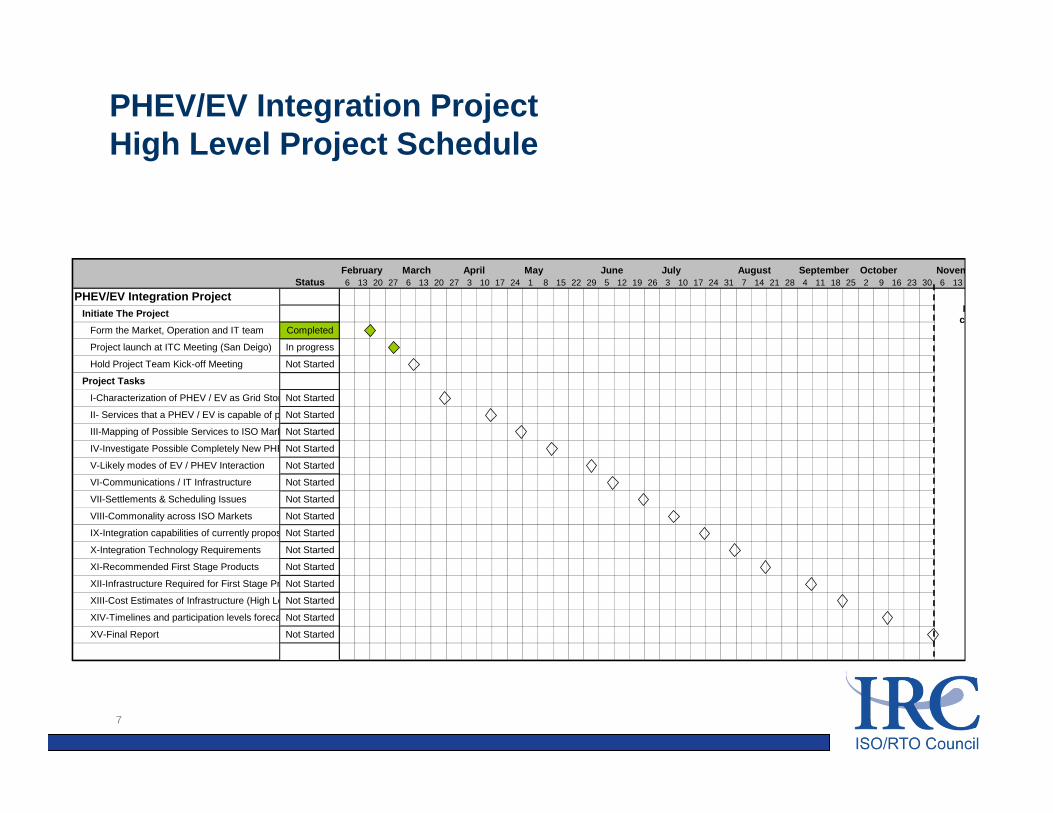
February March April May June July August September October Novem6 13 20 27 6 13 20 27 3 10 17 24 1 8 15 22 29 5 12 19 26 3 10 17 24 31 7 14 21 28 4 11 18 25 2 9 16 23 30 6 13
Initiate The Project
Pp
co
StatusPHEV/EV Integration Project
Not Started
In progress
Not Started
Not Started
Not Started
Not Started
Not Started
Not Started
IX-Integration capabilities of currently propos
Not Started
Not Started
Not Started
Not Started
Not Started
Not Started
VIII-Commonality across ISO Markets
XI-Recommended First Stage Products
I-Characterization of PHEV / EV as Grid Stor
Completed
Project launch at ITC Meeting (San Deigo)
Project Tasks
Form the Market, Operation and IT team
Not Started
Hold Project Team Kick-off Meeting
Not Started
Not StartedVII-Settlements & Scheduling Issues
II- Services that a PHEV / EV is capable of p
III-Mapping of Possible Services to ISO Mark
IV-Investigate Possible Completely New PHE
XV-Final Report
XIII-Cost Estimates of Infrastructure (High Le
X-Integration Technology Requirements
XIV-Timelines and participation levels foreca
VI-Communications / IT Infrastructure
V-Likely modes of EV / PHEV Interaction
XII-Infrastructure Required for First Stage Pr
8
Project Management and TeamProject manager is Ken Fell and the overall technical lead is Ralph Masiello,
who will report to Ken. Ken and Ralph will meet with the team leads every two weeks (at minimum, more frequently if necessary).
The project manager will– Provide overall guidance and reporting for the project– Hold oversight meetings with the project team members on a regular basis (at minimum
monthly project meetings, with every alternate meeting being in person).– Provide monthly progress reports to the IRC, which will include a dashboard that speaks
to progress (schedule, scope and budget) and risks/opportunities. This is the mechanism to highlight issues to the IRC.
– Work with the team leads and the Chairs of the Markets and IT Committee to ensure that there is consensus on the findings and recommendations in the report.
The overall technical lead will– Provide overall technical guidance– Provide the integration function amongst the teams and ensure technical consistency in
the work product from the teams.
9
Project Structure
Project Structure• The Project will consist of three teams, each reporting to the
project manager. These teams include a Markets team, a PHEV Operations team and an IT team.
• Each participating ISO is expected to assign someone to each of the teams one person may be on more than one team)
• The Markets team will have a team lead assigned from one of the ISOs by the Chair of the Markets Committee, after consultation with the Markets Committee members.
• The PHEV Operations team lead is (R. Gonzales from the ISOs; Ed Ungar from Taratec for the project)
• The IT team lead will be assigned by the Chair of the ITC, afterconsultation with the ITC members.
10
• Task 1 - Market Development & Characteristics of PEVs
• Task 2 – Description of services a PEV can provide to the grid acting as a controllable load
• Task 3 - Mapping possible services to existing ISO/RTO products and adoptions required
• Task 4 - Potentially new PEV services• Task 5 - Likely modes of PEV interactions• Task 6 - Communication / IT infrastructure
Completed Task Summary
11
Task 7 Impact on Settlements
Task 14* PEV market penetration study
* Note: Task 14 also considers accelerated market penetration
Tasks In Progress
12
Task 8 Commonality acoss ISO Markets
Task 9 Integration capabilities of currently
proposed SAE / IEEE Standards
* Note: Task 14 also considers accelerated market penetration
Next Tasks
External Linkages
• EPRI Infrastructure Working Group– Dave Hackett / Ken Huber are supporting / reporting
• NIST Smart Grid Standards– Many linkages; Ken Huber especially– Meeting with George Arnold at NIST (Ken, Tom O’Brien, Ralph
Masiello) will lead to formalizing interaction and a formal role for IRC / ITC in NIST advisory committee
• FERC– Gordon / Tom have briefed Jamie Simler @ FERC
• EU Initiatives– Several; KEMA providing cross-fertilization to efforts in the NL
and Germany
Additional Stakeholder Input
• Google announced PEV control software demo’dat KEMA conference last month
• IBM working in NL and Denmark on PEV integration with renewables
• Better Place promoting charging infrastructure and different business model
• Process: informal meetings for data gathering and feedback on an ongoing basis
USA Developing PEV Standards
• SAE Standards (evolving standards)– J1772 – Definition of the PHEV or EV
standard connector– J2836 - Definition of the PEV interaction
between Vehicle and charger/utility– J2847 – Definition of the messaging (format
and content); tightly associated with J2836• Opportunities to test connector (expecting
UL approval in May 09 for level 1-2) and EVSE (charger)
IEC Standards / J1772 Harmonization
• Committee entertained 3 connectors from the international community (1 was withdrawn). Candidates are
– US SAE J1772 (Single phase, 32 Amp, 230 VAC, 5 pins)– Germany/Several Europe countries – want single and three phase
connectors (70 Amp (single phase) and 63 Amp (three phase), 500 VAC, 7 pins)
– Italy (Single phase, 16 Amp, 230 VAC, 4-5 pins)• Agreed to enter all three connector and vote on all at same time.
Need at least 18 yes votes to be approved (out of 24 voting countries)
• Best case time frame for an international standard is March 2010; June – distributed
• Opportunity – Test the connector, charger and batteries
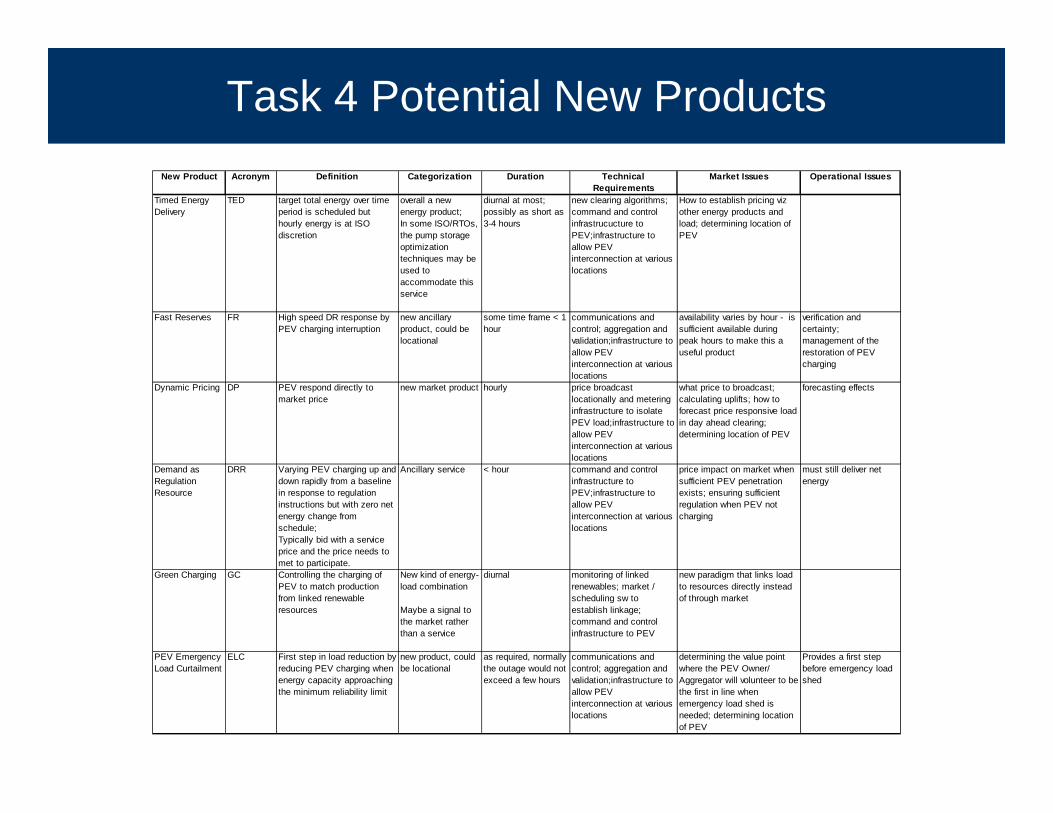
Task 4 Potential New ProductsNew Product Acronym Definition Categorization Duration Technical
RequirementsMarket Issues Operational Issues
Timed Energy Delivery
TED target total energy over time period is scheduled but hourly energy is at ISO discretion
overall a new energy product;In some ISO/RTOs, the pump storage optimization techniques may be used to accommodate this service
diurnal at most; possibly as short as 3-4 hours
new clearing algorithms; command and control infrastrucucture to PEV;infrastructure to allow PEV interconnection at various locations
How to establish pricing viz other energy products and load; determining location of PEV
Fast Reserves FR High speed DR response by PEV charging interruption
new ancillary product, could be locational
some time frame < 1 hour
communications and control; aggregation and validation;infrastructure to allow PEV interconnection at various locations
availability varies by hour - is sufficient available during peak hours to make this a useful product
verification and certainty;management of the restoration of PEV charging
Dynamic Pricing DP PEV respond directly to market price
new market product hourly price broadcast locationally and metering infrastructure to isolate PEV load;infrastructure to allow PEV interconnection at various locations
what price to broadcast; calculating uplifts; how to forecast price responsive load in day ahead clearing; determining location of PEV
forecasting effects
Demand as Regulation Resource
DRR Varying PEV charging up and down rapidly from a baseline in response to regulation instructions but with zero net energy change from schedule; Typically bid with a service price and the price needs to met to participate.
Ancillary service < hour command and control infrastructure to PEV;infrastructure to allow PEV interconnection at various locations
price impact on market when sufficient PEV penetration exists; ensuring sufficient regulation when PEV not charging
must still deliver net energy
Green Charging GC Controlling the charging of PEV to match production from linked renewable resources
New kind of energy-load combination
Maybe a signal to the market rather than a service
diurnal monitoring of linked renewables; market / scheduling sw to establish linkage; command and control infrastructure to PEV
new paradigm that links load to resources directly instead of through market
PEV Emergency Load Curtailment
ELC First step in load reduction by reducing PEV charging when energy capacity approaching the minimum reliability limit
new product, could be locational
as required, normally the outage would not exceed a few hours
communications and control; aggregation and validation;infrastructure to allow PEV interconnection at various locations
determining the value point where the PEV Owner/ Aggregator will volunteer to be the first in line when emergency load shed is needed; determining location of PEV
Provides a first step before emergency load shed

Task 14: Objective
The objective of Task 14:
Develop projections of the market penetration of PEVs among the ISOs and RTOs, including their locations, to provide an understanding of the amount of PEV charging loads
– (a) overall, among the individual ISOs and RTOs– (b) in concentrations that provide the opportunity for ISO and
RTO demand response management
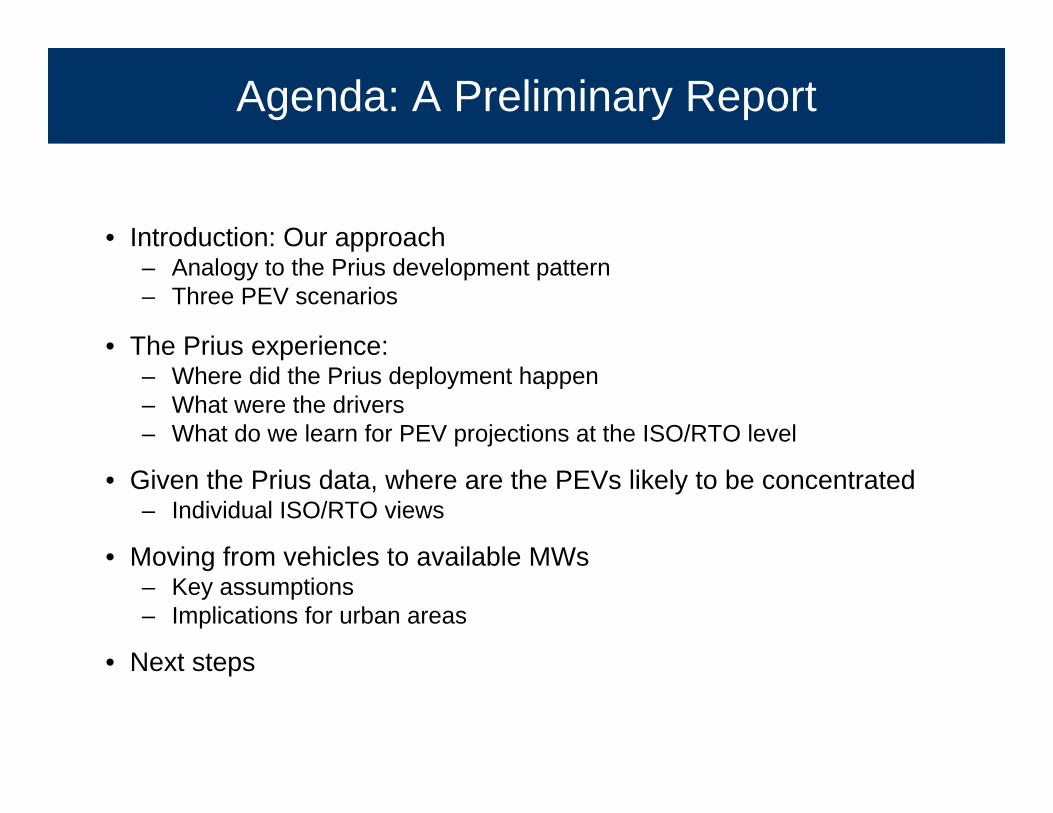
Agenda: A Preliminary Report
• Introduction: Our approach– Analogy to the Prius development pattern– Three PEV scenarios
• The Prius experience:– Where did the Prius deployment happen– What were the drivers– What do we learn for PEV projections at the ISO/RTO level
• Given the Prius data, where are the PEVs likely to be concentrated– Individual ISO/RTO views
• Moving from vehicles to available MWs– Key assumptions– Implications for urban areas
• Next steps
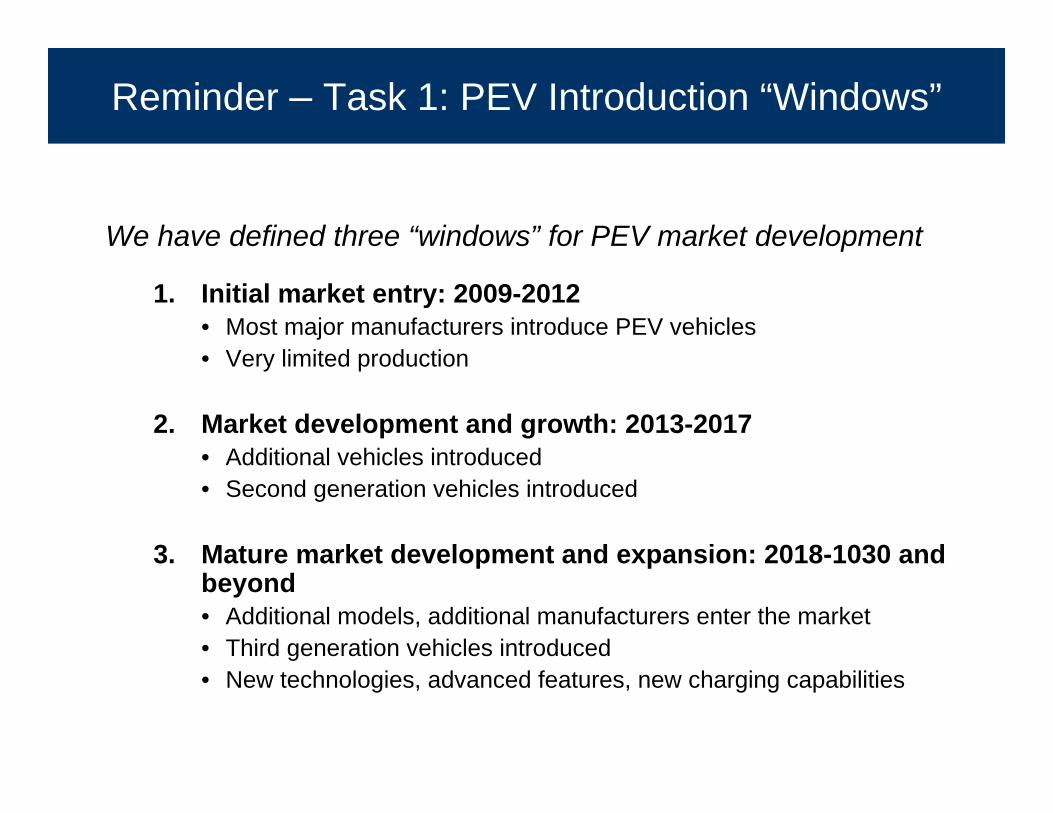
Reminder – Task 1: PEV Introduction “Windows”
We have defined three “windows” for PEV market development
1. Initial market entry: 2009-2012• Most major manufacturers introduce PEV vehicles• Very limited production
2. Market development and growth: 2013-2017• Additional vehicles introduced• Second generation vehicles introduced
3. Mature market development and expansion: 2018-1030 and beyond• Additional models, additional manufacturers enter the market• Third generation vehicles introduced• New technologies, advanced features, new charging capabilities
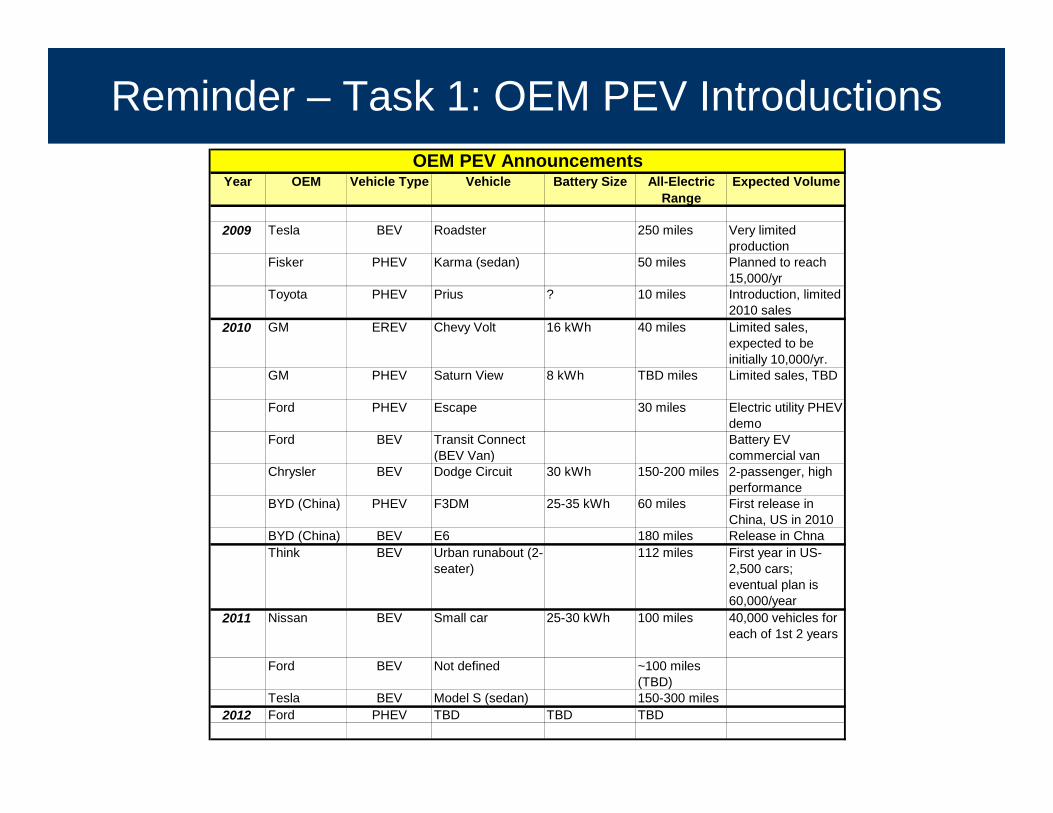
Reminder – Task 1: OEM PEV Introductions
Year OEM Vehicle Type Vehicle Battery Size All-Electric Range
Expected Volume
2009 Tesla BEV Roadster 250 miles Very limited production
Fisker PHEV Karma (sedan) 50 miles Planned to reach 15,000/yr
Toyota PHEV Prius ? 10 miles Introduction, limited 2010 sales
2010 GM EREV Chevy Volt 16 kWh 40 miles Limited sales, expected to be initially 10,000/yr.
GM PHEV Saturn View 8 kWh TBD miles Limited sales, TBD
Ford PHEV Escape 30 miles Electric utility PHEV demo
Ford BEV Transit Connect (BEV Van)
Battery EV commercial van
Chrysler BEV Dodge Circuit 30 kWh 150-200 miles 2-passenger, high performance
BYD (China) PHEV F3DM 25-35 kWh 60 miles First release in China, US in 2010
BYD (China) BEV E6 180 miles Release in Chna Think BEV Urban runabout (2-
seater)112 miles First year in US-
2,500 cars; eventual plan is 60,000/year
2011 Nissan BEV Small car 25-30 kWh 100 miles 40,000 vehicles for each of 1st 2 years
Ford BEV Not defined ~100 miles (TBD)
Tesla BEV Model S (sedan) 150-300 miles2012 Ford PHEV TBD TBD TBD
OEM PEV Announcements

Taratec Methodology
The challenge– How to project development of a PEV technology that has yet to be
introduced?The two issues
– Market size: How many, total– Market distribution: How many, where
Approach - Market size– Use Obama administration “1 million PEVs in 5 years” target
Approach - Market distribution– Consumer choice: use Prius sales as a proxy for early adopter behavior
and scale Prius choices to the “1 million vehicles” target– Fleet vehicles: use major urban areas as “sweet spot” for BEV fleets– BEVs: assume 85% of BEVs will be deployed in the largest urban areas,
generally by fleet operatorsNote: All Prius data provided by R. L. Polk
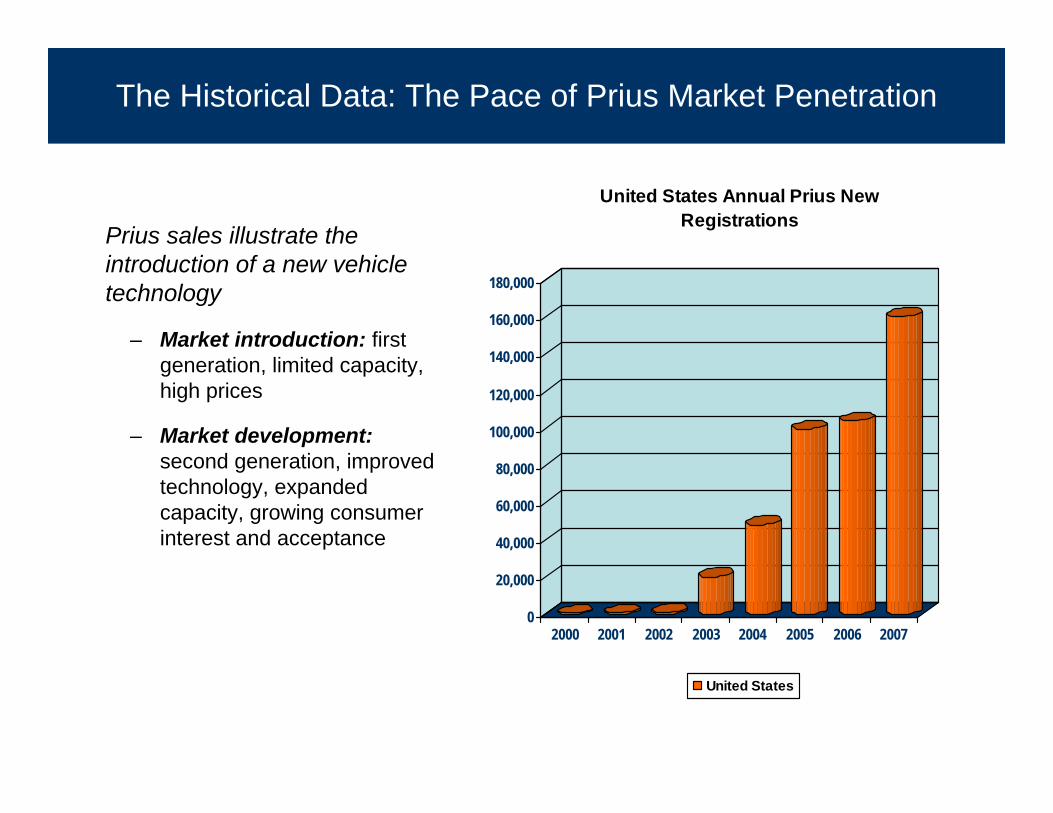
The Historical Data: The Pace of Prius Market Penetration
Prius sales illustrate the introduction of a new vehicle technology
– Market introduction: first generation, limited capacity, high prices
– Market development:second generation, improved technology, expanded capacity, growing consumer interest and acceptance
0
20,000
40,000
60,000
80,000
100,000
120,000
140,000
160,000
180,000
2000 2001 2002 2003 2004 2005 2006 2007
United States Annual Prius New Registrations
United States

When Will They Matter: The Pace of Market Development
We have assumed three scenarios for PEV market development
– Base case: Obama administration “1 million in five years”
– Slow case: Much slower consumer demand growth (1 million in eight years)
– Fast case: Much more rapid acceptance (1 million in four years)
Overview: What have we learned about Prius distribution?
Where have the Prius sales gone?
What can we learn about possible differences in consumer preferencesamong the states and cities in the US, and among the ISO/RTO regions?
What can we learn about the possible overall size of PEV concentrations in the ISO/RTO regions and cities?
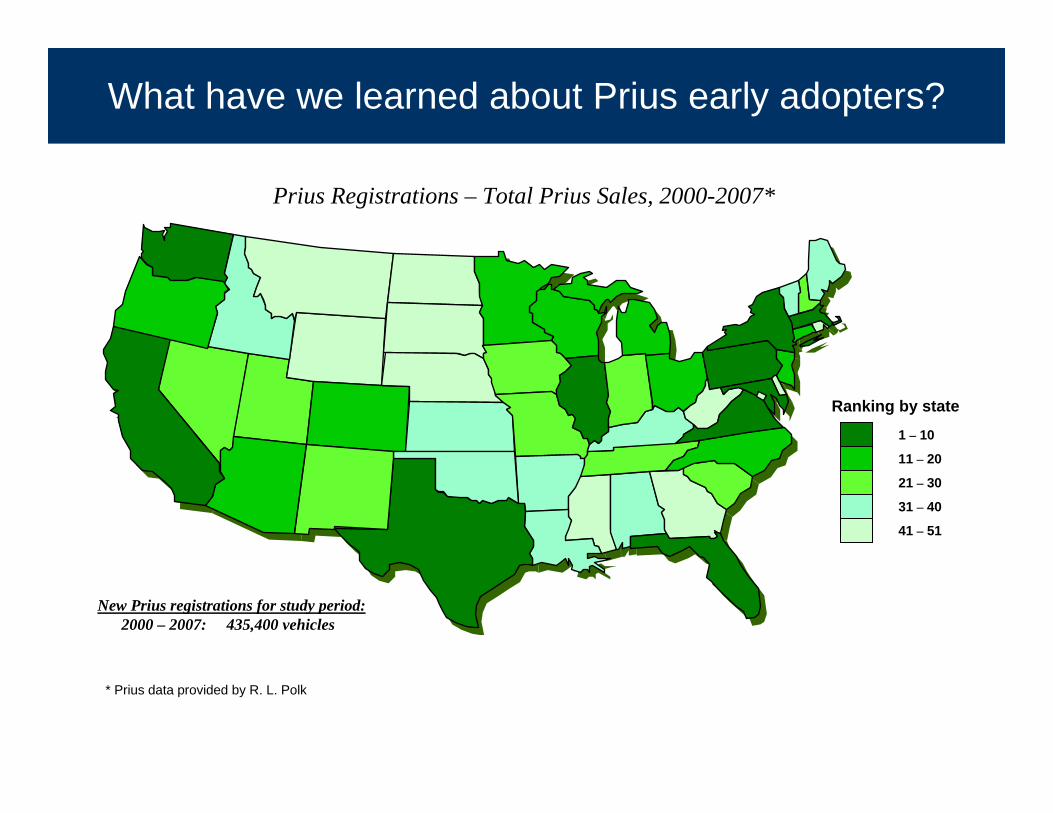
What have we learned about Prius early adopters?
Prius Registrations – Total Prius Sales, 2000-2007*
Ranking by state
1 – 10
11 – 20
21 – 30
31 – 40
41 – 51
New Prius registrations for study period:2000 – 2007: 435,400 vehicles
* Prius data provided by R. L. Polk

What have we learned about early Prius consumers?
Prius Registrations – New Registrations Per Capita, 2000-2007*
Ranking by statePer capita data
1 – 10
11 – 20
21 – 30
31 – 40
41 – 51
2.0 – 3.4
1.3 – 1.9
1,0 – 1,3
0.7 – 1.0
0.3 – 0.7
RankRegistrations
per 1,000
New Prius registrations for study period:2000 – 2007: 435,400 vehicles
* Prius data provided by R. L. Polk
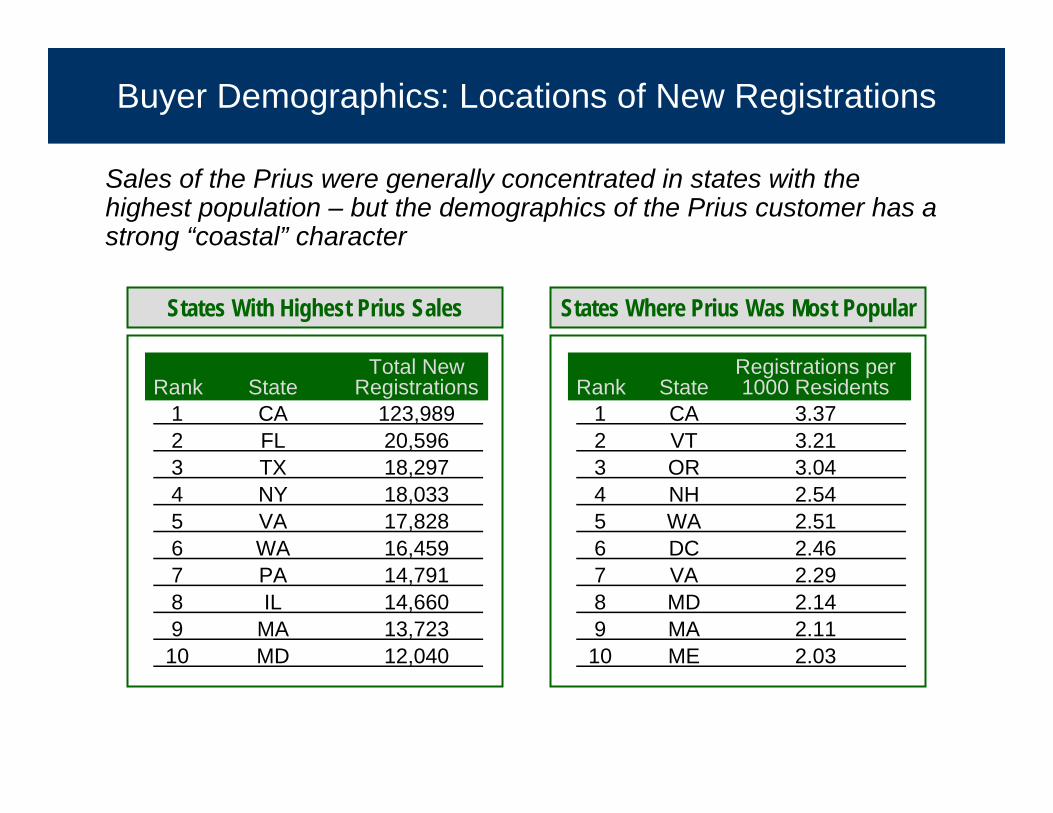
Buyer Demographics: Locations of New Registrations
Sales of the Prius were generally concentrated in states with the highest population – but the demographics of the Prius customer has a strong “coastal” character
Total NewRank State Registrations
1 CA 123,9892 FL 20,5963 TX 18,2974 NY 18,0335 VA 17,8286 WA 16,4597 PA 14,7918 IL 14,6609 MA 13,72310 MD 12,040
States With Highest Prius Sales
Registrations perRank State 1000 Residents
1 CA 3.372 VT 3.213 OR 3.044 NH 2.545 WA 2.516 DC 2.467 VA 2.298 MD 2.149 MA 2.1110 ME 2.03
States Where Prius Was Most Popular

Buyer Demographics: Urban Concentrations
The distribution of the Prius sales and new registrations was heavily concentrated in the largest urban areas, which account for 31.6% of total U.S. sales
Total NewRank State Registrations
1 CA 123,9892 FL 20,5963 TX 18,2974 NY 18,0335 VA 17,8286 WA 16,4597 PA 14,7918 IL 14,6609 MA 13,72310 MD 12,040
States With Highest Prius Sales
Total New % ofRank Metro Area Registrations US
1 New York 18,622 3.7%2 Los Angeles 52,700 10.4%3 Chicago 9,400 1.9%4 Wash., DC 15,100 8.4%5 San Francisco 42,900 8.4%6 Philadelphia 6,300 1.2%7 Boston 13,200 2.6%8 Detroit 3,000 0.6%9 Dallas 3,200 0.6%10 Houston 3,900 0.8%
Metro Areas Where Prius Was Most Popular
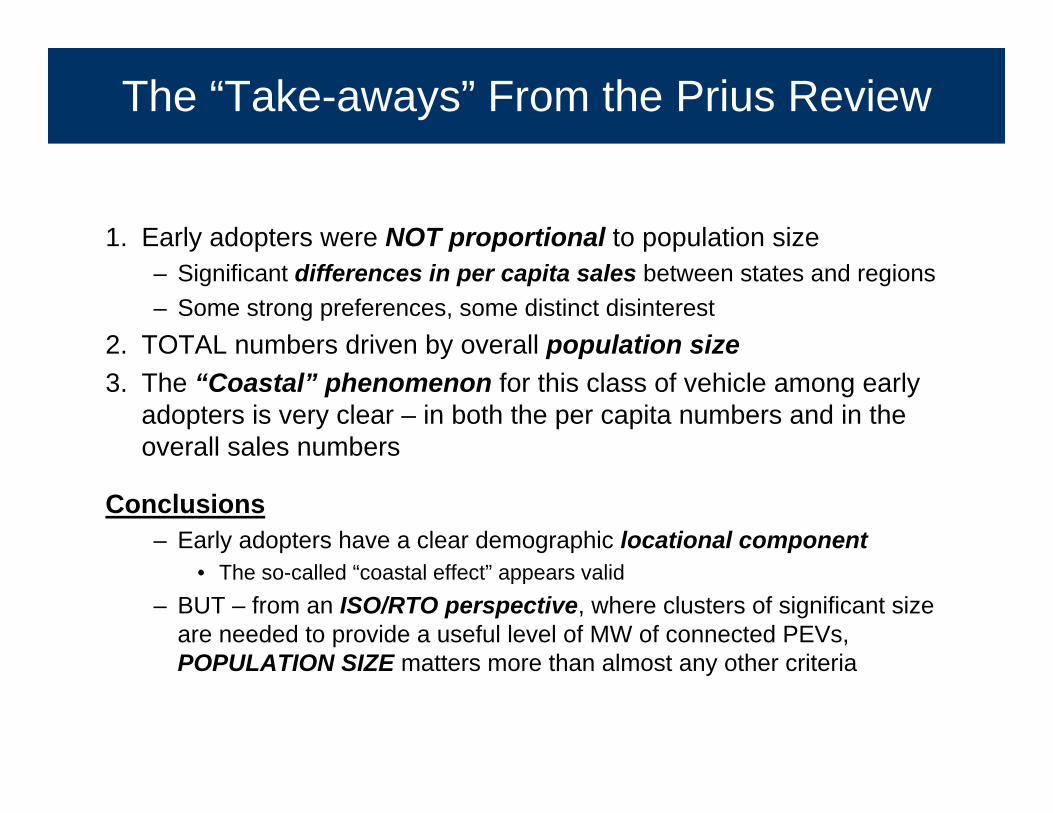
The “Take-aways” From the Prius Review
1. Early adopters were NOT proportional to population size– Significant differences in per capita sales between states and regions– Some strong preferences, some distinct disinterest
2. TOTAL numbers driven by overall population size3. The “Coastal” phenomenon for this class of vehicle among early
adopters is very clear – in both the per capita numbers and in the overall sales numbers
Conclusions– Early adopters have a clear demographic locational component
• The so-called “coastal effect” appears valid– BUT – from an ISO/RTO perspective, where clusters of significant size
are needed to provide a useful level of MW of connected PEVs, POPULATION SIZE matters more than almost any other criteria

PEVs: Where will they land?
• Where are PEVs likely to be concentrated in significant numbers from an ISO/RTO perspective?
• Key to an ISO/RTO perspective– MW – concentrations of PEVs
• One vehicle here and there doesn’t count
• Where will PEVs wind up?– The consumer model: PHEVs and EREVs (and some BEVs)
• The Prius analogy
– The “fleet” model: BEVs• An “urban center” model
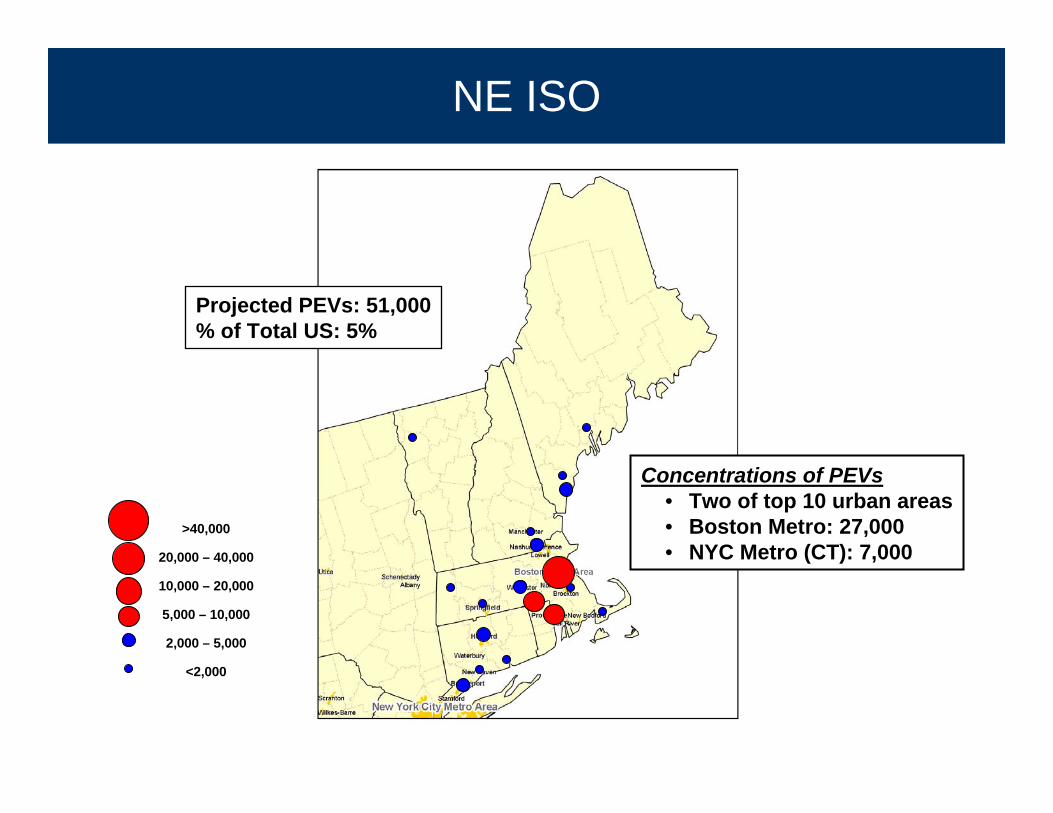
NE ISO
>40,000
20,000 – 40,000
10,000 – 20,000
5,000 – 10,000
2,000 – 5,000
<2,000
Projected PEVs: 51,000% of Total US: 5%
Concentrations of PEVs• Two of top 10 urban areas• Boston Metro: 27,000• NYC Metro (CT): 7,000
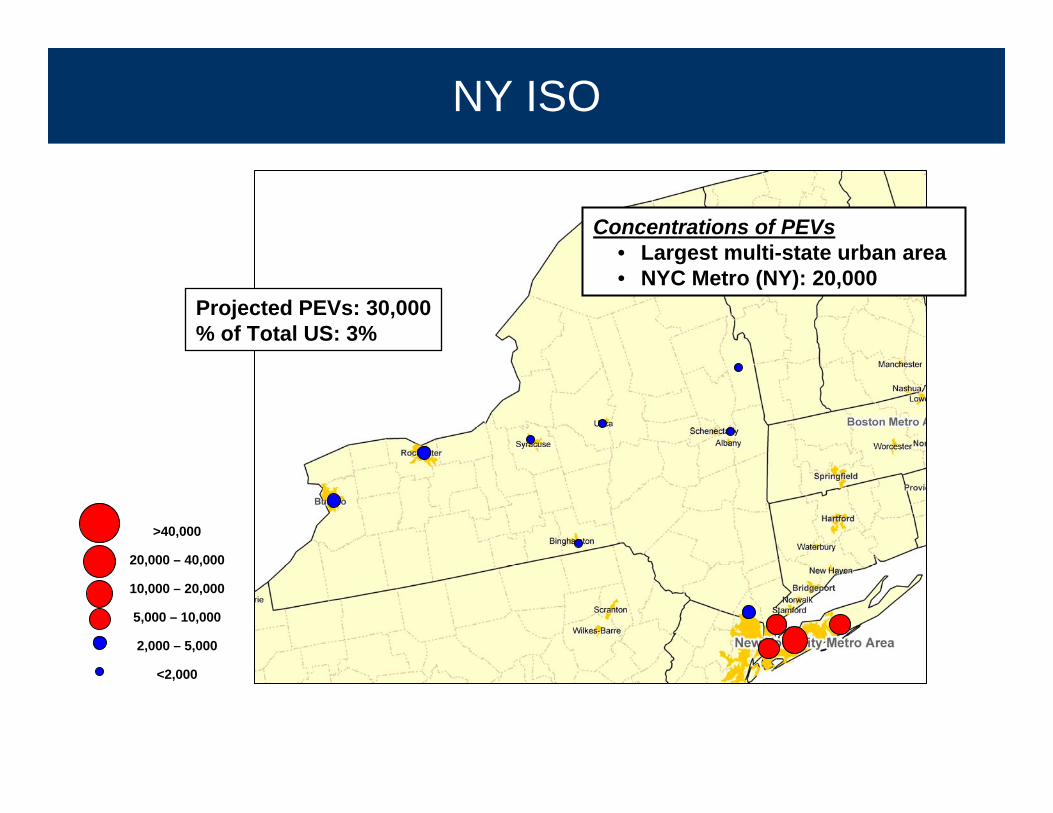
NY ISO
>40,000
20,000 – 40,000
10,000 – 20,000
5,000 – 10,000
2,000 – 5,000
<2,000
Projected PEVs: 30,000% of Total US: 3%
Concentrations of PEVs• Largest multi-state urban area• NYC Metro (NY): 20,000

PJM
>40,000
20,000 – 40,000
10,000 – 20,000
5,000 – 10,000
2,000 – 5,000
<2,000
Projected PEVs: 105,000% of Total US: 10%
Concentrations of PEVs• Four of top 10 urban areas• NY/NJ Metro: 12,000• Chicago Metro: 20,000• Balto/Wash Metro: 30,000• Philadelphia Metro: 14,000
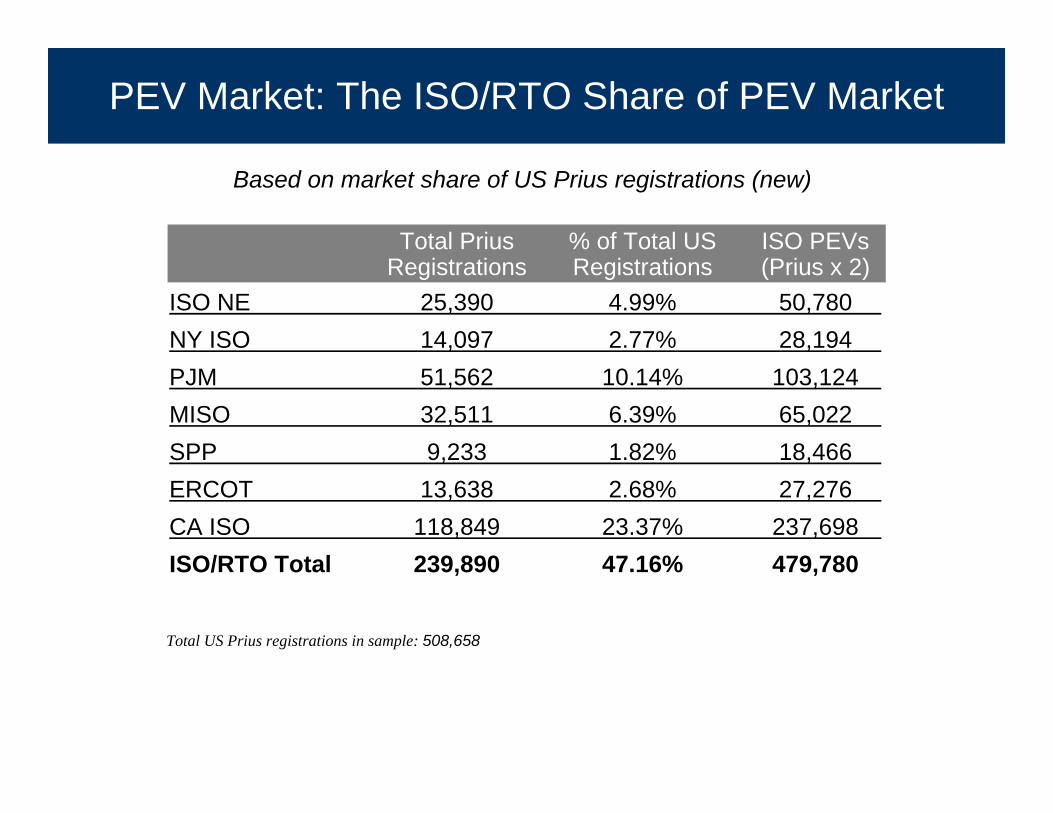
PEV Market: The ISO/RTO Share of PEV Market
Total US Prius registrations in sample: 508,658
Based on market share of US Prius registrations (new)
Total Prius % of Total US ISO PEVsRegistrations Registrations (Prius x 2)
ISO NE 25,390 4.99% 50,780NY ISO 14,097 2.77% 28,194PJM 51,562 10.14% 103,124MISO 32,511 6.39% 65,022SPP 9,233 1.82% 18,466ERCOT 13,638 2.68% 27,276CA ISO 118,849 23.37% 237,698ISO/RTO Total 239,890 47.16% 479,780