Embed Size (px)
Citation preview

PETSEC ENERGY LTD Annual Report 2016
Yemen oil production to market
P E T S E C E N E R GY LT D
A B N 9 2 0 0 0 6 0 2 70 0

P E T S E C E N E R GY LT D
A N N UA L R E P O R T 20 16
Corporate Objective and Strategy
Saudi Arabia
Below: Damis (Block S-1) Yemen –
An Nagyah Oilfield production facilities
Below: Ras Isa Oil Terminal aerial view
Below: Petsec Energy Middle East and North Africa
exploration and production leases
Republic of Yemen
BLOCK 7
BAL HAF TERMINAL (GAS) TERMINAL
ASH SHIHR (OIL) TERMINAL
AL MEASHAR
AN NAGYAH OILFIELD
MARIB PIPELINE ASH SHIHR PIPELINE
HISN AN NUSHAYMAH (OIL) TERMINAL
BLOCK S-1
Corporate objective
Petsec Energy’s corporate objective is to increase shareholder value by increasing the net asset value of the Company through successful oil and gas exploration, development, and production, thereby building Petsec Energy into a significant mid-tier oil and gas exploration and production company, respected in the industry for its technical skills, timely and cost effective delivery of projects, and the integrity with which it conducts its business.
Strategy
The Company’s strategy to meet the above objective is to maximise the value of its current reserves, pursue participation in high quality, high impact exploration drilling opportunities, and to acquire leases, with undeveloped or producing oil and gas reserves, which also hold significant development, low risk exploitation and exploration potential.
Historically, the strategic and geographical focus has been predominately exploration in Louisiana, USA. This focus shifted in 2014 to include oil reserve acquisitions in the MENA region. In the Republic of Yemen, the Company holds two leases. One with undeveloped oil resources, and substantial exploration potential, and the second a production licence over five sizeable oil and gas discoveries, one of which is developed (An Nagyah) and was in production until late in February 2014. The Company will continue to identify and acquire additional developed and undeveloped reserves within the MENA region.
RAS ISA (OIL) TERMINAL
Oman
OIL TRUCK ROUTE

Petsec Energy LtdABN 92 000 602 700
The Company is listed on the Australian Stock Exchange (symbol: PSA) and traded over the counter in the USA as American Depositary Receipts (ADRs) (symbol: PSJEY). Its corporate office is in Sydney, Australia, its USA operations offices are in Houston, Texas and Lafayette, Louisiana, and it’s Middle East and North Africa (MENA) operations offices are in Dubai, United Arab Emirates (UAE) and Sana’a, Yemen.
Annual General Meeting
To be held at: 11 a.m. (AEST) on Thursday, 11th May 2017, at the Museum of Sydney, corner of Bridge and Phillip Streets, Sydney NSW.
Below: Road transport to oil pipeline
facilities East of An Nagyah Oilfield
Above: Ash Shihr Oil Terminal aerial view
Left: Block 7 Yemen – Al Meashar
Oilfield discovery well
Capital Structure*
Australia
Exchange ASXTicker PSAShares on issue 290.3 millionShare price A$0.18Market capitalisation A$52.3 million
USA
Exchange OTC Pink SheetsTicker PSJEY
* At 24 February 2017.
1P E T S E C E N E R GY LT D
A N N UA L R E P O R T 20 16
Contents
Corporate Objective and StrategyIFCCompany Profile and History022016 Year in Review04Chairman’s Report06Operations Review08Oil & Gas Reserves11Directors’ Report13Financial Report for the Year Ended 31 December 201628Exploration and Production Interests67Shareholder Information685 Year Comparative Data Summary69Glossary71Corporate Directory72

P E T S E C E N E R GY LT D
A N N UA L R E P O R T 20 16
2
Petsec Energy Ltd (the “Company”) is an independent oil and gas exploration and production company listed on the Australian Stock Exchange (symbol: PSA) and traded over the counter in the USA in the form of American Depositary Receipts (symbol: PSJEY).
The Company was established on 7th December 1967 and its registered Australian Company Number is: 000 602 700.
The Company through its wholly owned subsidiary companies Petsec Energy Inc. and Petsec Exploration and Production LLC has operations in the shallow waters of the Gulf of Mexico and onshore Louisiana, USA.
The Company also has operations onshore in the Republic of Yemen through its wholly owned subsidiary Petsec Energy (Middle Eastern) Limited.
The Company has been active in the USA since 1989 and has explored offshore in the Gulf of Mexico and onshore in Louisiana, Texas, California, Utah, Colorado, Wyoming, Montana and North Dakota. In the period through 2015, the Company has drilled over 100 wells in the USA and has enjoyed a success rate of 74%.
From 2002 to 2011, the Company was active in the Beibu Gulf, China, participating in the drilling of 7 exploration wells resulting in 3 oil fields being discovered.
In 2014, the Company determined that it wished to pursue both an exploration and an oil reserves acquisitions strategy. Following a strategic review, the Company identified the Middle East & North African (MENA) region as a growth area for the Company where licences with producing oil reserves or near development reserves, with associated high exploration potential, can be acquired at more competitive prices than those in the USA.
In 2015, a non-operated interest in a large licence area was acquired in Yemen, which held a potentially large undeveloped oilfield discovery and a number of drill prospects which held potentially very large
oil reserves ranging up to 900 million barrels of oil. In early 2016, the Company acquired another licence in Yemen, which held five oil and gas fields of which one field, the An Nagyah Oilfield had been developed and was producing until political unrest in 2014 caused it to be shut-in.
The Company’s corporate office is in Sydney, Australia and the Company’s operational offices are located in Houston, Texas, Lafayette, Louisiana, USA, in Dubai, UAE, and Sana’a, Yemen.
Company Profile and History
Below: Onshore Louisiana,
USA – drilling operations
P E T S E C E N E R GY LT D
A N N UA L R E P O R T 20 16
3
Below: Beibu Gulf, China – drilling operations

P E T S E C E N E R GY LT D
A N N UA L R E P O R T 20 16
4
2016 Year in Review
Corporate
• Continued to implement the MENA region oil reserves acquisition strategy.
• Acquired:
– A 100% working interest in Damis (Block S-1) Production Licence in Yemen which holds five sizeable oil and gas discoveries including the developed/productive An Nagyah Oilfield; and
– Increased potential working interest in Block 7, Al Barqa Permit, Yemen to 100% following execution of an Acquisition Agreement with KUFPEC to acquire their 25% working interest.
• Established US$15 million secured convertible note facility to provide flexibility for the Group’s ongoing funding requirements to progress its development projects in the USA and MENA region.
• Completed a fully underwritten non-renounceable entitlement offer raising approximately A$11 million.
• Established a branch office in Sana’a, Yemen.
Operations
USA: Development
Hummer Gas/Oil Field, Gulf of Mexico, Main Pass 270/273/274, 50 miles South of the mouth of the Mississippi River
Main Pass 270 No. 3, Hummer discovery well (late 2015) in the shallow waters of the Gulf of Mexico:
• Completed the fabrication and installation of the Hummer platform jacket.
• Following the installation of the jacket the well was successfully flow tested on variable choke sizes at restricted rates over a 48 hour flow-back period. During the last 3 hours of the test period, the well flowed at an average rate of 19.88 MMcfpd and 396 bopd through a 16/64th inch choke with an average flowing wellhead pressure (WHP) of 9,753 psi and no formation water. Production rates continued to rise over the duration of the test with a maximum gas rate of 20.5 MMcfpd recorded.
• Whilst well logs indicated four additional potential reservoirs in the well, a decision was made not to run additional tests at the time. The untested sands will be targets for future drilling, most likely during 2018.
• The well has been completed for production and temporarily suspended pending the fabrication and installation of permanent production facilities onto the platform jacket, and pipelines for both oil and gas.
• First production from the Hummer project is anticipated to commence in late third quarter 2017.
USA: Production
• The Company holds an interest in two producing fields – the Jeanerette and Mystic Bayou Fields, onshore Louisiana.
• Production for the year of 313 MMcfe was largely attributable to the Mystic Bayou Field.
• The Main Pass Block 19 Field, which reached the end of its economic life in mid-2015, was plugged & abandoned during the second half of 2016.
• USA net 2P oil and gas reserves at 1 January 2017 were 3.9 MMboe with an NPV10 value of US$25 million (Cawley, Gillespie & Associates).
Left: An Nagyah Oilfield desalinator
Below: Main Pass Block 270/273/274 Hummer
Project jacket installation

P E T S E C E N E R GY LT D
A N N UA L R E P O R T 20 16
5
Financial
• Net production: 313 MMcfe, down 39%.
• Gas equivalent average sales price realised: US$3.48/Mcfe, up 13%.
• Net oil and gas revenues (after royalties): US$1.1 million, down 31%.
• EBITDAX: negative US$9.3 million (previous corresponding period: negative US$3.5 million).
• Impairment, abandonment, exploration and work-over expense: US$2.1 million, down 67%.
• Depreciation, depletion and amortisation (DD&A) expense: US$0.8 million (US$2.53/Mcfe), up 60%.
• Unit operating costs: US$33.95/Mcfe, up from US$11.38/Mcfe in the previous corresponding period due to increased costs associated with the acquisition of the An Nagyah Oilfield and the consolidated entity’s expansion into Middle East North Africa (MENA). Production from the An Nagyah Oilfield has been shut-in since late February 2014 due to political unrest.
• Net loss after tax: US$13.0 million, up from the loss of US$10.6 million in the previous corresponding period.
• Acquisition, exploration and development expenditures: US$5.5 million, down 66%.
• Cash at 31 December 2016: US$13.1 million, up 2%.
MENA: Acquisitions
• Block 7, Al Barqa Permit, Yemen:
– The Company entered into an agreement with KUFPEC to acquire their 25% working interest in Block 7.
– The KUFPEC transaction brings the Company’s potential interest in the block to 100% pending completion of the KUFPEC and Oil Search transactions which are subject to customary approvals from the Government of Yemen and the Ministry of Oil and Minerals.
– The block contains the undeveloped Al Meashar oil discovery made in 2010 which holds target resources of 11 MMbbl to 50 MMbbl, as well as an inventory of eight leads and prospects, holding mapped target sizes ranging from 2 MMbbl to 900 MMbbl, which are defined by 2D and 3D seismic surveys.
• Damis (Block S-1) Production Licence, Yemen:
– In February 2016, the company completed the acquisition of a 100% working interest (82.5% participating interest) and assumption of operatorship on the Damis (Block S-1) Production Licence.
– The block contains five sizeable, oil and gas discoveries including the developed/productive An Nagyah Oil Field complete with surface facilities to process and transport 20,000 BOPD.
– The An Nagyah Oilfield was estimated to have remaining gross 2P reserves of 12.8 MMbbl of which 5.6 MMbbl of oil was attributed to Petsec Energy net of all costs. The NPV10 of that 5.6 MMbbl was US$155.4 million (DeGolyer and MacNaughton), at 1 January 2016 forward oil prices.
– The block also contains significant additional resource potential in the four undeveloped fields (Osaylan, An Naeem, Wadi Bayhan and Harmel fields) which hold target resources of 34 MMbbl of oil and 550Bcf of gas.
Below: Block 7 seismic acquisition vibrators

P E T S E C E N E R GY LT D
A N N UA L R E P O R T 20 16
6
Chairman’s Report Dear Shareholder,
I am pleased to report that 2016 was a successful and transformative year for the Company, having substantially grown our oil and gas reserves, and positioned the Company for future success.During the course of the year, we added substantially to our Middle East and North African (“MENA”) portfolio through the acquisition of the Damis (Block S-1) production licence and increased our interest in the Block 7, Al Barqa Permit to 100%. The Damis (Block S-1) acquisition added net proved and probable (2P) reserves to the Company of 5.6 million barrels of oil from the developed/productive An Nagyah Oilfield, which held a net present value (NPV10) of US$155 million using a 10% discount rate and 1 January 2016 oil forward sales prices.
The Damis Block also holds an additional four discovered oil and gas fields which hold
target resources of 34 MMbbl of oil and 550 Bcf of gas which are yet to be developed.
Our exploration and acquisition activities in both the USA and Yemen during 2015 and 2016 delivered total reserve additions of approximately 9 million barrels of oil equivalent, which hold a net present value (NPV10) in the order of US$180 million at a 10% per annum discount value, at the forward oil and gas prices current at the 1st of January 2017.
This NPV10 value of US$180 million represented a value of approximately A$0.81 cents for each Petsec Energy share, at the time of writing.
In order to fund the development of the Company’s Hummer gas/oil discovery in the Gulf of Mexico, USA and to restart production from the An Nagyah Oilfield in Yemen, the Company executed an A$11 million capital raising via a fully underwritten non-renounceable rights issue and established a US$15 million secured convertible note facility.
USA DevelopmentThe Hummer Prospect, which was generated by Petsec Energy in 2010, was drilled in late 2015 and is a substantial oil and gas discovery with five reservoirs covering a large prospective area extending over three offshore lease blocks of Main Pass 270, 273 and 274. Petsec Energy owns a 12.5% working interest in the Hummer discovery in the three Main Pass leases.
A jacket was constructed and set over the well and the well was completed for production in November 2016.
The well was production tested in one of the upper reservoirs over a 48 hour period beginning 16 November 2016. Flow rates were measured at restricted rates on variable choke sizes.
Over the last three hours of the 48 hour test period the well flowed at an average rate of 19.88 MMcfpd (million cubic feet of gas per day) and 396 bopd (barrels of oil per day) through a 16/64th inch choke with an average flowing WHP of 9753 psi (pounds per square inch) and no formation water.
Production rates continued to rise over the duration of the test with a maximum gas rate of 20.5 MMcfpd recorded. The flow rates met our expectations and supported the Company’s high range estimates of mapped potential.
The Main Pass 270 No. 3 well was perforated from 14,100 feet to 14,186 feet measured depth (MD), 14,058 feet to 14,144 feet true vertical depth (TVD) in a Miocene age sand reservoir. Well logs indicate four additional potential reservoirs in the well, but a decision was made not to run additional tests at this time. These untested sands will be targets of future drilling activity on the Hummer Project. Significant production occurs for similar reservoirs along trend. Peak production rates from those intervals can exceed 25 MMcfpd and 1000 bopd. The well has now been temporarily suspended pending the fabrication and installation of a production deck and gas and oil pipelines. The Company estimates first production from the Hummer project to commence in late third quarter 2017.
P E T S E C E N E R GY LT D
A N N UA L R E P O R T 20 16
7
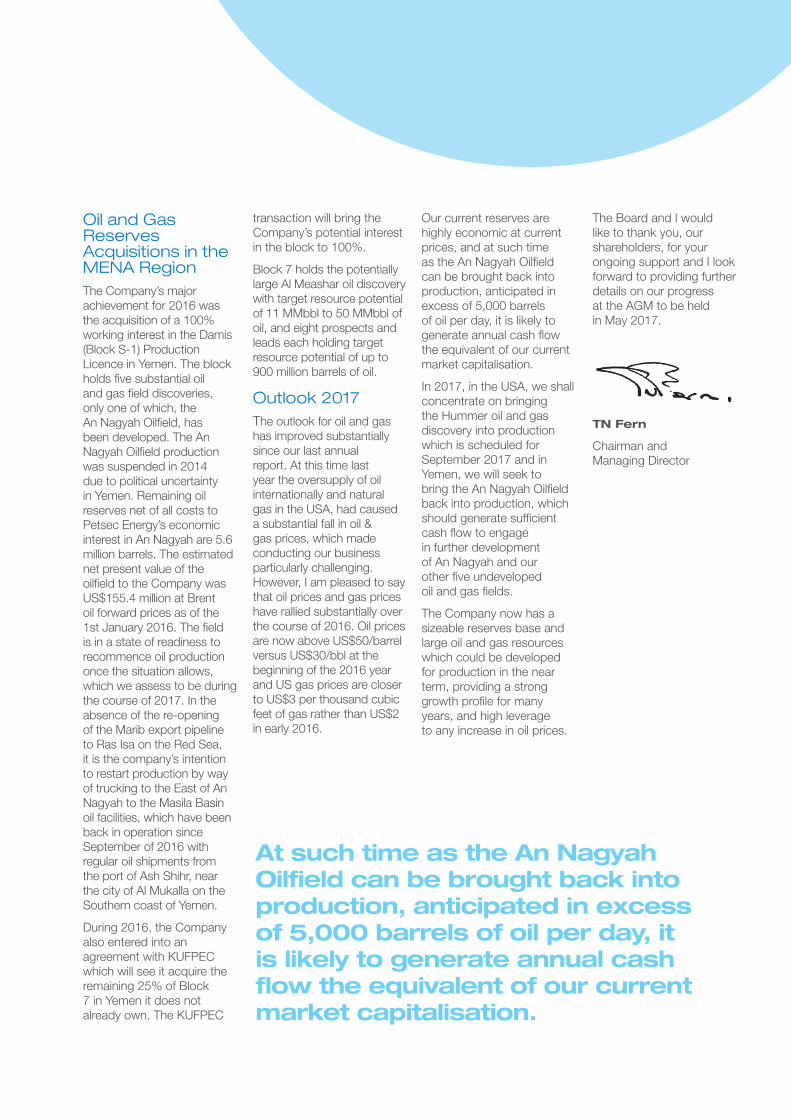
At such time as the An Nagyah Oilfield can be brought back into production, anticipated in excess of 5,000 barrels of oil per day, it is likely to generate annual cash flow the equivalent of our current market capitalisation.
Oil and Gas Reserves Acquisitions in the MENA RegionThe Company’s major achievement for 2016 was the acquisition of a 100% working interest in the Damis (Block S-1) Production Licence in Yemen. The block holds five substantial oil and gas field discoveries, only one of which, the An Nagyah Oilfield, has been developed. The An Nagyah Oilfield production was suspended in 2014 due to political uncertainty in Yemen. Remaining oil reserves net of all costs to Petsec Energy’s economic interest in An Nagyah are 5.6 million barrels. The estimated net present value of the oilfield to the Company was US$155.4 million at Brent oil forward prices as of the 1st January 2016. The field is in a state of readiness to recommence oil production once the situation allows, which we assess to be during the course of 2017. In the absence of the re-opening of the Marib export pipeline to Ras Isa on the Red Sea, it is the company’s intention to restart production by way of trucking to the East of An Nagyah to the Masila Basin oil facilities, which have been back in operation since September of 2016 with regular oil shipments from the port of Ash Shihr, near the city of Al Mukalla on the Southern coast of Yemen.
During 2016, the Company also entered into an agreement with KUFPEC which will see it acquire the remaining 25% of Block 7 in Yemen it does not already own. The KUFPEC
transaction will bring the Company’s potential interest in the block to 100%.
Block 7 holds the potentially large Al Meashar oil discovery with target resource potential of 11 MMbbl to 50 MMbbl of oil, and eight prospects and leads each holding target resource potential of up to 900 million barrels of oil.
Outlook 2017The outlook for oil and gas has improved substantially since our last annual report. At this time last year the oversupply of oil internationally and natural gas in the USA, had caused a substantial fall in oil & gas prices, which made conducting our business particularly challenging. However, I am pleased to say that oil prices and gas prices have rallied substantially over the course of 2016. Oil prices are now above US$50/barrel versus US$30/bbl at the beginning of the 2016 year and US gas prices are closer to US$3 per thousand cubic feet of gas rather than US$2 in early 2016.
Our current reserves are highly economic at current prices, and at such time as the An Nagyah Oilfield can be brought back into production, anticipated in excess of 5,000 barrels of oil per day, it is likely to generate annual cash flow the equivalent of our current market capitalisation.
In 2017, in the USA, we shall concentrate on bringing the Hummer oil and gas discovery into production which is scheduled for September 2017 and in Yemen, we will seek to bring the An Nagyah Oilfield back into production, which should generate sufficient cash flow to engage in further development of An Nagyah and our other five undeveloped oil and gas fields.
The Company now has a sizeable reserves base and large oil and gas resources which could be developed for production in the near term, providing a strong growth profile for many years, and high leverage to any increase in oil prices.
The Board and I would like to thank you, our shareholders, for your ongoing support and I look forward to providing further details on our progress at the AGM to be held in May 2017.
TN Fern
Chairman and Managing Director

P E T S E C E N E R GY LT D
A N N UA L R E P O R T 20 16
8
Operations Review
USA
Production
Petsec Energy produced 258 million cubic feet of gas and 9,233 barrels of oil/condensate (equivalent to 313 MMcfe) in the twelve months to 31 December 2016, primarily from the Mystic Bayou Field, onshore Louisiana USA.
Williams No.2 Alt. Well, Mystic Bayou Field
25.0% W.I. (NRI: 18.5%)
The Williams No. 2 Alt. well, located on the Mystic Bayou Field, St Martin Parish, Louisiana made a gas/condensate discovery mid-2015 and was brought into production on 31 August 2015.
The well was shut-in on 10 February 2016 due to a leak in the tubing at a depth below the producing reservoir. The operator completed a work-over of the well and returned it to production on 26 May 2016 at a gross rate of approximately 5.2 MMcfpd and 240 bcpd. The well was the primary contributor to the Company’s total production volume of 313 MMcfe for the year.
Adeline Sugar Factory No. 4 Well, Jeanerette Field
12.5% W.I. (NRI: 9.22%)
The Adeline Sugar Factory (“ASF”) No. 4 well located in the Jeanerette Field, St Mary Parish, Louisiana, was discovered and brought into production in June 2014.
The ASF No. well was shut-in in mid-November 2015 due to high water production and a restriction in the tubing due to salt build-up. The well has produced on an intermittent basis since that time, and it’s the operator’s intention to continue with intermittent production for the near-term.
Development
During 2016, the Company’s efforts in the U.S. were primarily focused on the development of the Hummer oil and gas discovery which covers a large prospective area extending over portions of the three offshore lease blocks of Main Pass 270, 273 and 274. Petsec Energy owns a 12.5% working interest in the area which was discovered in late 2015 with the Main Pass Block 270 No. 3 exploration well.
A jacket was constructed and set over the well and the well was completed for production in November 2016 in one of the upper reservoirs from the five reservoirs penetrated by the well.
Texas
MississippiAlabama
LouisianaMYSTIC BAYOU
ASF #4QUISKI BAYOU
MAIN PASS 270/273/274
Below: Petsec Energy Gulf
of Mexico and Louisiana Gulf
Coast, USA exploration and
production leases. Image:
Jacques Descloitres, MODIS
Land Rapid Response Team,
NASA/GSFC
P E T S E C E N E R GY LT D
A N N UA L R E P O R T 20 16
9
The well was production tested over a 48 hour period beginning 16 November 2016. Flow rates were measured at restricted rates on variable choke sizes.
Over the last three hours of the 48 hour test period the well flowed at an average rate of 19.88 MMcfpd (million cubic feet of gas per day) and 396 bcpd (barrels of condensate per day) through a 16/64th inch choke with an average flowing WHP of 9753 psi (pounds per square inch) and no formation water. Production rates continued to rise over the duration of the test with a maximum gas rate of 20.5 MMcfpd recorded. The flow rates met our expectations and supported the Company’s high range estimates of mapped potential.
Plug and abandonment
During the year, the Main Pass Block 19 Field, which reached the end of its commercial life in mid-2015, was plugged and abandoned.
MENA (Middle East and North Africa) – Yemen
Acquisitions
The Company remained very active during 2016 in the MENA region, pursuing its objective of acquiring onshore leases, with oil reserves both developed/producing and undeveloped, that hold significant development, exploitation and exploration potential.
The highlight of 2016 was the acquisition of the Damis (Block S-1) Production Licence in Yemen. The acquisition of a 100% working interest in the Damis (Block S-1) Production Licence has delivered the company a transformative asset, which can increase the value of Petsec Energy by orders of magnitude. The block holds five substantial oil and gas field discoveries, only one of which, the An Nagyah Oilfield, has been developed.
The An Nagyah Oilfield holds net 2P reserves of 5.6 million barrels of oil to the Company’s net economic interest, with an NPV10 of US$155 million at 1 January 2016 and four other undeveloped oil and gas fields, which hold target resources of 34 MMbbls and 550 Bcf of gas.
During 2016, the Company also entered into an agreement with KUFPEC to acquire their 25% working interest in Block 7 in Yemen. The KUFPEC transaction brings the Company’s potential interest in the block to 100% pending approvals.
Block 7 holds the potentially large Al Meashar Oilfield with estimated target resources of 11 to 50 MMbbls and several substantial exploration prospects and leads holding target resource potential of up to 900 MMbbl.
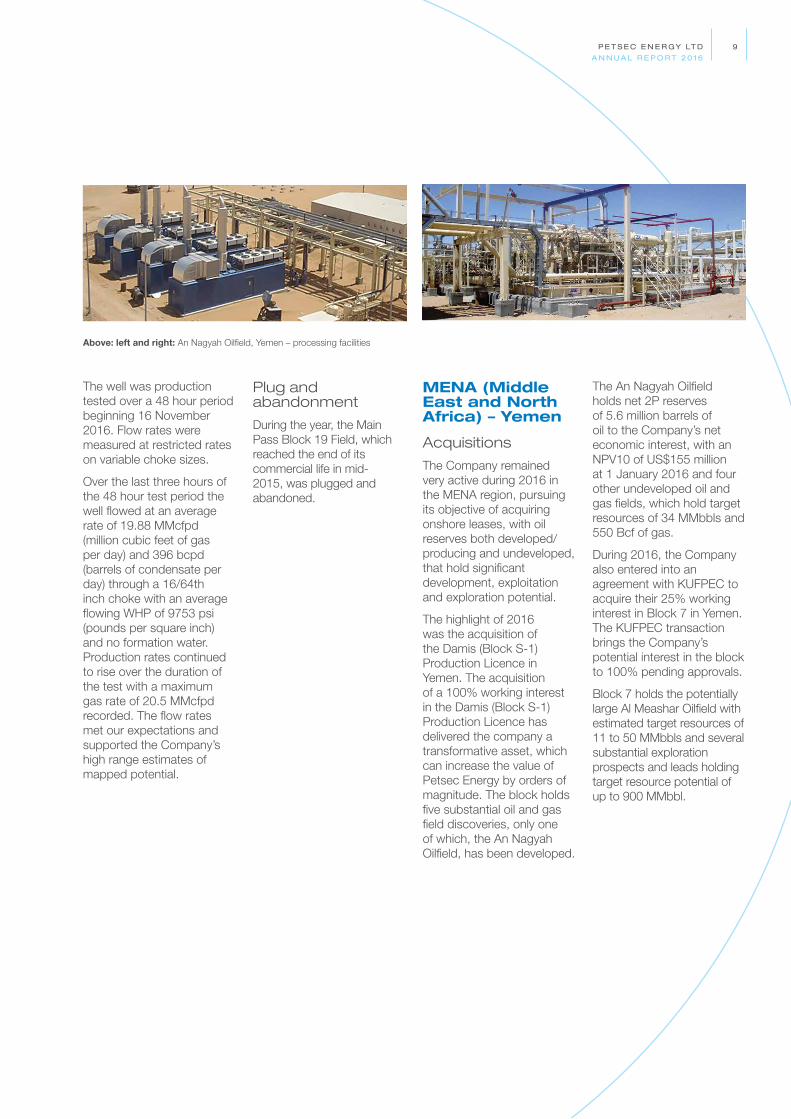
Above: left and right: An Nagyah Oilfield, Yemen – processing facilities

P E T S E C E N E R GY LT D
A N N UA L R E P O R T 20 16
10
Operations Review continued
Block 7, Al Barqa Permit, Republic of Yemen
Block 7 is an onshore exploration permit covering an area of 5,000 square kilometres (1,235,527 acres) located 340 kilometres east of Sana’a, the capital of Yemen. It contains the undeveloped Al Meashar oil discovery made in 2010, and an inventory of prospects and leads defined by 2D and 3D seismic surveys that hold significant oil potential ranging from 2 to 900 million barrels of oil.
The Al Meashar oil discovery is similar in geology and structure to the Habban Oilfield, located 14 kilometres to the West of Al Meashar, operated by OMV. The field had been producing at rates of 23,000 barrels of oil per day prior to its shut-in in 2015.
In 2014, the Company executed agreements with AWE Limited (25% working interest/ 21.25% participating interest) and Mitsui E&P Middle East B.V. (10% working interest/ 8.5% participating interest) to acquire their respective participating interests in Block 7. The Company concluded the acquisition of these interests in September 2015.
In April 2015, the Company executed an agreement with Oil Search Limited to acquire all the shares of its subsidiary Oil Search (ROY) Limited, which holds a 40% working interest (34% participating interest) in Block 7 and is the designated operator of the exploration permit. Finally, in 2016 the Company entered into an agreement with KUFPEC to acquire their 25% working interest in Block 7 in Yemen. The KUFPEC transaction brings the Company’s potential interest in the block to 100% pending approvals.
As soon as the situation in Yemen allows, the Company’s first objective in this block is to bring the two suspended discovery wells (2010/2011) of the Al Meashar Oilfield into production. Short-term testing of the wells in 2011 delivered flow rates ranging from 200 to 1,000 bopd.
Damis (Block S-1), Production Licence Republic of Yemen
The Company announced on 5 February 2016 a further significant expansion of its oil and gas interests in the Republic of Yemen with the acquisition of entities holding a 100% participating interest (82.5% equity interest) and operational control of the Damis (Block S-1) Production Licence.
Damis (Block S-1) is located approximately 80 kilometres to the southwest of Block 7 and holds five sizeable oil and gas discoveries – the developed and producing (until suspended in 2014), An Nagyah Oilfield, and a further four undeveloped oil and gas fields – Osaylan, An Naeem, Wadi Bayhan, and Harmel.
The An Nagyah Oilfield has remaining 2P reserves of 12.8 MMbbls of oil (gross to Petsec), which 5.6 million barrels of oil is net to the Company, net of all royalties and costs, and has an estimated NPV10 value of US$155.4 million at Brent oil forward prices at 1 January 2016.
The four undeveloped fields hold substantial oil and gas target resources (34 MMbbl oil and 550 Bcf gas), which will be a source of future growth of production and reserves for the Company.
The block contains significant existing infrastructure, including surface facilities with a capacity to process up to 20,000 barrels of oil per day (bopd) and an 80,000 bopd pipeline, which joins the 200,000 BOPD Marib export pipeline to the Ras Isa terminal on the Red Sea Coast.
The An Nagyah oil field was shut-in at the end of February 2014 following the declaration of Force Majeure by the current operator due to political issues in Yemen and consequent inability to ship oil for the Al Nagyah oil field from the export pipeline terminus on the west coast of Yemen.
It is Petsec’s intention to restart production as early as the political situation makes possible, either by pipeline or trucking or a combination of both.

P E T S E C E N E R GY LT D
A N N UA L R E P O R T 20 16
1 1
Oil and Gas Reserves
Petsec Energy Group Net Reserves as of 1 January 2017
Oil Equivalent (Mboe1)Net ProvedReserves3
Net ProbableReserves3
Net Proved and Probable
Reserves3
USA Reserves2
Reserves as of 1 January 2016 2,096.2 1,578.2 3,674.4
Additions/(revisions) 710.0 (460.5) 249.5
Production (52.1) – (52.1)USA reserves as of 1 January 2017 2,754.1 1,117.7 3,871.8Developed 1,185.9 – 1,185.9Undeveloped 1,568.2 1,117.7 2,685.9
Yemen Reserves2
Reserves as of 1 January 2016 4,540.0 1,108.0 5,648.0
Additions/(revisions) – – –Yemen reserves as of 1 January 2017 4,540.0 1,108.0 5,648.0Developed 4,540.0 1,108.0 5,648.0Undeveloped – – –
Total Petsec Group Reserves
Total Petsec Group Reserves as of 1 January 2017 7,294.1 2,225.7 9,519.8
Developed 5,725.9 1,108.0 6,833.9Undeveloped 1,568.2 1,117.7 2,685.9
1. Mboe = One thousand barrels of oil equivalent (using a ratio of approximately six thousand cubic feet of natural gas to one barrel of oil).
2. The USA and Yemen reserve assessments presented in the table above and throughout this report are consistent with the announcement released to the ASX on 24 February 2017. The Company confirms that it is not aware of any new information or data that materially affects the information included in these announcements, and that all the material assumptions and technical parameters underpinning the estimates therein continue to apply and have not materially changed.
The U.S. reserves are stated for the Jeanerette, Mystic Bayou and Main Pass Block 270/273/274 fields. The Yemen reserves are stated for the An Nagyah Oilfield only and are unchanged from the assessment announced to the ASX on 15 March 2016.
3. Net reserves means those reserves representing the Company’s net revenue interest (or net economic interest) which is the Company’s working interest less royalties payable in the USA, and after all costs – operational, government taxes and government participation in Yemen, according to the terms of the Participating Agreement with the Yemen government.
To ensure accuracy and compliance of reserves estimations, the Company has put in place a robust process that incorporates the following governance arrangements and internal controls:
• At least once a year, as part of the year-end reporting procedures, the Company’s producing oil and gas reserves are to be reviewed by an external, independent expert. The independent verified reserves are to be used as the basis for depreciation, depletion and amortisation calculations.
• All releases or reports containing statements of reserves are to be in accordance with ASX listing rules, requiring sign-off for content and context by an appropriately qualified person and in accordance with the Company’s Reserves Policy.

Contents
Directors’ Report13Financial Report for the Year Ended 31 December 201628Exploration and Production Interests67Shareholder Information685 Year Comparative Data Summary69Glossary71Corporate Directory72
Directors’ and Financial Report For the Year Ended 31 December 2016
The Secretary
Petsec Energy Ltd PO Box R204 Royal Exchange NSW 1225 +61 (2) 9247 4605
P E T S E C E N E R GY LT D
A N N UA L R E P O R T 20 16
12

P E T S E C E N E R GY LT D
A N N UA L R E P O R T 20 16
13
Directors’ ReportFor the year ended 31 December 2016
The directors present their report together with the Financial Report of Petsec Energy Ltd (“the consolidated entity”), being Petsec Energy Ltd (the Company) and its subsidiaries, for the financial year ended 31 December 2016 and the independent auditor’s report thereon.
1. Directors
The names and particulars of the qualifications and experience of each director during or since the end of the financial year are:
Terrence N FernChairman and Managing Director
Mr Fern has been a director since 1987 and has over 45 years of extensive international experience in petroleum and minerals exploration, development and financing. He holds a Bachelor of Science degree from the University of Sydney and has followed careers in both exploration geophysics and natural resource investment. Mr Fern was formerly a director of TSX and ASX listed company OceanaGold Corporation from 2006 until June 2011.
David A Mortimer AONon-executive Director
Chairman of the Audit Committee and the Nomination and Remuneration Committee
Mr Mortimer was appointed to the Board in 1985 and has over 40 years of corporate finance experience. He was a senior executive of TNT Limited Group from 1973, serving as Finance Director and then as Chief Executive Officer until his resignation in October 1997. He is presently Chairman of Opera Australia, Crescent Capital Partners Limited, Buildcorp Advisory Board and a Fellow of the Senate of the University of Sydney. He is Chairman of the Senate Investment and Commercialisation Committee and a Director of MySale Group PLC, Clayton Utz Foundation, the Grant Samuel Advisory Board and is on the CEDA’s Board of Governors.
Mr Mortimer holds a Bachelor of Economics degree (First Class Honours) from the University of Sydney and is a Fellow of the University of Sydney Senate and the Australian Institute of Company Directors. Mr Mortimer’s other roles include Governor of the Australia Israel Chamber of Commerce, and Chairman of the Sydney University Football Club Foundation.
Mr Mortimer was formerly a non-executive director and more recently Chairman of ASX listed company Leighton Holdings Limited from 1997 until August 2011 and Chairman of Australia Post from 2006 to 2012.
Alan P BadenNon-executive Director
Member of the Audit Committee and the Nomination and Remuneration Committee
Mr Baden was appointed to the Board in May 2013 and is a U.S. citizen, resident in Houston, Texas. He is Of Counsel with the legal firm of Thompson & Knight and has over 35 years of experience in the U.S. oil and gas industry, with a focus on mergers and acquisitions, public and private financings, and U.S. capital market activities, representing U.S. and foreign E&P companies, master limited partnerships and other energy companies. He has been recognised by his peers to be a leading lawyer in oil and gas transactions and in securities and corporate finance.
Mr Baden holds a Juris Doctor Degree from Case Western Reserve University, and a Bachelor of Science (Economics) Degree from the University of Pennsylvania.
Mark S LoberNon-executive Director
Member of the Audit Committee and the Nomination and Remuneration Committee
Mr Lober served as a director of the Company from 2013 until his retirement from the Board and its Committees on 19 May 2016.
2. Executive Officers
Richard J SmithChief Executive Officer of Petsec Energy Inc. (“PEI”)
Mr Smith joined the Company in March 2014 and has over 40 years of experience in a wide variety of senior exploration and production roles predominantly with U.S. E&P companies including Amerada Hess Corporation, Amoco Production Company, Pedernales Production LLC, Houston Energy LLC, Prime Natural Resources (formerly F-W Oil Interests, Inc.), and F-W Oil Exploration LLC/F-W Oil Trinidad LLC. He holds an impressive record of growing the value of exploration and production companies through successful exploration and acquisitions. His North American experience is predominantly in the Gulf of Mexico, Louisiana and Texas onshore, in conventional and unconventional reservoirs. He also has international exploration experience in West Africa, North Africa, Europe and the Caribbean.
Mr Smith holds a Master of Science (Geology) from the University of Tennessee, Knoxville, Tennessee and a Bachelor of Science (Geology) from SUNY at Brockport, Brockport, New York.

Directors’ Report Continued For the year ended 31 December 2016
P E T S E C E N E R GY LT D
A N N UA L R E P O R T 20 16
14
2. Executive Officers (continued)Ross A KeoghPresident of PEI and Group Chief Financial Officer
Mr Keogh joined the Company in 1989 and has over 35 years of experience in the oil and gas industry. Between 1979 and 1989, Mr Keogh worked in the financial accounting and budgeting divisions of Total Oil Company and as Joint Venture Administrator for Bridge Oil Limited in Australia. Mr Keogh holds a Bachelor of Economics degree, with a major in Accounting, from Macquarie University in Sydney. Mr Keogh was appointed Chief Financial Officer in November 1998 until April 2002, and appointed President of PEI in April 2002. Mr Keogh took on the extended role of Group Chief Financial Officer in February 2012, in addition to his current role of President of PEI.
Ron KrenzkeExecutive Vice President of Exploration of PEI
Mr. Krenzke joined the Company in November 2009 as the Executive Vice President of Exploration of Petsec Energy Inc. Mr. Krenzke has over 40 years of experience in the oil and gas exploration and production industry. His career includes experience in many phases of management of oil and gas exploration and production operations. During his early career Mr. Krenzke worked in a variety of technical and management positions at major and large independent oil and gas companies including: Mobil Oil, Texas Eastern, Monsanto Oil and Amerada Hess. Since 1990 Mr. Krenzke has founded and co-founded three private E&P companies operating in the Gulf Coast region of the USA. Mr. Krenzke founded INEXS and South Coast Exploration in 1990, both of which were sold in 1997 to Xplor Energy. In 2000, he co-founded Gryphon Exploration Company, which was ultimately sold to Woodside Petroleum in 2005 for US$285 million. From 2006 through 2009, Mr. Krenzke worked with small cap private companies primarily as a business and technical consultant.
Mr. Krenzke holds a Bachelor of Science degree in Geophysics from Texas A&M University.
Maki PetkovskiChief Executive Officer of Petsec Energy (Middle Eastern) Limited
Mr. Petkovski joined the Company in March 2015 as the Chief Executive Officer of Petsec Energy (Middle Eastern) Limited. Mr. Petkovski has over 25 years of experience in the international upstream oil and gas business sector and has held various managerial and senior technical roles with large E&P companies including BP, Ampolex Ltd and most recently with Oil Search Ltd where he was responsible for managing Oil Search’s MENA portfolio.
Mr Petkovski holds a Bachelor of Applied Science (Geology) degree from the University of Technology, Sydney.
Paul GahdmarCompany Secretary and Group Financial Controller
Mr Gahdmar joined the Company in 1999 as the Financial Accountant of the Petsec Energy Ltd group and has since held a number of management positions within the Company. Mr Gahdmar was appointed as the Company Secretary of Petsec Energy Ltd in 2008 and has 25 years of experience in corporate accounting and finance in listed companies within the mining and resources industry. Mr Gahdmar holds a Master of Business and Technology degree from The University of New South Wales and a Diploma in Investor Relations from the Australasian Investor Relations Association. Mr Gahdmar is a Fellow of the Institute of Public Accountants and a Member of the Australian Institute of Company Directors.
3. Directors’ meetings
The Board has a formally constituted Audit Committee and a Nomination and Remuneration Committee, of which Mr Mortimer and Mr Baden (non-executive directors) are members. Mr Mortimer chairs both committees.
The number of directors’ meetings (including meetings of committees of directors) and number of meetings attended by each of the directors of the Company during the financial year are:
Regular Board
MeetingsAdditional Board
MeetingsAudit Committee
Meetings
Nomination & Remuneration
Committee Meetings
Total number held during the year 8 3 5 4T N Fern 1 8 3 5 4
D A Mortimer 8 3 5 4
A P Baden 8 3 5 4
M S Lober 2 2 – 1 2
1 Mr Fern attended the Audit and Nomination & Remuneration Committee meetings as an invitee.
2 Mr Lober retired from the Board and its Committees on 19 May 2016.
P E T S E C E N E R GY LT D
A N N UA L R E P O R T 20 16
15
4. Remuneration report
The Remuneration Report is set out on pages 20 to 26 and forms part of the Directors’ Report for the financial year ended 31 December 2016.
5. Principal activities
The principal activities of the consolidated entity during the course of the year were oil and gas exploration activities and production onshore and coastal waters of the Louisiana Gulf Coast region, and the shallow waters of the Gulf of Mexico, USA and the acquisition of certain oil and gas interests in the MENA region.
There were no other significant changes in the nature of the activities of the consolidated entity during the year.
6. Financial review
The consolidated entity incurred a net loss after tax for the twelve months ended 31 December 2016 of US$13.0 million (previous corresponding period: net loss after tax of US$10.6 million) mainly due to a lower oil and gas revenue base in combination with increased operating and GG&A costs associated with the acquisition of the An Nagyah Oilfield in Yemen.
Net oil and gas revenues of US$1.1 million were generated for the current period, from production of 313 million cubic feet of gas equivalent (“MMcfe”) at an average natural gas equivalent sales price of US$3.48/Mcfe. This was 31% lower than the net oil and gas revenues achieved in the previous corresponding period of US$1.6 million, mainly due to the impact of lower production volumes.
Net production for the current period of 313 MMcfe was 39% lower than the previous corresponding period of 511 MMcfe, due to the shut-in of both the Adeline Sugar Factory No. 4 and Williams No. 2 wells for extended periods of time during the course of the year. Refer to the “Operations Review” section below for further details.
The consolidated entity realised an average net gas equivalent sales price of US$3.48/Mcfe in the current period, 13% higher than the US$3.07/Mcfe achieved for the previous corresponding period, reflecting the improved commodity price environment. The consolidated entity received an average sales of price of US$2.66/Mcf and US$43.86/bbl for its natural gas and oil/condensation production, respectively. This compares to US$2.60/Mcf and US$39.95/bbl received respectively, in the previous corresponding period.
Lease operating expense of US$3.1 million (previous corresponding period: US$0.6 million) and geological, geophysical and administrative (“GG&A”) expense of US$7.5 million (previous corresponding period: US$5.2 million) were higher as a result of the increased activities and business expansion in MENA region – Dubai, UAE and Sana’a, Yemen.
On a unit-basis, lease operating expense was US$9.97/Mcfe (previous corresponding period: US$1.26/Mcfe) and GG&A expense was US$23.98/Mcfe (previous corresponding period: US$10.12/Mcfe).
The consolidated entity recorded negative earnings before interest, income tax, depreciation, depletion and amortisation, and exploration expense (“EBITDAX”) of US$9.3 million for the current period (previous corresponding period: negative EBITDAX of US$3.5 million).
Depreciation, depletion and amortisation (“DD&A”) expense was US$0.8 million in the current period (previous corresponding period: US$0.5 million).
Financial position
At 31 December 2016, the Company held cash deposits of US$13.1 million, US$0.3 million higher than the previous corresponding period cash balance of US$12.8 million. The cash deposits which are predominantly held in U.S. dollars include US$3.6 million primarily held in an escrow account to secure operator bonds that are on issue to the Bureau of Ocean Energy Management (“BOEM”).
During the year, the Company secured additional funding through the establishment of a US$15 million secured convertible note facility and undertook a fully underwritten rights issue to raise approximately A$11 million to support its participation in the development of the Hummer gas/oil discovery in the Gulf of Mexico, USA, and the expected re-start of oil production from its An Nagyah Oilfield (Damis Block S-1) in Yemen.
7. Operations review
Petsec Energy Ltd (the “Company”) is an independent oil and gas exploration and production company listed on the Australian Stock Exchange (ASX Ticker: PSA) and is traded over the counter in the USA in the form of American Depositary Receipts (symbol: PSJEY). The Company has operations in the shallow waters of the Gulf of Mexico and onshore Louisiana, USA and in the Republic of Yemen.
USAProduction
Petsec Energy holds interests in two producing fields, onshore Louisiana – Jeanerette and Mystic Bayou Field. The Company produced 258 MMcf of gas and 9,233 barrels of oil/condensate (equivalent to 313 MMcfe) for the twelve months to 31 December 2016, predominantly from the Williams No.2 Alt. well in the Mystic Bayou Field, onshore Louisiana USA.
Williams Alt No.2 well – Mystic Bayou FieldPetsec: 25% working interest (18.5% net revenue interest)
The Williams Alternate No.2 gas/condensate discovery well on the Mystic Bayou Field in St. Martin Parish, Louisiana was drilled and brought into production on 31 August 2015. The well contributed 312 MMcfe to production for the year.
Adeline Sugar Factory No. 4 Well – Jeanerette FieldPetsec: 12.5% working interest (9.2% net revenue interest)
The Adeline Sugar Factory (“ASF”) No. 4 well located in St. Mary Parish, Louisiana was drilled and brought into production in June 2014. The well was shut-in in mid-November 2015 due to high water production and a restriction in the tubing due to salt build-up. The well has produced on an intermittent basis since that time, and it’s the operator’s intention to continue with intermittent production for the near-term.

Directors’ Report Continued For the year ended 31 December 2016
P E T S E C E N E R GY LT D
A N N UA L R E P O R T 20 16
16
7. Operations review (continued)
Acquisitions
Main Pass Block 274 – Hummer ProjectPetsec: 12.5% working interest (10.24% net revenue interest)
On 5 May 2016, the Bureau of Ocean Energy Management (“BOEM”) awarded the Main Pass Block 274 lease to Castex Offshore, Inc. (“Castex”), the operator of the Hummer Project. Castex was the high bidder with a gross bid of US$675,576 (US$84,447 net to Petsec).
The block falls within an Area of Mutual Interest (AMI) for the Hummer Project participants, and as a result the Company had the right, which it has exercised, to participate for its 12.5% working interest (“W.I.”) in the lease.
Main Pass Block 274 was previously leased by Petsec in March 2010 as part of the Hummer Exploration Prospect, which was identified on 3D seismic as extending across portions of Main Pass Blocks 270, 273 and 274. The Main Pass Block 270 No. 3 Hummer discovery well (Petsec 12.5% W.I.) was drilled in late 2015 and is currently under development with the fabrication and installation of a platform jacket and production facilities. The initial term of the Main Pass Block 274 lease had expired prior to the discovery well being drilled.
Development
Main Pass Block 270 No. 3 well – Hummer ProspectPetsec: 12.5% working interest (10.24% net revenue interest)
The Main Pass Block 270 No. 3 well on the Hummer exploration prospect in 215 feet of water, offshore Louisiana (federal waters) was drilled during the second half of 2015.
During the year, the Company completed the fabrication and installation of the jacket and successfully flow tested the well. The well was tested in one of the five identified reservoirs on variable choke sizes at restricted rates over a 48 hour flow-back period. During the last 3 hours of the test period, the well flowed at an average rate of 19.88 MMcfpd (million cubic feet of gas per day) and 396 bopd (barrels of oil per day) through a 16/64th inch choke with an average flowing WHP of 9,753 psi and no formation water. Production rates continued to rise over the duration of the test with a maximum gas rate of 20.5 MMcfpd recorded.
Well logs indicate four additional potential reservoirs in the well, but a decision was made not to run additional tests at this time. These untested sands will be targets of future drilling on the Hummer project. Significant production occurs for similar reservoirs along trend with peak production rates from those intervals exceeding 25 MMcfpd and 1,000 bcpd.
The well has been temporarily suspended pending the fabrication and installation of production facilities and pipelines. The Company estimates first production from the Hummer project to commence in late third quarter 2017.
MENA
During the year, the Company expanded its capabilities and activities in the MENA region in order to pursue its objective of acquiring onshore leases with oil reserves, both developed/producing and undeveloped, that hold significant development, exploitation and exploration potential.
In February 2016, the Company announced the appointments of Mr. Murray Hawkes and Mr. John Rees as Chief Operating Officer and VP Technical, respectively, of the Company’s wholly owned subsidiary, Petsec Energy (Middle Eastern) Limited. Mr. Hawkes also took on the role of Yemen General Manager, focussing on reactivating field activities in Yemen, including the re-start of production from the newly acquired An Nagyah Oilfield in Damis (Block S-1). Mr. Hawkes and Mr. Rees both have significant managerial experience overseeing the delivery of major oil and gas projects, and extensive contacts in the MENA region which will enhance the Company’s capabilities and expansion of activities in the region.
In the second half of 2016, the activities for the Company in MENA are focussed on preparations for the re-start of production from the recently acquired An Nagyah Oilfield with the aim of ensuring that the Company is ready for production once the political situation allows.
The political situation in Yemen continues to evolve and is progressing towards a resolution of the conflict. The internationally recognised Government continues to prepare for the re-start of crude exports from Yemen facilities. Production from the Masila Basin recommenced in September 2016. It is anticipated that Yemen oil production from Block S-1 is likely to recommence by mid-2017.
Damis (Block S-1) Production Licence, Republic of YemenPetsec: 100% working interest (82.5% participating interest)
The Company announced on 5 February 2016 a further significant expansion of its oil and gas interests in Yemen with the acquisition of entities holding a 100% working interest (82.5% participating interest) and operational control of the Damis (Block S-1) Production Licence.
Damis (Block S-1) is located approximately 80 kilometres to the southwest of Block 7 and holds five sizeable oil and gas discoveries – the developed and productive (until suspended in 2014), An Nagyah Oilfield, and a further four undeveloped oil and gas fields – Osaylan, An Naeem, Wadi Bayhan, and Harmel.
The four undeveloped fields hold substantial oil and gas resources, in excess of 34 million barrels of oil and 550 Bcf of gas 1 which will be a source of future growth of reserves and production for the Company.
The block contains significant existing infrastructure, including surface facilities with a capacity to process up to 20,000 barrels of oil per day (bopd) and an 80,000 bopd pipeline, which joins the 300,000 BOPD Marib export pipeline to the Ras Isa terminal on the Red Sea Coast.
1 Source: Wood Mackenzie Asia Pacific Pty Ltd (November 2015)
P E T S E C E N E R GY LT D
A N N UA L R E P O R T 20 16
17
The An Nagyah Oilfield was shut-in at the end of February 2014 following the declaration of Force Majeure by the previous operator due to the political issues in Yemen and the resulting inability to ship oil for the An Nagyah oilfield from the export pipeline terminus on the west coast of Yemen. The field was producing at a rate of over 5,600 bopd prior to its being shut-in.
It is Petsec’s intention to restart production as early as the political situation allows. The production facility has been maintained during the shut-in period and preparations are underway for the re-start of production with the initiation of maintenance on access roads within the facility, with a view to the delivery of crude either by pipeline or trucking or a combination of both.
Block 7, Al Barqa Permit, Republic of YemenPetsec: 35% working interest (29.75% participating interest)
Block 7 is an onshore exploration permit covering an area of 5,000 square kilometres (1,235,527 acres) located approximately 340 kilometres east of Sana’a, the capital of Yemen.
Petsec currently holds a non-operating 35% working interest (29.75% participating interest) in the Block 7 Joint Venture.
In April 2015, the Company executed an agreement with Oil Search Limited to acquire all the shares of its subsidiary Oil Search (ROY) Limited, which holds a 40% working interest (34% participating interest) in Block 7 and is the designated operator of the exploration permit. In late 2016, the Company entered into an agreement with KUFPEC to acquire their 25% working interest in Block 7 in Yemen. The KUFPEC transaction brings the Company’s potential interest in the block to 100% pending approvals.
The Company’s first objective in this block is to bring the two suspended discovery wells of the Al Meashar Oilfield (target resource of 11 MMbbl to 50 MMbbl 1) into production. In 2011, short-term testing of the wells delivered flow rates ranging from 200 to 1,000 bopd. Analysis of this data suggests clean-up of the reservoir is likely to result in stabilised production rates over a longer production period.
Well engineering and cost estimates of the re-entry programme for both wells on the Al Meashar Oilfield are complete and will be followed by a tendering process for equipment and services.
8. Objectives, strategy and future performance
It is the consolidated entity’s objective to increase the value of the Company and thus shareholder value through successful oil and gas exploration, development, and production, and through acquisitions. The consolidated entity intends to produce its current reserves, pursue participation in high quality, high impact exploration drilling opportunities in the Gulf Coast onshore Louisiana and offshore Gulf of Mexico, USA. The consolidated entity also intends to explore opportunities to acquire onshore producing oil and gas reserves in MENA which hold significant development, exploitation potential.
The consolidated entity’s strategy takes into account the expected operating and market conditions, together with general economic conditions, which are inherently uncertain. The consolidated entity has structured and proactive risk management and internal control systems in place to manage material risks. Certain of those risks are inherent to the consolidated entity’s business, such as drilling for, producing and marketing oil and gas. Although the consolidated entity is committed to minimising its risk exposure, many risks are largely beyond the control of the consolidated entity and its directors. Moreover, other more general risks associated with the vicissitudes of commercial life, political change, and cyclical economic conditions are risks that the consolidated entity cannot control. The following are those risks which management and the Board consider to be material business risks that could adversely affect the achievement of the financial prospects of the Company discussed above:
Drilling and Production Risks
Drilling for oil and natural gas is subject to numerous risks. Paramount is the risk that drilling operations will not result in the discovery of commercially productive oil or natural gas reservoirs. Also, projects are subject to economic risks. Before beginning a drilling project, the Company can only estimate the cost of drilling and completing wells as many indeterminable factors can affect the total cost. For example, oil and natural gas drilling and production activities may be extended, shortened, delayed or cancelled as a result of a variety of factors, many of which are beyond the Company’s control. These risks may negatively impact the economics of drilling projects. In part, these factors include:
– Unexpected drilling conditions including abnormal geological pressure or irregularities in formations;
– Equipment failures or accidents;
– Weather conditions, including hurricanes and other tropical weather disturbances;
– Shortages in experienced labour;
– Shortages, delays in the delivery, or high cost of drilling rigs and equipment;
– Constraints on access to transportation systems (pipelines) delaying sale of oil and natural gas;
– Reduction or losses of resources or reserves;
– Acquiring and maintaining title to its interests;
– Unresolved landowner or regulatory issues; and
– Inability of third-party joint venture partners to participate in or fund their share of drilling and production activities.
1 Source: Oil Search Limited

Directors’ Report Continued For the year ended 31 December 2016
P E T S E C E N E R GY LT D
A N N UA L R E P O R T 20 16
18
8. Objectives, strategy and future performance (continued)
Operating Risks
The exploration for and development and production of oil and natural gas involves a variety of industry operating risks. If any of these industry-operating risks occur, the Company could have substantial losses. Substantial losses could include injury or loss of life, severe damage to or destruction of property, natural resources and equipment, pollution or other environmental damage, clean-up responsibilities, regulatory investigation and penalties and suspension of operations. These risks include:
– Fire, explosions, blow-outs and surface cratering;
– Lost or damaged oilfield drilling pipe and service tools;
– Casing or cement failures;
– Environmental hazards caused by oil spills, natural gas leaks, pipeline ruptures or discharges of toxic gases; and
– Hazards of marine operations such as capsizing, collision and adverse weather and sea conditions.
Marketing and Sales Risks
The marketing and sale of oil and natural gas is subject to the risk of adverse commodity price fluctuations that impact cash flow. Some factors that affect commodity prices include:
– Relatively minor changes in the supply of and demand for oil and natural gas;
– Market uncertainty;
– The level of consumer product demand;
– Weather conditions;
– Domestic and foreign governmental regulations;
– The price and availability of alternative fuels;
– Technological advances affecting oil and natural gas consumption;
– Political and economic conditions in oil producing countries, particularly those in the Middle East;
– Policies of the Australian, U.S. and Yemen governments;
– The foreign supply of oil and natural gas;
– The price of oil and natural gas imports; and
– General economic conditions.
To reduce the impact of price fluctuations, from time to time, the Company has used derivative financial instruments, such as natural gas swaps, puts and costless collars, on a portion of its future production. However, such hedging activities may not be sufficient to protect the Company against the risk of price declines and may limit income and liquidity if prices rise.
– Hedging activities that are intended to reduce the risk of downward price fluctuations on a portion of our future production may limit the Company’s potential income if oil and gas prices rise above a level established by its hedge instruments.
– Hedging counterparties require collateral when the mark-to-market value of our hedge instruments is in the counterparties’ favour and exceeds the Company’s credit limits with such counterparties. As a result, the Company may be required to provide substantial security to the counterparties when commodity prices change significantly. The security provided may be in the form of cash or letters of credit, and thus, could have a significant impact on the Company’s liquidity.
Exchange Rate Risks
Adverse exchange rate variations between the U.S. dollar and the Australian dollar may impact upon cash balances held in Australian dollars. Since most of the Company’s operations are conducted in U.S. dollars, the Company generally maintains a substantial portion of its cash balances in U.S. dollar accounts. Occasionally, however, it may have some cash deposits in Australian dollar accounts. Until these funds are converted into U.S. dollars, the U.S. dollar value of the deposits will change as the exchange rate between the two currencies fluctuates.
Other Risks
Other factors can impact the environment in which the Company operates and thus can affect its ability to perform as desired. Such factors include:
– Changes in legislation and Government regulation both in the USA and in other countries in which the Company operates.
– Political and societal risks from wars, social and ethnic unrest, changes in government and insurgencies in the districts, regions and countries in which the Company operates;
– Environmental risks from existing and new regulations and standards being applied in the jurisdictions in which the Company operates;
– General economic conditions in the USA and Australia; and
– Stock market conditions in Australia.
9. Dividends
Directors do not recommend the payment of a dividend for the financial year ended 31 December 2016. No dividends were paid during the financial year.
10. Significant changes in state of affairs
There were no significant changes to the state of affairs of Petsec Energy during the financial year, other than those detailed in the “Financial review” and “Operations review” sections of this report.
P E T S E C E N E R GY LT D
A N N UA L R E P O R T 20 16
19
11. Environmental regulation
The consolidated entity’s oil and gas exploration and production activities are subject to significant environmental regulation under U.S. Federal and State legislation and Republic of Yemen legislation.
The consolidated entity is committed to achieving a high standard of environmental performance and compliance with all lease conditions. Directors are not aware of any breach of environmental compliance requirements relating to the consolidated entity’s activities during the year.
12. Likely developments
The consolidated entity’s focus in 2017 will be:
– USA – development of the Hummer project with a view to first production commencing third quarter 2017.
– MENA – restart of production at the An Nagyah Oilfield, with the objective of achieving production in 2017.
The Company will focus on optimisation of its resources across all of its geographic segments with the objective to achieve maximum efficiency and an overall reduction in its operating costs.
13. Directors’ interests
The relevant interest of each director in the shares or options over such instruments issued by the Company, as notified by the directors to the Australian Securities Exchange in accordance with S205G (1) of the Corporations Act 2001, at the date of this report is as follows:
DirectorOrdinary Shares
Options over
Ordinary Shares
T N Fern 37,876,361 2,000,000
D A Mortimer 12,241,098 Nil
A P Baden Nil Nil
14. Share options
Options granted to directors and officers of the Company
As at 31 December 2016, there were 6,700,000 share options in Petsec Energy Ltd on issue.
During or since the end of the financial year, 800,000 share options were granted under the Employee Share Plan to key management personnel of the Company as part of their remuneration. No share options were exercised or forfeited.
During or since the end of the financial year, no ordinary shares have been issued by the Company as result of the exercise of options.
15. Indemnification and insurance of officers
During the year ended 31 December 2016, the Company maintained policies of insurance in respect of directors and officers liability. The policies insure persons who are directors or officers of the Company and its controlled entities against certain costs and expenses which may be incurred by them in defending proceedings and against other liabilities which may arise from their positions. The insured directors and officers are the directors, executive officers and secretaries of the Company and the directors, executive officers and secretaries of controlled entities.
The insurance contracts prohibit the disclosure of particulars of the premiums and the nature of the liabilities insured.
The Company has entered into Deeds of Indemnity and Access with directors on the terms approved by shareholders. The agreements stipulate that the Company will meet the full amount of any liabilities to another person that might arise from their position (except where the liability arises out of conduct involving a lack of good faith).
The Company has made during or since the end of the financial year no payments in relation to indemnification. The Company provides the normal indemnities to directors and officers in relation to the work carried out on behalf of or at the request of the Company.
16. Non-audit services
The Company’s auditor, KPMG, may perform certain other services in addition to their statutory duties.
The Board considers the non-audit services provided during the year by the auditor and in accordance with advice provided by resolution of the audit committee, is satisfied that the provision of those non-audit services during the year by the auditor is compatible with, and did not compromise, the auditor independence requirements of the Corporation Act 2001 for the following reasons:
– All non-audit services were subject to the corporate governance procedures adopted by the Company and have been reviewed by the audit committee to ensure they do not impact the integrity and objectivity of the auditor; and
– The non-audit services provided do not undermine the general principles relating to auditor independence as set out in APES 110 Code of Ethics for Professional Accountants, as they did not involve reviewing or auditing the auditor’s own work, acting in a management or decision-making capacity for the Company, acting as an advocate for the Company or jointly sharing risks and rewards.
Details of the amounts paid to the auditor of the Company, KPMG, and its related practices for audit and non-audit services provided during the year are set out in Note 7 of the accompanying Financial Statements.

Directors’ Report Continued For the year ended 31 December 2016
P E T S E C E N E R GY LT D
A N N UA L R E P O R T 20 16
20
17. Lead auditor’s independence declaration
The Lead Auditor’s Independence Declaration is set out on page 27 and forms part of the Directors’ Report for the financial year ended 31 December 2016.
18. Rounding off
The Company is of a kind referred to in ASIC Corporations (Rounding in Financial/Directors’ Reports) Instrument 2016/191 dated 24 March 2016 and in accordance with that Class Order, amounts in the Financial Report and Directors’ Report have been rounded off to the nearest one thousand dollars, unless otherwise stated.
19. Events subsequent to balance date
Subsequent to balance date, the Company has agreed with the Registrar of the secured convertible note facility to extend the drawdown period of the remaining US$0.5 million of funds available under Tranche 1 of the facility to 1 April 2017.
Other than the matter disclosed above, there has not arisen in the interval between the end of the financial year and the date of this report any item, transaction or event of a material and unusual nature likely, in the opinion of the directors of the Company, to affect significantly the operations of the consolidated entity, the results of those operations, or the state of affairs of the consolidated entity, in future years.
This report is made with a resolution of the directors:
Terrence N Fern Director
Sydney, 28 February 2017
20. Remuneration Report – Audited
20.1 Introduction
This Remuneration Report forms part of the Directors’ Report. It outlines the overall remuneration strategy, framework and practices adopted by the Company and the consolidated entity (“Petsec Energy Group”) for the year ended 31 December 2016 and has been prepared in accordance with Section 300A of the Corporations Act 2001 and its regulations.
In accordance with the Corporations Act 2001, remuneration details are disclosed for the Petsec Energy Group’s Key Management Personnel.
Key management personnel are those persons having authority and responsibility for planning, directing and controlling the activities of the Petsec Energy Group. Key management personnel comprise the directors of the Company and senior executives of the Petsec Energy Group, whose names appear in the tables in section 20.5 of this report.
20.2 Executive summary
The Board’s remuneration policy is to provide fair and market competitive levels of remuneration for all employees, including directors and key management personnel in order for the Company and the Petsec Energy Group to benefit by attracting and retaining a high quality team.
The Company has a Nomination and Remuneration Committee to assist the Board in the implementation and administration of the remuneration policy – refer to section 20.3, below.
The key developments during the year in the implementation and administration of the remuneration policy included:
20.2.1 The annual review of key management personnel performance.
20.2.2 Annual review of the Nomination & Remuneration Committee Charter.
20.3 Nomination and Remuneration Committee
The Nomination and Remuneration Committee oversees the appointment and induction process for directors and committee members, and the selection, appointment and succession planning process of the Company’s Chief Executive Officer. The Committee makes recommendations to the Board on the appropriate skill mix, personal qualities, expertise and diversity of each position. When a vacancy exists or there is a need for particular skills, the Committee in consultation with the Board determines the selection criteria based on the skills deemed necessary.
The Committee reviews and makes recommendations to the Board on compensation packages and policies applicable to the executive officers and directors of the Petsec Energy Group. It is also responsible for oversight of diversity, employee share and option schemes, incentive performance packages, superannuation entitlements, retirement and termination entitlements, fringe benefits policies, deeds of access and indemnity, and professional indemnity and liability insurance policies.
P E T S E C E N E R GY LT D
A N N UA L R E P O R T 20 16
2 1
Executive compensation and other terms of employment are reviewed annually by the Nomination and Remuneration Committee having regard to performance against goals set at the start of the year, relevant corporate information and where appropriate independent expert advice.
The Nomination and Remuneration Committee comprised the following members during the year:
– D A Mortimer (Chairman) – Independent Non-executive Director
– A P Baden – Independent Non-executive Director
– M S Lober – Independent Non-executive Director (retired on 19 May 2016)
The Board policy is that the Nomination and Remuneration Committee will comprise a majority of non-executive directors and a non-executive chairman.
The Nomination and Remuneration Committee meets at least twice a year and as required. The Committee met four times during the year and the Committee members’ attendance record is disclosed in the table of directors’ meetings.
The Nomination and Remuneration Committee’s Charter is available on the Company’s website www.petsec.com.au.
20.4 Principles of compensation
Compensation levels for key management personnel are competitively set to attract and retain appropriately qualified and experienced directors and senior executives. The Nomination and Remuneration Committee obtains peer comparisons and/or independent advice on the appropriateness of compensation packages of the Petsec Energy Group, given trends in comparative companies both locally and internationally and the objectives of the Company’s compensation strategy.
The compensation structures explained below are designed to attract suitably qualified candidates, reward the achievement of the Company’s objectives, and achieve the broader outcome of creation of value for shareholders.
The compensation structures take into account:
– the capability and experience of the key management personnel; and
– the ability of key management personnel to control the relevant performance of their segment of operation.
Compensation packages include a mix of fixed compensation and performance-based incentives, including equity-based incentives as set out below.
In addition to their salaries, the Petsec Energy Group also provides non-cash benefits to its key management personnel as set out below, and contributes to several post-employment defined contribution superannuation plans in Australia and also matches contributions made by U.S. based key management personnel to a voluntary savings plan under Section 401(k) of the U.S. tax code.
Fixed compensation
Fixed compensation consists of base compensation (which is calculated on a total cost basis and includes any FBT charges related to employee benefits), as well as employer contributions to superannuation funds in Australia and employer matching contributions to voluntary savings plans under Section 401(k) of the U.S. tax code. Non-cash benefits comprise employer payments towards U.S. health, dental and vision plans, as well as life and salary continuance insurance benefits.
The Nomination and Remuneration Committee reviews compensation levels and other terms of employment annually through a process that considers individual, segment and overall performance of the Company against goals set at the start of the year. In addition, where necessary, external consultants provide analysis and advice to ensure the directors’ and senior executives’ compensation is competitive in the market place.
Performance-linked compensation
Performance-linked compensation includes both short-term and long-term incentives and is designed to reward key management personnel for meeting or exceeding the Company’s financial objectives and agreed individual objectives. The short-term incentive (STI) is an “at risk” bonus provided in the form of cash or ordinary shares in the Company, while the long-term incentive (LTI) is provided as either shares or options over ordinary shares of the Company under the rules of the Employee Share and Option Plans approved by shareholders at the Annual General Meeting held on 19 May 2016 (see note 17(b) to financial statements). The maximum number of securities in aggregate that may be issued under the Employee Share and Option Plans is 15,033,435.
Short-term incentive
Short-term incentives are provided to key management personnel through discretionary bonuses as determined and granted by the Company’s Nomination and Remuneration Committee. Factors considered by the Committee when granting discretionary bonuses include personal performance, the achievement of strategic objectives, and the retention and motivation of employees.
During the year, Mr. Petkovski received a guaranteed bonus of A$150,000 (US$ 107,570) in respect of the first 12 months of his employment. No other bonuses were paid to key management personnel.
Long-term incentive
Certain key management personnel are also provided with long-term incentives through participation in the Company’s Employee Share and Option Plans, subject to the approval of the Committee. Key management personnel are typically offered options on an annual basis with the exercise price of the shares or options based on the weighted average market price of the Company’s ordinary shares for the five trading days preceding the date of issue, subject to a minimum exercise price of 20 cents.
Directors’ Report Continued For the year ended 31 December 2016
P E T S E C E N E R GY LT D
A N N UA L R E P O R T 20 16
22
20. Remuneration Report – Audited (continued)
20.4 Principles of compensation (continued)
During the year, the Company issued 800,000 shares under its shareholder approved Employee Share Plan (“ESP”) to Mr. Gahdmar as long-term incentive compensation (see note 20.7 of the Remuneration Report). The shares were issued to the Trustee of the ESP on behalf of Mr. Gahdmar and under the terms of the ESP at a price of A$0.20 per share, being the minimum issue price under the terms of the ESP. The funds for the share issue were provided to Mr. Gahdmar through an interest free limited recourse loan under the terms of the loan scheme under the ESP, The terms of the loan provide that if the borrower defaults on the loan the Company shall accept the shares issued under the ESP in full satisfaction of the loan. The loan matures on 24 February 2021.
The shares will vest as follows:
(i) 200,000 shares on 24 February 2017 at a minimum share price of A$0.25
(ii) A further 200,000 shares on 24 February 2018 at a minimum share price of A$0.30
(iii) A further 200,000 shares on 24 February 2019 at a minimum share price of A$0.35
(iv) A further 200,000 shares on 24 February 2020 at a minimum share price of A$0.40
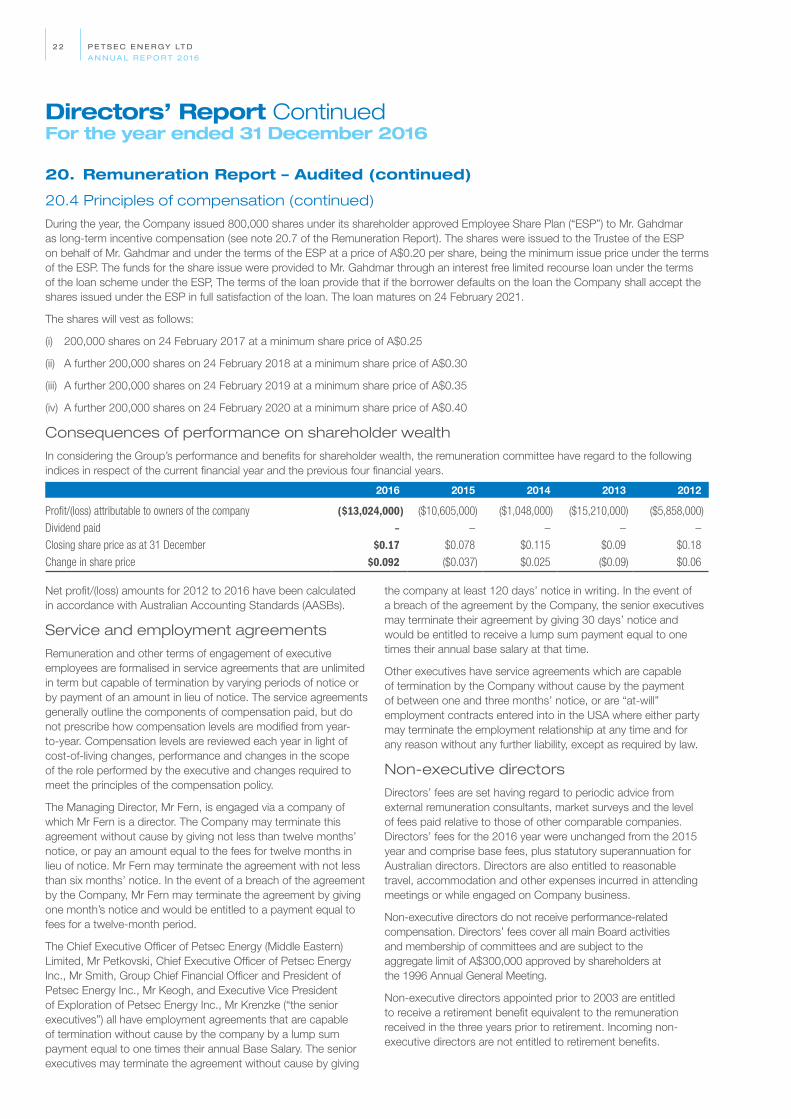
Consequences of performance on shareholder wealth
In considering the Group’s performance and benefits for shareholder wealth, the remuneration committee have regard to the following indices in respect of the current financial year and the previous four financial years.
2016 2015 2014 2013 2012
Profit/(loss) attributable to owners of the company ($13,024,000) ($10,605,000) ($1,048,000) ($15,210,000) ($5,858,000)
Dividend paid – – – – –
Closing share price as at 31 December $0.17 $0.078 $0.115 $0.09 $0.18
Change in share price $0.092 ($0.037) $0.025 ($0.09) $0.06
Net profit/(loss) amounts for 2012 to 2016 have been calculated in accordance with Australian Accounting Standards (AASBs).
Service and employment agreements
Remuneration and other terms of engagement of executive employees are formalised in service agreements that are unlimited in term but capable of termination by varying periods of notice or by payment of an amount in lieu of notice. The service agreements generally outline the components of compensation paid, but do not prescribe how compensation levels are modified from year-to-year. Compensation levels are reviewed each year in light of cost-of-living changes, performance and changes in the scope of the role performed by the executive and changes required to meet the principles of the compensation policy.
The Managing Director, Mr Fern, is engaged via a company of which Mr Fern is a director. The Company may terminate this agreement without cause by giving not less than twelve months’ notice, or pay an amount equal to the fees for twelve months in lieu of notice. Mr Fern may terminate the agreement with not less than six months’ notice. In the event of a breach of the agreement by the Company, Mr Fern may terminate the agreement by giving one month’s notice and would be entitled to a payment equal to fees for a twelve-month period.
The Chief Executive Officer of Petsec Energy (Middle Eastern) Limited, Mr Petkovski, Chief Executive Officer of Petsec Energy Inc., Mr Smith, Group Chief Financial Officer and President of Petsec Energy Inc., Mr Keogh, and Executive Vice President of Exploration of Petsec Energy Inc., Mr Krenzke (“the senior executives”) all have employment agreements that are capable of termination without cause by the company by a lump sum payment equal to one times their annual Base Salary. The senior executives may terminate the agreement without cause by giving
the company at least 120 days’ notice in writing. In the event of a breach of the agreement by the Company, the senior executives may terminate their agreement by giving 30 days’ notice and would be entitled to receive a lump sum payment equal to one times their annual base salary at that time.
Other executives have service agreements which are capable of termination by the Company without cause by the payment of between one and three months’ notice, or are “at-will” employment contracts entered into in the USA where either party may terminate the employment relationship at any time and for any reason without any further liability, except as required by law.
Non-executive directors
Directors’ fees are set having regard to periodic advice from external remuneration consultants, market surveys and the level of fees paid relative to those of other comparable companies. Directors’ fees for the 2016 year were unchanged from the 2015 year and comprise base fees, plus statutory superannuation for Australian directors. Directors are also entitled to reasonable travel, accommodation and other expenses incurred in attending meetings or while engaged on Company business.
Non-executive directors do not receive performance-related compensation. Directors’ fees cover all main Board activities and membership of committees and are subject to the aggregate limit of A$300,000 approved by shareholders at the 1996 Annual General Meeting.
Non-executive directors appointed prior to 2003 are entitled to receive a retirement benefit equivalent to the remuneration received in the three years prior to retirement. Incoming non-executive directors are not entitled to retirement benefits.

P E T S E C E N E R GY LT D
A N N UA L R E P O R T 20 16
23
20
.5 D
irec
tors
’ an
d E
xec
utiv
e O
ffic
ers
’ Re
mu
ne
ratio
n R
ep
ort
Det
ails
of t
he n
atur
e an
d am
ount
of r
emun
erat
ion
for
the
key
man
agem
ent p
erso
nnel
con
sist
ing
of e
ach
dire
ctor
and
exe
cutiv
e of
ficer
of t
he C
ompa
ny a
nd th
e co
nsol
idat
ed e
ntity
are
:
Shor
t-te
rm b
enefi
tsPo
st-e
mpl
oym
ent
bene
fits
Shar
e-ba
sed
paym
ent
Tota
lU
S$
Prop
ortio
n of
rem
uner
atio
n p
erfo
rman
ce re
late
d %
Acco
untin
g fa
ir va
lue
as p
ropo
rtio
n of
rem
uner
atio
n %
Sala
ry &
fees
US$
Shor
t-te
rm in
cent
ive/
re
tent
ion
cash
bon
usU
S$
Othe
r be
nefit
sU
S$
Serv
ice
agr
eem
ents
US$
Supe
r-an
nuat
ion
ben
efits
US$
Term
inat
ion
bene
fits
US$
Acco
untin
g fa
ir va
lue
US$
Dire
ctor
s 1
Exec
utiv
eT
N Fe
rn 1
(Not
e 1)
2016
––
41,6
4553
4,24
0–
––
575,
885
––
Chai
rman
, Man
agin
g Di
rect
or20
15–
–42
,061
541,
224
––
–58
3,28
5–
–No
n-ex
ecut
ive
D A
Mor
timer
120
1648
,230
––
–4,
582
––
52,8
12–
–Di
rect
or20
1548
,860
––
–4,
642
––
53,5
02–
–
A P
Bade
n20
1650
,000
––
––
––
50,0
00–
–Di
rect
or20
1550
,000
––
––
–
–50
,000
––
M S
Lob
er (N
ote
2)20
1619
,086
––
––
––
19,0
86–
–Di
rect
or20
1550
,000
––
––
–
–50
,000
––
Tota
l dire
ctor
s re
mun
erat
ion
2016
117,
316
–41
,645
534,
240
4,58
2–
–69
7,78
3–
–20
1514
8,86
0–
42,0
6154
1,22
44,
642
––
736,
787
––
1 Au
stra
lian-
base
d di
rect
ors’
rem
uner
atio
n am
ount
s ar
e ac
tual
ly pa
id in
Aus
tralia
n do
llars
and
pre
sent
ed in
US
dolla
rs a
t the
follo
win
g av
erag
e FX
rate
s i)
2016
– 0
.742
0 ii)
201
5 –
0.75
17

Directors’ Report Continued For the year ended 31 December 2016
P E T S E C E N E R GY LT D
A N N UA L R E P O R T 20 16
242
0.
Re
mu
ne
rati
on
Re
po
rt –
Au
dit
ed
(c
on
tin
ue
d)
20
.5 D
irec
tors
’ an
d E
xec
utiv
e O
ffic
ers
’ Re
mu
ne
ratio
n R
ep
ort
(c
on
tinu
ed
)
Det
ails
of t
he n
atur
e an
d am
ount
of r
emun
erat
ion
for
the
key
man
agem
ent p
erso
nnel
con
sist
ing
of e
ach
dire
ctor
of t
he C
ompa
ny a
nd e
xecu
tive
offic
er o
f the
Com
pany
and
the
cons
olid
ated
ent
ity a
re:
Shor
t-te
rm b
enefi
tsPo
st-e
mpl
oym
ent b
enefi
tsSh
are-
base
d pa
ymen
t
Tota
lU
S$
Prop
ortio
n of
rem
uner
atio
n p
erfo
rman
ce re
late
d %
Acco
untin
g fa
ir va
lue
as p
ropo
rtio
n of
rem
uner
atio
n %
Sala
ry &
fees
US$
Note
4
Shor
t-te
rm in
cent
ive/
rete
ntio
n ca
shbo
nusB
US$
Note
5
Othe
r be
nefit
sU
S$No
te 6
Serv
ice
agr
eem
ents
US$
Supe
r-an
nuat
ion
/401
K be
nefit
sU
S$
Term
-in
atio
nbe
nefit
sU
S$
Acco
untin
g fa
ir va
lue
US$
Note
7
Exe
cutiv
esR
J Sm
ith
Chie
f Exe
cutiv
e Of
ficer
of
Pets
ec E
nerg
y In
c. (P
EI)
2016
310,
000
–33
,427
–13
,250
––
356,
677
––
2015
310,
000
–32
,884
–13
,250
––
356,
134
––
R A
Keog
h Pr
esid
ent,
PEI a
nd G
roup
Ch
ief F
inan
cial
Offi
cer
2016
296,
135
–33
,457
–13
,250
––
342,
842
––
2015
295,
000
–31
,521
–13
,250
––
339,
771
––
R Kr
enzk
e Ex
ecut
ive V
ice
Pres
iden
t Ex
plor
atio
n, P
EI
2016
292,
231
–38
,842
–13
,250
––
344,
323
––
2015
290,
000
–36
,792
–13
,250
––
340,
042
––
M P
etko
vski
A &
C (N
ote
3)
Chie
f Exe
cutiv
e Of
ficer
of
Pet
sec
Ener
gy (M
iddl
e Ea
ster
n) L
imite
d (a
ppoi
nted
16
Mar
ch 2
015)
2016
–23
,014
24,9
9225
9,70
0–
–16
,396
324,
102
7.1
5.1
2015
–84
,566
96,9
8520
8,45
2–
–11
,085
401,
088
21.1
2.8
P Ga
hdm
ar A
Com
pany
Sec
reta
ry, G
roup
Fi
nanc
ial C
ontro
ller
2016
148,
024
–8,
024
–12
,875
–3,
246
172,
169
–1.
920
1514
7,68
6–
7,48
6–
14,0
30–
1516
9,21
7–
–
Tota
l exe
cutiv
e re
mun
erat
ion
2016
1,04
6,39
023
,014
138,
742
259,
700
52,6
25–
19,6
421,
540,
113
1.5
1.3
2015
1,04
2,68
684
,566
205,
668
208,
452
53,7
80–
11,1
001,
606,
252
5.3
0.7
Tota
l dire
ctor
s an
d
exec
utiv
e of
ficer
re
mun
erat
ion
2016
1,16
3,70
623
,014
180,
387
793,
940
57,2
07–
19,6
422,
237,
896
1.0
0.9
2015
1,19
1,54
684
,566
247,
729
749,
676
58,4
22–
11,1
002,
343,
039
3.6
0.5
A Au
stra
lian-
base
d ex
ecut
ive o
ffice
rs’ r
emun
erat
ion
amou
nts
are
actu
ally
paid
in A
ustra
lian
dolla
rs a
nd p
rese
nted
in U
S do
llars
at t
he fo
llow
ing
aver
age
FX ra
tes
i) 20
16 –
0.7
420
ii) 2
015
– 0.
7517
.B
Bonu
ses
accr
ued
in re
spec
t of t
he 2
015
and
2016
yea
r wer
e pa
id in
201
6.C
A si
gn-o
n bo
nus
of U
S$90
,204
was
pai
d to
Mr.
Petk
ovsk
i on
21 D
ecem
ber 2
015
and
is in
clud
ed in
Oth
er B
enefi
ts a
bove
in th
e 20
15 y
ear.
Note
s1)
In
clud
ed in
ser
vice
agre
emen
ts a
bove
is a
n am
ount
of U
S$53
4,24
0 (2
015:
US$
541,
224)
whi
ch w
as p
aid
or is
pay
able
to, a
com
pany
of w
hich
Mr F
ern
is a
dire
ctor
.
Durin
g th
e ye
ar, a
com
pany
of w
hich
Mr F
ern
is a
dire
ctor
pro
vided
man
agem
ent s
ervic
es to
the
Com
pany
and
its
cont
rolle
d en
titie
s. T
he d
ealin
gs w
ere
in th
e or
dina
ry c
ours
e of
bus
ines
s an
d on
nor
mal
term
s an
d co
nditi
ons.
2)
Mr L
ober
resi
gned
from
his
pos
ition
on
the
Boar
d an
d its
Com
mitt
ees
on 1
9 M
ay 2
016.
3)
Mr P
etko
vski
was
app
oint
ed to
the
role
of C
hief
Exe
cutiv
e Of
ficer
of t
he C
ompa
ny’s
MEN
A su
bsid
iary
, Pet
sec
Ener
gy (M
iddl
e Ea
ster
n) L
imite
d on
16
Mar
ch 2
015.
In
clud
ed in
ser
vice
agre
emen
ts a
bove
is a
n am
ount
of U
S$25
9,70
0 (2
015:
US$
208,
452)
whi
ch w
as p
aid,
or i
s pa
yabl
e to
a c
ompa
ny o
f whi
ch M
r. Fe
rn is
a d
irect
or a
nd th
roug
h w
hich
Mr.
Petk
ovsk
i pro
vided
ser
vices
.4)
Sa
lary
and
fees
for c
erta
in s
peci
fied
exec
utive
s in
clud
es th
e m
ovem
ent d
urin
g th
e re
porti
ng p
erio
d of
acc
rual
s fo
r ann
ual l
eave
and
long
ser
vice
leav
e.5)
Sh
ort-
term
ince
ntive
/rete
ntio
n ca
sh b
onus
es re
pres
ent d
iscr
etio
nary
bon
us a
mou
nts
gran
ted
base
d on
a n
umbe
r of f
acto
rs in
clud
ing
pers
onal
per
form
ance
, the
ach
ieve
men
t of s
trate
gic
obje
ctive
s, re
tent
ion
and
mot
ivatio
n of
em
ploy
ees.
6)
Othe
r ben
efits
repr
esen
t am
ount
s pa
id o
n be
half
of th
e M
anag
ing
Dire
ctor
and
Exe
cutiv
e Of
ficer
s in
resp
ect o
f ins
uran
ce, c
ar p
arki
ng, f
ringe
ben
efits
and
sig
n-on
bon
uses
.7)
Th
e fa
ir va
lue
of o
ptio
ns a
nd s
hare
s is
cal
cula
ted
at th
e da
te o
f the
gra
nt u
sing
the
Blac
k-Sc
hole
s m
odel
and
allo
cate
d to
eac
h re
porti
ng p
erio
d ov
er th
e pe
riod
from
gra
nt d
ate
to v
estin
g da
te.

P E T S E C E N E R GY LT D
A N N UA L R E P O R T 20 16
25
No termination benefits were paid to key management personnel for the year ended 31 December 2016 (2015: Nil).
The following table sets out the factors and assumptions used in determining the fair value of the shares or options issued to key management personnel.
Grant date Expiry date
Average fair value
per optionExercise
price
Price of shares on grant date
Averageestimated volatility
Risk-free interest
rateDividend
yield
26/03/124 26/03/17 A$0.116 A$0.20 A$0.235 75.7% 3.56% –
8/10/121 10/10/17 A$0.048 A$0.20 A$0.145 103.6% 2.39% –
26/6/152 24/06/21 A$0.006 A$0.20 A$0.10 67.0% 2.06% –
23/02/163 24/02/21 A$0.005 A$0.20 A$0.09 58.1% 1.75% –
1 Issued to T Fern. Shares vest between 1 June 2012 – 10 October 2017 at a minimum share price of A$0.20.
2 Issued to M Petkovski. Shares vest between 24 June 2016 – 24 June 2020 at a minimum share price of between A$0.25-A$0.45.
3 Issued to P Gahdmar. Shares vest between 24 February 2017 – 24 February 2020 at a minimum share price of between A$0.25-A$0.40.
4 Issued to P Gahdmar. Shares vest between 1 January 2013 – 26 March 2017 at a minimum share price of A$0.20.
20.6 Analysis of short-term incentive/retention cash bonuses included in remuneration
Amounts included in remuneration for the financial year, within the table included in note 20.5 of this Directors’ Report, represent the amount that vested in the financial year based on a number of factors including achievement of personal goals, satisfaction of specified performance criteria, retention and motivation of employees.
No amounts vest in future financial years in respect of the short-term incentives and bonus schemes for the 2016 year.
No amounts were forfeited due to the performance or service criteria not being met in relation to the current financial year.
20.7 Equity instrumentsOptions over equity instruments granted as compensation
All options refer to options over ordinary shares of Petsec Energy Ltd, which are exercisable on a one-for-one basis under the Employee Share Plan and Employee Option Plan.
During 2016, 800,000 shares under the Employee Share Plan were granted as compensation to key management personnel (2015: nil) and no shares vested (2015: 133,333).
The movement during the reporting period in the number of shares and options under the Employee Share Plan and Employee Option Plan held, directly, indirectly or beneficially, by each key management person, including their related parties, is as follows:
Held at1 January
2016Granted as
compensation ExercisedOther
changes 1
Held at 31 December
2016
Vested during the
year
Vested and exercisable at 31 December
2016
DirectorsT Fern 2,000,000 – – – 2,000,000 3 – –
D Mortimer – – – – – – –
A Baden – – – – – – –
M Lober 2 – – – – – – –ExecutivesR Smith – – – – – – –
R Keogh – – – – – – –
R Krenzke – – – – – – –
M. Petkovski 2,500,000 – – – 2,500,000 4 – –
P Gahdmar 400,000 800,000 – – 1,200,000 3 – –
1 Other changes represent shares and options that expired or were forfeited during the year.
2 Mr Lober resigned from his position on the Board and its Committees on 19 May 2016.
3 Shares exercisable upon reaching a minimum share price of between A$0.20 to A$0.40.
4 Shares exercisable upon reaching a minimum share price of between A$0.25 to A$0.45.
No shares or options under the Employee Share Plan and Employee Option Plan are held by key management personnel related parties.
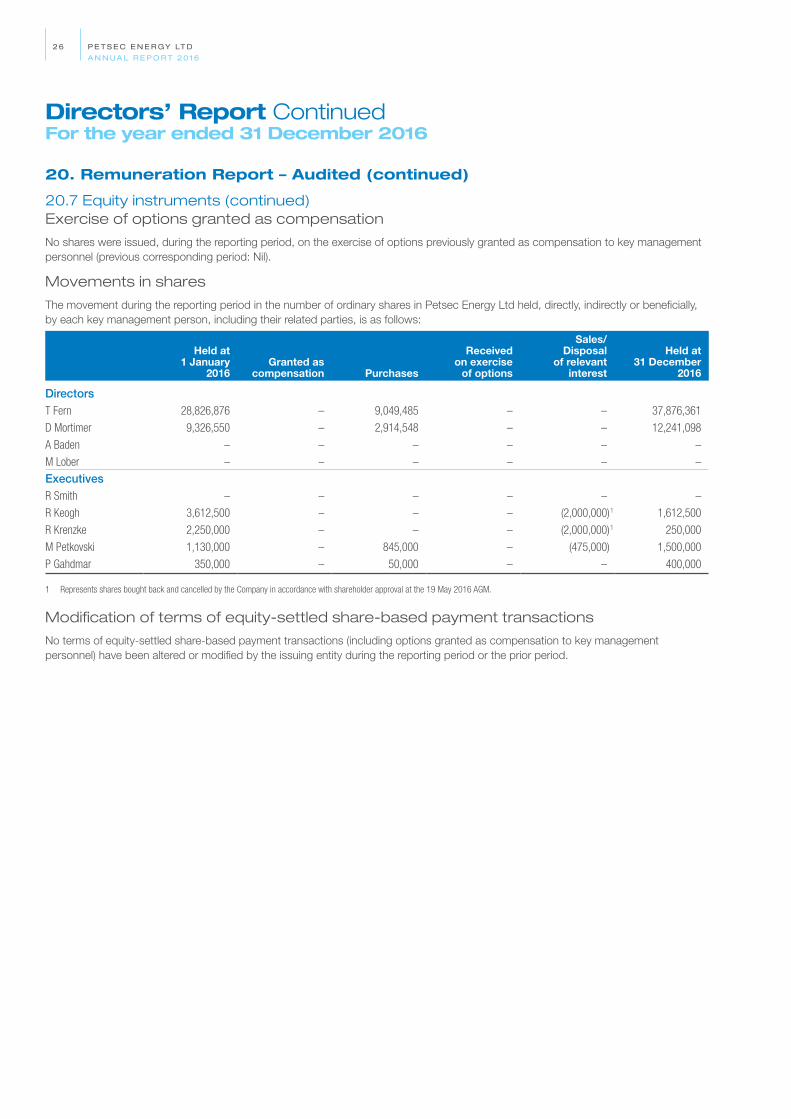
Directors’ Report Continued For the year ended 31 December 2016
P E T S E C E N E R GY LT D
A N N UA L R E P O R T 20 16
26
20. Remuneration Report – Audited (continued)
20.7 Equity instruments (continued)Exercise of options granted as compensation
No shares were issued, during the reporting period, on the exercise of options previously granted as compensation to key management personnel (previous corresponding period: Nil).
Movements in shares
The movement during the reporting period in the number of ordinary shares in Petsec Energy Ltd held, directly, indirectly or beneficially, by each key management person, including their related parties, is as follows:
Held at1 January
2016Granted as
compensation Purchases
Received on exercise
of options
Sales/Disposal
of relevant interest
Held at 31 December
2016
DirectorsT Fern 28,826,876 – 9,049,485 – – 37,876,361
D Mortimer 9,326,550 – 2,914,548 – – 12,241,098
A Baden – – – – – –
M Lober – – – – – –ExecutivesR Smith – – – – – –
R Keogh 3,612,500 – – – (2,000,000) 1 1,612,500
R Krenzke 2,250,000 – – – (2,000,000) 1 250,000
M Petkovski 1,130,000 – 845,000 – (475,000) 1,500,000
P Gahdmar 350,000 – 50,000 – – 400,000
1 Represents shares bought back and cancelled by the Company in accordance with shareholder approval at the 19 May 2016 AGM.
Modification of terms of equity-settled share-based payment transactions
No terms of equity-settled share-based payment transactions (including options granted as compensation to key management personnel) have been altered or modified by the issuing entity during the reporting period or the prior period.
P E T S E C E N E R GY LT D
A N N UA L R E P O R T 20 16
27
Lead Auditor’s Independence Declaration under Section 307C of the Corporations Act 2001
34
KPMG, an Australian partnership and a member firm of the KPMG network of independent member firms affiliated with KPMG International Cooperative (“KPMG International”), a Swiss entity.
Liability limited by a scheme approved under Professional Standards Legislation.
Lead Auditor’s Independence Declaration under
Section 307C of the Corporations Act 2001
To the Directors of Petsec Energy Ltd.
I declare that, to the best of my knowledge and belief, in relation to the audit for the financial year ended 31 December 2016 there have been:
(i) no contraventions of the auditor independence requirements as set out in the Corporations Act 2001 in relation to the audit; and
(ii) no contraventions of any applicable code of professional conduct in relation to the audit
KPMG Daniel Camilleri Partner Sydney 28 February 2017
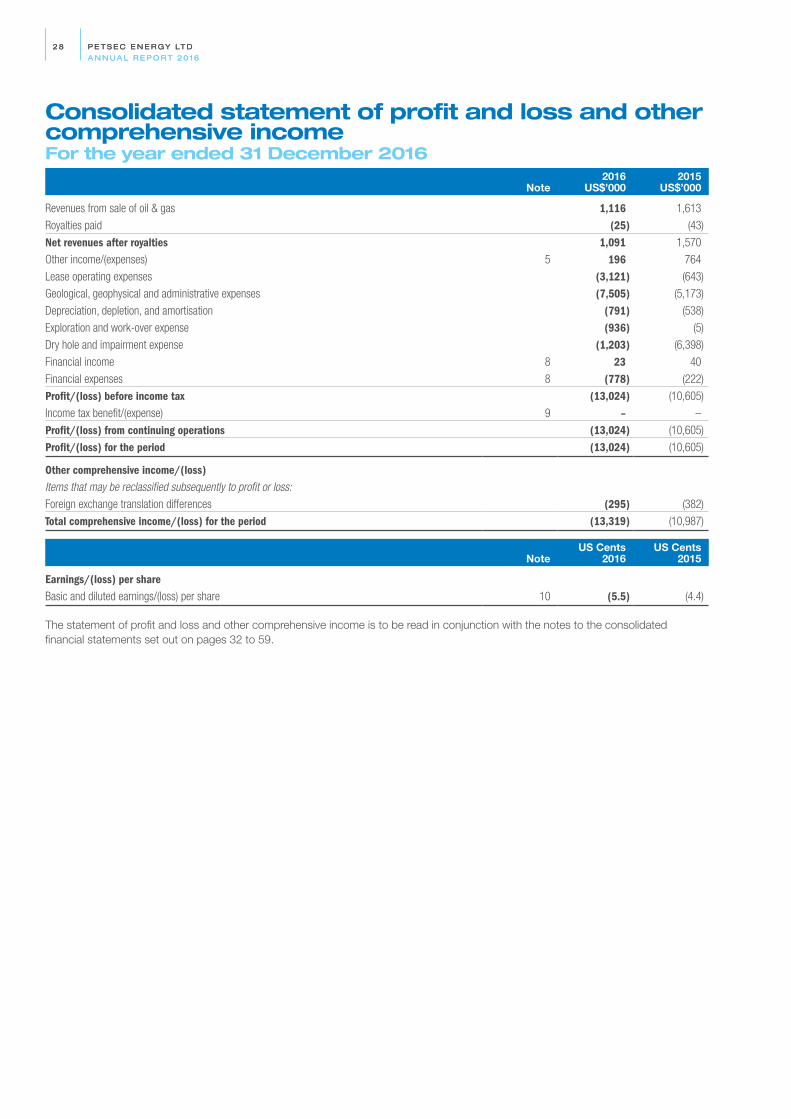
P E T S E C E N E R GY LT D
A N N UA L R E P O R T 20 16
28 P E T S E C E N E R GY LT D
A N N UA L R E P O R T 20 16
28
Consolidated statement of profit and loss and other comprehensive incomeFor the year ended 31 December 2016
Note2016
US$’0002015
US$’000
Revenues from sale of oil & gas 1,116 1,613
Royalties paid (25) (43)
Net revenues after royalties 1,091 1,570
Other income/(expenses) 5 196 764
Lease operating expenses (3,121) (643)
Geological, geophysical and administrative expenses (7,505) (5,173)
Depreciation, depletion, and amortisation (791) (538)
Exploration and work-over expense (936) (5)
Dry hole and impairment expense (1,203) (6,398)
Financial income 8 23 40
Financial expenses 8 (778) (222)
Profit/(loss) before income tax (13,024) (10,605)
Income tax benefit/(expense) 9 – –
Profit/(loss) from continuing operations (13,024) (10,605)
Profit/(loss) for the period (13,024) (10,605)
Other comprehensive income/(loss)Items that may be reclassified subsequently to profit or loss:
Foreign exchange translation differences (295) (382)
Total comprehensive income/(loss) for the period (13,319) (10,987)
NoteUS Cents
2016US Cents
2015
Earnings/(loss) per shareBasic and diluted earnings/(loss) per share 10 (5.5) (4.4)
The statement of profit and loss and other comprehensive income is to be read in conjunction with the notes to the consolidated financial statements set out on pages 32 to 59.

P E T S E C E N E R GY LT D
A N N UA L R E P O R T 20 16
29
In thousands of USD
Share capital
US$’000
TranslationReserveUS$’000
Share-basedcompen-
sationUS$’000
OptionReserveUS$’000
Accumulated losses
US$’000
TotalEquity
US$’000
Balance at 1 January 2015 186,001 1,786 17 – (153,559) 34,245
Total comprehensive income for the periodProfit/(loss) for the period – – – – (10,605) (10,605)
Other comprehensive income Foreign exchange translation difference – (382) – – – (382)
Total other comprehensive income/(loss) – (382) – – – (382)
Total comprehensive income/(loss) for the period – (382) – – (10,605) (10,987)
Transactions with owners, recorded directly in equityContributions by and distributions to ownersShare issue 525 – – – – 525
Vesting of share options 15 – (15) – – –
Share-based payments expense – – 11 – – 11
Total transactions with owners 540 – (4) – – 536
Balance at 31 December 2015 186,541 1,404 13 – (164,164) 23,794
Balance at 1 January 2016 186,541 1,404 13 – (164,164) 23,794Total comprehensive income/(loss) for the periodProfit/(loss) for the period – – – – (13,024) (13,024)Other comprehensive income/(loss)Foreign exchange translation differences – (295) – – – (295)Total other comprehensive income/(loss) – (295) – – – (295)Total comprehensive income/(loss) for the period – (295) – – (13,024) (13,319)Transactions with owners, recorded directly in equityContributions by and distributions to ownersShare issue/(cancelled) 7,187 – – – – 7,187Option issue – – – 416 – 416Vesting of share options 5 – (5) – – –Share-based payments expense – – 23 – – 23Total transactions with owners 7,192 – 18 416 – 7,626Balance at 31 December 2016 193,733 1,109 31 416 (177,188) 18,101
The statement of changes in equity is to be read in conjunction with the notes to the consolidated financial statements set out on pages 32 to 59.
Consolidated statement of changes in equityFor the year ended 31 December 2016

P E T S E C E N E R GY LT D
A N N UA L R E P O R T 20 16
3 0 P E T S E C E N E R GY LT D
A N N UA L R E P O R T 20 16
3 0
Consolidated statement of financial positionAs at 31 December
Note2016
US$’0002015
US$’000
ASSETSCurrent assetsCash and cash equivalents 9,504 9,140
Restricted cash deposits 1 3,368 66
Trade and other receivables 11 4,566 5,180
Prepayments 187 520
Crude inventories 190 –
Total current assets 17,815 14,906
Non-current assetsRestricted cash deposits 1 205 3,601
Receivables 11 – 861
Property, plant and equipment 184 104
Oil and gas properties 12(a) 16,810 6,443
Exploration and evaluation properties 12(b) 358 6,556
Total non-current assets 17,557 17,565
Total assets 35,372 32,471
LIABILITIESCurrent liabilitiesTrade and other payables 14 12,229 5,702
Rehabilitation provisions 18 546 2,573
Employee benefits provisions 181 157
Total current liabilities 12,956 8,432
Non-current liabilitiesSecured borrowings 15 3,299 –
Fair value of derivative instruments 16 764 –
Rehabilitation provisions 18 68 61
Employee benefits provisions 184 184
Total non-current liabilities 4,315 245
Total liabilities 17,271 8,677
Net assets 18,101 23,794
EQUITYIssued capital 19 193,733 186,541
Reserves 19 1,556 1,417
Accumulated losses (177,188) (164,164)
Total equity 18,101 23,794
1 Relates to cash used to guarantee certain future rehabilitation obligations (see note 23–Contingencies and Legal Matters for further details).
The statement of financial position is to be read in conjunction with the notes to the consolidated financial statements set out on pages 32 to 59.

P E T S E C E N E R GY LT D
A N N UA L R E P O R T 20 16
3 1
Consolidated statement of cashflowsFor the year ended 31 December
Note2016
US$’0002015
US$’000
Cashflows from operating activitiesCash receipts from customers 1,383 1,572
Cash payments for royalties (30) (252)
Cash payments to suppliers and employees (8,268) (8,810)
Interest received 23 26
Restricted deposits 1 93 1,634
Net cash from operating activities 29 (6,799) (5,830)
Cashflows from investing activitiesPayments for property, plant and equipment (138) (20)
Payments for oil and gas, exploration and evaluation properties (2,727) (12,238)
Net cash from investing activities (2,865) (12,258)
Cashflows from financing activitiesProceeds from shares issued – net of transaction costs 5,521 –
Proceeds from drawdown of convertible note facility 4,508 –
Net cash from financing activities 10,029 –
Net increase/(decrease) in cash and cash equivalents 365 (18,088)
Cash and cash equivalents at 1 January 9,140 27,290
Effects of exchange rate changes on cash held (1) (62)
Cash and cash equivalents at 31 December 9,504 9,140
1 Relates to cash used to guarantee certain future rehabilitation obligations (see note 23 – Contingencies and Legal Matters for further details).
The statement of cashflows is to be read in conjunction with the notes to the consolidated financial statements set out on pages 32 to 59.
Notes to the Financial Statements For the year ended 31 December 2016
P E T S E C E N E R GY LT D
A N N UA L R E P O R T 20 16
32 P E T S E C E N E R GY LT D
A N N UA L R E P O R T 20 16
32
1. Reporting entity
Petsec Energy Ltd (the “Company”) is a company domiciled in Australia. The registered office of the Company is Level 27, Governor Macquarie Tower, One Farrer Place Sydney NSW 2000. The consolidated financial statements of the Company as at and for the year ended 31 December 2016 comprise the Company and its subsidiaries (together referred to as the “consolidated entity”).
The financial report is presented in United States dollars, which is the consolidated entity’s choice of presentation currency.
The Group is a for-profit entity and is primarily involved in oil and gas exploration and production with operations in the shallow waters of the Gulf of Mexico and onshore Louisiana, USA, and in the Republic of Yemen.
2. Basis of preparation
(a) Statement of compliance
The financial report is a general purpose financial report which has been prepared in accordance with Australian Accounting Standards (“AASBs”) (including Australian Interpretations) adopted by the Australian Accounting Standards Board (“AASB”) and the Corporations Act 2001. The consolidated financial report of the consolidated entity and the financial report of the Company comply with International Financial Reporting Standards (“IFRSs”) and interpretations adopted by the International Accounting Standards Board (IASB).
The Board of Directors approved the financial statements on 28 February 2017.
(b) Basis of measurement
The consolidated financial statements have been prepared on the historical cost basis except for the following:
– Derivative financial instruments are measured at fair value;
The methods used to measure fair values are discussed further in note 4.
The consolidated entity is of a kind referred to in ASIC Corporations (Rounding in Financial/Directors’ Reports) Instrument 2016/191 and in accordance with that instrument, all financial information presented in US dollars has been rounded to the nearest thousand unless otherwise stated.
(c) Use of estimates and judgements
The preparation of financial statements requires management to make judgements, estimates and assumptions that affect the application of accounting policies and the reported amounts of assets, liabilities, income and expenses. Actual results may differ from these estimates.
Estimates and underlying assumptions are reviewed on an ongoing basis. Revisions to accounting estimates are recognised in the period in which the estimate is revised and in any future periods affected.
In particular, information about significant areas of estimation uncertainty and critical judgements in applying accounting policies that have the most significant effect on the amount recognised in the financial statements are described in Note 3 (d) – Exploration, evaluation properties and oil and gas properties, Note 3(l) Rehabilitation provision and Note 3 (q) – Income tax.
The estimated recoverable amount of oil and gas assets is based on discounted cash flow projections which are based on estimates and assumptions that are subject to change. Key assumptions include the ultimate prices realised on the sale of oil and gas and the reserves ultimately recovered. A sustained deterioration in prices or reduction in reserves may result in future asset impairments.
(d) Going concern basis of preparation
The financial statements of the consolidated entity have been prepared on the basis of a going concern. The going concern basis of preparation assumes that an entity will realise its assets and discharge its liabilities in the normal course of business.
The directors have approved cash flow projections which support the going concern basis of preparation. The preparation of these projections incorporate a number of assumptions and judgements, and we have concluded that the range of possible outcomes considered in arriving at this judgement do not give rise to a material uncertainty casting significant doubt on the Group’s ability to continue as a going concern.
3. Significant accounting policies
The accounting policies set out below have been applied consistently to all periods presented in these consolidated financial statements, and have been applied consistently by the Company and consolidated entity.
(a) Basis of consolidation(i) Subsidiaries
Subsidiaries are entities controlled by the Company. The Company controls an entity when it is exposed to, or has rights to, variable returns from its involvement with the entity and has the ability to affect those returns through its power over the entity. The financial statements of subsidiaries are included in the consolidated financial statements from the date that control commences until the date that control ceases. The accounting policies of subsidiaries have been changed when necessary to align them with the policies adopted by the consolidated entity.
In the Company’s financial statements, investments in subsidiaries are carried at cost, less accumulated impairments.
(ii) Joint operating arrangements
Joint operating arrangements are those legal entities over whose activities the consolidated entity has joint control, whereby the Company has rights to the assets and obligations for the liabilities relating to the arrangement. The interest of the consolidated entity in unincorporated joint operating arrangements and jointly operated assets are brought to account by recognising in its financial statements the Company’s share of the arrangements underlying assets and liabilities, and the expenses it incurs and its share of income that it earns from the sale of goods or services by the joint arrangements.

P E T S E C E N E R GY LT D
A N N UA L R E P O R T 20 16
3 3
(iii) Transactions eliminated on consolidation
Intra-group balances and any unrealised gains and losses or income and expenses arising from intra-group transactions, are eliminated in preparing the consolidated financial statements. Unrealised losses are eliminated in the same way as unrealised gains, but only to the extent that there is no evidence of impairment.
(iv) Loss of control
Upon the loss of control, the consolidated entity derecognises the assets and liabilities of the subsidiary, any non-controlling interests and the other components of equity related to the subsidiary. Any surplus or deficit arising on the loss of control is recognised in profit or loss. If the consolidated entity retains any interest in the previous subsidiary, then such interest is measured at fair value at the date that control is lost. Subsequently it is accounted for as an equity-accounted investee or as an available-for-sale financial asset depending on the level of influence retained.
(b) Foreign currency(i) Functional and presentation currency
Items included in the financial statements of each of the consolidated entity’s subsidiaries are measured using the currency of the primary economic environment in which the subsidiary operates (“the functional currency”). The functional currency of the Company and its Australian subsidiaries is Australian dollars (A$) and the functional currency of the Company’s overseas subsidiaries is United States dollars (US$).
The financial statements are presented in United States dollars. The consolidated entity believes the US dollar is the best measure of performance for Petsec Energy Ltd because oil and gas, the consolidated entity’s dominant sources of revenue, are priced in US dollars and the consolidated entity’s main operations are based in jurisdictions where most of the costs incurred are denominated in US dollars.
Prior to consolidation, the results and financial position of each entity within the group are translated from the functional currency into the group’s presentation currency as follows:
– Assets and liabilities are translated at the closing rate at the date of that balance sheet;
– Income and expenses are translated at average exchange rates (unless this is not a reasonable approximation of the cumulative effect of the rates prevailing on the transaction dates, in which case income and expenses are translated at the dates of the transactions);
– Components of equity are translated at the historical rates; and
– All resulting exchange differences are recognised as a separate component of equity.
(ii) Foreign currency transactions and balances
Foreign currency transactions are translated into the functional currency at the exchange rates prevailing at the date of the transaction. Monetary assets and liabilities denominated in foreign currencies at the balance sheet date are translated to the respective functional currency at the foreign exchange rate
ruling at that date. Foreign exchange gains and losses resulting from the settlement of such transactions and from the translation at year-end exchange rates of monetary assets and liabilities denominated in foreign currencies are recognised in the statement of comprehensive income.
Non-monetary assets and liabilities that are measured in terms of historical cost in a foreign currency are translated using the exchange rate at the date of the transaction.
Foreign exchange gains and losses arising from a monetary item receivable from or payable to a foreign operation, the settlement of which is neither planned nor likely in the foreseeable future, are considered to form part of a net investment in a foreign operation and are recognised directly in equity in the foreign currency translation reserve (FCTR).
(c) Derivative financial instruments and hedging activities
The consolidated entity’s revenues are exposed to changes in commodity prices. From time to time, the consolidated entity enters into derivative financial instruments to manage a portion of its oil and gas sales price risks.
The consolidated entity does not hold derivative financial instruments for speculative purposes.
Derivative financial instruments are initially recognised at fair value on the date a derivative contract is entered into and are subsequently remeasured to their fair value each reporting date. The method of recognising the resulting gain or loss depends on whether the derivative is designated as a hedging instrument, and if so, the nature of the item being hedged. The consolidated entity designates certain derivatives as hedges of highly probable forecast transactions (cash flow hedges).
The consolidated entity documents at the inception of the transaction the relationship between hedging instruments and hedged items, as well as its risk management objective and strategy for undertaking various hedge transactions. The consolidated entity also documents its assessment, both at hedge inception and on an ongoing basis, of whether the derivatives that are used in hedging transactions have been and will continue to be highly effective in offsetting changes in fair values or cash flows of hedged items.
(i) Cash flow hedge
Changes in the fair value of the derivative-hedging instrument designated as a cash flow hedge are recognised directly in equity to the extent that the hedge is effective. To the extent that the hedge is ineffective, changes in fair value are recognised in the statement of comprehensive income.
If the hedging instrument no longer meets the criteria for hedge accounting, expires or is sold, terminated or exercised, then hedge accounting is discontinued prospectively. The cumulative gain or loss previously recognised in equity remains there until the forecast transaction occurs. When the hedged item is a non-financial asset, the amount recognised in equity is transferred to the carrying amount of the asset when it is recognised. In other cases the amount recognised in equity is transferred to the income statement in the same period that the hedged item affects profit or loss.
Notes to the Financial Statements For the year ended 31 December 2016
P E T S E C E N E R GY LT D
A N N UA L R E P O R T 20 16
3 4 P E T S E C E N E R GY LT D
A N N UA L R E P O R T 20 16
3 4
3. Significant accounting policies (continued)
(c) Derivative financial instruments and hedging activities (continued)
(ii) Derivative financial instruments that do not qualify for hedge accounting
Certain derivative financial instruments do not qualify for hedge accounting. Changes in the fair value of any derivative financial instrument that does not qualify for hedge accounting are recognised immediately in the statement of profit and loss.
Other derivative financial instruments are recognised initially at fair value; attributable transaction costs are recognised in profit or loss as incurred. Subsequent to initial recognition, derivatives are measured at fair value and changes therein are recognised immediately in profit or loss.
(d) Exploration, evaluation properties and oil and gas properties
Exploration and evaluation expenditure is accumulated in respect of each separate area of interest. The consolidated entity’s capitalisation policy for its natural gas and crude oil exploration and development activities is to capitalise expenditure of productive exploratory wells, development drilling and productive wells, and expenditure to acquire mineral interests. Exploration expenditure, including personnel costs, certain geological and geophysical expenses including seismic costs where exploration rights have not been obtained for oil and natural gas leases, are charged to expense as incurred. Exploratory drilling expenditures are initially capitalised, but charged to expense if and when the well is determined not to have found reserves in commercial quantities.
Exploration and evaluation expenditures relating to an area of interest are capitalised where exploration rights have been obtained. This expenditure is carried forward only to the extent that they are expected to be recouped through successful development and exploitation, or sale of the area, or where exploration and evaluation activities have not yet reached a stage which permits a reasonable assessment of the existence of economically recoverable reserves, and active and significant exploration operations are continuing. This expenditure is not subject to amortisation. Once management has determined the existence of economically recoverable reserves for an area of interest, expenditure is reclassified from exploration and evaluation to oil and gas properties on the balance sheet. Oil and gas properties are amortised using a units-of-production method, as further discussed in note 3(e).
Exploration and evaluation properties and oil and gas properties are assessed for impairment when facts and circumstances suggest that the carrying amount of the asset may exceed its recoverable amount. In the event that indicators of impairment are present, an impairment loss is recorded based on the higher of an asset’s fair value less costs to sell and value in use (see note 3(g)). When an area of interest is abandoned or the directors decide that it is not commercial, any accumulated costs in respect of that area are written off in the financial period the decision is made.
(e) Amortisation of oil and gas properties
Oil and gas properties in the production phase are amortised on a units-of-production method based on the ratio of actual production to remaining proved and probable reserves (2P). Remaining 2P reserves are measured at the lower of 2P reserves estimated by external independent petroleum engineers and internal estimates.
Amortisation is not charged on costs carried forward in respect of areas of interest in the development phase until commercial production commences.
(f) Property, plant and equipment(i) Recognition and measurement
Items of property, plant and equipment are measured at cost less accumulated depreciation and impairment losses.
Cost includes expenditures that are directly attributable to the acquisition of the asset. The cost of self-constructed assets includes the cost of materials and direct labour, any other costs directly attributable to bringing the asset to a working condition for its intended use, and the costs of dismantling and removing the items and restoring the site on which they are located. Purchased software that is integral to the functionality of the related equipment is capitalised as part of the equipment.
When parts of an item of property, plant and equipment have different useful lives, they are accounted for as separate items (major components) of property, plant and equipment.
Gains and losses on disposal of an item of property, plant and equipment are determined by comparing the proceeds from disposal with the carrying amount of property, plant and equipment and are recognised net within “other income” in profit and loss.
(ii) Leased assets
Leases in terms of which the consolidated entity assumes substantially all the risks and rewards of ownership are classified as finance leases. Lease payments are accounted for as described in accounting policy 3(n).
(iii) Subsequent costs
The cost of replacing part of an item of property, plant and equipment is recognised in the carrying amount of the item if it is probable that the future economic benefits embodied within the part will flow to the consolidated entity and its costs can be measured reliably. The costs of the day-to-day servicing of property, plant and equipment are recognised in the income statement as incurred.
(iv) Depreciation and amortisation
Depreciation of property, plant and equipment is recognised in the statement of comprehensive income on a straight-line basis over the estimated useful lives of each part of an item. Leased assets are depreciated over the shorter of the lease term and their useful lives. Assets are depreciated or amortised from the date of acquisition or, in respect of internally constructed assets, from the time an asset is completed and held ready for use.

P E T S E C E N E R GY LT D
A N N UA L R E P O R T 20 16
35
Depreciation methods, useful lives and residual values are reassessed at the reporting date. When changes are made, adjustments are reflected prospectively in current and future periods only.
The estimated useful lives or the amortisation method used for each class of asset in the current and comparative periods are as follows:
2016 2015
Property, plant and equipment
Furniture and fittings 5 – 8 years 5 – 8 years
Office equipment 3 – 4 years 3 – 4 years
Leasehold improvements 5 – 7 years 5 – 7 years
(g) Impairment – Non-financial assets
The carrying amounts of the consolidated entity’s and the Company’s non-financial assets, other than deferred tax assets (see note 3(q)), are reviewed at each reporting date to determine whether there is any indication of impairment. If any such indication exists then the asset’s recoverable amount is estimated. For intangible assets that have indefinite lives or that are not yet available for use, recoverable amount is estimated at each reporting date.
An impairment loss is recognised if the carrying amount of an asset or its cash-generating unit exceeds its recoverable amount. A cash-generating unit is the smallest identifiable asset group that generates cash flows that largely are independent from other assets or groups. Impairment losses are recognised in the income statement. Impairment losses recognised in respect of cash-generating units are allocated first to reduce the carrying amount of any goodwill allocated to the units and then to reduce the carrying amount of the other assets in the unit (group of units) on a pro rata basis.
The recoverable amount of an asset or cash-generating unit is the greater of its value in use and its fair value less costs to sell. In assessing value in use, the estimated future cash flows are discounted to their present value using a pre-tax discount rate that reflects current market assessment of the time value of money and the risks specific to the asset.
The measurement of recoverable amount for the consolidated entity’s exploration, evaluation and oil and gas properties expenditure requires significant estimation and judgement. Note 12 provides further details of the key assumptions adopted by the consolidated entity in measuring the recoverable amounts of exploration, evaluation and oil and gas properties expenditure.
Impairment losses recognised in prior periods are assessed at each reporting date for any indications that the loss has decreased or no longer exists. An impairment loss is reversed if there has been a change in the estimates used to determine the recoverable amount. An impairment loss is reversed only to the extent that the asset’s carrying amount does not exceed the carrying amount that would have been determined, net of depreciation or amortisation, if no impairment loss had been recognised.
(h) Trade and other receivables
Trade receivables, which generally have 30-60 day terms, are recognised and carried at original invoice amount less an allowance for any uncollectible amounts.
An estimate for doubtful debts is made when collection of the full amount is no longer probable. Bad debts are written off when identified.
(i) Cash and cash equivalents
Cash and cash equivalents in the balance sheet comprise cash at bank and on hand and short-term deposits with an original maturity of three months or less.
For the purposes of the Statement of Cash Flows, cash and cash equivalents consist of cash and cash equivalents as defined above, net of outstanding bank overdrafts.
(j) Interest-bearing loans and borrowings
All loans and borrowings are initially recognised at cost, being the fair value of the consideration received net of debt issue costs associated with the borrowing.
After initial recognition, interest-bearing loans and borrowings are subsequently measured at amortised cost using the effective interest method. Amortised cost is calculated by taking into account any issue costs, and any discount or premium on settlement.
(k) Borrowing costs
Borrowing costs comprise interest payable on borrowings calculated using the effective interest rate method, lease finance charges, amortisation of discounts or premiums relating to borrowings, and the unwinding of discounts on the rehabilitation provisions.
Borrowing costs relating to oil and gas properties under development are capitalised as a cost of development up to the date production commences. The actual borrowing costs are capitalised where funds are borrowed specifically for oil and gas properties under development. Borrowing costs on general funding are capitalised based on the weighted average borrowing rate.
(l) Provisions
A provision is recognised if, as a result of a past event, the consolidated entity has a present legal or constructive obligation that can be estimated reliably, and it is probable that an outflow of economic benefits will be required to settle the obligation. Provisions are determined by discounting the expected future cash flows at a pre-tax rate that reflects current market assessments of the time value of money and the risks specific to the liability.
Where discounting is used, the increase in the provision due to the passage of time is recognised as a finance cost.

Notes to the Financial Statements For the year ended 31 December 2016
P E T S E C E N E R GY LT D
A N N UA L R E P O R T 20 16
3 6 P E T S E C E N E R GY LT D
A N N UA L R E P O R T 20 16
3 6
3. Significant accounting policies (continued)
(l) Provisions (continued)Rehabilitation
The consolidated entity recognises a provision for the legal obligation associated with the retirement of long-lived assets that results from the acquisition, construction, development, and (or) the normal operation of oil and natural gas properties. The initial recognition of a liability for rehabilitation, which is discounted using a risk-free interest rate, increases the carrying amount of the related long-lived asset by the same amount as the liability. In periods subsequent to initial measurement, period-to-period changes in the liability are recognised for the passage of time (unwinding of discount) as a borrowing cost. Additionally, the capitalised asset retirement cost is subsequently allocated to expense on a units-of-production basis over its estimated useful life.
Changes in the estimate of the liability arising from revised timing or estimated cost-to-complete the rehabilitation are recognised with a corresponding adjustment to the relevant long-lived asset.
The rehabilitation provision requires significant estimation and judgement. These estimates include:
– Expected method of remediation;
– Forecast costs-to-complete the future remediation; and
– Anticipated timing of the remediation work.
The consolidated entity monitors the estimates and judgements involved in measuring this provision.
(m) Employee benefits and director benefits
(i) Short-term employee benefits
Liabilities for employee benefits for wages, salaries, annual leave, sick leave and bonuses represent present obligations resulting from employees’ services provided to reporting date which are expected to be wholly settled by the Company within the next financial year. Such liabilities are calculated at undiscounted amounts based on remuneration wage and salary rates that the consolidated entity expects to pay as at reporting date including related on-costs, such as workers’ compensation insurance and payroll tax.
(ii) Long-term employee benefits
The provision for employee benefits for long service leave represents the present value of the estimated future cash outflows to be made resulting from employees’ services provided to reporting date.
The provision is calculated using expected future increases in wage and salary rates including related on-costs and expected settlement dates based on turnover history and is discounted using the rates attaching to national government bonds at reporting date which most closely match the terms of maturity of the related liabilities.
(iii) Defined contribution pension plans
The Company and other controlled entities contribute to several defined contribution pension plans. Obligations for contributions to defined contribution pension plans are recognised as an expense in the statement of comprehensive income when they are due.
(iv) Share-based compensation transactions
Share-based compensation benefits are provided to employees of the consolidated entity, including directors, via the Company’s Employee Option Plan and Employee Share Plan.
The grant date fair value of options granted to employees is recognised as an employee expense, with a corresponding increase in equity, over the period in which the employees become unconditionally entitled to the options.
(n) Leases
Leases in terms of which the consolidated entity assumes substantially all the risks and rewards of ownership are classified as finance leases. Upon initial recognition the leased asset is measured at an amount equal to the lower of its fair value and the present value of the minimum lease payments. Subsequent to initial recognition, the asset is accounted for in accordance with the accounting policy applicable to that asset.
Lease payments are apportioned between the finance charges and reduction of the lease liability so as to achieve a constant rate of interest on the remaining balance of the liability. Finance charges are charged directly against income.
Leases where the lessor retains substantially all the risks and benefits of ownership of the asset are classified as operating leases. Operating lease payments are recognised as an expense in the statement of profit and loss on a straight-line basis over the lease term. Lease incentives received are recognised as an integral part of the total lease expense, over the term of the lease.
(o) Revenue and other income recognition
Revenue is recognised to the extent that it is probable that the economic benefits will flow to the consolidated entity and the revenue can be reliably measured. The following specific recognition criteria must also be met before revenue is recognised:
Sale of oil and gas
Revenues from the sale of oil and gas is recognised when the product is in the form in which it is to be delivered and an actual physical quantity has been provided or allocated to a purchaser pursuant to a contract. Revenue from oil and gas sales is measured at the fair value of the consideration receivable.
Revenue from oil and gas royalties is recognised on an accrual basis in accordance with the terms of underlying royalty agreements. Revenue from oil and gas royalties is measured at the fair value of the consideration receivable.

P E T S E C E N E R GY LT D
A N N UA L R E P O R T 20 16
37
Sale of non-current assets
Gains or losses on sale of non-current assets are recognised as other income at the date control of the asset passes to the buyer, usually when an unconditional contract of sale is signed.
Interest income
Interest income is recognised as the interest accrues (using the effective interest method, which is the rate that discounts estimated future cash receipts through the expected life of the financial instrument).
(p) Earnings per share
The consolidated entity presents basic and diluted earnings per share (EPS) data for its ordinary shares. Basic EPS is calculated by dividing the profit or loss attributable to ordinary shareholders of the Company by the weighted average number of ordinary shares outstanding during the period. Diluted EPS is determined by adjusting the profit or loss attributable to ordinary shareholders and the weighted average number of ordinary shares outstanding for the effects of all dilutive potential ordinary shares, which comprise share options granted to employees.
(q) Income tax
Income tax expense comprises current and deferred tax. Income tax expense is recognised in the statement of comprehensive income except to the extent that it relates to items recognised directly in equity, in which case it is recognised in equity.
Current tax is the expected tax payable on the taxable income for the year, using tax rates enacted or substantively enacted at the reporting date, and any adjustment to tax payable in respect of previous years.
Deferred tax is recognised using the balance sheet method, providing for temporary differences between the carrying amounts of assets and liabilities for financial reporting purposes and the amounts used for taxation purposes. Deferred tax is not recognised for the following temporary differences: the initial recognition of assets or liabilities that affect neither accounting nor taxable profit nor differences relating to investments in subsidiaries to the extent that they will probably not reverse in the foreseeable future. Deferred tax is measured at the tax rates that are expected to be applied to the temporary differences when they reverse, based on the laws that have been enacted or substantively enacted by the reporting date.
A deferred tax asset is recognised to the extent that it is probable that future taxable profits will be available against which the temporary difference or tax losses can be utilised. Deferred tax assets are reviewed at each reporting date and are reduced to the extent that it is no longer probable that the related tax benefit will be realised.
(r) Segment reporting
An operating segment is a distinguishable component of the consolidated entity whose information is reviewed regularly by the CEO, the consolidated entity’s chief decision making officer, and that is engaged in providing related products or services which are subject to risk and rewards that are different to other segments.
(s) Changes in accounting policies
The consolidated entity has consistently applied the accounting policies set out in Note 3(a) through (r) to all periods presented in these consolidated financial statements.
(t) New standards and interpretations not yet adopted
A number of new standards, amendments to standards and interpretations are effective for annual periods beginning after 1 January 2016, and have not been applied in preparing these consolidated financial statements. Those which may be relevant to the consolidated entity are set out below. The consolidated entity does not plan to adopt these standards early.
(i) AASB 9 Financial Instruments
AASB 9, published in July 2014, replaces the existing guidance in AASB 139 Financial Instruments: Recognition and Measurement. AASB 9 includes revised guidance on the classification and measurement of financial instruments, including a new expected credit loss model for calculating impairment on financial assets, and the new general hedge accounting requirements. It also carries forward the guidance on recognition and derecognition of financial instruments from AASB 139.
AASB 9 is effective for annual reporting periods beginning on or after 1 January 2018, with early adoption permitted.
The consolidated entity does not expect a material impact on its consolidated financial statements resulting from the application of AASB 9.
(ii) AASB 15 Revenue from Contracts with Customers
AASB 15 establishes a comprehensive framework for determining whether, how much and when revenue is recognised. It replaces existing revenue recognition guidance, including AASB 118 Revenue and AASB 111 Construction Contracts.
AASB 15 is effective for annual reporting periods beginning on or after 1 January 2018, with early adoption permitted.
The consolidated entity does not expect a material impact on its consolidated financial statements resulting from the application of AASB 15.
(iii) AASB 16 Leases
AASB 16 Leases amends the accounting for leases. Lessees will be required to bring all leases on Balance Sheet as the distinction between operating and financing leases has been eliminated. Lessor accounting remains largely unchanged.
AASB 16 is effective for annual reporting periods beginning on or after 1 January 2019, with early adoption permitted if adopted in conjunction with AASB 15 for the same accounting period.
The consolidated entity will continue to assess the potential impact on its consolidated financial statements resulting from the application of AASB 16.

Notes to the Financial Statements For the year ended 31 December 2016
P E T S E C E N E R GY LT D
A N N UA L R E P O R T 20 16
3 8 P E T S E C E N E R GY LT D
A N N UA L R E P O R T 20 16
3 8
4. Determination of fair values
A number of the consolidated entity’s accounting policies and disclosures require the determination of fair value, for both financial and non-financial assets and liabilities. Fair values have been determined for measurement and/or disclosure purposes based on the following methods. The Company has applied fair value methodologies that approximate the price that would be received to sell an asset or paid to transfer a liability in an orderly transaction between market participants at the measurement date.
Where applicable, further information about the assumptions made in determining fair values is disclosed in the notes specific to that asset or liability.
Derivative Instruments
The fair values of derivative instruments are initially recognised at fair value on the date at which the derivative contracts are entered into and subsequently remeasured to fair value. On subsequent revaluation the derivatives are carried as assets when their fair value is positive and liabilities when their fair value is negative.
When the fair values of financial assets and financial liabilities recorded in the statement of financial position cannot be measured based on quoted prices in active markets, their fair value is measured using valuation techniques including discounted cash flow models. The inputs to these models are taken from observable markets where possible, but where this is not feasible, a degree of judgement is required in establishing fair values. Judgements include considerations of inputs such as liquidity risk, credit risk and volatility. Changes in assumptions relating to these factors could affect the reported fair value of financial instruments.
Equity securities
The fair value of equity securities (level 3 category instruments) is determined using an option pricing model – the Black-Scholes-Merton formula – in arriving at an expected present value for options granted by the consolidated entity at period end. Measurement inputs include observable inputs, such as the share price on the measurement date, the exercise price of the instrument, share price target and the risk-free interest rate (based on government bonds), as well as unobservable inputs, such as expected volatility, expected term of the instruments, and expected dividends which represent management’s best estimates at period end.
5. Other income and expenses2016
US$’0002015
US$’000
Other income and expensesProduction and project overhead income 70 222
Net foreign exchange gains 133 203
Net gain on disposal of assets – 339
Net loss on disposal of property, plant and equipment (7) –
196 764
6. Employee expenses2016
US$’0002015
US$’000
Wages and salaries 1,486 1,287
Service agreements for executives 1,312 750
Bonuses 23 84
Contract labour 1,055 126
Superannuation & 401(k) plans 84 79
Share-based payment compensation 23 11
Other employee-related expenses 151 91
4,134 2,428

P E T S E C E N E R GY LT D
A N N UA L R E P O R T 20 16
39
7. Auditor’s remuneration
2016US$
2015US$
Audit services:Auditors of the CompanyKPMG Australia
Audit and review of financial reports 90,375 85,000
KPMG UAE
Audit of financial reports 12,000 –
102,375 85,000
8. Finance income and expense2016
US$’0002015
US$’000
Interest income – Other parties 23 40
Financial income 23 40
Interest expense (674) –
Unwinding of discount (104) (222)
Financial expense (778) (222)
Net financial income (755) (182)
9. Income tax expense2016
US$’0002015
US$’000
Recognised in the statement of comprehensive incomeDeferred tax expenseOrigination and reversal of temporary differences – –
Total income tax benefit/(expense) in the statement of comprehensive income – –
Numerical reconciliation between tax expense and pre-tax net profit/(loss)Profit/(loss) before tax (13,024) (10,605)
Income tax expense/(benefit) using the Australian corporation tax rate of 30% (2015: 30%) (3,907) (3,182)
Increase/(decrease) in income tax expense due to:
Non-deductible expenses 2,407 700
Non-Australian income taxes assessed at different rate (254) (416)
Deferred tax movements not brought to account in current year 1,754 2,898
Under/(over) provided in prior years – –
Income tax expense/(benefit) on pre-tax net profit/(loss) – –
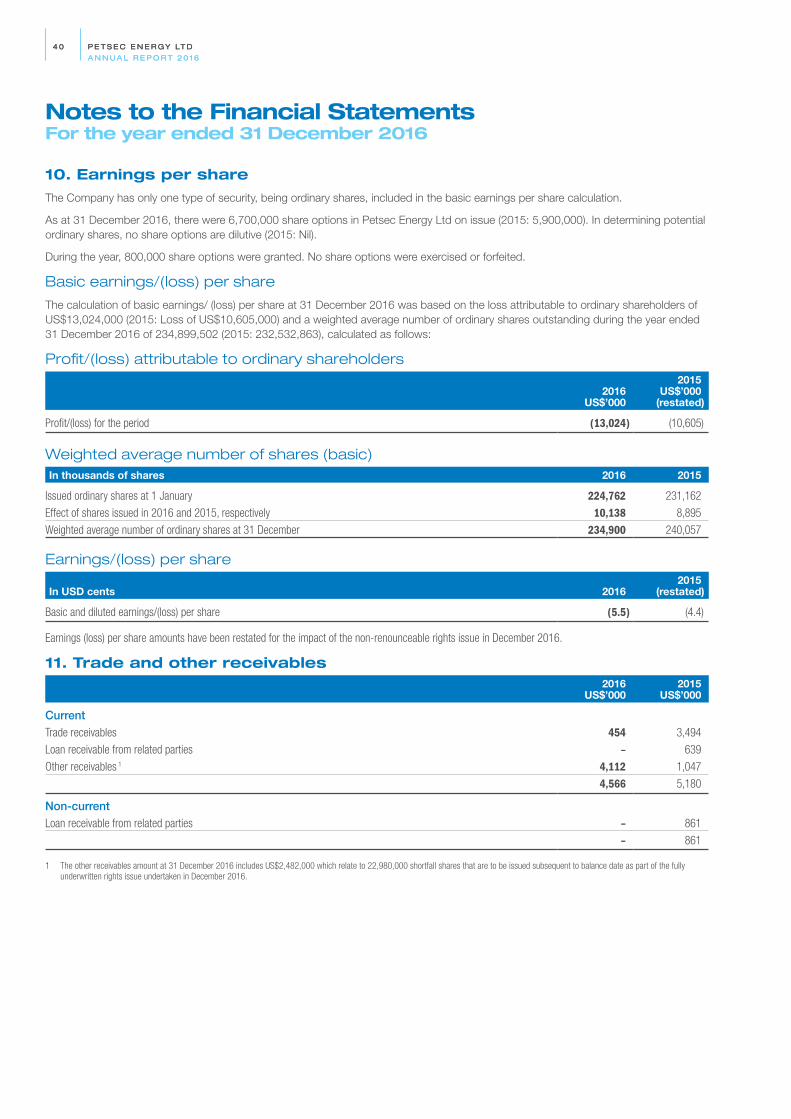
Notes to the Financial Statements For the year ended 31 December 2016
P E T S E C E N E R GY LT D
A N N UA L R E P O R T 20 16
4 0 P E T S E C E N E R GY LT D
A N N UA L R E P O R T 20 16
4 0
10. Earnings per share
The Company has only one type of security, being ordinary shares, included in the basic earnings per share calculation.
As at 31 December 2016, there were 6,700,000 share options in Petsec Energy Ltd on issue (2015: 5,900,000). In determining potential ordinary shares, no share options are dilutive (2015: Nil).
During the year, 800,000 share options were granted. No share options were exercised or forfeited.
Basic earnings/(loss) per share
The calculation of basic earnings/ (loss) per share at 31 December 2016 was based on the loss attributable to ordinary shareholders of US$13,024,000 (2015: Loss of US$10,605,000) and a weighted average number of ordinary shares outstanding during the year ended 31 December 2016 of 234,899,502 (2015: 232,532,863), calculated as follows:
Profit/(loss) attributable to ordinary shareholders
2016US$’000
2015US$’000
(restated)
Profit/(loss) for the period (13,024) (10,605)
Weighted average number of shares (basic)In thousands of shares 2016 2015
Issued ordinary shares at 1 January 224,762 231,162
Effect of shares issued in 2016 and 2015, respectively 10,138 8,895
Weighted average number of ordinary shares at 31 December 234,900 240,057
Earnings/(loss) per share
In USD cents 20162015
(restated)
Basic and diluted earnings/(loss) per share (5.5) (4.4)
Earnings (loss) per share amounts have been restated for the impact of the non-renounceable rights issue in December 2016.
11. Trade and other receivables
2016
US$’0002015
US$’000
CurrentTrade receivables 454 3,494
Loan receivable from related parties – 639
Other receivables 1 4,112 1,047
4,566 5,180
Non-currentLoan receivable from related parties – 861
– 861
1 The other receivables amount at 31 December 2016 includes US$2,482,000 which relate to 22,980,000 shortfall shares that are to be issued subsequent to balance date as part of the fully underwritten rights issue undertaken in December 2016.
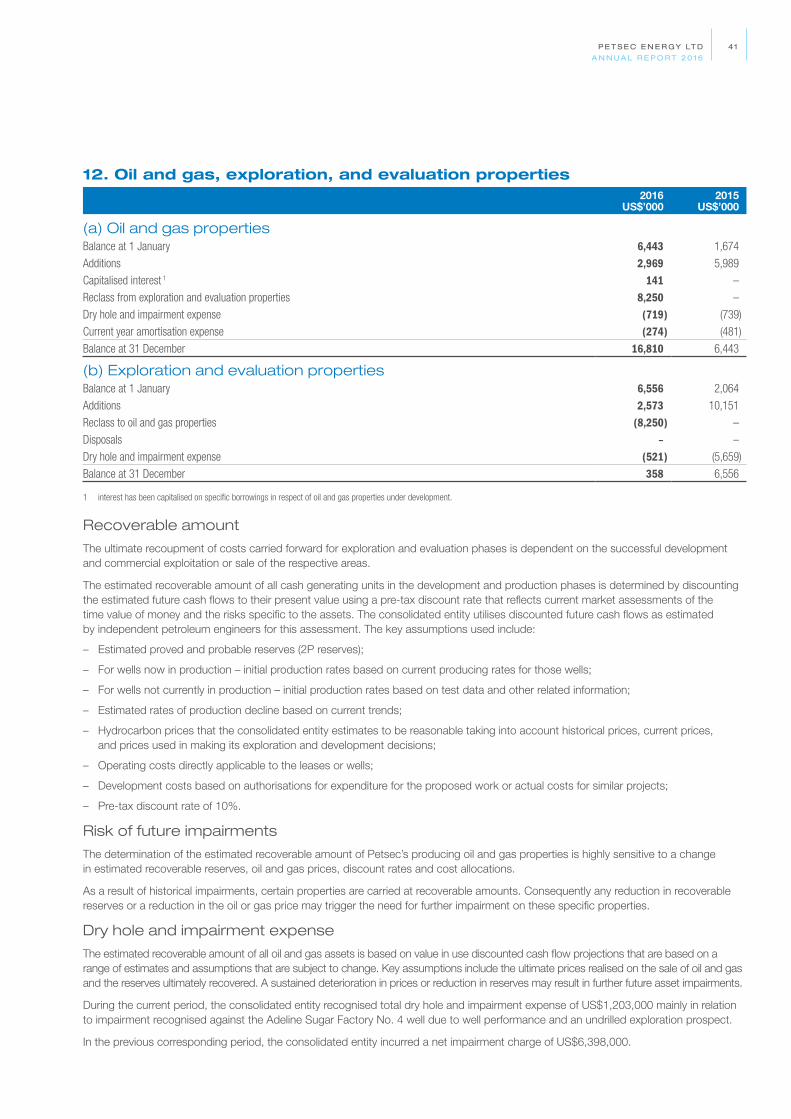
P E T S E C E N E R GY LT D
A N N UA L R E P O R T 20 16
41
12. Oil and gas, exploration, and evaluation properties2016
US$’0002015
US$’000
(a) Oil and gas propertiesBalance at 1 January 6,443 1,674
Additions 2,969 5,989
Capitalised interest 1 141 –
Reclass from exploration and evaluation properties 8,250 –
Dry hole and impairment expense (719) (739)
Current year amortisation expense (274) (481)
Balance at 31 December 16,810 6,443
(b) Exploration and evaluation propertiesBalance at 1 January 6,556 2,064
Additions 2,573 10,151
Reclass to oil and gas properties (8,250) –
Disposals – –
Dry hole and impairment expense (521) (5,659)
Balance at 31 December 358 6,556
1 interest has been capitalised on specific borrowings in respect of oil and gas properties under development.
Recoverable amount
The ultimate recoupment of costs carried forward for exploration and evaluation phases is dependent on the successful development and commercial exploitation or sale of the respective areas.
The estimated recoverable amount of all cash generating units in the development and production phases is determined by discounting the estimated future cash flows to their present value using a pre-tax discount rate that reflects current market assessments of the time value of money and the risks specific to the assets. The consolidated entity utilises discounted future cash flows as estimated by independent petroleum engineers for this assessment. The key assumptions used include:
– Estimated proved and probable reserves (2P reserves);
– For wells now in production – initial production rates based on current producing rates for those wells;
– For wells not currently in production – initial production rates based on test data and other related information;
– Estimated rates of production decline based on current trends;
– Hydrocarbon prices that the consolidated entity estimates to be reasonable taking into account historical prices, current prices, and prices used in making its exploration and development decisions;
– Operating costs directly applicable to the leases or wells;
– Development costs based on authorisations for expenditure for the proposed work or actual costs for similar projects;
– Pre-tax discount rate of 10%.
Risk of future impairments
The determination of the estimated recoverable amount of Petsec’s producing oil and gas properties is highly sensitive to a change in estimated recoverable reserves, oil and gas prices, discount rates and cost allocations.
As a result of historical impairments, certain properties are carried at recoverable amounts. Consequently any reduction in recoverable reserves or a reduction in the oil or gas price may trigger the need for further impairment on these specific properties.
Dry hole and impairment expense
The estimated recoverable amount of all oil and gas assets is based on value in use discounted cash flow projections that are based on a range of estimates and assumptions that are subject to change. Key assumptions include the ultimate prices realised on the sale of oil and gas and the reserves ultimately recovered. A sustained deterioration in prices or reduction in reserves may result in further future asset impairments.
During the current period, the consolidated entity recognised total dry hole and impairment expense of US$1,203,000 mainly in relation to impairment recognised against the Adeline Sugar Factory No. 4 well due to well performance and an undrilled exploration prospect.
In the previous corresponding period, the consolidated entity incurred a net impairment charge of US$6,398,000.
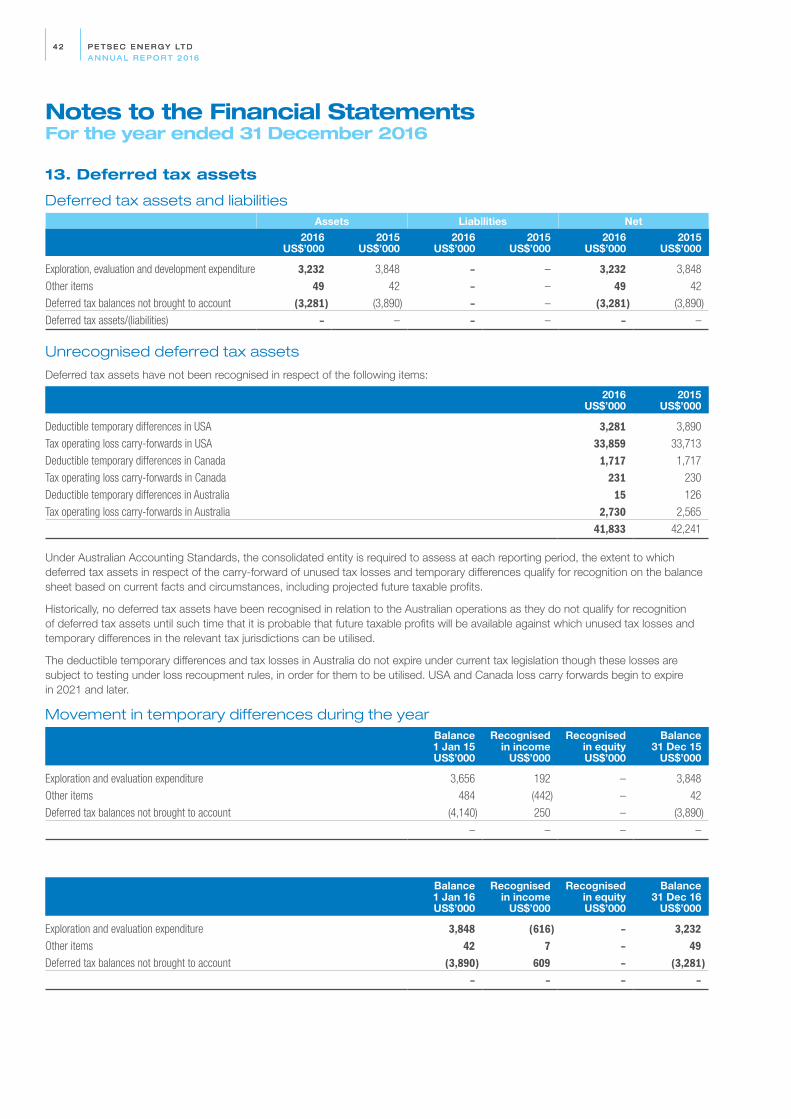
Notes to the Financial Statements For the year ended 31 December 2016
P E T S E C E N E R GY LT D
A N N UA L R E P O R T 20 16
42 P E T S E C E N E R GY LT D
A N N UA L R E P O R T 20 16
42
13. Deferred tax assets
Deferred tax assets and liabilitiesAssets Liabilities Net
2016US$’000
2015US$’000
2016US$’000
2015US$’000
2016US$’000
2015US$’000
Exploration, evaluation and development expenditure 3,232 3,848 – – 3,232 3,848
Other items 49 42 – – 49 42
Deferred tax balances not brought to account (3,281) (3,890) – – (3,281) (3,890)
Deferred tax assets/(liabilities) – – – – – –
Unrecognised deferred tax assets
Deferred tax assets have not been recognised in respect of the following items:
2016US$’000
2015US$’000
Deductible temporary differences in USA 3,281 3,890
Tax operating loss carry-forwards in USA 33,859 33,713
Deductible temporary differences in Canada 1,717 1,717
Tax operating loss carry-forwards in Canada 231 230
Deductible temporary differences in Australia 15 126
Tax operating loss carry-forwards in Australia 2,730 2,565
41,833 42,241
Under Australian Accounting Standards, the consolidated entity is required to assess at each reporting period, the extent to which deferred tax assets in respect of the carry-forward of unused tax losses and temporary differences qualify for recognition on the balance sheet based on current facts and circumstances, including projected future taxable profits.
Historically, no deferred tax assets have been recognised in relation to the Australian operations as they do not qualify for recognition of deferred tax assets until such time that it is probable that future taxable profits will be available against which unused tax losses and temporary differences in the relevant tax jurisdictions can be utilised.
The deductible temporary differences and tax losses in Australia do not expire under current tax legislation though these losses are subject to testing under loss recoupment rules, in order for them to be utilised. USA and Canada loss carry forwards begin to expire in 2021 and later.
Movement in temporary differences during the yearBalance1 Jan 15US$’000
Recognisedin income
US$’000
Recognisedin equityUS$’000
Balance31 Dec 15
US$’000
Exploration and evaluation expenditure 3,656 192 – 3,848
Other items 484 (442) – 42
Deferred tax balances not brought to account (4,140) 250 – (3,890)
– – – –
Balance1 Jan 16US$’000
Recognisedin income
US$’000
Recognisedin equityUS$’000
Balance31 Dec 16
US$’000
Exploration and evaluation expenditure 3,848 (616) – 3,232Other items 42 7 – 49Deferred tax balances not brought to account (3,890) 609 – (3,281)
– – – –

P E T S E C E N E R GY LT D
A N N UA L R E P O R T 20 16
4 3
14. Trade and other payables
Current2016
US$’0002015
US$’000
Trade and other payables, stated at cost
Trade payables 2,892 1,928
Exploration and evaluation accruals 200 2,202
Operational and administration accruals 9,054 1,423
Related party payables 83 149
12,229 5,702
15. Interest bearing loans and borrowings
Non-current2016
US$’0002015
US$’000
Secured borrowings – convertible notes 3,299 –
3,299 –
Secured borrowings – convertible notes
Secured borrowings represent the outstanding balance at 31 December 2016 under a convertible note facility with Republic Investment Management and associates in Singapore, managed through the registrar Sing Rim Pte Ltd of Singapore. The consolidated entity entered into a US$15 million facility in August 2016.
The key terms and conditions of the convertible note facility as set out in the secured convertible notes Deed Poll dated 23 August 2016 (subsequently amended by a Deed of Variation dated 13 September 2016 and Letter of Variation dated 28 December 2016) are as follows:
(a) Facility amount – US$15 million.
(b) Facility drawdown – available in three tranches of US$5 million each.
(c) Facility term – the convertible note facility had an initial redemption date of 31 December 2017. The Letter of Variation dated 28 December 2016 resulted in the redemption date being amended from 31 December 2017 to 5 July 2018.
(d) Interest – interest accrues daily at 10% per annum for the period through 31 December 2017, compounded monthly on the drawn amount, with interest capitalising into the principal amount of the convertible notes. The Letter of Variation dated 28 December 2016 resulted in the interest rate increasing from 10% to 12.5% per annum for the period of the extension of the redemption date from 1 January 2018 to 5 July 2018.
(e) Security – the convertible notes constitute unsubordinated and secured obligations of the Company. The Company and the registrar entered into a general security deed on 23 August 2016 under which the Company granted the registrar a general security interest over all of the Company’s assets as security for the Company’s obligations under the convertible notes. In addition, the Company granted the registrar mortgages over certain assets of its U.S. subsidiaries.
(f) Conditions precedent to issue – the convertible notes are subject to a number of conditions precedent to issue, as follows:
(i) Tranche 1. US$5 million may be issued no later than 31 December 2016. There are no outstanding conditions precedent for this Tranche. As at 31 December 2016, To date, the consolidated entity has issued convertible notes for a face value of US$4.5 million under this Tranche;
(ii) Tranche 2. US$5 million may be issued no later than 31 March 2017, as follows:
(A) US$2 million may be issued upon clear indication that oil has commenced to flow freely within the Republic of Yemen, shipped and sold, which will be prima facie evidenced by the Yemen companies, Safer and Jana Hunt having produced and transported through the Marib pipeline and shipped and sold no less than 500,000 barrels of oil per month over a two month period;
(B) US$2 million may be issued in parcels of US$500,000 for each 50,000 barrels of oil net to the Company which has been produced, transported, and stored at the shipping terminal, ready for sale; and
(C) US$1 million may be issued in US$500,000 parcels for each 50,000 barrels of oil net shipped and sold.
(iii) Tranche 3. US$5 million may be issued no later than 30 June 2017, as follows:
(A) US$500,000 may be issued for each 50,000 barrels net to the Company, produced, transported, shipped and sold, in excess of the 100,000 barrels of crude per month anticipated in Tranche 2.

Notes to the Financial Statements For the year ended 31 December 2016
P E T S E C E N E R GY LT D
A N N UA L R E P O R T 20 16
4 4 P E T S E C E N E R GY LT D
A N N UA L R E P O R T 20 16
4 4
15. Interest bearing loans and borrowings (continued)
Secured borrowings – convertible notes (continued)
(g) Conversion to Petsec Energy Ltd shares – the noteholder will be entitled to convert up to 50% of the outstanding amount of the convertible notes into shares, by delivering a conversion notice at any time prior to the maturity date. The maximum number of shares issued on conversion is restricted to 46 million shares provided that this number is less than 19.9% of the issued capital or potential issued capital of the Company.
(h) Conversion price – each convertible note will convert into shares at conversion prices ranging from A$0.15 to A$0.30 per Share (as amended on 28 December 2016), as follows:
(A) Tranche 1: Interest – A$0.15/share;
(B) Tranche 1: Principal (up to 50% may be converted) – A$0.15/share;
(C) Tranche 2: Principal and interest (up to 50% may be converted) – A$0.25/share; and
(D) Tranche 3: Principal and interest (up to 50% may be converted) – A$0.30/share.
In accordance with the terms of the Deed Poll, the Company issued 5 million shares at A$0.20/share on 17 October 2016, being the facility fee shares, to the Registrar.
As at 31 December 2016, the Company had drawn down US$4.5 million on the facility.
The Company has a commitment to issue 5 million shares at A$0.15/share AU$750,000 (US$540,150) to the Registrar of the secured convertible note facility under the Letter of Variation dated 28 December 2016 as a fee for extending the maturity date of the facility from 31 December 2017 to 5 July 2018.
The Deed of Variation dated 13 September 2016 amends terms to ensure compliance of the facility with ASX listing rules.
16. Fair value of financial derivative instruments
Non-current2016
US$’0002015
US$’000
Fair value of financial derivatives 764 –
764 –
The transaction costs of US$445,000 incurred are netted against the US$4,508,000 convertible note facility drawn down. The net US$4,063,000 is represented by US$3,299,000 of secured borrowings and US$764,000 of financial derivative.
The fair value of financial derivative of US$764,000 represents the embedded derivative component within the secured convertible note (refer Note 15 above).
Embedded derivatives are separated from the host contract and accounted for separately if certain criteria are met.
Derivatives are initially valued at fair value; subsequent to initial recognition, derivatives are measured at fair value, and changes therein are recognised in profit and loss.
The fair value of the financial derivative was determined at initial recognition and subsequent reporting dates using a Monte Carlo model.
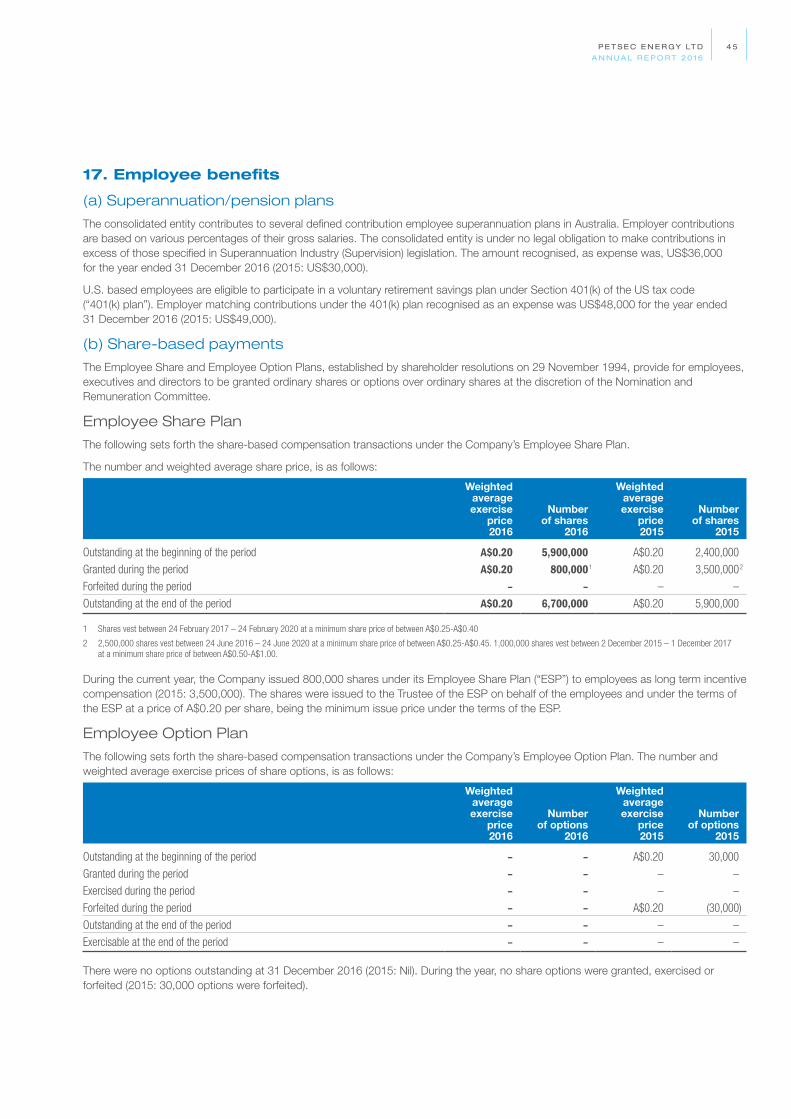
P E T S E C E N E R GY LT D
A N N UA L R E P O R T 20 16
4 5
17. Employee benefits
(a) Superannuation/pension plans
The consolidated entity contributes to several defined contribution employee superannuation plans in Australia. Employer contributions are based on various percentages of their gross salaries. The consolidated entity is under no legal obligation to make contributions in excess of those specified in Superannuation Industry (Supervision) legislation. The amount recognised, as expense was, US$36,000 for the year ended 31 December 2016 (2015: US$30,000).
U.S. based employees are eligible to participate in a voluntary retirement savings plan under Section 401(k) of the US tax code (“401(k) plan”). Employer matching contributions under the 401(k) plan recognised as an expense was US$48,000 for the year ended 31 December 2016 (2015: US$49,000).
(b) Share-based payments
The Employee Share and Employee Option Plans, established by shareholder resolutions on 29 November 1994, provide for employees, executives and directors to be granted ordinary shares or options over ordinary shares at the discretion of the Nomination and Remuneration Committee.
Employee Share Plan
The following sets forth the share-based compensation transactions under the Company’s Employee Share Plan.
The number and weighted average share price, is as follows:
Weighted average exercise
price2016
Numberof shares
2016
Weighted average exercise
price2015
Numberof shares
2015
Outstanding at the beginning of the period A$0.20 5,900,000 A$0.20 2,400,000
Granted during the period A$0.20 800,000 1 A$0.20 3,500,000 2
Forfeited during the period – – – –
Outstanding at the end of the period A$0.20 6,700,000 A$0.20 5,900,000
1 Shares vest between 24 February 2017 – 24 February 2020 at a minimum share price of between A$0.25-A$0.40
2 2,500,000 shares vest between 24 June 2016 – 24 June 2020 at a minimum share price of between A$0.25-A$0.45. 1,000,000 shares vest between 2 December 2015 – 1 December 2017 at a minimum share price of between A$0.50-A$1.00.
During the current year, the Company issued 800,000 shares under its Employee Share Plan (“ESP”) to employees as long term incentive compensation (2015: 3,500,000). The shares were issued to the Trustee of the ESP on behalf of the employees and under the terms of the ESP at a price of A$0.20 per share, being the minimum issue price under the terms of the ESP.
Employee Option Plan
The following sets forth the share-based compensation transactions under the Company’s Employee Option Plan. The number and weighted average exercise prices of share options, is as follows:
Weighted average exercise
price2016
Numberof options
2016
Weighted average exercise
price2015
Numberof options
2015
Outstanding at the beginning of the period – – A$0.20 30,000
Granted during the period – – – –
Exercised during the period – – – –
Forfeited during the period – – A$0.20 (30,000)
Outstanding at the end of the period – – – –
Exercisable at the end of the period – – – –
There were no options outstanding at 31 December 2016 (2015: Nil). During the year, no share options were granted, exercised or forfeited (2015: 30,000 options were forfeited).

Notes to the Financial Statements For the year ended 31 December 2016
P E T S E C E N E R GY LT D
A N N UA L R E P O R T 20 16
4 6 P E T S E C E N E R GY LT D
A N N UA L R E P O R T 20 16
4 6
17. Employee benefits (continued)
Share and option grants to key management personnel
Grants of 800,000 shares were made to key management personnel during the year ended 31 December 2016 (2015: 2,500,000).
The following table summarises the fair value assumptions of shares granted to key management personnel during the years ended 31 December 2016 and 2015.
Key management
personnel2016
Key management
personnel2015
Weighted average fair value at measurement date A$0.005 A$0.01
Weighted average share price A$0.09 A$0.10
Weighted average exercise price A$0.20 A$0.20
Expected volatility (expressed as weighted average used in the modelling under Black-Scholes model) 58.1% 67.02%
Expected option life (expressed as weighted average used in the modelling under Black-Scholes model) 4.5 years 5.5 years
Expected dividends – –
Risk-free interest rate (based on national government bonds) 1.75% 2.06%
The expected volatility is based on historic volatility (calculated based on the weighted average remaining life of the shares and options), adjusted for any expected changes to future volatility due to publicly available information.
18. Rehabilitation provisions2016
US$’0002015
US$’000
CurrentBalance at 1 January 2,573 618
Provisions made during the year – –
Provisions reclassed from non-current classification – 2,307
Provisions used during the year (2,125) (460)
Unwind of discount 98 108
Balance at 31 December 546 2,573
Non-current Balance at 1 January 61 2,219
Provisions made during the year – 38
Provisions reclassed to current classification – (2,307)
Unwind of discount 7 111
Balance at 31 December 68 61
614 2,634
19. Capital and reserves
Share capital
In thousands of sharesOrdinary Shares
2016 2015
On issue at 1 January 234,662 231,162
Shares issued 56,720 3,500
Shares cancelled (4,000) –
On issue at 31 December – fully paid 1 287,382 234,662
1 Share on issue amount at 31 December 2016 includes 6,700,000 share options held by the trustee under the Employee Share Plan (2015: 5,900,000).
The Company does not have authorised capital or par value in respect of its issued shares.
The holders of ordinary shares are entitled to receive dividends as declared from time to time and are entitled to one vote per share at meetings of the Company.
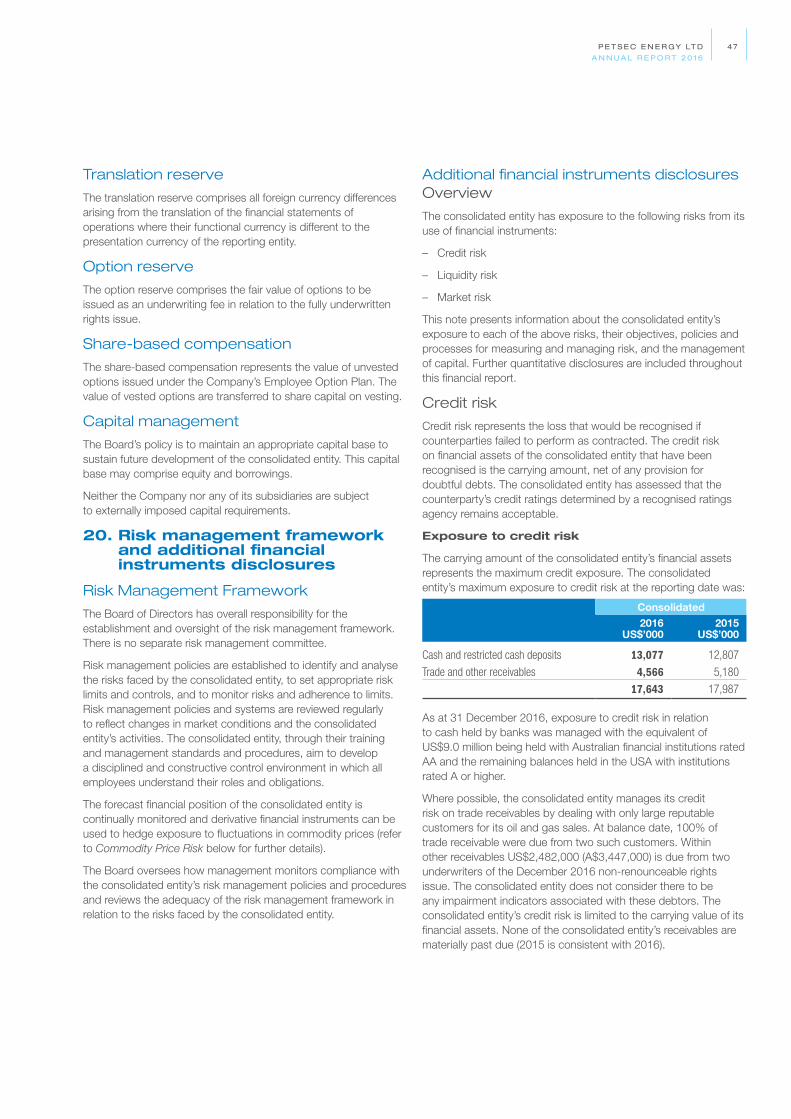
P E T S E C E N E R GY LT D
A N N UA L R E P O R T 20 16
47
Translation reserve
The translation reserve comprises all foreign currency differences arising from the translation of the financial statements of operations where their functional currency is different to the presentation currency of the reporting entity.
Option reserve
The option reserve comprises the fair value of options to be issued as an underwriting fee in relation to the fully underwritten rights issue.
Share-based compensation
The share-based compensation represents the value of unvested options issued under the Company’s Employee Option Plan. The value of vested options are transferred to share capital on vesting.
Capital management
The Board’s policy is to maintain an appropriate capital base to sustain future development of the consolidated entity. This capital base may comprise equity and borrowings.
Neither the Company nor any of its subsidiaries are subject to externally imposed capital requirements.
20. Risk management framework and additional financial instruments disclosures
Risk Management Framework
The Board of Directors has overall responsibility for the establishment and oversight of the risk management framework. There is no separate risk management committee.
Risk management policies are established to identify and analyse the risks faced by the consolidated entity, to set appropriate risk limits and controls, and to monitor risks and adherence to limits. Risk management policies and systems are reviewed regularly to reflect changes in market conditions and the consolidated entity’s activities. The consolidated entity, through their training and management standards and procedures, aim to develop a disciplined and constructive control environment in which all employees understand their roles and obligations.
The forecast financial position of the consolidated entity is continually monitored and derivative financial instruments can be used to hedge exposure to fluctuations in commodity prices (refer to Commodity Price Risk below for further details).
The Board oversees how management monitors compliance with the consolidated entity’s risk management policies and procedures and reviews the adequacy of the risk management framework in relation to the risks faced by the consolidated entity.
Additional financial instruments disclosuresOverview
The consolidated entity has exposure to the following risks from its use of financial instruments:
– Credit risk
– Liquidity risk
– Market risk
This note presents information about the consolidated entity’s exposure to each of the above risks, their objectives, policies and processes for measuring and managing risk, and the management of capital. Further quantitative disclosures are included throughout this financial report.
Credit risk
Credit risk represents the loss that would be recognised if counterparties failed to perform as contracted. The credit risk on financial assets of the consolidated entity that have been recognised is the carrying amount, net of any provision for doubtful debts. The consolidated entity has assessed that the counterparty’s credit ratings determined by a recognised ratings agency remains acceptable.
Exposure to credit risk
The carrying amount of the consolidated entity’s financial assets represents the maximum credit exposure. The consolidated entity’s maximum exposure to credit risk at the reporting date was:
Consolidated2016
US$’0002015
US$’000
Cash and restricted cash deposits 13,077 12,807
Trade and other receivables 4,566 5,180
17,643 17,987
As at 31 December 2016, exposure to credit risk in relation to cash held by banks was managed with the equivalent of US$9.0 million being held with Australian financial institutions rated AA and the remaining balances held in the USA with institutions rated A or higher.
Where possible, the consolidated entity manages its credit risk on trade receivables by dealing with only large reputable customers for its oil and gas sales. At balance date, 100% of trade receivable were due from two such customers. Within other receivables US$2,482,000 (A$3,447,000) is due from two underwriters of the December 2016 non-renounceable rights issue. The consolidated entity does not consider there to be any impairment indicators associated with these debtors. The consolidated entity’s credit risk is limited to the carrying value of its financial assets. None of the consolidated entity’s receivables are materially past due (2015 is consistent with 2016).
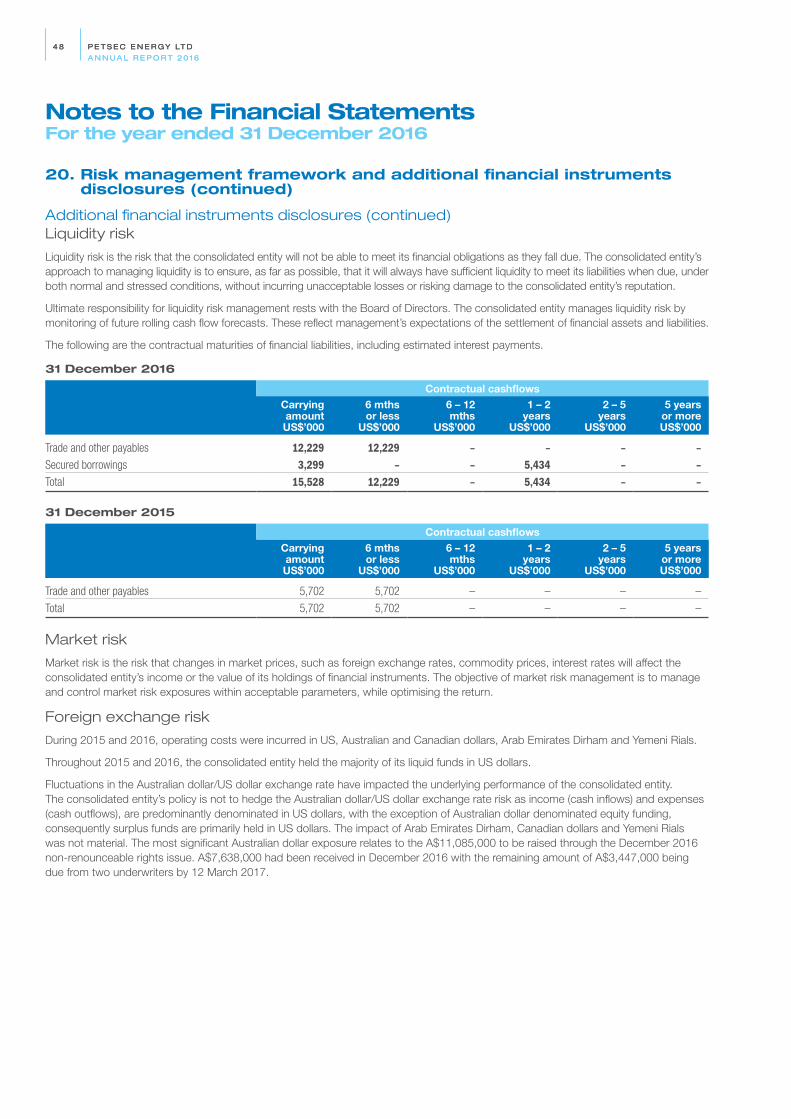
Notes to the Financial Statements For the year ended 31 December 2016
P E T S E C E N E R GY LT D
A N N UA L R E P O R T 20 16
4 8 P E T S E C E N E R GY LT D
A N N UA L R E P O R T 20 16
4 8
20. Risk management framework and additional financial instruments disclosures (continued)
Additional financial instruments disclosures (continued)Liquidity risk
Liquidity risk is the risk that the consolidated entity will not be able to meet its financial obligations as they fall due. The consolidated entity’s approach to managing liquidity is to ensure, as far as possible, that it will always have sufficient liquidity to meet its liabilities when due, under both normal and stressed conditions, without incurring unacceptable losses or risking damage to the consolidated entity’s reputation.
Ultimate responsibility for liquidity risk management rests with the Board of Directors. The consolidated entity manages liquidity risk by monitoring of future rolling cash flow forecasts. These reflect management’s expectations of the settlement of financial assets and liabilities.
The following are the contractual maturities of financial liabilities, including estimated interest payments.
31 December 2016
Contractual cashflowsCarrying amount US$’000
6 mths or less
US$’000
6 – 12 mths
US$’000
1 – 2 years
US$’000
2 – 5 years
US$’000
5 years or more
US$’000
Trade and other payables 12,229 12,229 – – – –Secured borrowings 3,299 – – 5,434 – –Total 15,528 12,229 – 5,434 – –
31 December 2015
Contractual cashflowsCarrying amount US$’000
6 mths or less
US$’000
6 – 12 mths
US$’000
1 – 2 years
US$’000
2 – 5 years
US$’000
5 years or more
US$’000
Trade and other payables 5,702 5,702 – – – –
Total 5,702 5,702 – – – –
Market risk
Market risk is the risk that changes in market prices, such as foreign exchange rates, commodity prices, interest rates will affect the consolidated entity’s income or the value of its holdings of financial instruments. The objective of market risk management is to manage and control market risk exposures within acceptable parameters, while optimising the return.
Foreign exchange risk
During 2015 and 2016, operating costs were incurred in US, Australian and Canadian dollars, Arab Emirates Dirham and Yemeni Rials.
Throughout 2015 and 2016, the consolidated entity held the majority of its liquid funds in US dollars.
Fluctuations in the Australian dollar/US dollar exchange rate have impacted the underlying performance of the consolidated entity. The consolidated entity’s policy is not to hedge the Australian dollar/US dollar exchange rate risk as income (cash inflows) and expenses (cash outflows), are predominantly denominated in US dollars, with the exception of Australian dollar denominated equity funding, consequently surplus funds are primarily held in US dollars. The impact of Arab Emirates Dirham, Canadian dollars and Yemeni Rials was not material. The most significant Australian dollar exposure relates to the A$11,085,000 to be raised through the December 2016 non-renounceable rights issue. A$7,638,000 had been received in December 2016 with the remaining amount of A$3,447,000 being due from two underwriters by 12 March 2017.

P E T S E C E N E R GY LT D
A N N UA L R E P O R T 20 16
4 9
Commodity price risk
The revenue and income of the consolidated entity are affected by changes in natural gas and crude oil prices, and from time to time various financial transactions (swap contracts and collar contracts involving NYMEX commodity prices for natural gas and crude oil) may be undertaken to reduce the effect of these changes. The consolidated entity ensures that it has sufficient proved reserves of these commodities to cover all these transactions and it only enters into such derivatives to match its anticipated underlying physical production and reserves. The consolidated entity also limits the term of the transactions and the percentage of the Company’s expected aggregate oil and natural gas production that may be hedged at any time.
Swaps
In a natural gas swap agreement the consolidated entity receives from the counterparty the difference between the agreed contracted fixed price and the quoted or published reference settlement price if the latter is lower than the fixed price. If the reference settlement price is higher than the agreed fixed price, the consolidated entity will pay the difference to the counterparty.
Collars
In a collar agreement, a floor price and a ceiling price are established. If there is no cash outlay upon entering a collar arrangement, it is called a “costless” or “cashless” collar. If quoted reference prices at the specified date (expiration date) are lower than the floor price, then the counterparty pays the price difference multiplied by the notional quantity to the consolidated entity. If the quoted reference prices at the specified date are higher than the ceiling price, then the consolidated entity pays the price difference multiplied by the notional quantity to the counterparty.
At 31 December 2016, the consolidated entity had no outstanding oil or natural gas hedges in place (previous corresponding period: Nil).
Interest rate risk
The consolidated entity’s exposure to market interest rates primarily relates to the consolidated entity’s cash holdings (2015: cash holdings).
The financial instruments exposed to interest rate risk are as follows:
2016US$’000
2015US$’000
Financial assets
Cash and restricted cash deposits 13,077 12,807
13,077 12,807
Sensitivity analysis
In managing commodity price and interest rate risks the consolidated entity aims to reduce the impact of short-term fluctuations on the consolidated entity’s earnings. However, credit considerations limit the amount of hedging with derivative instruments that the consolidated entity can enter into. The consolidated entity and the Company do not use derivative instruments to manage foreign exchange rate risk. Over the longer-term, permanent changes in commodity prices, interest rates and exchange rates will have an impact on profit.
The estimated impact of a 10 per cent change in the average commodity price for the year ended 31 December 2016 would have increased or decreased the consolidated entity’s profit or loss by US$109,000 (2015: US$157,000) excluding potential impact of impairments. The estimated impact of a change of 100 basis points in interest rates would have increased or decreased the consolidated entity’s profit or loss by US$14,000 (2015: US$4,000). The estimated impact of a 10 per cent change in the USD/AUD and USD/CAD exchange rates would have increased or decreased the consolidated entity’s profit or loss by a total of US$170,000 (2015: US$44,000).

Notes to the Financial Statements For the year ended 31 December 2016
P E T S E C E N E R GY LT D
A N N UA L R E P O R T 20 16
5 0 P E T S E C E N E R GY LT D
A N N UA L R E P O R T 20 16
5 0
20. Risk management framework and additional financial instruments disclosures (continued)
Fair values of financial assets and liabilities
The carrying values of financial assets and liabilities of the Group approximate their fair values.
The Group measures and recognises in the statement of financial position on a recurring basis certain assets and liabilities at fair value in accordance with AASB13 Fair value measurement. The fair value must be estimated for recognition and measurement or for disclosure purposes in accordance with the following hierarchy:
Level 1: Quoted prices (unadjusted) in active markets for identical assets or liabilities;
Level 2: Inputs other than quoted prices included within level 1 that are observable for the asset or liability, either directly (as priced) or indirectly (derived from prices); and
Level 3: Inputs for the asset or liability which are not based on observable market data (unobservable inputs).
The fair values of financial assets and liabilities, together with the carrying amounts shown in the balance sheet, are as follows:
2016 2015CarryingamountUS$’000
Fair valueUS$’000
CarryingamountUS$’000
Fair valueUS$’000
Trade and other receivables 4,566 4,566 5,180 5,180
Cash and restricted cash deposits 13,077 13,077 12,807 12,807
Trade and other payables (12,229) (12,229) (5,702) (5,702)
Secured borrowings (3,299) (3,299) – –
Financial derivative instruments (764) (764) – –
1,351 1,351 12,285 12,285
The financial derivative instrument of US$764,000 (2015: nil) is a level 2 instrument.
Refer to note 4 for the determination of fair values.
21. Operating leases
Leases as lessee
Non-cancellable operating lease rentals are payable as follows:
2016US$’000
2015US$’000
Less than 1 year 441 362
Between 1 and 2 years 207 195
Between 2 and 3 years 201 5
Between 3 and 4 years 210 –
Between 4 and 5 years 200 –
1,259 562
The consolidated entity leases office space in Australia and the USA under operating leases. The leases typically run for a period between 1 and 5 years. None of the leases includes contingent rentals.
During the year ended 31 December 2016, US$528,000 was recognised as an expense in the statement of comprehensive income in respect of operating leases including month-to-month leases (2015: US$537,000).
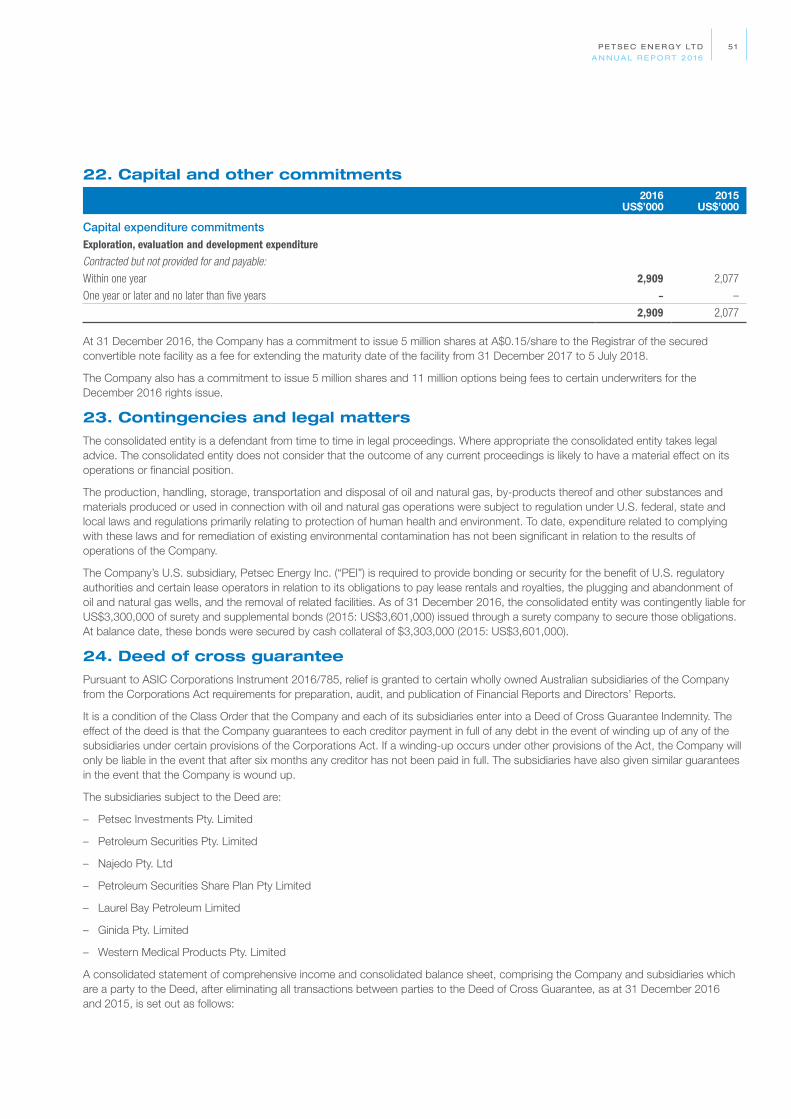
P E T S E C E N E R GY LT D
A N N UA L R E P O R T 20 16
5 1
22. Capital and other commitments2016
US$’0002015
US$’000
Capital expenditure commitmentsExploration, evaluation and development expenditureContracted but not provided for and payable:
Within one year 2,909 2,077
One year or later and no later than five years – –
2,909 2,077
At 31 December 2016, the Company has a commitment to issue 5 million shares at A$0.15/share to the Registrar of the secured convertible note facility as a fee for extending the maturity date of the facility from 31 December 2017 to 5 July 2018.
The Company also has a commitment to issue 5 million shares and 11 million options being fees to certain underwriters for the December 2016 rights issue.
23. Contingencies and legal matters
The consolidated entity is a defendant from time to time in legal proceedings. Where appropriate the consolidated entity takes legal advice. The consolidated entity does not consider that the outcome of any current proceedings is likely to have a material effect on its operations or financial position.
The production, handling, storage, transportation and disposal of oil and natural gas, by-products thereof and other substances and materials produced or used in connection with oil and natural gas operations were subject to regulation under U.S. federal, state and local laws and regulations primarily relating to protection of human health and environment. To date, expenditure related to complying with these laws and for remediation of existing environmental contamination has not been significant in relation to the results of operations of the Company.
The Company’s U.S. subsidiary, Petsec Energy Inc. (“PEI”) is required to provide bonding or security for the benefit of U.S. regulatory authorities and certain lease operators in relation to its obligations to pay lease rentals and royalties, the plugging and abandonment of oil and natural gas wells, and the removal of related facilities. As of 31 December 2016, the consolidated entity was contingently liable for US$3,300,000 of surety and supplemental bonds (2015: US$3,601,000) issued through a surety company to secure those obligations. At balance date, these bonds were secured by cash collateral of $3,303,000 (2015: US$3,601,000).
24. Deed of cross guarantee
Pursuant to ASIC Corporations Instrument 2016/785, relief is granted to certain wholly owned Australian subsidiaries of the Company from the Corporations Act requirements for preparation, audit, and publication of Financial Reports and Directors’ Reports.
It is a condition of the Class Order that the Company and each of its subsidiaries enter into a Deed of Cross Guarantee Indemnity. The effect of the deed is that the Company guarantees to each creditor payment in full of any debt in the event of winding up of any of the subsidiaries under certain provisions of the Corporations Act. If a winding-up occurs under other provisions of the Act, the Company will only be liable in the event that after six months any creditor has not been paid in full. The subsidiaries have also given similar guarantees in the event that the Company is wound up.
The subsidiaries subject to the Deed are:
– Petsec Investments Pty. Limited
– Petroleum Securities Pty. Limited
– Najedo Pty. Ltd
– Petroleum Securities Share Plan Pty Limited
– Laurel Bay Petroleum Limited
– Ginida Pty. Limited
– Western Medical Products Pty. Limited
A consolidated statement of comprehensive income and consolidated balance sheet, comprising the Company and subsidiaries which are a party to the Deed, after eliminating all transactions between parties to the Deed of Cross Guarantee, as at 31 December 2016 and 2015, is set out as follows:

Notes to the Financial Statements For the year ended 31 December 2016
P E T S E C E N E R GY LT D
A N N UA L R E P O R T 20 16
52 P E T S E C E N E R GY LT D
A N N UA L R E P O R T 20 16
52
24. Deed of cross guarantee (continued)
Summarised consolidated statement of profit or loss and other comprehensive income and retained earnings/(accumulated losses)
2016US$’000
2015US$’000
Other income and expenses 6,168 9,261
Operating expenses (1,704) (1,340)
Finance income/(expense) (653) 40
Profit/(loss) before tax 3,811 7,961
Income tax benefit/(expense) – –
Profit/(loss) after tax 3,811 7,961
Other comprehensive income – –
Total comprehensive income for the period 3,811 7,961
Retained earnings/(accumulated losses) at beginning of year (168,022) (175,983)
Retained earnings/(accumulated losses) at end of year (164,211) (168,022)
Balance sheet2016
US$’0002015
US$’000
AssetsCash and cash equivalents 8,745 7,361
Restricted deposits 269 66
Loans receivable from related parties – 639
Other receivables 2,529 1,067
Prepayments 54 61
Total current assets 11,597 9,194
Loans receivable from controlled entities 12,041 3,011
Loans receivable from related parties – 861
Other financial assets 32,013 27,524
Other investments 896 908
Property, plant and equipment 122 35
Total non-current assets 45,072 32,339
Total assets 56,669 41,533
LiabilitiesTrade and other payables 523 136
Employee benefits provision 40 31
Total current liabilities 563 167
Secured borrowings 3,299 –
Fair value of derivative instruments 764 –
Loans payable to controlled entities 341 349
Employee benefits provision 184 184
Total non-current liabilities 4,588 533
Total liabilities 5,151 700
Net assets 51,518 40,833
EquityIssued capital 193,733 186,542
Reserves 21,996 22,313
Retained earnings/(accumulated losses) (164,211) (168,022)
Total equity 51,518 40,833
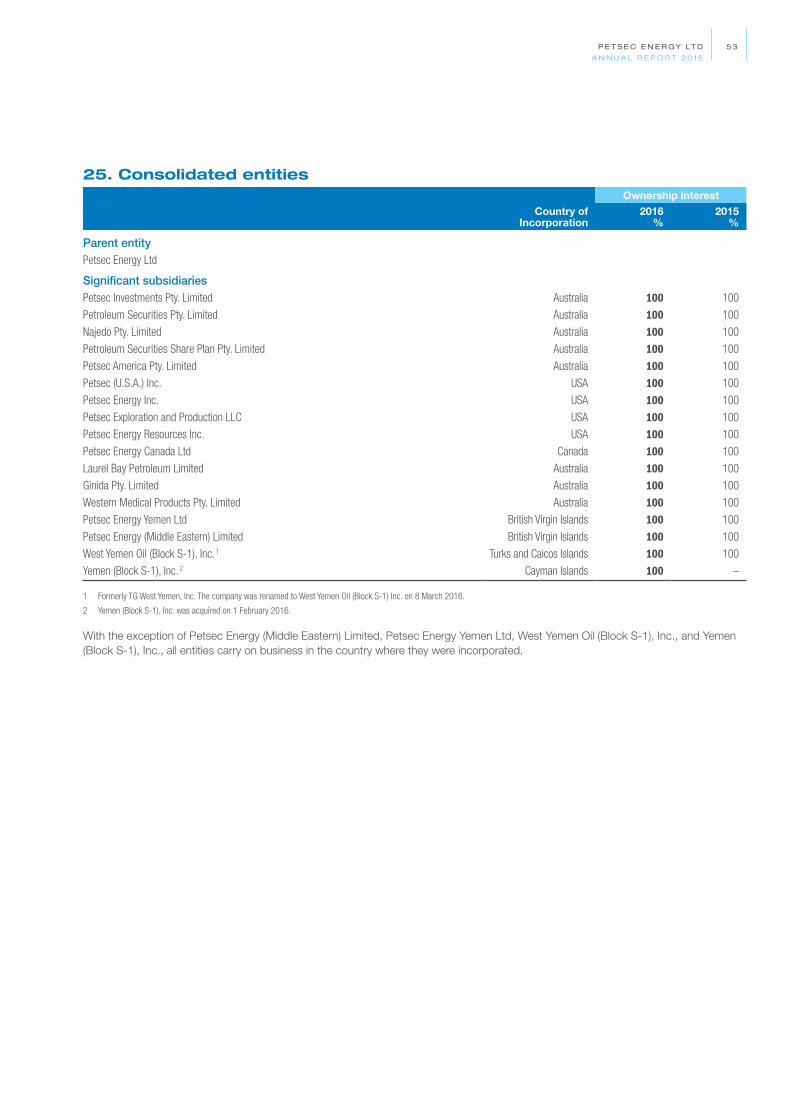
P E T S E C E N E R GY LT D
A N N UA L R E P O R T 20 16
5 3
25. Consolidated entities
Country ofIncorporation
Ownership interest2016
%2015
%
Parent entityPetsec Energy Ltd
Significant subsidiariesPetsec Investments Pty. Limited Australia 100 100
Petroleum Securities Pty. Limited Australia 100 100
Najedo Pty. Limited Australia 100 100
Petroleum Securities Share Plan Pty. Limited Australia 100 100
Petsec America Pty. Limited Australia 100 100
Petsec (U.S.A.) Inc. USA 100 100
Petsec Energy Inc. USA 100 100
Petsec Exploration and Production LLC USA 100 100
Petsec Energy Resources Inc. USA 100 100
Petsec Energy Canada Ltd Canada 100 100
Laurel Bay Petroleum Limited Australia 100 100
Ginida Pty. Limited Australia 100 100
Western Medical Products Pty. Limited Australia 100 100
Petsec Energy Yemen Ltd British Virgin Islands 100 100
Petsec Energy (Middle Eastern) Limited British Virgin Islands 100 100
West Yemen Oil (Block S-1), Inc. 1 Turks and Caicos Islands 100 100
Yemen (Block S-1), Inc. 2 Cayman Islands 100 –
1 Formerly TG West Yemen, Inc. The company was renamed to West Yemen Oil (Block S-1) Inc. on 8 March 2016.
2 Yemen (Block S-1), Inc. was acquired on 1 February 2016.
With the exception of Petsec Energy (Middle Eastern) Limited, Petsec Energy Yemen Ltd, West Yemen Oil (Block S-1), Inc., and Yemen (Block S-1), Inc., all entities carry on business in the country where they were incorporated.

Notes to the Financial Statements For the year ended 31 December 2016
P E T S E C E N E R GY LT D
A N N UA L R E P O R T 20 16
5 4 P E T S E C E N E R GY LT D
A N N UA L R E P O R T 20 16
5 4
26
. S
eg
me
nt
rep
ort
ing
(c
on
tin
ue
d)
Aus
tral
iaU
SA
Can
ada
ME
NA
Co
nso
lidat
ed20
16U
S$’
000
2015
US
$’00
020
16U
S$’
000
2015
US
$’00
020
16U
S$’
000
2015
US
$’00
020
16U
S$’
000
2015
US
$’00
020
16U
S$’
000
2015
US
$’00
0
Oil a
nd g
as s
ales
–
–1,
116
1,61
3–
––
–1,
116
1,61
3
Roya
lties
pai
d–
–(2
5)(4
3)–
––
–(2
5)(4
3)
Net r
even
ues
afte
r roy
altie
s *
––
1,09
11,
570
––
––
1,09
11,
570
Segm
ent n
et p
rofit
/(los
s) b
efor
e ta
x(2
,236
)(1
,566
)(4
,535
)(7
,522
)(4
)(2
1)(6
,249
)(1
,496
)(1
3,02
4)(1
0,60
5)
Inco
me
tax
expe
nse
––
––
––
––
––
Profi
t/(lo
ss)
afte
r tax
(2,2
36)
(1,5
66)
(4,5
35)
(7,5
22)
(4)
(21)
(6,2
49)
(1,4
96)
(13,
024)
(10,
605)
Depr
ecia
tion,
dep
letio
n, a
mor
tisat
ion
& re
clam
atio
n11
1277
852
6–
–2
–79
153
8
Dry
hole
, im
pairm
ent a
nd
aban
donm
ent e
xpen
se–
–1,
203
6,37
8–
20–
–1,
203
6,39
8
Expl
orat
ion
and
wor
k-ov
er e
xpen
se–
–93
6–
––
––
936
5
Segm
ent a
sset
s11
,719
9,04
216
,345
19,7
21–
–7,
308
3,70
835
,372
32,4
71
Acqu
isitio
n of
pro
perty
, pla
nt
and
equi
pmen
t and
exp
lora
tion,
ev
alua
tion
and
deve
lopm
ent a
sset
s10
515
2,53
311
,373
–20
227
850
2,86
512
,258
* Th
ere
are
no in
ter-
segm
ent s
ales
.
**
99%
of t
he G
roup
’s o
il an
d ga
s sa
les
and
roya
lties
are
der
ived
from
one
cus
tom
er.
Aus
tral
iaU
SA
Can
ada
ME
NA
Co
nso
lidat
ed20
16U
S$’
000
2015
US
$’00
020
16U
S$’
000
2015
US
$’00
020
16U
S$’
000
2015
US
$’00
020
16U
S$’
000
2015
US
$’00
020
16U
S$’
000
2015
US
$’00
0
Segm
ent l
iabi
litie
s4,
811
352
3,68
85,
669
––
8,77
22,
656
17,2
718,
677
Cash
flow
s fro
m o
pera
ting
activ
ities
(1,9
75)
(903
)(1
,593
)(3
,161
)(4
)(6
2)(3
,227
)(1
,704
)(6
,799
)(5
,830
)
Cash
flow
s fro
m in
vest
ing
activ
ities
(105
)(1
5)(2
,533
)(1
1,37
3)–
(20)
(227
)(8
50)
(2,8
65)
(12,
258)
Cash
flow
s fro
m fi
nanc
ing
activ
ities
10,0
29–
––
––
––
10,0
29–26. Segment
reporting
The consolidated entity operates in the oil and gas industry.
Segment information is presented in the consolidated financial statements in respect of the consolidated entity’s geographic segments, which reflects the presentation of information to the chief operating decision maker.
Segment results include items directly attributable to a segment as well as those that can be allocated on a reasonable basis. Segment acquisition of property, plant and equipment, intangibles and exploration, evaluation and development assets is the total cost incurred during the period to acquire segment assets that are expected to be utilised for more than one period.
In presenting information on the basis of geographical segments, segment assets and liabilities, segment revenue and net profit/(loss) after tax are based on the geographical location of operations.
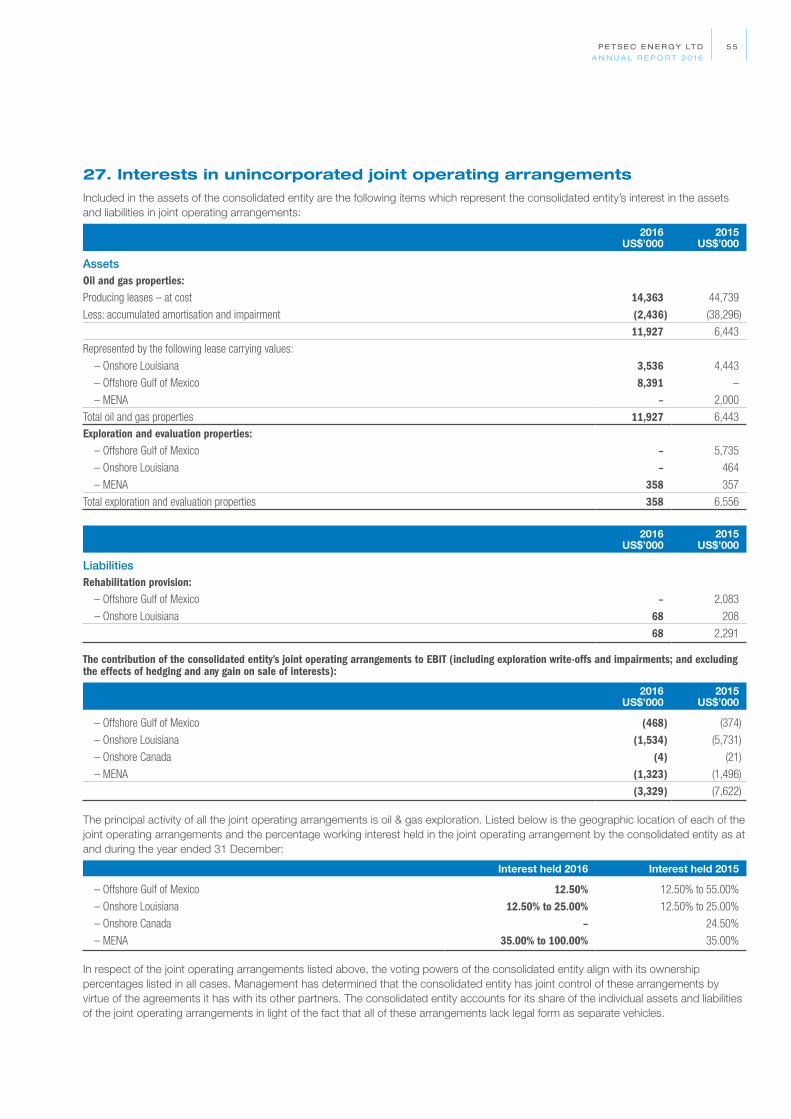
P E T S E C E N E R GY LT D
A N N UA L R E P O R T 20 16
5 5
27. Interests in unincorporated joint operating arrangements
Included in the assets of the consolidated entity are the following items which represent the consolidated entity’s interest in the assets and liabilities in joint operating arrangements:
2016US$’000
2015US$’000
AssetsOil and gas properties:Producing leases – at cost 14,363 44,739
Less: accumulated amortisation and impairment (2,436) (38,296)
11,927 6,443
Represented by the following lease carrying values:
– Onshore Louisiana 3,536 4,443
– Offshore Gulf of Mexico 8,391 –
– MENA – 2,000
Total oil and gas properties 11,927 6,443Exploration and evaluation properties: – Offshore Gulf of Mexico – 5,735
– Onshore Louisiana – 464
– MENA 358 357
Total exploration and evaluation properties 358 6,556
2016US$’000
2015US$’000
LiabilitiesRehabilitation provision: – Offshore Gulf of Mexico – 2,083
– Onshore Louisiana 68 208
68 2,291
The contribution of the consolidated entity’s joint operating arrangements to EBIT (including exploration write-offs and impairments; and excluding the effects of hedging and any gain on sale of interests):
2016US$’000
2015US$’000
– Offshore Gulf of Mexico (468) (374)
– Onshore Louisiana (1,534) (5,731)
– Onshore Canada (4) (21)
– MENA (1,323) (1,496)
(3,329) (7,622)
The principal activity of all the joint operating arrangements is oil & gas exploration. Listed below is the geographic location of each of the joint operating arrangements and the percentage working interest held in the joint operating arrangement by the consolidated entity as at and during the year ended 31 December:
Interest held 2016 Interest held 2015
– Offshore Gulf of Mexico 12.50% 12.50% to 55.00%
– Onshore Louisiana 12.50% to 25.00% 12.50% to 25.00%
– Onshore Canada – 24.50%
– MENA 35.00% to 100.00% 35.00%
In respect of the joint operating arrangements listed above, the voting powers of the consolidated entity align with its ownership percentages listed in all cases. Management has determined that the consolidated entity has joint control of these arrangements by virtue of the agreements it has with its other partners. The consolidated entity accounts for its share of the individual assets and liabilities of the joint operating arrangements in light of the fact that all of these arrangements lack legal form as separate vehicles.
26
. S
eg
me
nt
rep
ort
ing
(c
on
tin
ue
d)
Aus
tral
iaU
SA
Can
ada
ME
NA
Co
nso
lidat
ed20
16U
S$’
000
2015
US
$’00
020
16U
S$’
000
2015
US
$’00
020
16U
S$’
000
2015
US
$’00
020
16U
S$’
000
2015
US
$’00
020
16U
S$’
000
2015
US
$’00
0
Oil a
nd g
as s
ales
–
–1,
116
1,61
3–
––
–1,
116
1,61
3
Roya
lties
pai
d–
–(2
5)(4
3)–
––
–(2
5)(4
3)
Net r
even
ues
afte
r roy
altie
s *
––
1,09
11,
570
––
––
1,09
11,
570
Segm
ent n
et p
rofit
/(los
s) b
efor
e ta
x(2
,236
)(1
,566
)(4
,535
)(7
,522
)(4
)(2
1)(6
,249
)(1
,496
)(1
3,02
4)(1
0,60
5)
Inco
me
tax
expe
nse
––
––
––
––
––
Profi
t/(lo
ss)
afte
r tax
(2,2
36)
(1,5
66)
(4,5
35)
(7,5
22)
(4)
(21)
(6,2
49)
(1,4
96)
(13,
024)
(10,
605)
Depr
ecia
tion,
dep
letio
n, a
mor
tisat
ion
& re
clam
atio
n11
1277
852
6–
–2
–79
153
8
Dry
hole
, im
pairm
ent a
nd
aban
donm
ent e
xpen
se–
–1,
203
6,37
8–
20–
–1,
203
6,39
8
Expl
orat
ion
and
wor
k-ov
er e
xpen
se–
–93
6–
––
––
936
5
Segm
ent a
sset
s11
,719
9,04
216
,345
19,7
21–
–7,
308
3,70
835
,372
32,4
71
Acqu
isitio
n of
pro
perty
, pla
nt
and
equi
pmen
t and
exp
lora
tion,
ev
alua
tion
and
deve
lopm
ent a
sset
s10
515
2,53
311
,373
–20
227
850
2,86
512
,258
* Th
ere
are
no in
ter-
segm
ent s
ales
.
**
99%
of t
he G
roup
’s o
il an
d ga
s sa
les
and
roya
lties
are
der
ived
from
one
cus
tom
er.
Aus
tral
iaU
SA
Can
ada
ME
NA
Co
nso
lidat
ed20
16U
S$’
000
2015
US
$’00
020
16U
S$’
000
2015
US
$’00
020
16U
S$’
000
2015
US
$’00
020
16U
S$’
000
2015
US
$’00
020
16U
S$’
000
2015
US
$’00
0
Segm
ent l
iabi
litie
s4,
811
352
3,68
85,
669
––
8,77
22,
656
17,2
718,
677
Cash
flow
s fro
m o
pera
ting
activ
ities
(1,9
75)
(903
)(1
,593
)(3
,161
)(4
)(6
2)(3
,227
)(1
,704
)(6
,799
)(5
,830
)
Cash
flow
s fro
m in
vest
ing
activ
ities
(105
)(1
5)(2
,533
)(1
1,37
3)–
(20)
(227
)(8
50)
(2,8
65)
(12,
258)
Cash
flow
s fro
m fi
nanc
ing
activ
ities
10,0
29–
––
––
––
10,0
29–

Notes to the Financial Statements For the year ended 31 December 2016
P E T S E C E N E R GY LT D
A N N UA L R E P O R T 20 16
56 P E T S E C E N E R GY LT D
A N N UA L R E P O R T 20 16
56
28. Wholly owned areas of interest
Included in the assets and liabilities of the consolidated entity are the following items which represent the consolidated entity’s wholly owned areas of interest:
2016US$’000
2015US$’000
AssetsOil and gas properties:Producing leases – at cost 4,883 17,124
Less: accumulated amortisation and impairments – (17,124)
4,883 –
Represented by the following lease carrying values:
– MENA 4,883 –
4,883 –
2016US$’000
2015US$’000
LiabilitiesRehabilitation provision: – Offshore Gulf of Mexico – 343
– 343
The contribution of the consolidated entity’s areas of interest to EBIT (including exploration write-offs and impairments; and excluding the effects of hedging):
2016US$’000
2015US$’000
– Offshore Gulf of Mexico (107) (39)
– MENA (4,001) –
(4,108) (39)
29. Reconciliation of cash flows from operating activities2015
US$’0002015
US$’000
Cash flows from operating activitiesProfit/(loss) for the period (13,024) (10,605)
Adjustments for:
Depreciation, depletion and amortisation 791 538
Dry-hole and impairment expense 1,203 6,398
Exploration and work-over expense 936 5
Net foreign exchange losses/(gains) (133) (203)
Net loss/(gain) on assets – (339)
Net loss/(gain) on property, plant and equipment 7 –
Share-based payment expenses 23 11
Operating profit before changes in working capital and provisions (10,197) (4,195)
Decrease/(increase) in restricted cash deposits 93 1,634
Decrease/(Increase) in receivables and prepayments 308 (2,569)
(Decrease)/Increase in payables and provisions 2,997 (700)
Net cash from operating activities (6,799) (5,830)

P E T S E C E N E R GY LT D
A N N UA L R E P O R T 20 16
57
30. Related parties
The following were key management personnel of the consolidated entity at any time during the reporting period and unless otherwise indicated were key management personnel for the entire period:
Non-executive director Executive director
D A Mortimer T N Fern (Chairman and Managing Director)
A P Baden
M S Lober 1
Executives
M Petkovski (Chief Executive Officer, Petsec Energy (Middle Eastern) Limited)
R J Smith (Chief Executive Officer, Petsec Energy Inc.)
R A Keogh (Group Chief Financial Officer and President, Petsec Energy Inc.)
R A Krenzke (Executive Vice President Exploration, Petsec Energy Inc.)
P Gahdmar (Company Secretary and Group Financial Controller, Petsec Energy Ltd)
1 Mr Lober resigned from the Board and its Committees on 19 May 2016
Key management personnel compensation
The key management personnel compensation included in personnel expenses (see note 6) is as follows:
2016US$
2015US$
Wages and salaries 1,163,706 1,191,546
Service agreements 793,940 749,676
Post-employment benefits 57,207 58,422
Short-term incentives/ retention cash bonus 23,014 84,566
Share-based payment compensation 19,642 11,100
Other benefits * 180,387 247,729
2,237,896 2,343,039
* Other benefits represent amounts paid on behalf of the Managing Director and Executive Officers in respect of insurance, car parking, fringe benefits and sign-on bonuses
Individual directors and executives compensation disclosures
Information regarding individual directors’ and executives’ compensation and some equity instruments disclosures as required by Corporations Act s300A and Corporations Regulations 2M.3.03 are provided in the Remuneration Report section of the Directors’ Report on pages 20 to 26.
Apart from the details disclosed in this note, no director has entered into a material contract with the Company or consolidated entity since the end of the previous financial year and there were no material contracts involving directors’ interests existing at year-end.
Non-executive directors appointed prior to 2003 are entitled to receive a retirement benefit that is equivalent to the remuneration received in the three years prior to retirement. Incoming non-executive directors appointed thereafter are not entitled to receive retirement benefits in accordance with the recommendations made by the ASX Corporate Governance Council. Directors’ retirement obligations are presently US$140,000 in total (2015: US$142,000).

Notes to the Financial Statements For the year ended 31 December 2016
P E T S E C E N E R GY LT D
A N N UA L R E P O R T 20 16
5 8 P E T S E C E N E R GY LT D
A N N UA L R E P O R T 20 16
5 8
30. Related parties (continued)
Transactions with key management personnel
Key management personnel of the Company and their immediate relatives control approximately 20.7 percent of the voting shares of the Company.
During the year, Mr T Fern and Mr D Mortimer, Directors of the Company, participated as sub-underwriters in the A$11 million rights issue for a total amount of A$1,357,000 and $437,000, respectively. A 5% fee was payable to those shareholders that participated as sub-underwriters to the rights issue. Mr T Fern and Mr D Mortimer respectively received A$67,871 and $21,859 in sub-underwriting fees. In addition, Mr T Fern underwrote A$1,500,000 in the rights issue through a personally-related entity as a general sub-underwriting for which he will receive a 2% fee. If the entity takes up the full amount of the A$1,500,000 sub-underwriting, he will receive a further 3% fee. The terms and conditions of these fees paid to Mr T Fern and Mr D Mortimer were no more favourable than those available to all sub-underwriters.
800,000 shares were issued by the Company under its shareholder approved Employee Share Plan (“ESP”) to key management personnel as long term incentive compensation during the year (2015: 2,500,000). Refer to note 17(b) for details.
The aggregate amounts recognised in service agreements during the year relating to key management personnel and their personally related entities, were a total expense of US$794,000 (2015: US$750,000). Refer to Remuneration Report for further details.
Assets and liabilities arising from the above related party transactions2016
US$’0002015
US$’000
Current assetsRelated party receivables – 639
Non-current assetsRelated party receivables – 861
Current liabilitiesRelated party payables 83 149
Other related party disclosures
Information relating to subsidiaries is set out in note 25.
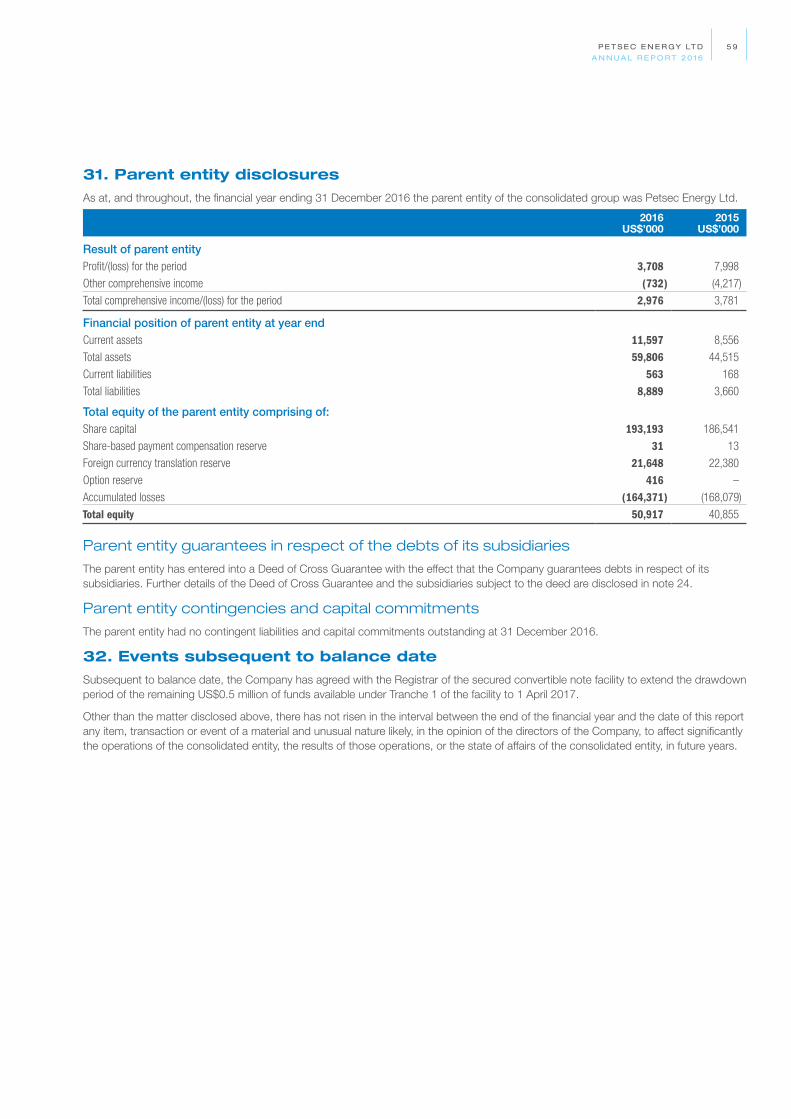
P E T S E C E N E R GY LT D
A N N UA L R E P O R T 20 16
59
31. Parent entity disclosures
As at, and throughout, the financial year ending 31 December 2016 the parent entity of the consolidated group was Petsec Energy Ltd.
2016US$’000
2015US$’000
Result of parent entityProfit/(loss) for the period 3,708 7,998
Other comprehensive income (732) (4,217)
Total comprehensive income/(loss) for the period 2,976 3,781
Financial position of parent entity at year endCurrent assets 11,597 8,556
Total assets 59,806 44,515
Current liabilities 563 168
Total liabilities 8,889 3,660
Total equity of the parent entity comprising of:Share capital 193,193 186,541
Share-based payment compensation reserve 31 13
Foreign currency translation reserve 21,648 22,380
Option reserve 416 –
Accumulated losses (164,371) (168,079)
Total equity 50,917 40,855
Parent entity guarantees in respect of the debts of its subsidiaries
The parent entity has entered into a Deed of Cross Guarantee with the effect that the Company guarantees debts in respect of its subsidiaries. Further details of the Deed of Cross Guarantee and the subsidiaries subject to the deed are disclosed in note 24.
Parent entity contingencies and capital commitments
The parent entity had no contingent liabilities and capital commitments outstanding at 31 December 2016.
32. Events subsequent to balance date
Subsequent to balance date, the Company has agreed with the Registrar of the secured convertible note facility to extend the drawdown period of the remaining US$0.5 million of funds available under Tranche 1 of the facility to 1 April 2017.
Other than the matter disclosed above, there has not risen in the interval between the end of the financial year and the date of this report any item, transaction or event of a material and unusual nature likely, in the opinion of the directors of the Company, to affect significantly the operations of the consolidated entity, the results of those operations, or the state of affairs of the consolidated entity, in future years.

P E T S E C E N E R GY LT D
A N N UA L R E P O R T 20 16
6 0 P E T S E C E N E R GY LT D
A N N UA L R E P O R T 20 16
6 0
Directors’ Declaration
1 In the opinion of the directors of Petsec Energy Ltd (“the Company”):
(a) the financial statements and notes and the Remuneration report in the Directors’ Report, set out on pages 20 to 59, are in accordance with the Corporations Act 2001 including:
(i) giving a true and fair view of the financial position of the Company and the consolidated entity as at 31 December 2016 and of their performance, as represented by the results of their operations and their cash flows, for the year ended on that date; and
(ii) complying with Australian Accounting Standards and the Corporations Regulation 2001; and
(b) the financial report also complies with International Financial Reporting Standards as disclosed in note 2; and
(c) there are reasonable grounds to believe that the Company will be able to pay its debts as and when they become due and payable.
2 There are reasonable grounds to believe that the Company and the controlled entities identified in Note 26 will be able to meet any obligations or liabilities to which they are or may become subject to by virtue of the Deed of Cross Guarantee between the Company and those controlled entities pursuant to ASIC Corporations Instrument 2016/785.
3 The directors have been given the declarations required by Section 295A of the Corporations Act 2001 from the chief executive officer and chief financial officer for the financial year ended 31 December 2016.
Signed in accordance with a resolution of the directors:
Terrence N Fern Director
Sydney, 28 February 2017

P E T S E C E N E R GY LT D
A N N UA L R E P O R T 20 16
6 1
Independent Auditor’s Report
75
KPMG, an Australian partnership and a member firm of the KPMG network of independent member firms affiliated with KPMG International Cooperative (“KPMG International”), a Swiss entity.
Liability limited by a scheme approved under Professional Standards Legislation.
Independent Auditor’s Report
To the shareholders of Petsec Energy Ltd
Report on the audit of the Financial Report
Opinion
We have audited the Financial Report of Petsec Energy Ltd (the Company).
In our opinion, the accompanying Financial Report of the Company is in accordance with the Corporations Act 2001, including:
• giving a true and fair view of the Group and Company’s financial position as at 31 December 2016 and of its financial performance for the year ended on that date; and
• complying with Australian Accounting Standards and the Corporations Regulations 2001.
The Financial Report comprises:
• Consolidated statement of financial position as at 31 December 2016.
• Consolidated statement of profit or loss and other comprehensive income, Consolidated statement of changes in equity, and Consolidated statement of cash flows for the year then ended
• Notes including a summary of significant accounting policies
• Directors’ Declaration.
The Group consists of the Company and the entities it controlled at the year end or from time to time during the financial year.
Basis for opinion
We conducted our audit in accordance with Australian Auditing Standards. We believe that the audit evidence we have obtained is sufficient and appropriate to provide a basis for our opinion.
Our responsibilities under those standards are further described in the Auditor’s responsibilities for the audit of the Financial Report section of our report.
We are independent of the Company and Group in accordance with the Corporations Act 2001 and the ethical requirements of the Accounting Professional and Ethical Standards Board’s APES 110 Code of Ethics for Professional Accountants (the Code) that are relevant to our audit of the Financial Report in Australia. We have fulfilled our other ethical responsibilities in accordance with the Code.

P E T S E C E N E R GY LT D
A N N UA L R E P O R T 20 16
6 2
Independent Auditor’s Report Continued
76
Key Audit Matters
The Key Audit Matters we identified are:
• Oil and Gas Properties;
• Exploration and evaluation properties; and
• Going concern basis of preparation.
Key Audit Matters are those matters that, in our professional judgment, were of most significance in our audit of the Financial Report of the current period.
These matters were addressed in the context of our audit of the Financial Report as a whole, and in forming our opinion thereon, and we do not provide a separate opinion on these matters.
Oil and Gas properties US$16.810m
Refer to Note 12(a) to the financial report.
The key audit matter How the matter was addressed in our audit
The Group’s Oil and Gas properties were a significant portion (47.5%) of the Group’s total assets, and their carrying value was a key audit matter due to the high level of judgement required by us to assess the carrying value.
The key judgements involved in the carrying value assessment are forward looking assumptions, as used in the Group’s value in use models. The key assumptions are forecast production, oil and gas prices, discount rates and reserve estimates. Management obtain a reserve report from a third party expert to assist in their carrying value assessment.
Our assessment is made more challenging given certain recent operating conditions, intermittent production issues, political instability in Middle Eastern located wells and the oil and gas price volatility, each of which are uncertain as to their future improvement.
Our audit procedures included, amongst others:
• We held discussions with management and read the minutes of directors meetings and ASX announcements to understand if the Group had decided to discontinue production at any well. We used this knowledge when assessing forecast production assumptions and the recoverability of the oil and gas properties;
• We compared historical production profiles for consistency with forecast production trends. We analysed the impact of the political instability in the Middle East to forecast production. We compare forecast production to third party expert reserve reports and investigated inconsistencies.
• We used our valuation specialists to compare management’s discount rates to equivalent industry participants.
• For all oil and gas properties we performed sensitivity analysis on key assumptions in the value in use models such as production forecasts, discount rates and oil and gas prices to identify areas of increased audit focus.
• We compared management’s oil and gas price assumptions against published forecasts such as the (WTI oil price) and

P E T S E C E N E R GY LT D
A N N UA L R E P O R T 20 16
6 3
77
investigated inconsistencies.
• We obtained the Group’s value in use models and agreed amounts to FY17 Board approved production plans, FY17 budgets and the third party reserve report.
• We assessed the competence and the independence of the third party experts who prepare the third party reserve report used by management to assist in their carrying value assessment of oil and gas properties.
Exploration and evaluation properties US$0.358m
Refer to Note 12 (b) to the financial report.
The key audit matter How the matter was addressed in our audit
Exploration and evaluation properties is a key audit matter due to:
• The high level of judgement involved inevaluating the ability of the Group tocapitalise and recover exploration andevaluation expenditure carried forward.
Significant judgements included:
• the assessment of the areas ofinterest;
• the assessment of the Group’s currentright to explore in areas of interest.
Recoverability of expenditure focusing on comparing expenditure incurred to date plus further forecast expenditure, to forecast cash flows to be generated from either future production or sale of the area of interest. We assess drilling results collated by management engaged industry experts.
In assessing this key audit matter, we involved senior audit team members with exploration industry expertise.
Our procedures included, amongst others:
• We assessed management’s determinationof areas of interest and the Group’s currentrights to explore in those areas of interest bychecking license status and conditions to therelevant public register.
• We held discussions with management, readthe minutes of directors meetings and ASXannouncements, and used this knowledge toassess further forecast expenditure and tounderstand any decisions regardingdiscontinuation of activities in an areas ofinterest;
• We assessed recoverability of the carryingvalue of the Group’s exploration andevaluation properties by:
• obtaining the results of currentexploration activities and future forecastexpenditure; and
• analysing management forecast cashflows to be generated from either futureproduction or sale of the area of interestagainst our knowledge of the businessand industry.
• We assessed the competence andindependence of experts used bymanagement.
77
investigated inconsistencies.
• We obtained the Group’s value in use models and agreed amounts to FY17 Board approved production plans, FY17 budgets and the third party reserve report.
• We assessed the competence and the independence of the third party experts who prepare the third party reserve report used by management to assist in their carrying value assessment of oil and gas properties
Exploration and evaluation properties US$0.358m
Refer to Note 12 (b) to the financial report.
The key audit matter How the matter was addressed in our audit
Exploration and evaluation properties is a key audit matter due to:
• The high level of judgement involved in evaluating the ability of the Group to capitalise and recover exploration and evaluation expenditure carried forward.
Significant judgements included:
• the assessment of the areas of interest;
• the assessment of the Group’s current right to explore in areas of interest.
Recoverability of expenditure focusing on comparing expenditure incurred to date plus further forecast expenditure, to forecast cash flows to be generated from either future production or sale of the area of interest. We assess drilling results collated by management engaged industry experts.
In assessing this key audit matter, we involved senior audit team members with exploration industry expertise.
Our procedures included, amongst others:
• We assessed management’s determination of areas of interest and the Group’s current rights to explore in those areas of interest by checking license status and conditions to the relevant public register.
• We held discussions with management, read the minutes of directors meetings and ASX announcements, and used this knowledge to assess further forecast expenditure and to understand any decisions regarding discontinuation of activities in an areas of interest;
• We assessed recoverability of the carrying value of the Group’s exploration and evaluation properties by:
• obtaining the results of current exploration activities and future forecast expenditure; and
• analysing management forecast cash flows to be generated from either future production or sale of the area of interest against our knowledge of the business and industry.
• We assessed the competence and independence of experts used by management.
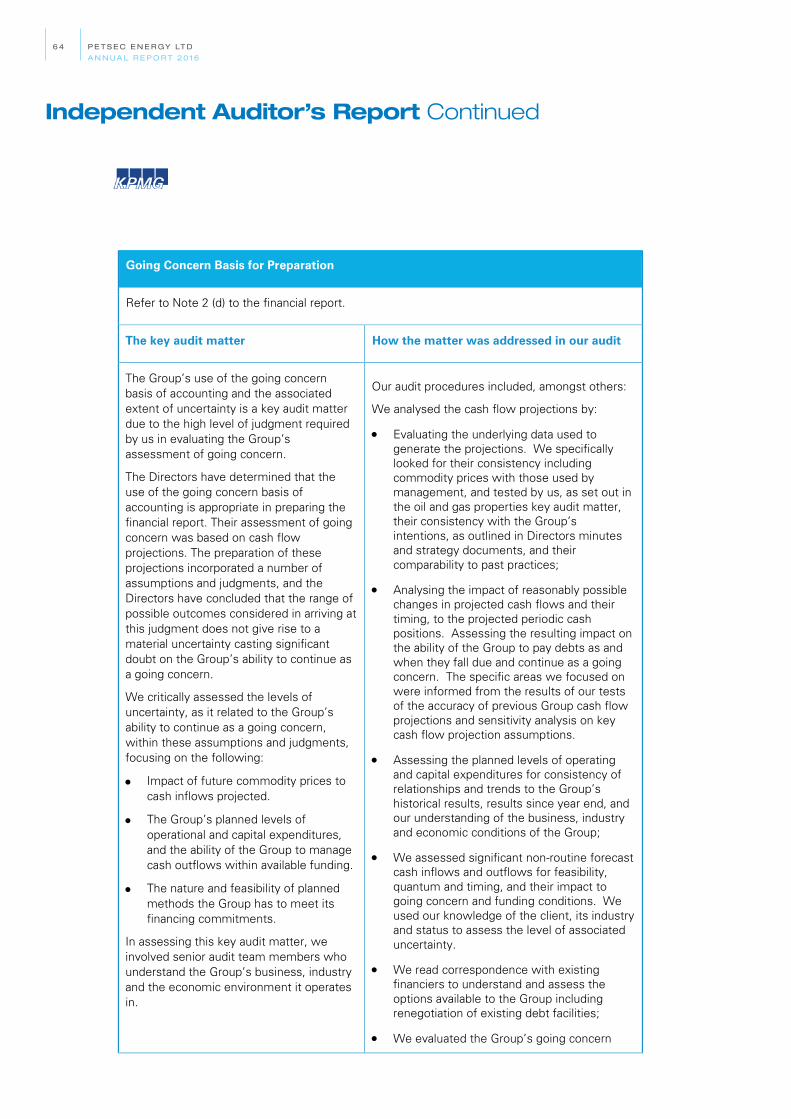
P E T S E C E N E R GY LT D
A N N UA L R E P O R T 20 16
6 4
Independent Auditor’s Report Continued
78
Going Concern Basis for Preparation
Refer to Note 2 (d) to the financial report.
The key audit matter How the matter was addressed in our audit
The Group’s use of the going concern basis of accounting and the associated extent of uncertainty is a key audit matter due to the high level of judgment required by us in evaluating the Group’s assessment of going concern.
The Directors have determined that the use of the going concern basis of accounting is appropriate in preparing the financial report. Their assessment of going concern was based on cash flow projections. The preparation of these projections incorporated a number of assumptions and judgments, and the Directors have concluded that the range of possible outcomes considered in arriving at this judgment does not give rise to a material uncertainty casting significant doubt on the Group’s ability to continue as a going concern.
We critically assessed the levels of uncertainty, as it related to the Group’s ability to continue as a going concern, within these assumptions and judgments, focusing on the following:
• Impact of future commodity prices to cash inflows projected.
• The Group’s planned levels of operational and capital expenditures, and the ability of the Group to manage cash outflows within available funding.
• The nature and feasibility of planned methods the Group has to meet its financing commitments.
In assessing this key audit matter, we involved senior audit team members who understand the Group’s business, industry and the economic environment it operates in.
Our audit procedures included, amongst others:
We analysed the cash flow projections by:
• Evaluating the underlying data used to generate the projections. We specifically looked for their consistency including commodity prices with those used by management, and tested by us, as set out in the oil and gas properties key audit matter, their consistency with the Group’s intentions, as outlined in Directors minutes and strategy documents, and their comparability to past practices;
• Analysing the impact of reasonably possible changes in projected cash flows and their timing, to the projected periodic cash positions. Assessing the resulting impact on the ability of the Group to pay debts as and when they fall due and continue as a going concern. The specific areas we focused on were informed from the results of our tests of the accuracy of previous Group cash flow projections and sensitivity analysis on key cash flow projection assumptions.
• Assessing the planned levels of operating and capital expenditures for consistency of relationships and trends to the Group’s historical results, results since year end, and our understanding of the business, industry and economic conditions of the Group;
• We assessed significant non-routine forecast cash inflows and outflows for feasibility, quantum and timing, and their impact to going concern and funding conditions. We used our knowledge of the client, its industry and status to assess the level of associated uncertainty.
• We read correspondence with existing financiers to understand and assess the options available to the Group including renegotiation of existing debt facilities;
• We evaluated the Group’s going concern 78
Going Concern Basis for Preparation
Refer to Note 2 (d) to the financial report.
The key audit matter How the matter was addressed in our audit
The Group’s use of the going concern basis of accounting and the associated extent of uncertainty is a key audit matter due to the high level of judgment required by us in evaluating the Group’s assessment of going concern.
The Directors have determined that the use of the going concern basis of accounting is appropriate in preparing the financial report. Their assessment of going concern was based on cash flow projections. The preparation of these projections incorporated a number of assumptions and judgments, and the Directors have concluded that the range of possible outcomes considered in arriving at this judgment does not give rise to a material uncertainty casting significant doubt on the Group’s ability to continue as a going concern.
We critically assessed the levels of uncertainty, as it related to the Group’s ability to continue as a going concern, within these assumptions and judgments, focusing on the following:
• Impact of future commodity prices to cash inflows projected.
• The Group’s planned levels of operational and capital expenditures, and the ability of the Group to manage cash outflows within available funding.
• The nature and feasibility of planned methods the Group has to meet its financing commitments.
In assessing this key audit matter, we involved senior audit team members who understand the Group’s business, industry and the economic environment it operates in.
Our audit procedures included, amongst others:
We analysed the cash flow projections by:
• Evaluating the underlying data used to generate the projections. We specifically looked for their consistency including commodity prices with those used by management, and tested by us, as set out in the oil and gas properties key audit matter, their consistency with the Group’s intentions, as outlined in Directors minutes and strategy documents, and their comparability to past practices;
• Analysing the impact of reasonably possible changes in projected cash flows and their timing, to the projected periodic cash positions. Assessing the resulting impact on the ability of the Group to pay debts as and when they fall due and continue as a going concern. The specific areas we focused on were informed from the results of our tests of the accuracy of previous Group cash flow projections and sensitivity analysis on key cash flow projection assumptions.
• Assessing the planned levels of operating and capital expenditures for consistency of relationships and trends to the Group’s historical results, results since year end, and our understanding of the business, industry and economic conditions of the Group;
• We assessed significant non-routine forecast cash inflows and outflows for feasibility, quantum and timing, and their impact to going concern and funding conditions. We used our knowledge of the client, its industry and status to assess the level of associated uncertainty.
• We read correspondence with existing financiers to understand and assess the options available to the Group including renegotiation of existing debt facilities;
• We evaluated the Group’s going concern

P E T S E C E N E R GY LT D
A N N UA L R E P O R T 20 16
6 5
79
disclosures in the financial report by comparing them to our understanding of the matter, the events or conditions incorporated into the cash flow projection assessment, the Group’s plans, and accounting standard requirements
Other Information
Other Information is financial and non-financial information in Petsec’s annual reporting which is provided in addition to the Financial Report and the Auditor’s Report. The Directors are responsible for the Other Information.
Our opinion on the Financial Report does not cover the Other Information and, accordingly, we do not express any form of assurance conclusion thereon.
In connection with our audit of the Financial Report, our responsibility is to read the Other Information. In doing so, we consider whether the Other Information is materially inconsistent with the Financial Report or our knowledge obtained in the audit, or otherwise appears to be materially misstated.
We are required to report if we conclude that there is a material misstatement of this Other Information, and based on the work we have performed on the Other Information that we obtained prior to the date of this Auditor’s Report we have nothing to report.
Responsibilities of the Directors for the Financial Report
The Directors are responsible for:
• preparing the Financial Report that gives a true and fair view in accordance with Australian Accounting Standards and the Corporations Act 2001.
• implementing necessary internal control to enable the preparation of a Financial Report that gives a true and fair view and is free from material misstatement, whether due to fraud or error.
• assessing the Company and Group’s ability to continue as a going concern. This includes disclosing, as applicable, matters related to going concern and using the going concern basis of accounting unless they either intend to liquidate the Company and Group or to cease operations, or have no realistic alternative but to do so.
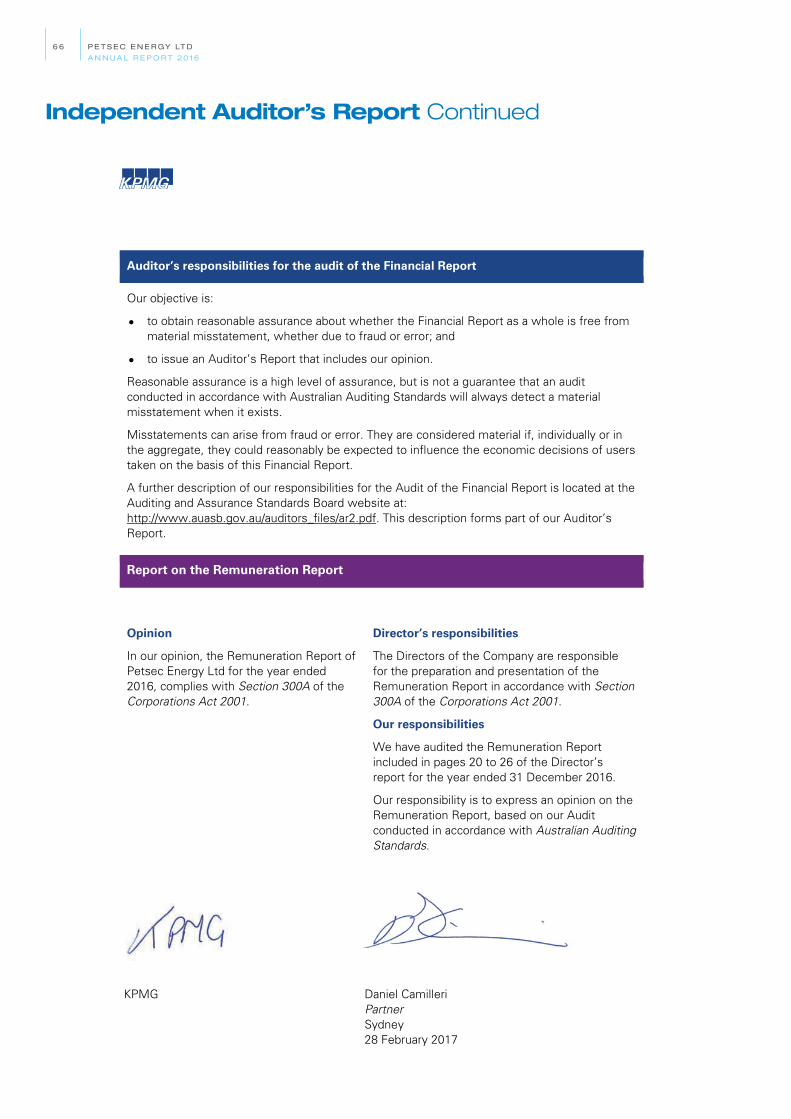
P E T S E C E N E R GY LT D
A N N UA L R E P O R T 20 16
6 6
Independent Auditor’s Report Continued
80
Auditor’s responsibilities for the audit of the Financial Report
Our objective is:
• to obtain reasonable assurance about whether the Financial Report as a whole is free frommaterial misstatement, whether due to fraud or error; and
• to issue an Auditor’s Report that includes our opinion.
Reasonable assurance is a high level of assurance, but is not a guarantee that an audit conducted in accordance with Australian Auditing Standards will always detect a material misstatement when it exists.
Misstatements can arise from fraud or error. They are considered material if, individually or in the aggregate, they could reasonably be expected to influence the economic decisions of users taken on the basis of this Financial Report.
A further description of our responsibilities for the Audit of the Financial Report is located at the Auditing and Assurance Standards Board website at: http://www.auasb.gov.au/auditors_files/ar2.pdf. This description forms part of our Auditor’s Report.
Report on the Remuneration Report
Opinion
In our opinion, the Remuneration Report of Petsec Energy Ltd for the year ended 2016, complies with Section 300A of the Corporations Act 2001.
Director’s responsibilities
The Directors of the Company are responsible for the preparation and presentation of the Remuneration Report in accordance with Section 300A of the Corporations Act 2001.
Our responsibilities
We have audited the Remuneration Report included in pages 20 to 26 of the Director’s report for the year ended 31 December 2016.
Our responsibility is to express an opinion on the Remuneration Report, based on our Audit conducted in accordance with Australian Auditing Standards.
KPMG Daniel Camilleri Partner Sydney 28 February 2017
80
Auditor’s responsibilities for the audit of the Financial Report
Our objective is:
• to obtain reasonable assurance about whether the Financial Report as a whole is free from material misstatement, whether due to fraud or error; and
• to issue an Auditor’s Report that includes our opinion.
Reasonable assurance is a high level of assurance, but is not a guarantee that an audit conducted in accordance with Australian Auditing Standards will always detect a material misstatement when it exists.
Misstatements can arise from fraud or error. They are considered material if, individually or in the aggregate, they could reasonably be expected to influence the economic decisions of users taken on the basis of this Financial Report.
A further description of our responsibilities for the Audit of the Financial Report is located at the Auditing and Assurance Standards Board website at: http://www.auasb.gov.au/auditors_files/ar2.pdf. This description forms part of our Auditor’s Report.
Report on the Remuneration Report
Opinion
In our opinion, the Remuneration Report of Petsec Energy Ltd for the year ended 2016, complies with Section 300A of the Corporations Act 2001.
Director’s responsibilities
The Directors of the Company are responsible for the preparation and presentation of the Remuneration Report in accordance with Section 300A of the Corporations Act 2001.
Our responsibilities
We have audited the Remuneration Report included in pages 25 to 33 of the Director’s report for the year ended 31 December 2016.
Our responsibility is to express an opinion on the Remuneration Report, based on our Audit conducted in accordance with Australian Auditing Standards.
KPMG Daniel Camilleri Partner Sydney 28 February 2017
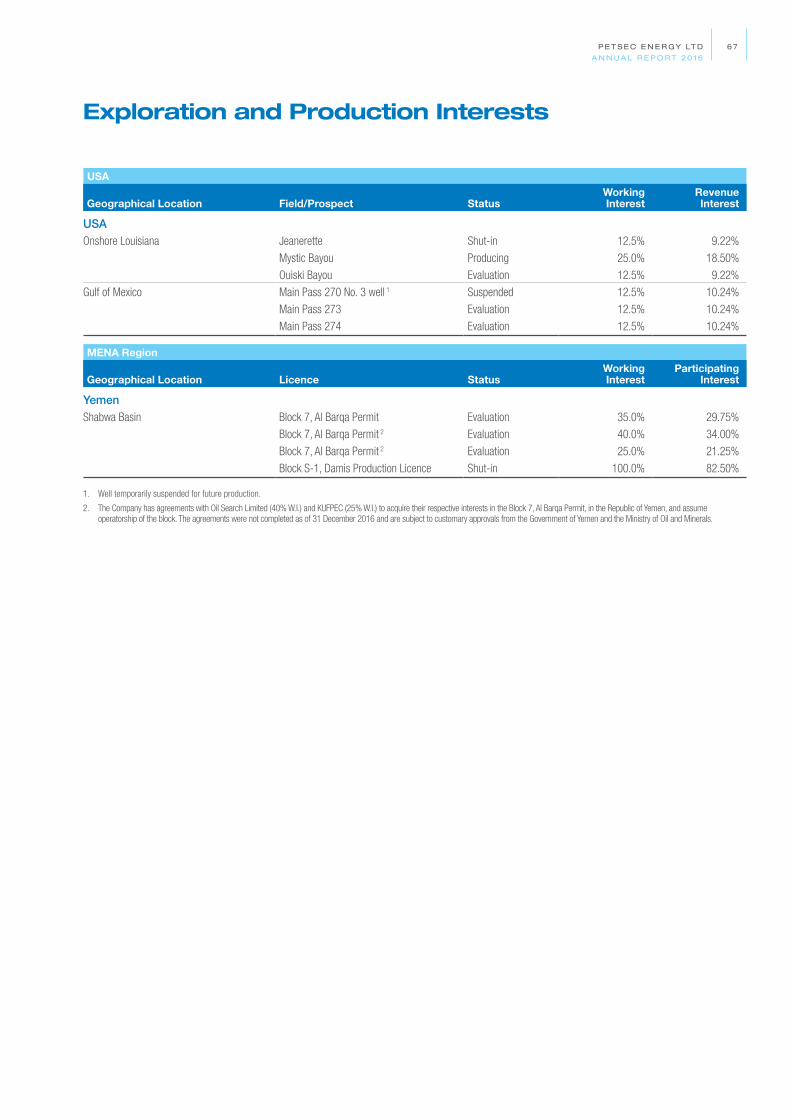
P E T S E C E N E R GY LT D
A N N UA L R E P O R T 20 16
6 7
Exploration and Production Interests
USA
Geographical Location Field/Prospect StatusWorking Interest
Revenue Interest
USAOnshore Louisiana Jeanerette Shut-in 12.5% 9.22%
Mystic Bayou Producing 25.0% 18.50%
Ouiski Bayou Evaluation 12.5% 9.22%
Gulf of Mexico Main Pass 270 No. 3 well 1 Suspended 12.5% 10.24%
Main Pass 273 Evaluation 12.5% 10.24%
Main Pass 274 Evaluation 12.5% 10.24%
MENA Region
Geographical Location Licence StatusWorking Interest
Participating Interest
YemenShabwa Basin Block 7, Al Barqa Permit Evaluation 35.0% 29.75%
Block 7, Al Barqa Permit 2 Evaluation 40.0% 34.00%
Block 7, Al Barqa Permit 2 Evaluation 25.0% 21.25%
Block S-1, Damis Production Licence Shut-in 100.0% 82.50%
1. Well temporarily suspended for future production.
2. The Company has agreements with Oil Search Limited (40% W.I.) and KUFPEC (25% W.I.) to acquire their respective interests in the Block 7, Al Barqa Permit, in the Republic of Yemen, and assume operatorship of the block. The agreements were not completed as of 31 December 2016 and are subject to customary approvals from the Government of Yemen and the Ministry of Oil and Minerals.

P E T S E C E N E R GY LT D
A N N UA L R E P O R T 20 16
6 8 P E T S E C E N E R GY LT D
A N N UA L R E P O R T 20 16
6 8
Shareholder Information
Number of Shareholders
Issued capital was 290,287,924 ordinary shares held by 1,984 shareholders.
All issued shares carry equal voting rights on a one for one basis.
Size of Holding No. of Holders
1 – 1,000 171
1,001 – 5,000 297
5,001 – 10,000 451
10,001 – 100,000 827
100,001 and over 238
Total number of shareholders 1,984Number holding less than a marketable parcel 307
Largest Twenty Shareholders
The largest twenty shareholders held 172,262,609 ordinary shares being 59.342% of the issued ordinary capital.
Name of ShareholderNumber of
Shares Held% of
Issued Capital
Martin Place Securities Nominees Pty Ltd 53,020,486 18.265
Canning Oil Pty Ltd 25,709,116 8.856
HSBC Custody Nominees (Australia) Limited 13,266,332 4.570
Mr David A Mortimer & Mrs Barbara L Mortimer 11,335,339 3.905
Lippo Securities Ltd 11,332,500 3.904
Petroleum Securities Share Plan Pty Limited 6,700,000 2.308
Citicorp Nominees Pty Limited 5,493,050 1.892
Martin Place Securities Nominees Pty Ltd <Gulf Stream A/c> 5,308,549 1.829
National Nominees Limited 4,968,585 1.712
Mr Edward Gacka & Mrs Beryl Gacka 4,813,000 1.658
Kirman 2 Pty Ltd 4,129,700 1.423
ABN AMRO Clearing Sydney Nominees Pty Ltd 3,988,452 1.374
Mr Peter Gacka & Mrs Jenny Gacka 3,692,500 1.272
Hestian Pty Ltd 3,127,843 1.077
Den Duyts Corporation Pty Ltd 3,057,635 1.053
Ms Dan Luo 2,649,943 0.913
Mr David Lindsay Elsworth 2,500,000 0.861
Calveston Worldwide Ltd 2,460,000 0.847
Sino Champion Development Limited 2,459,579 0.847
Asian Corporate Advisers (BVI) Limited 2,250,000 0.775
Substantial shareholders disclosed in substantial shareholder notices given to the Company are as follows:Canning Oil Pty Ltd including its associates 37,876,361 13.048
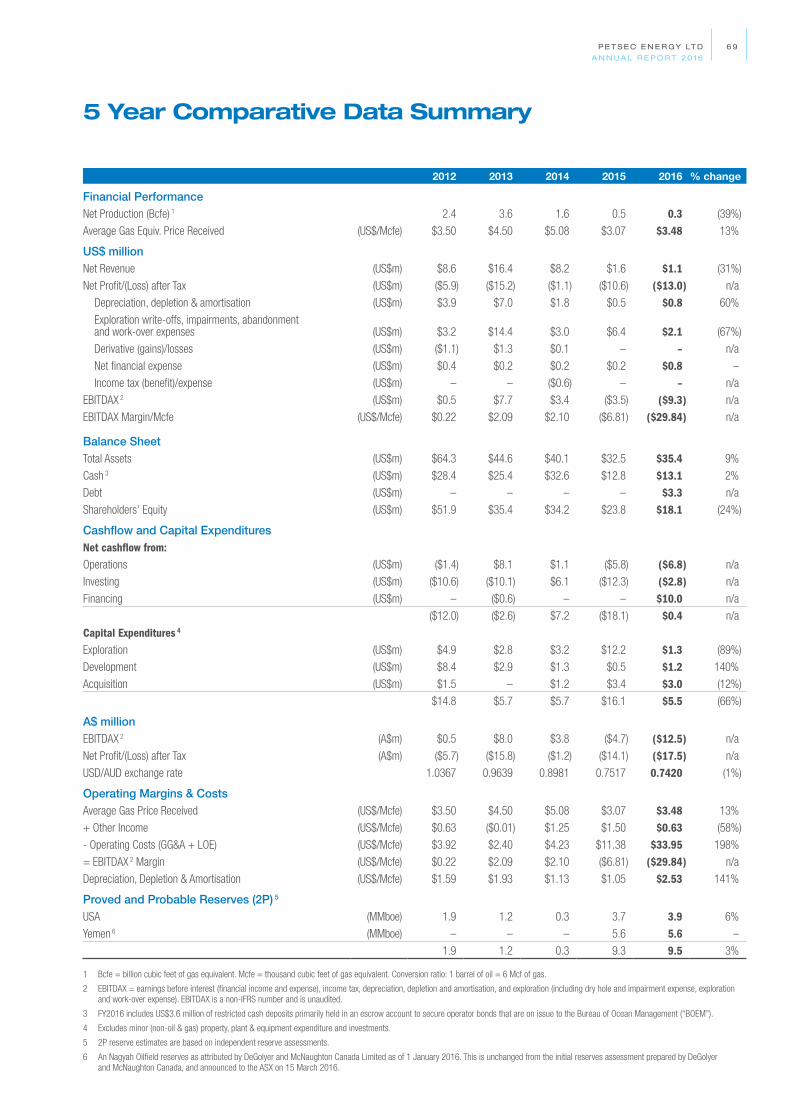
P E T S E C E N E R GY LT D
A N N UA L R E P O R T 20 16
6 9
5 Year Comparative Data Summary
2012 2013 2014 2015 2016 % change
Financial PerformanceNet Production (Bcfe) 1 2.4 3.6 1.6 0.5 0.3 (39%)
Average Gas Equiv. Price Received (US$/Mcfe) $3.50 $4.50 $5.08 $3.07 $3.48 13%
US$ millionNet Revenue (US$m) $8.6 $16.4 $8.2 $1.6 $1.1 (31%)
Net Profit/(Loss) after Tax (US$m) ($5.9) ($15.2) ($1.1) ($10.6) ($13.0) n/a
Depreciation, depletion & amortisation (US$m) $3.9 $7.0 $1.8 $0.5 $0.8 60%
Exploration write-offs, impairments, abandonment and work-over expenses (US$m) $3.2 $14.4 $3.0 $6.4 $2.1 (67%)
Derivative (gains)/losses (US$m) ($1.1) $1.3 $0.1 – – n/a
Net financial expense (US$m) $0.4 $0.2 $0.2 $0.2 $0.8 –
Income tax (benefit)/expense (US$m) – – ($0.6) – – n/a
EBITDAX 2 (US$m) $0.5 $7.7 $3.4 ($3.5) ($9.3) n/a
EBITDAX Margin/Mcfe (US$/Mcfe) $0.22 $2.09 $2.10 ($6.81) ($29.84) n/a
Balance SheetTotal Assets (US$m) $64.3 $44.6 $40.1 $32.5 $35.4 9%
Cash 3 (US$m) $28.4 $25.4 $32.6 $12.8 $13.1 2%
Debt (US$m) – – – – $3.3 n/a
Shareholders’ Equity (US$m) $51.9 $35.4 $34.2 $23.8 $18.1 (24%)
Cashflow and Capital ExpendituresNet cashflow from:Operations (US$m) ($1.4) $8.1 $1.1 ($5.8) ($6.8) n/a
Investing (US$m) ($10.6) ($10.1) $6.1 ($12.3) ($2.8) n/a
Financing (US$m) – ($0.6) – – $10.0 n/a
($12.0) ($2.6) $7.2 ($18.1) $0.4 n/a
Capital Expenditures 4
Exploration (US$m) $4.9 $2.8 $3.2 $12.2 $1.3 (89%)
Development (US$m) $8.4 $2.9 $1.3 $0.5 $1.2 140%
Acquisition (US$m) $1.5 – $1.2 $3.4 $3.0 (12%)
$14.8 $5.7 $5.7 $16.1 $5.5 (66%)
A$ millionEBITDAX 2 (A$m) $0.5 $8.0 $3.8 ($4.7) ($12.5) n/a
Net Profit/(Loss) after Tax (A$m) ($5.7) ($15.8) ($1.2) ($14.1) ($17.5) n/a
USD/AUD exchange rate 1.0367 0.9639 0.8981 0.7517 0.7420 (1%)
Operating Margins & CostsAverage Gas Price Received (US$/Mcfe) $3.50 $4.50 $5.08 $3.07 $3.48 13%
+ Other Income (US$/Mcfe) $0.63 ($0.01) $1.25 $1.50 $0.63 (58%)
- Operating Costs (GG&A + LOE) (US$/Mcfe) $3.92 $2.40 $4.23 $11.38 $33.95 198%
= EBITDAX 2 Margin (US$/Mcfe) $0.22 $2.09 $2.10 ($6.81) ($29.84) n/a
Depreciation, Depletion & Amortisation (US$/Mcfe) $1.59 $1.93 $1.13 $1.05 $2.53 141%
Proved and Probable Reserves (2P) 5
USA (MMboe) 1.9 1.2 0.3 3.7 3.9 6%
Yemen 6 (MMboe) – – – 5.6 5.6 –
1.9 1.2 0.3 9.3 9.5 3%
1 Bcfe = billion cubic feet of gas equivalent. Mcfe = thousand cubic feet of gas equivalent. Conversion ratio: 1 barrel of oil = 6 Mcf of gas.
2 EBITDAX = earnings before interest (financial income and expense), income tax, depreciation, depletion and amortisation, and exploration (including dry hole and impairment expense, exploration and work-over expense). EBITDAX is a non-IFRS number and is unaudited.
3 FY2016 includes US$3.6 million of restricted cash deposits primarily held in an escrow account to secure operator bonds that are on issue to the Bureau of Ocean Management (“BOEM”).
4 Excludes minor (non-oil & gas) property, plant & equipment expenditure and investments.
5 2P reserve estimates are based on independent reserve assessments.
6 An Nagyah Oilfield reserves as attributed by DeGolyer and McNaughton Canada Limited as of 1 January 2016. This is unchanged from the initial reserves assessment prepared by DeGolyer and McNaughton Canada, and announced to the ASX on 15 March 2016.

P E T S E C E N E R GY LT D
A N N UA L R E P O R T 20 16
70 P E T S E C E N E R GY LT D
A N N UA L R E P O R T 20 16
70
5 Year Comparative Data Summary
Production history by Field (USA)
Bcfe
0
1.0
2.0
3.0
4.0Forecast 2017*
* Forecast production from existing USA producing fields only and initial Hummer discovery well
2012 2013 2014 2016 20172015
Onshore LouisianaMain Pass 19/18Main Pass 270 Chandeler 31/32
Atchafalaya Bay
EBITDAX, Net Revenue & Average Sales Price Received/Mcfe
US$ Million / US$
10
-10
20
2012 2013 2014
EBITDAX Net Revenue Average Sales Price Received per Mcfe
2015 2016
0US$1.1m
US$3.48 /Mcfe
(US$9.3m) 2.0
3.0
4.0
5.0
6.0
Wells Drilled/Successful 40% success rate – 5 years to 2016
Number of wells
2.0
4.0
6.0
8.0
2012 2013 2014 2015
Successful Unsuccessful
2016
0
1
2
3
4
5
6
7
8
0
Balance Sheet Equity and Total Assets
US$ Million
20
40
60
80
2015 20162012 2013 20140
Equity Total Assets
$US18.1m$US35.4m
Exploration, Development and Acquisition Expenditure
US$ Million
24
14
2016
6
108
12
1816
2012 2013 2014 2015
Exploration Development Acquisition
US$3.0m
US$1.2m
US$1.3m
0
Year End Independently Assessed Proved and Probable Reserves
MMboe
6.0
2.0
4.0
8.0
10.0
2015 20162012 2013 2014
9.5
5.6
3.9
0.0
USA Yemen
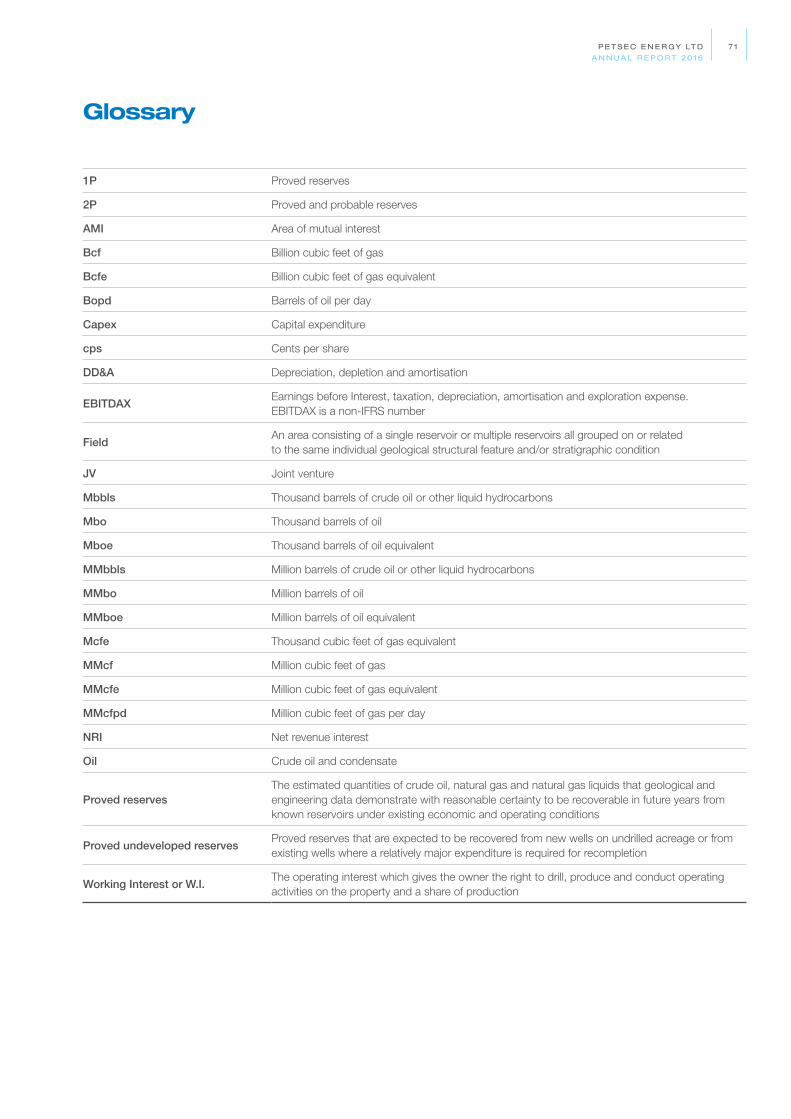
P E T S E C E N E R GY LT D
A N N UA L R E P O R T 20 16
7 1
Glossary
1P Proved reserves
2P Proved and probable reserves
AMI Area of mutual interest
Bcf Billion cubic feet of gas
Bcfe Billion cubic feet of gas equivalent
Bopd Barrels of oil per day
Capex Capital expenditure
cps Cents per share
DD&A Depreciation, depletion and amortisation
EBITDAX Earnings before Interest, taxation, depreciation, amortisation and exploration expense. EBITDAX is a non-IFRS number
Field An area consisting of a single reservoir or multiple reservoirs all grouped on or related to the same individual geological structural feature and/or stratigraphic condition
JV Joint venture
Mbbls Thousand barrels of crude oil or other liquid hydrocarbons
Mbo Thousand barrels of oil
Mboe Thousand barrels of oil equivalent
MMbbls Million barrels of crude oil or other liquid hydrocarbons
MMbo Million barrels of oil
MMboe Million barrels of oil equivalent
Mcfe Thousand cubic feet of gas equivalent
MMcf Million cubic feet of gas
MMcfe Million cubic feet of gas equivalent
MMcfpd Million cubic feet of gas per day
NRI Net revenue interest
Oil Crude oil and condensate
Proved reserves The estimated quantities of crude oil, natural gas and natural gas liquids that geological and engineering data demonstrate with reasonable certainty to be recoverable in future years from known reservoirs under existing economic and operating conditions
Proved undeveloped reservesProved reserves that are expected to be recovered from new wells on undrilled acreage or from existing wells where a relatively major expenditure is required for recompletion
Working Interest or W.I.The operating interest which gives the owner the right to drill, produce and conduct operating activities on the property and a share of production

P E T S E C E N E R GY LT D
A N N UA L R E P O R T 20 16
7 2 P E T S E C E N E R GY LT D
A N N UA L R E P O R T 20 16
7 2
Board of Directors
Terrence N Fern – Chairman and Managing DirectorDavid A Mortimer – Non-executive DirectorAlan P Baden – Non-executive Director
Company Secretary
Paul Gahdmar
Australian Management
Terrence N Fern – Chairman and Managing DirectorPaul Gahdmar – Company Secretary and Group Financial ControllerManny Anton – Head of Investor Relations & Corporate Development
MENA Management
Maki M Petkovski – Chief Executive Officer of Petsec Energy (Middle Eastern) Limited (“PEMEL”)Murray R Hawkes – Chief Operating Officer & Yemen General Manager of PEMELJohn L Rees – Vice President Technical of PEMEL
USA Management
Richard J Smith – Chief Executive Officer of Petsec Energy Inc. (“PEI”)Ross A Keogh – President of PEI and Group Chief Financial OfficerRon A Krenzke – Executive Vice President of Exploration of PEI
Registered Office and Principal Business Office
Level 27Governor Macquarie TowerOne Farrer PlaceTelephone: + 61 2 9247 4605Facsimile: + 61 2 9251 2410
MENA Offices
Indigo Icon Tower, Suite 2908Dubai, United Arab EmiratesTelephone: +971 4 454 7714Facsimile: +971 4 451 8443
6th Floor, Libyan Trade CenterAlgeria (ST),Sana’a, YemenTelephone: +967 1 448392Facsimile: +967 1 448368
USA Offices
1201 Louisiana, Suite 520Houston, TX 77002Telephone: +1 713 457 5800Facsimile: +1 713 457 5838
301 E. Kaliste Saloom RoadSuite 300, LafayetteLA 70508 USATelephone: +1 337 989 1942Facsimile: +1 337 989 7271
Share Register
Boardroom Pty LimitedLevel 12, 225 George Street, Sydney NSW 2000 Australia
Postal: GPO Box 3993, Sydney NSW 2001
Telephone: 1300 737 760International: + 61 2 9290 9600Facsimile: 1300 653 459International: + 61 2 9279 0664Email: [email protected]
Depositary Receipts Register
The Bank of New York6th Floor, 620 Avenue of the AmericasNew York NY 10011 USATelephone: + 1 646 885 3300Facsimile: + 1 646 885 3043
Auditors
KPMG AustraliaLevel 38, Tower ThreeInternational Towers Sydney300 Barangaroo AvenueSydney NSW 2000 Australia
Stock Exchange
Listed on the Australian Stock Exchange, Symbol: PSATraded in USA on ADRs, Symbol: PSJEY
For further information
Web: www.petsec.com.au
Corporate Directory

C R E AT E D BY D E S I G N AT E

P E T S E C.C O M . AU