Embed Size (px)
Citation preview
Order Code RL32248
Petroleum Refining: Economic Performance and
Challenges for the Future
Updated June 3, 2008
Robert PirogSpecialist in Energy Economics
Resources, Science, and Industry Division
Petroleum Refining: Economic Performance and Challenges for the Future
Summary
The petroleum refining industry provides products that are critical to thefunctioning of the economy. Virtually all transportation, land, sea, and air, is fueledby products that are refined from crude oil. Industrial, residential, and commercialactivities, as well as electricity generation, use petroleum-based products. Along withvolatile changes in crude oil prices, the industry has faced evolving health, safety,and environmental requirements which have changed and multiplied productspecifications and required capital investment in refineries.
Since the late 1990s, the industry has undergone significant structural changewhich might alter its profitability requirements, its ability to provide stable productvolumes to the consuming market, and its ability to adapt to current and futureenvironmental requirements.
Two significant structural changes characterize the industry. Mergers,acquisitions, and joint ventures have changed the ownership profile of the industry,altering concentration patterns both regionally and nationally. A change in thebusiness model from an integrated component, to a stand-alone profit center, hasfocused attention on earning competitive profit rates at each stage in the productionchain. Evidence suggests that the new market structure and business model mightdemand better economic performance from the industry. Regulatory compliance tomeet congressionally mandated environmental standards, both on refined productsand refinery sites, requires substantial capital investment by refiners, and has resultedin reduced profitability, according to the Energy Information Administration (EIA).To the extent that continued capacity expansion and technological investments arereduced, or not undertaken, because of low historical rates of return (even thoughrecent returns are higher) U.S. dependence on imported refined products mightincrease, or product markets could be disrupted by shortages and price spikes.
As the 110th Congress considers energy legislation, it is likely to be concernedwith domestic energy security and market stability, issues linked to the performanceof the petroleum refining industry. Increased imports of refined products, particularlymotor gasoline, combined with growing imports of crude oil, could make the UnitedStates increasingly vulnerable to shocks originating in the world oil market.Importing motor gasoline into the United States in appropriate volumes may becomeincreasingly difficult because of the unavailability of world supplies consistent withU.S. fuel specification requirements.
This report will be updated.
Contents
Refining Economics . . . . . . . . . . . . . . . . . . . . . . . . . . . . . . . . . . . . . . . . . . . . . . . . 2
Defining Profitability . . . . . . . . . . . . . . . . . . . . . . . . . . . . . . . . . . . . . . . . . . . . . . . 5
Performance of the Refining Industry . . . . . . . . . . . . . . . . . . . . . . . . . . . . . . . . . . 7
Changing Structure of U.S. Refining Industry . . . . . . . . . . . . . . . . . . . . . . . . . . . 12
Challenges Facing the Refining Industry . . . . . . . . . . . . . . . . . . . . . . . . . . . . . . . 18Environmental Requirements . . . . . . . . . . . . . . . . . . . . . . . . . . . . . . . . . . . . 18Capital Investment . . . . . . . . . . . . . . . . . . . . . . . . . . . . . . . . . . . . . . . . . . . . 19Production and Growth . . . . . . . . . . . . . . . . . . . . . . . . . . . . . . . . . . . . . . . . 22Imports . . . . . . . . . . . . . . . . . . . . . . . . . . . . . . . . . . . . . . . . . . . . . . . . . . . . . 23Permits and Regulatory Uncertainty . . . . . . . . . . . . . . . . . . . . . . . . . . . . . . 25
Conclusions . . . . . . . . . . . . . . . . . . . . . . . . . . . . . . . . . . . . . . . . . . . . . . . . . . . . . 26
List of Figures
Figure 1. U.S. Refining Capital Expenditures for FRS Companies, 1988-2001 21
List of Tables
Table 1. U.S. Real Price Spread Between Light Crude Oil and Heavy Crude Oil, 1983-2007 . . . . . . . . . . . . . . . . . . . . . . . . . . . . . . . . . . . . . . . . . . . . . . . . . . . 3
Table 2. U.S. Real Price Spread Between Motor Gasoline and Residual Fuel Oil, 1983-2007 . . . . . . . . . . . . . . . . . . . . . . . . . . . . . . . . . . . . . . . . . . . . . . . . . . . 4
Table 3. Refining Margins of U.S. Major Oil Refiners, 1993-2006 . . . . . . . . . . . 7Table 4. U.S. Refinery Output,1991-2006 . . . . . . . . . . . . . . . . . . . . . . . . . . . . . . 8Table 5. Domestic Refining/Marketing Return on Investment for FRS
Companies, 1991-2006 . . . . . . . . . . . . . . . . . . . . . . . . . . . . . . . . . . . . . . . . 10Table 6. Refinery Capacity and Utilization, 1991-2006 . . . . . . . . . . . . . . . . . . . 11Table 7. U.S. Refining/Marketing Net Income, 1995-2005 . . . . . . . . . . . . . . . . 12Table 8. Top Twenty U.S. Refiners, 1980-2005 . . . . . . . . . . . . . . . . . . . . . . . . . 14Table 9. Refining Concentration by PADD . . . . . . . . . . . . . . . . . . . . . . . . . . . . 16Table 10. Imports of Petroleum Products, 1992-2006 . . . . . . . . . . . . . . . . . . . . 24
Petroleum Refining: Economic Performance and Challenges for the Future
The petroleum refining industry processes crude oil and produces a variety ofproducts that are used in the transportation, residential, commercial, and industrialsectors of the economy. In 2007, over two thirds of refinery output went totransportation uses, nearly a quarter went to industrial uses, and the remainder wasused in residences, commercial activities, and electricity generation. Thetransportation sector remains the most heavily dependent on petroleum, drawing over95% of its fuel needs from refineries.
Because the refining industry plays such a key role in providing energy for theU.S. economy, its structure and economic condition are matters of national interest.In recent years, the industry has undergone significant change. The traditionalindustry model, based on ownership by vertically integrated oil companies withprofitability viewed within the context of a linked supply chain, has been altered bycompanies and joint ventures whose primary business is refining. Increasingly, thebusiness model for these firms, as well as the integrated oil companies, is the stand-alone profit center. Refiners now must earn market rates of return for investors, aswell as returns sufficient to make investments in expansion, technologicalimprovements, possible business restructuring, and to meet environmentalregulations, both with respect to refined product specifications and refinery siteoperations and expansion.
Should the industry fail to meet these market-based performance standards,policy makers may be faced with the prospect of weighing the costs and benefits ofdecisions taken to mitigate supply and price volatility, especially in gasolinemarkets. If the industry determines that it is unable to invest sufficiently to meetprojected demand increases, additional supplies of refined products will likely beimported. If imports were to increase significantly, policy makers might need toprioritize the needs of the local markets within the context of national energy securitygoals. The ability of the refining industry to meets its economic challenges willlikely determine, in part, the nature of the energy challenges facing Congress. Thisreport seeks to describe the recent performance of the refining industry, to evaluatethe structural changes that are occurring in the industry, and to analyze the nature andeffects of the challenges confronting the industry.
CRS-2
Refining Economics
When considering the economic performance of a petroleum refiner, severalcharacteristics should be noted. First, the production process is capital intensive, andtechnological improvements are embodied through investments in the basic refinery.As a result, any circumstance which affects the availability, or allocation, of capitalinvestment can have significant structural effects on the firm and the industry.Second, the major variable cost in the production process is crude oil, the price ofwhich is determined in the world petroleum market. Third, while labor and othervariable costs are relatively small fractions of total costs, a great deal of attention isgiven to minimizing them in the interests of enhancing profit margins. Finally,regulatory costs, both capital and operational, required to meet congressionallymandated environmental standards on both refined products and refinery sites,increase as new requirements are phased in.
Evaluating the economic performance of the petroleum refining industry iscomplicated by the fact that many refineries can use crude oil of lower quality as aninput, while others cannot. Crude oil can be of lighter or heavier density, as well ashaving a higher or lower sulfur content. The density of the crude oil is importantbecause, in general, a lighter crude oil input yields a lighter product mix. A lighterproduct mix is important because lighter products are generally in higher demand,and yield higher prices for the refiner.
Does this mean, then, that refineries that are able should always use the lightestcrude oil available? Not necessarily, if the crude oil market pricing mechanism isworking well. The market compensates for differences in the quality of crude oil bya price differential, the light-heavy price spread. However, at any given time, theactual, specific spread value for any set of crude oils is also influenced by relativeavailability on the world market as well as the location of the oil. As a result, thevalue of the spread changes, and, at any given time, the purchase of either light orheavy crude might be warranted by economic conditions, if technologically feasiblefor the refiner.
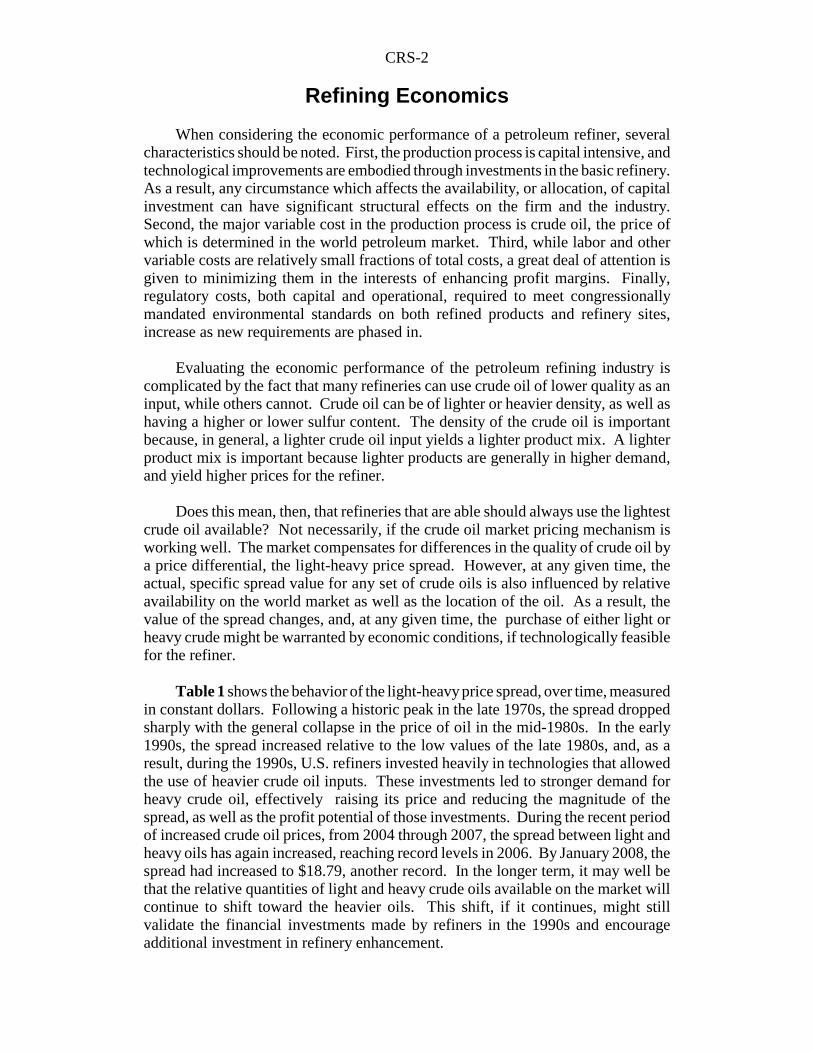
Table 1 shows the behavior of the light-heavy price spread, over time, measuredin constant dollars. Following a historic peak in the late 1970s, the spread droppedsharply with the general collapse in the price of oil in the mid-1980s. In the early1990s, the spread increased relative to the low values of the late 1980s, and, as aresult, during the 1990s, U.S. refiners invested heavily in technologies that allowedthe use of heavier crude oil inputs. These investments led to stronger demand forheavy crude oil, effectively raising its price and reducing the magnitude of thespread, as well as the profit potential of those investments. During the recent periodof increased crude oil prices, from 2004 through 2007, the spread between light andheavy oils has again increased, reaching record levels in 2006. By January 2008, thespread had increased to $18.79, another record. In the longer term, it may well bethat the relative quantities of light and heavy crude oils available on the market willcontinue to shift toward the heavier oils. This shift, if it continues, might stillvalidate the financial investments made by refiners in the 1990s and encourageadditional investment in refinery enhancement.
CRS-3
1 Energy Information Administration, “Petroleum Marketing Monthly”, March 2007, Tables35, 42. Calculation of averages by the author.
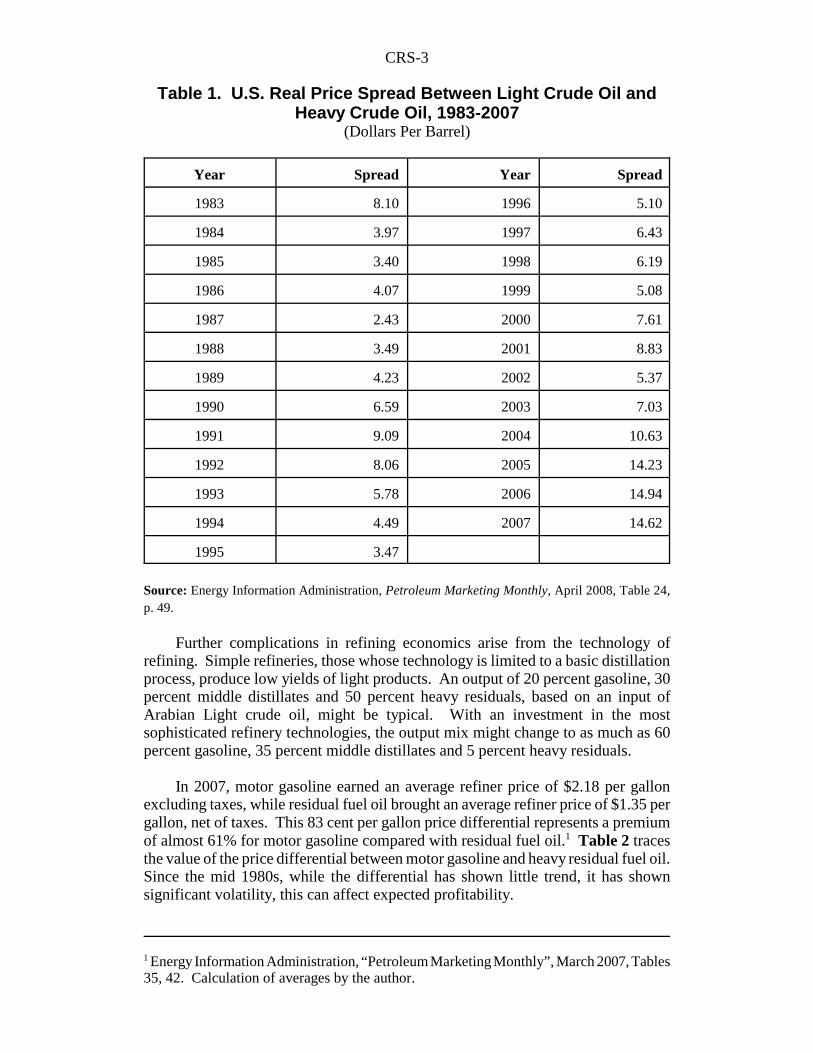
Table 1. U.S. Real Price Spread Between Light Crude Oil andHeavy Crude Oil, 1983-2007
(Dollars Per Barrel)
Year Spread Year Spread
1983 8.10 1996 5.10
1984 3.97 1997 6.43
1985 3.40 1998 6.19
1986 4.07 1999 5.08
1987 2.43 2000 7.61
1988 3.49 2001 8.83
1989 4.23 2002 5.37
1990 6.59 2003 7.03
1991 9.09 2004 10.63
1992 8.06 2005 14.23
1993 5.78 2006 14.94
1994 4.49 2007 14.62
1995 3.47
Source: Energy Information Administration, Petroleum Marketing Monthly, April 2008, Table 24,p. 49.
Further complications in refining economics arise from the technology ofrefining. Simple refineries, those whose technology is limited to a basic distillationprocess, produce low yields of light products. An output of 20 percent gasoline, 30percent middle distillates and 50 percent heavy residuals, based on an input ofArabian Light crude oil, might be typical. With an investment in the mostsophisticated refinery technologies, the output mix might change to as much as 60percent gasoline, 35 percent middle distillates and 5 percent heavy residuals.
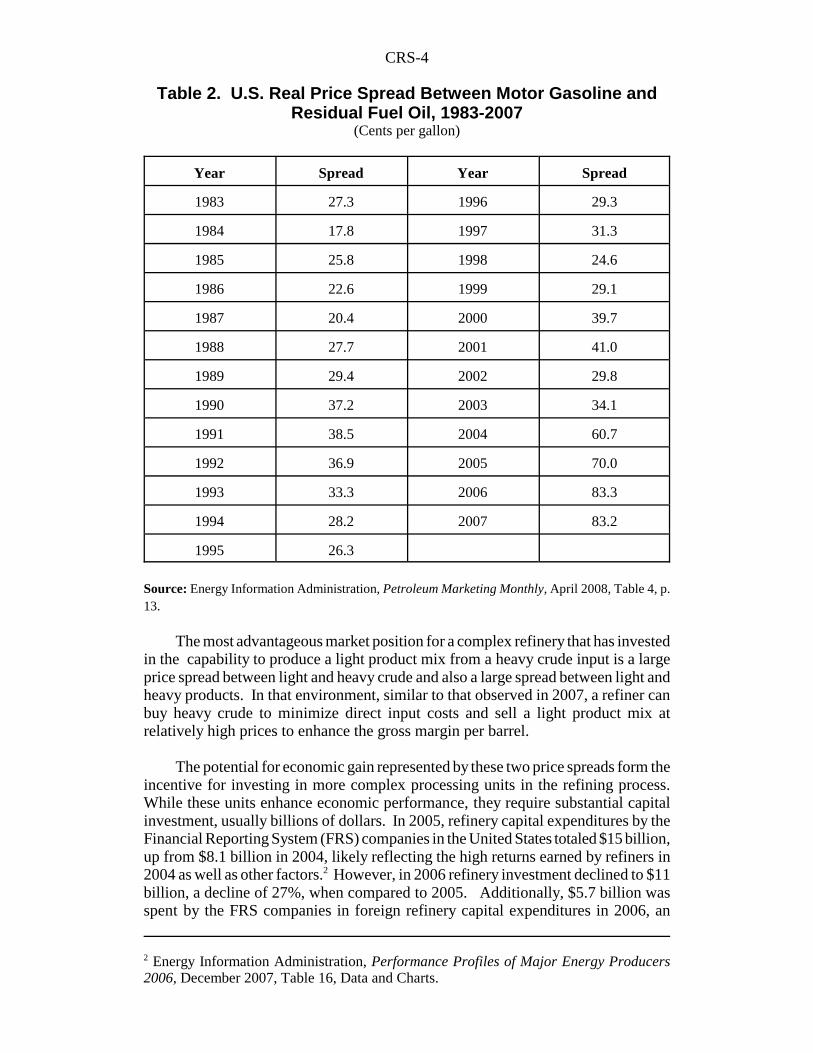
In 2007, motor gasoline earned an average refiner price of $2.18 per gallonexcluding taxes, while residual fuel oil brought an average refiner price of $1.35 pergallon, net of taxes. This 83 cent per gallon price differential represents a premiumof almost 61% for motor gasoline compared with residual fuel oil.1 Table 2 tracesthe value of the price differential between motor gasoline and heavy residual fuel oil.Since the mid 1980s, while the differential has shown little trend, it has shownsignificant volatility, this can affect expected profitability.
CRS-4
2 Energy Information Administration, Performance Profiles of Major Energy Producers2006, December 2007, Table 16, Data and Charts.
Table 2. U.S. Real Price Spread Between Motor Gasoline andResidual Fuel Oil, 1983-2007
(Cents per gallon)
Year Spread Year Spread
1983 27.3 1996 29.3
1984 17.8 1997 31.3
1985 25.8 1998 24.6
1986 22.6 1999 29.1
1987 20.4 2000 39.7
1988 27.7 2001 41.0
1989 29.4 2002 29.8
1990 37.2 2003 34.1
1991 38.5 2004 60.7
1992 36.9 2005 70.0
1993 33.3 2006 83.3
1994 28.2 2007 83.2
1995 26.3
Source: Energy Information Administration, Petroleum Marketing Monthly, April 2008, Table 4, p.13.
The most advantageous market position for a complex refinery that has investedin the capability to produce a light product mix from a heavy crude input is a largeprice spread between light and heavy crude and also a large spread between light andheavy products. In that environment, similar to that observed in 2007, a refiner canbuy heavy crude to minimize direct input costs and sell a light product mix atrelatively high prices to enhance the gross margin per barrel.
The potential for economic gain represented by these two price spreads form theincentive for investing in more complex processing units in the refining process.While these units enhance economic performance, they require substantial capitalinvestment, usually billions of dollars. In 2005, refinery capital expenditures by theFinancial Reporting System (FRS) companies in the United States totaled $15 billion,up from $8.1 billion in 2004, likely reflecting the high returns earned by refiners in2004 as well as other factors.2 However, in 2006 refinery investment declined to $11billion, a decline of 27%, when compared to 2005. Additionally, $5.7 billion wasspent by the FRS companies in foreign refinery capital expenditures in 2006, an
CRS-5
3 Energy Information Administration, Performance Profiles of Major Energy Producers,2006, December 2007, Table 16, Data and Charts.4 The FRS companies are those major energy companies that report to the EnergyInformation Administration’s Financial Reporting System (FRS). To be included as a majorenergy company the firm must satisfy at least one of the following: control at least 1% ofU.S. crude oil production or reserves, control at least 1% of U.S. natural gas production orreserves, or control at least 1% of U.S. crude oil distillation capacity or product sales. In2001 the FRS companies share of refined product output was 85%.
increase of 88%.3 Not all of this amount was for technological improvements orcapacity expansion; environmental based investment is also included.4
An additional factor in refining economics is crude oil sulfur content, definedto also include the presence of heavy metals and contaminants. Low sulfur crude oilis said to be “sweet” while crude oil with a high sulfur content is said to be “sour.”Low sulfur crude oil sells at a premium compared to higher sulfur crude oil, becausesubstantial investment must be made at the refinery to reduce the sulfur content ofthe product mix. These two factors, crude oil density and sulfur content, takentogether, determine the quality differential in crude oil prices. At any point in time,refiners strive to run an optimal mix of crude oils through their refineries. Theoptimal mix depends on the state of the refineries’ equipment and technology, thedesired output product mix, and the price spreads on available crude oils andproducts. In the longer term, the refiner must decide whether to continue to investin new technologies as they become available, based on expected future values ofthese factors.
Defining Profitability
Measures of economic performance in the refining industry usually begin withthe gross margin. The gross margin is defined as the difference between thewholesale composite product price and the composite refiner acquisition cost ofcrude oil. Both the product price and the acquisition cost of crude oil must becomposites, or weighted averages, because they reflect the multi-product nature ofrefinery output as well as the multi-grade character of the crude oils used as refineryinputs. The gross margin is a simple, first approach to refinery profitability. It iscomputed as the total revenues from product sales minus the cost of the largest singleinput in refinery operations, crude oil. However, other inputs are used and they toogenerate costs, which leads to the net margin. The net margin is defined as the grossmargin minus petroleum product marketing costs, internal energy costs and otheroperating costs. Both margins are usually expressed on a per barrel basis.
Over time, crude oil prices have been volatile, reflecting international politicaland economic events. Both margins normally respond inversely to movements in theprice of crude oil. Other things held equal, an increase in crude oil prices wouldreduce a positive margin and a decline in the price of oil would expand the margin.Of course, other things are rarely equal. Changes in the price of crude oil may bepassed on to consumers of petroleum products. However, refiners’ ability to pass onprice increases and maintain sales volumes may not be equal for each component ofthe product mix produced by the refinery. As a result, in practice, margins may
CRS-6
5 The EIA in compiling FRS data defines return on investment as net income earned by theU.S. marketing/refining line of business (excluding unallocated items, mainly interestexpense) as a percentage of net fixed assets involved in U.S. refining and marketing.
increase or decrease when the price of oil increases. Additionally, in some cases, theevent which accounted for the change in crude oil prices might itself alter specificproduct demand levels. For example, when expectations concerning the onset of warin Iraq drove up crude oil prices, they also reduced the demand for air travel, andhence, jet fuel. Lower demand for air travel made it difficult for refiners to pass oncost increases of crude oil while maintaining sales volumes for jet fuel.
As a result of these factors, margins are not stable, or even predictable, duringperiods of crude oil price volatility. The outcome tends to depend on the nature andmagnitude of the crude oil price change as well as the level of demand in the productmarkets. Over time, persistently low margins may have important consequences forthe industry. Low margins may lead to reduced refinery investment which ultimatelycan lead to constrained domestic capacity and higher product prices. But lowmargins also put pressure on refiners to reduce operating costs and spread fixed costsover larger production runs in an effort to enhance margins.
The relationships between crude oil quality, product price mix, andtechnological improvement make capital investment management important to therefining industry. In refining, there are several competing demands for investmentfunds. Capacity expansion is necessary to keep pace with growing demand. Sitinga new refinery is a long and expensive process. As a result, virtually all U.S.capacity expansion in the last decade or more has come from enhancing andmodifying existing refineries. Technological investments can improve refineryeconomics by allowing refiners to use cheaper heavy, sour, crude oils as inputs andstill produce a light, high value mix of products. Finally, investment must beundertaken to keep both the refinery site and the products it produces in compliancewith evolving environmental standards. The issues surrounding refinery investmentare covered later in this report.
The most widely used measure of economic performance in the refining industryis return on investment (ROI).5 As with the gross and net margins, assessing thismeasure requires care. First, refining returns are usually reported together withreturns from marketing, largely determined by motor vehicle gasoline retail sales.Marketing net income can also be affected by credit card business performance andconvenience store profits, neither of which is directly associated with the corebusiness of refining petroleum products. Second, depending on accountingprocedures and transfer pricing rules, an integrated oil company might report profitas earned in various business activities of the company, contrasted to a companywhose only business is refining. Third, depreciation reduces the net value of assetsover time creating an upward bias in ROI over time for any specified level of netincome. Fourth, business strategy decisions, such as whether to distribute productsat the retail level through company-owned service stations, or through franchises, canalter the measured ROI by affecting the invested capital base.
CRS-7
Performance of the Refining Industry
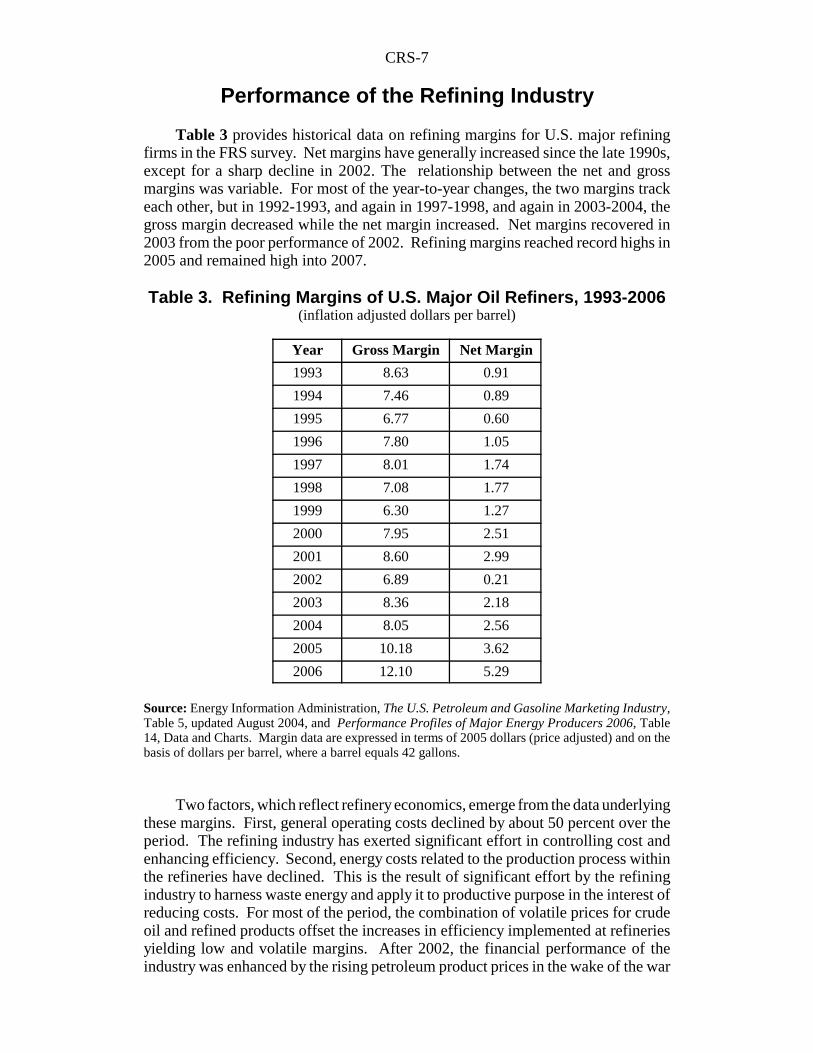
Table 3 provides historical data on refining margins for U.S. major refiningfirms in the FRS survey. Net margins have generally increased since the late 1990s,except for a sharp decline in 2002. The relationship between the net and grossmargins was variable. For most of the year-to-year changes, the two margins trackeach other, but in 1992-1993, and again in 1997-1998, and again in 2003-2004, thegross margin decreased while the net margin increased. Net margins recovered in2003 from the poor performance of 2002. Refining margins reached record highs in2005 and remained high into 2007.
Table 3. Refining Margins of U.S. Major Oil Refiners, 1993-2006(inflation adjusted dollars per barrel)
Year Gross Margin Net Margin
1993 8.63 0.91
1994 7.46 0.89
1995 6.77 0.60
1996 7.80 1.05
1997 8.01 1.74
1998 7.08 1.77
1999 6.30 1.27
2000 7.95 2.51
2001 8.60 2.99
2002 6.89 0.21
2003 8.36 2.18
2004 8.05 2.56
2005 10.18 3.62
2006 12.10 5.29
Source: Energy Information Administration, The U.S. Petroleum and Gasoline Marketing Industry,Table 5, updated August 2004, and Performance Profiles of Major Energy Producers 2006, Table14, Data and Charts. Margin data are expressed in terms of 2005 dollars (price adjusted) and on thebasis of dollars per barrel, where a barrel equals 42 gallons.
Two factors, which reflect refinery economics, emerge from the data underlyingthese margins. First, general operating costs declined by about 50 percent over theperiod. The refining industry has exerted significant effort in controlling cost andenhancing efficiency. Second, energy costs related to the production process withinthe refineries have declined. This is the result of significant effort by the refiningindustry to harness waste energy and apply it to productive purpose in the interest ofreducing costs. For most of the period, the combination of volatile prices for crudeoil and refined products offset the increases in efficiency implemented at refineriesyielding low and volatile margins. After 2002, the financial performance of theindustry was enhanced by the rising petroleum product prices in the wake of the war
CRS-8
in Iraq, demand growth in China and other consuming nations, and the shortages thatresulted from refinery closures in the aftermath of hurricane Katrina.
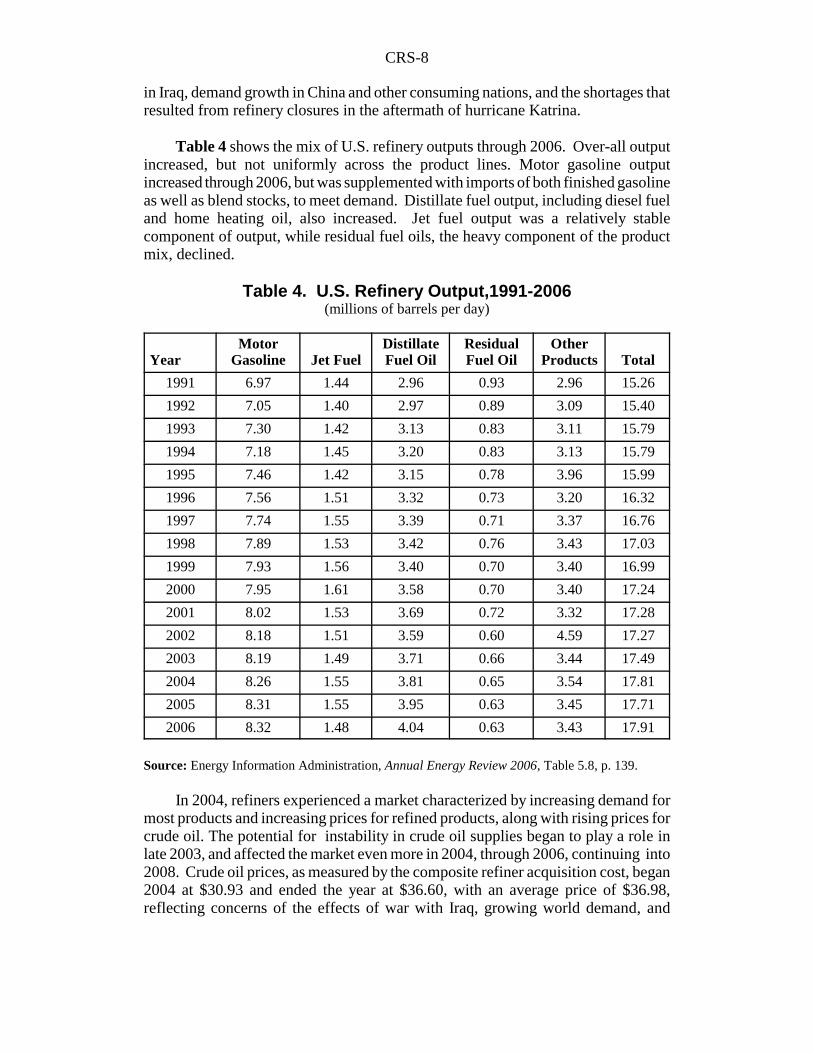
Table 4 shows the mix of U.S. refinery outputs through 2006. Over-all outputincreased, but not uniformly across the product lines. Motor gasoline outputincreased through 2006, but was supplemented with imports of both finished gasolineas well as blend stocks, to meet demand. Distillate fuel output, including diesel fueland home heating oil, also increased. Jet fuel output was a relatively stablecomponent of output, while residual fuel oils, the heavy component of the productmix, declined.
Table 4. U.S. Refinery Output,1991-2006(millions of barrels per day)
YearMotor
Gasoline Jet FuelDistillateFuel Oil
ResidualFuel Oil
OtherProducts Total
1991 6.97 1.44 2.96 0.93 2.96 15.26
1992 7.05 1.40 2.97 0.89 3.09 15.40
1993 7.30 1.42 3.13 0.83 3.11 15.79
1994 7.18 1.45 3.20 0.83 3.13 15.79
1995 7.46 1.42 3.15 0.78 3.96 15.99
1996 7.56 1.51 3.32 0.73 3.20 16.32
1997 7.74 1.55 3.39 0.71 3.37 16.76
1998 7.89 1.53 3.42 0.76 3.43 17.03
1999 7.93 1.56 3.40 0.70 3.40 16.99
2000 7.95 1.61 3.58 0.70 3.40 17.24
2001 8.02 1.53 3.69 0.72 3.32 17.28
2002 8.18 1.51 3.59 0.60 4.59 17.27
2003 8.19 1.49 3.71 0.66 3.44 17.49
2004 8.26 1.55 3.81 0.65 3.54 17.81
2005 8.31 1.55 3.95 0.63 3.45 17.71
2006 8.32 1.48 4.04 0.63 3.43 17.91
Source: Energy Information Administration, Annual Energy Review 2006, Table 5.8, p. 139.
In 2004, refiners experienced a market characterized by increasing demand formost products and increasing prices for refined products, along with rising prices forcrude oil. The potential for instability in crude oil supplies began to play a role inlate 2003, and affected the market even more in 2004, through 2006, continuing into2008. Crude oil prices, as measured by the composite refiner acquisition cost, began2004 at $30.93 and ended the year at $36.60, with an average price of $36.98,reflecting concerns of the effects of war with Iraq, growing world demand, and
CRS-9
6 Petroleum price data from the Energy Information Administration, Petroleum SupplyMonthly, Table 1, Crude Oil Prices, November, 2003. The prices reported by the EIA in thistable are the composite refiner acquisition price of crude oil which is a weighted average ofthe prices refiners paid for domestic as well as imported crude oil.7 Economists define demand to be inelastic when a specified change in price, say a 1%increase, yields a decline in quantity demanded of less than one percent. Petroleum productdemand is more elastic in the longer term, as consumers are more able to adjust theirdecisions to the higher prices.
instability in other oil producing parts of the world.6 While motor gasoline demandfor 2004 increased by about 1%, the price of gasoline increased by about 24%. Jetfuel demand increased by about 4% and the price of jet fuel rose by almost 38%.Distillates demand increased by about 3% while the price increased by about 24%.Residual demand decreased by about 1%, but the average price increased by about6%. Overall, refined product revenues for the FRS companies increased by about26% from 2004 to 2005 and total refined product costs rose by almost 21%.
Data for 2005 and 2006 suggest a much stronger financial performance for therefining industry. Crude oil prices, based on the refiner’s average compositeacquisition cost, averaged over $50 per barrel in 2005, and over $60 per barrel in2006. This led to dramatic spikes in motor gasoline prices and other petroleumproduct prices. The airline industry has continued to show weak demand for jet fuel,but the cold winter periods increased the demand for heating oil, and diesel fueldemand continued to increase. In the short term, the demand for most petroleumproducts appears to be relatively inelastic with respect to price, meaning that therising cost of crude oil can be passed on to consumers with little loss in sales volumeyielding high net income for refiners when oil prices are high.7
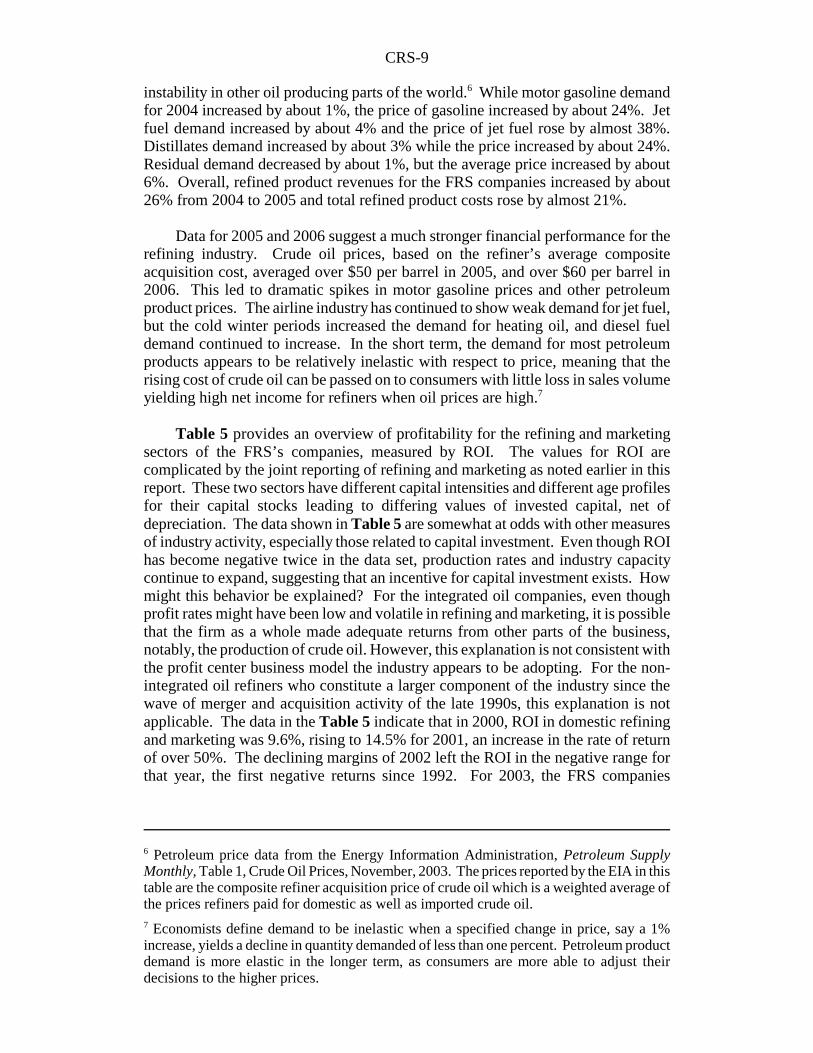
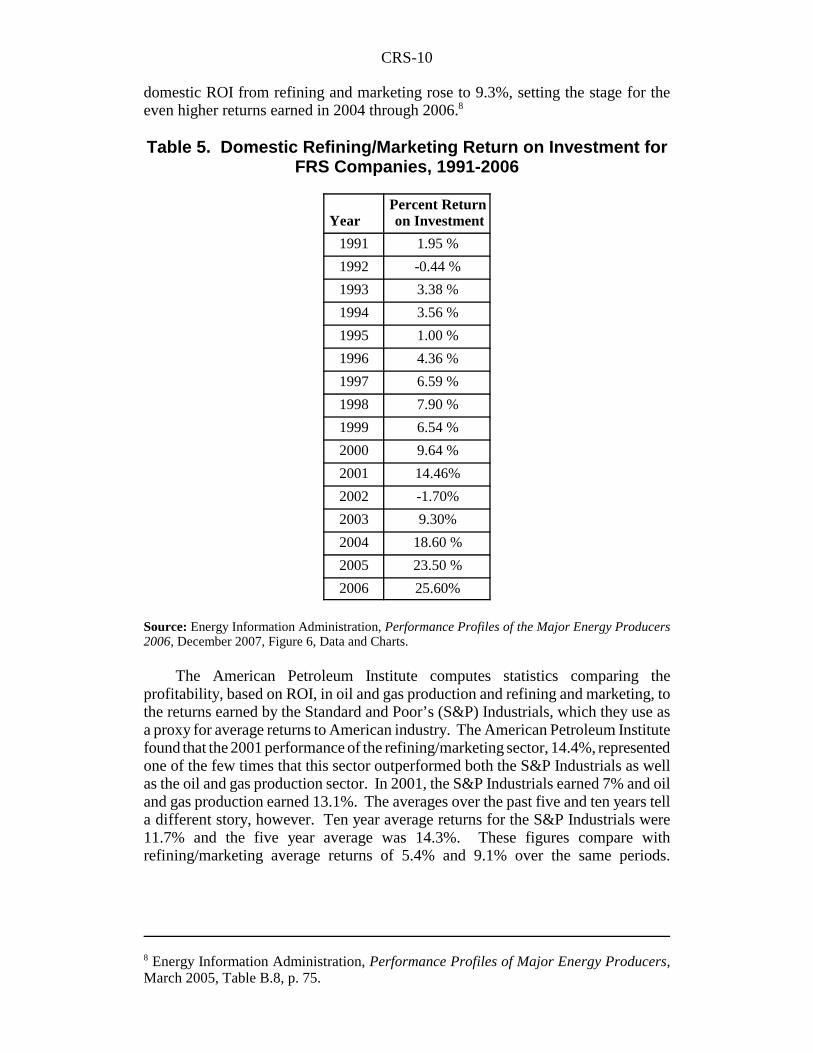
Table 5 provides an overview of profitability for the refining and marketingsectors of the FRS’s companies, measured by ROI. The values for ROI arecomplicated by the joint reporting of refining and marketing as noted earlier in thisreport. These two sectors have different capital intensities and different age profilesfor their capital stocks leading to differing values of invested capital, net ofdepreciation. The data shown in Table 5 are somewhat at odds with other measuresof industry activity, especially those related to capital investment. Even though ROIhas become negative twice in the data set, production rates and industry capacitycontinue to expand, suggesting that an incentive for capital investment exists. Howmight this behavior be explained? For the integrated oil companies, even thoughprofit rates might have been low and volatile in refining and marketing, it is possiblethat the firm as a whole made adequate returns from other parts of the business,notably, the production of crude oil. However, this explanation is not consistent withthe profit center business model the industry appears to be adopting. For the non-integrated oil refiners who constitute a larger component of the industry since thewave of merger and acquisition activity of the late 1990s, this explanation is notapplicable. The data in the Table 5 indicate that in 2000, ROI in domestic refiningand marketing was 9.6%, rising to 14.5% for 2001, an increase in the rate of returnof over 50%. The declining margins of 2002 left the ROI in the negative range forthat year, the first negative returns since 1992. For 2003, the FRS companies
CRS-10
8 Energy Information Administration, Performance Profiles of Major Energy Producers,March 2005, Table B.8, p. 75.
domestic ROI from refining and marketing rose to 9.3%, setting the stage for theeven higher returns earned in 2004 through 2006.8
Table 5. Domestic Refining/Marketing Return on Investment forFRS Companies, 1991-2006
YearPercent Return on Investment
1991 1.95 %
1992 -0.44 %
1993 3.38 %
1994 3.56 %
1995 1.00 %
1996 4.36 %
1997 6.59 %
1998 7.90 %
1999 6.54 %
2000 9.64 %
2001 14.46%
2002 -1.70%
2003 9.30%
2004 18.60 %
2005 23.50 %
2006 25.60%
Source: Energy Information Administration, Performance Profiles of the Major Energy Producers2006, December 2007, Figure 6, Data and Charts.
The American Petroleum Institute computes statistics comparing theprofitability, based on ROI, in oil and gas production and refining and marketing, tothe returns earned by the Standard and Poor’s (S&P) Industrials, which they use asa proxy for average returns to American industry. The American Petroleum Institutefound that the 2001 performance of the refining/marketing sector, 14.4%, representedone of the few times that this sector outperformed both the S&P Industrials as wellas the oil and gas production sector. In 2001, the S&P Industrials earned 7% and oiland gas production earned 13.1%. The averages over the past five and ten years tella different story, however. Ten year average returns for the S&P Industrials were11.7% and the five year average was 14.3%. These figures compare withrefining/marketing average returns of 5.4% and 9.1% over the same periods.
CRS-11
9 Michael A. Lobue, Challenges Facing U.S. Refiners, Presentation at NEMS/AEOConference, March 18, 2003.
Comparable average rates of return for oil and gas production were 8.4% and 10.3%.9
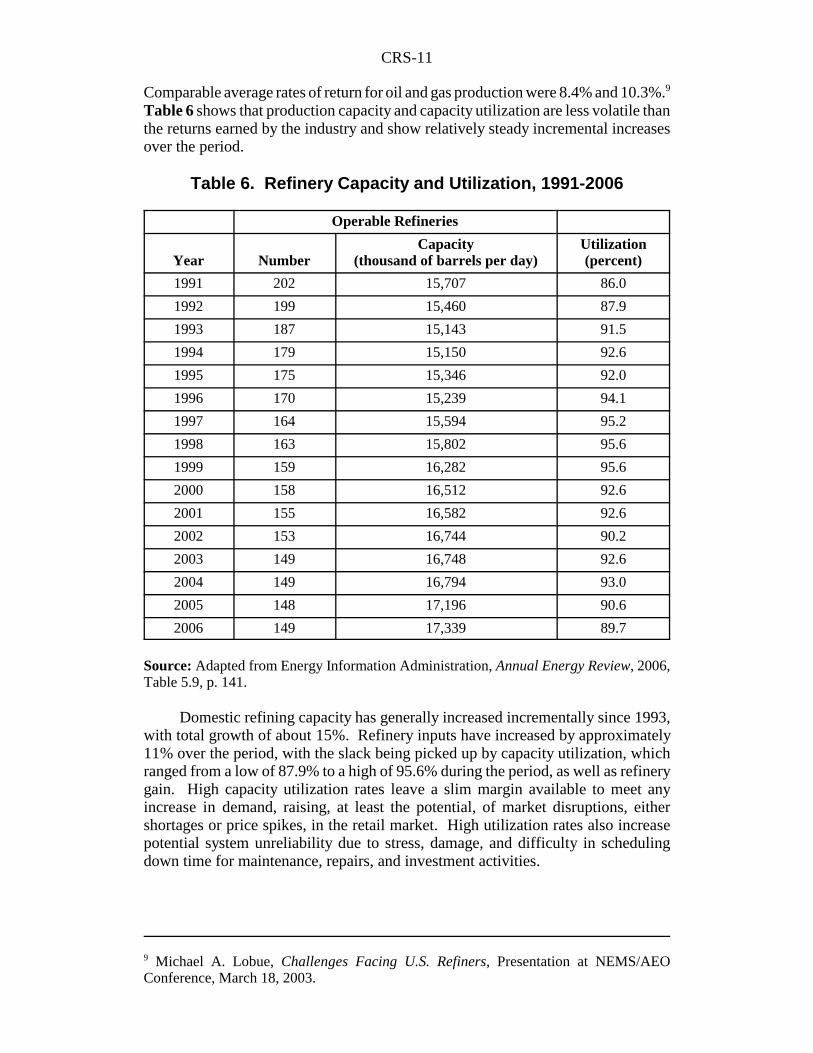
Table 6 shows that production capacity and capacity utilization are less volatile thanthe returns earned by the industry and show relatively steady incremental increasesover the period.
Table 6. Refinery Capacity and Utilization, 1991-2006
Operable Refineries
Year NumberCapacity
(thousand of barrels per day)Utilization(percent)
1991 202 15,707 86.0
1992 199 15,460 87.9
1993 187 15,143 91.5
1994 179 15,150 92.6
1995 175 15,346 92.0
1996 170 15,239 94.1
1997 164 15,594 95.2
1998 163 15,802 95.6
1999 159 16,282 95.6
2000 158 16,512 92.6
2001 155 16,582 92.6
2002 153 16,744 90.2
2003 149 16,748 92.6
2004 149 16,794 93.0
2005 148 17,196 90.6
2006 149 17,339 89.7
Source: Adapted from Energy Information Administration, Annual Energy Review, 2006,Table 5.9, p. 141.
Domestic refining capacity has generally increased incrementally since 1993,with total growth of about 15%. Refinery inputs have increased by approximately11% over the period, with the slack being picked up by capacity utilization, whichranged from a low of 87.9% to a high of 95.6% during the period, as well as refinerygain. High capacity utilization rates leave a slim margin available to meet anyincrease in demand, raising, at least the potential, of market disruptions, eithershortages or price spikes, in the retail market. High utilization rates also increasepotential system unreliability due to stress, damage, and difficulty in schedulingdown time for maintenance, repairs, and investment activities.
CRS-12
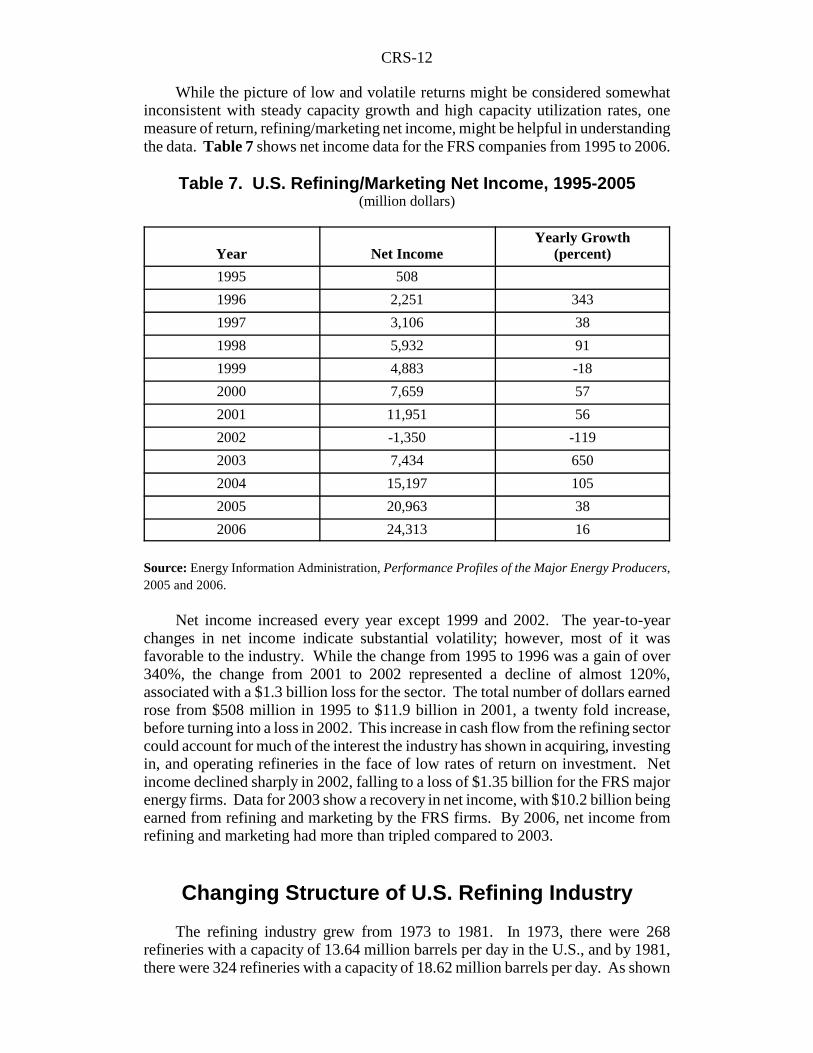
While the picture of low and volatile returns might be considered somewhatinconsistent with steady capacity growth and high capacity utilization rates, onemeasure of return, refining/marketing net income, might be helpful in understandingthe data. Table 7 shows net income data for the FRS companies from 1995 to 2006.
Table 7. U.S. Refining/Marketing Net Income, 1995-2005(million dollars)
Year Net IncomeYearly Growth
(percent)
1995 508
1996 2,251 343
1997 3,106 38
1998 5,932 91
1999 4,883 -18
2000 7,659 57
2001 11,951 56
2002 -1,350 -119
2003 7,434 650
2004 15,197 105
2005 20,963 38
2006 24,313 16
Source: Energy Information Administration, Performance Profiles of the Major Energy Producers,2005 and 2006.
Net income increased every year except 1999 and 2002. The year-to-yearchanges in net income indicate substantial volatility; however, most of it wasfavorable to the industry. While the change from 1995 to 1996 was a gain of over340%, the change from 2001 to 2002 represented a decline of almost 120%,associated with a $1.3 billion loss for the sector. The total number of dollars earnedrose from $508 million in 1995 to $11.9 billion in 2001, a twenty fold increase,before turning into a loss in 2002. This increase in cash flow from the refining sectorcould account for much of the interest the industry has shown in acquiring, investingin, and operating refineries in the face of low rates of return on investment. Netincome declined sharply in 2002, falling to a loss of $1.35 billion for the FRS majorenergy firms. Data for 2003 show a recovery in net income, with $10.2 billion beingearned from refining and marketing by the FRS firms. By 2006, net income fromrefining and marketing had more than tripled compared to 2003.
Changing Structure of U.S. Refining Industry
The refining industry grew from 1973 to 1981. In 1973, there were 268refineries with a capacity of 13.64 million barrels per day in the U.S., and by 1981,there were 324 refineries with a capacity of 18.62 million barrels per day. As shown
CRS-13
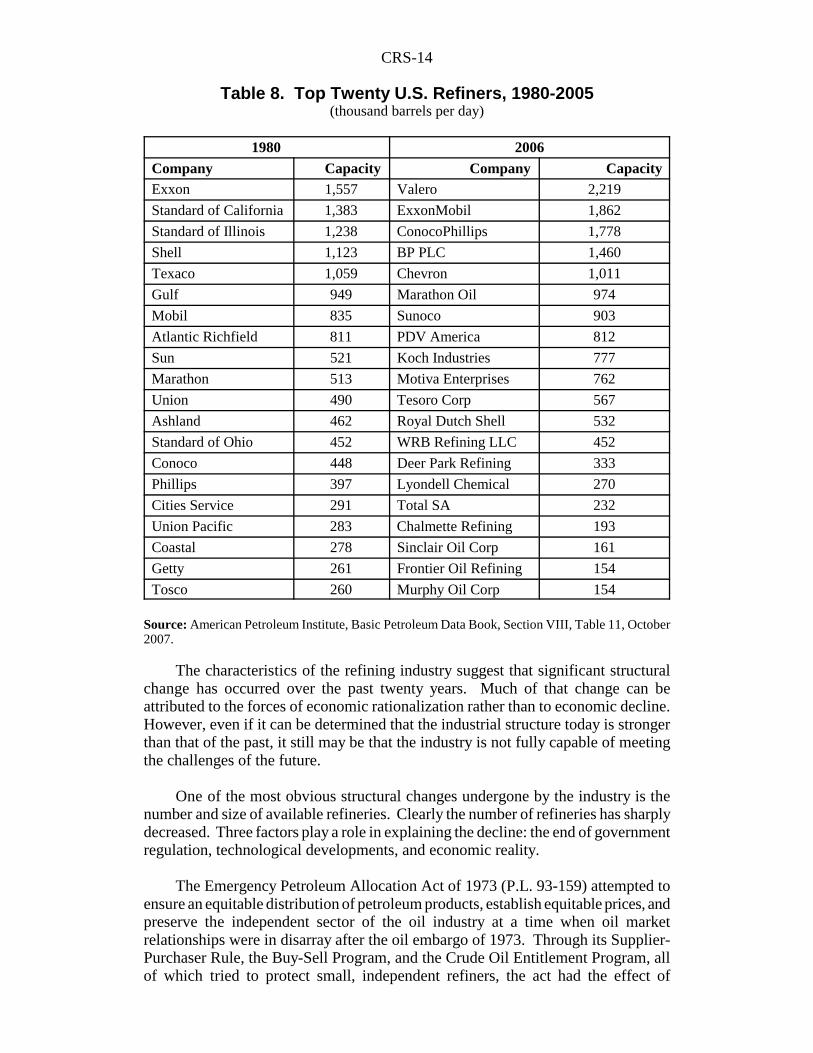
in Table 6, by 2006 the number of refineries had declined to 149 with a capacity of17.3 million barrels per day. Over the period 1981 to 2006, the number of refineriesdeclined by over 50% while the total capacity of the sector declined by about 8%.Ownership of refining assets has changed as well. Table 8 shows the top twentyU.S. refiners, rated by capacity. Several observations can be made about this table.First, in 1980, ownership of refineries was largely held by the major, integrated U.S.oil companies. In 2006, significant foreign ownership existed, including BritishPetroleum, PLC, the fourth largest refiner, and PDV America, a subsidiary of theVenezuelan national oil company. Second, the period since 1981 has seen significantmerger and acquisition activity within the U.S. oil industry as oil companies soughtto acquire expanded crude oil reserves as well as other assets through acquisition andmerger with other firms. As a result of mergers, acquisitions, and corporate strategy,the ownership of many specific refineries has changed hands, even though the totalcapacity of the corporate entity has remained relatively stable. For example, theBayway refinery in Linden, New Jersey, with a current capacity of 238,000 barrelsper day was owned by ExxonMobil, but is now owned by ConocoPhillips; Conocoand Phillips Petroleum were separate companies in 2001. Third, the industry nowhas significant capacity operated by firms that are not integrated oil companies at all,but specialize in only a part of the petroleum supply chain. Fourth, specific jointventure organizations, (e.g., Motiva Enterprises) have been created to engagespecifically in refining. Joint ventures have become common because they allow forsignificant cost and risk reductions through asset sharing and rationalization, but donot require the financial and institutional stresses of a more direct union throughmerger or acquisition.
CRS-14
Table 8. Top Twenty U.S. Refiners, 1980-2005(thousand barrels per day)
1980 2006Company Capacity Company CapacityExxon 1,557 Valero 2,219
Standard of California 1,383 ExxonMobil 1,862
Standard of Illinois 1,238 ConocoPhillips 1,778
Shell 1,123 BP PLC 1,460
Texaco 1,059 Chevron 1,011
Gulf 949 Marathon Oil 974
Mobil 835 Sunoco 903
Atlantic Richfield 811 PDV America 812
Sun 521 Koch Industries 777
Marathon 513 Motiva Enterprises 762
Union 490 Tesoro Corp 567
Ashland 462 Royal Dutch Shell 532
Standard of Ohio 452 WRB Refining LLC 452
Conoco 448 Deer Park Refining 333
Phillips 397 Lyondell Chemical 270
Cities Service 291 Total SA 232
Union Pacific 283 Chalmette Refining 193
Coastal 278 Sinclair Oil Corp 161
Getty 261 Frontier Oil Refining 154
Tosco 260 Murphy Oil Corp 154
Source: American Petroleum Institute, Basic Petroleum Data Book, Section VIII, Table 11, October2007.
The characteristics of the refining industry suggest that significant structuralchange has occurred over the past twenty years. Much of that change can beattributed to the forces of economic rationalization rather than to economic decline.However, even if it can be determined that the industrial structure today is strongerthan that of the past, it still may be that the industry is not fully capable of meetingthe challenges of the future.
One of the most obvious structural changes undergone by the industry is thenumber and size of available refineries. Clearly the number of refineries has sharplydecreased. Three factors play a role in explaining the decline: the end of governmentregulation, technological developments, and economic reality.
The Emergency Petroleum Allocation Act of 1973 (P.L. 93-159) attempted toensure an equitable distribution of petroleum products, establish equitable prices, andpreserve the independent sector of the oil industry at a time when oil marketrelationships were in disarray after the oil embargo of 1973. Through its Supplier-Purchaser Rule, the Buy-Sell Program, and the Crude Oil Entitlement Program, allof which tried to protect small, independent refiners, the act had the effect of
CRS-15
10 Energy Information Administration, The U.S. Petroleum Refining Industry in the 1980’s,October, 1990, p. 6.
increasing the incentive to build and own small refineries, many of which wereinefficient. Between 1973 and 1981 there was a net expansion of 43 refineries (75newly constructed, 32 old units closed). All but two of the new refineries had aninput capacity of less than 50,000 barrels per day, which was the average refinery sizein 1973. The average capacity of the new refineries that came on line over the periodwas 14,900 barrels per day. The utilization rate of the refinery sector declinedduring the expansion phase. In 1973, the capacity utilization rate was 93.9%, but by1981 it had fallen to 68.6%. The industry was characterized by idle capacity, toomany producers, and many refineries too small to benefit from economies of scale.In addition, many of the small refineries were very simple distillation facilitiesunsuited to produce the product slate required by the market and environmentalrequirements. As a result, a good portion of the output of these facilities was onlysuited to serve as feedstock for larger, technically sophisticated refineries. PresidentReagan ordered the elimination of the allocation programs that favored the smallrefiners in 1981, and since then the industry has responded to market forces.10
Technological and economic rationales for the decline in the number of
refineries are linked. The market for petroleum products has become heavily skewedtoward a lighter product mix, mainly gasoline, to serve demand from thetransportation sector. Lighter product mixes are primarily produced by addingadditional technical processing units downstream from the basic distillationprocedure. The technology and economics of the industry suggest that investmentin those downstream facilities is only rational for large scale plants, due tosignificant economies of scale. The net effect of these factors may be that the smallernumber of larger refineries operating in 2006 are economically and technologicallybetter prepared to meet the requirements of the market than the earlier structure, evenwith far fewer refineries and a smaller total capacity.
Although foreign ownership of refineries on U.S. soil has increased, this maybe the result of a continuing process of internationalization of the oil industry. U.S.major oil companies have long had a presence in all aspects of the industry aroundthe world. They have brought quality products as well as technological expertise andinvestment to many countries. Today, with the largest oil companies even moreinternational in character than in the past, the United States is receiving a share of theproducts, technology and investment that U.S. oil companies provided, and continueto provide, around the world. A threat to U.S. supply security related to foreignownership might be possible if the owner of the refineries was controlled by foreigngovernments with oil supply as well as hostile intentions to the United States, but thisdoes not seem to be the case in the present pattern of ownership.
Beyond the number of firms and their productive capacity, and the extent offoreign ownership, another important part of the structure of the refining industry isthe degree of concentration. Concentration refers to the proportion of the totalmarket accounted for by the largest firms. In petroleum refining, concentration canbe determined on the national level and on the regional level. The results are quitedifferent. The largest national refining companies are not necessarily the most
CRS-16
11 The information on industry concentration in the PADDs draws from a report by thePetroleum Industry Research Foundation, Inc., Refining Concentration and IndustryDynamics, April 2002.12 PADD is an acronym for Petroleum Administration for Defense Districts. The 50 statesand the District of Columbia were divided into five geographic districts in 1950.
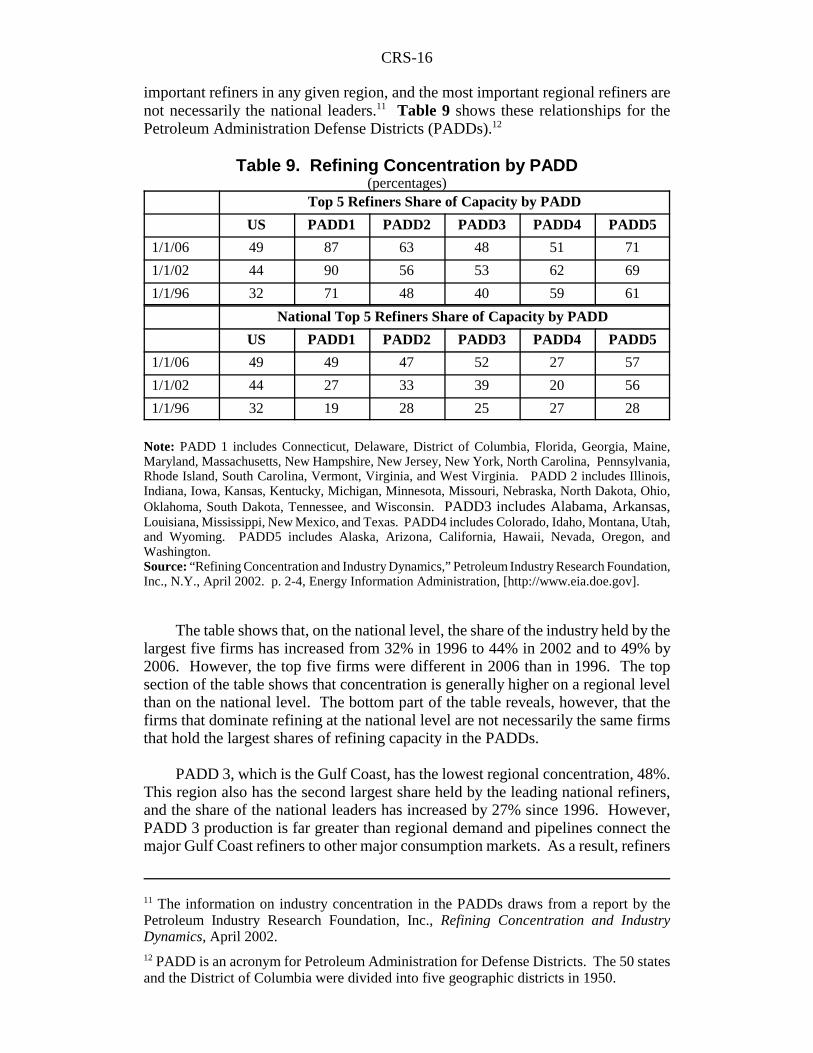
important refiners in any given region, and the most important regional refiners arenot necessarily the national leaders.11 Table 9 shows these relationships for thePetroleum Administration Defense Districts (PADDs).12
Table 9. Refining Concentration by PADD(percentages)
Top 5 Refiners Share of Capacity by PADD
US PADD1 PADD2 PADD3 PADD4 PADD5
1/1/06 49 87 63 48 51 71
1/1/02 44 90 56 53 62 69
1/1/96 32 71 48 40 59 61
National Top 5 Refiners Share of Capacity by PADD
US PADD1 PADD2 PADD3 PADD4 PADD5
1/1/06 49 49 47 52 27 57
1/1/02 44 27 33 39 20 56
1/1/96 32 19 28 25 27 28
Note: PADD 1 includes Connecticut, Delaware, District of Columbia, Florida, Georgia, Maine,Maryland, Massachusetts, New Hampshire, New Jersey, New York, North Carolina, Pennsylvania,Rhode Island, South Carolina, Vermont, Virginia, and West Virginia. PADD 2 includes Illinois,Indiana, Iowa, Kansas, Kentucky, Michigan, Minnesota, Missouri, Nebraska, North Dakota, Ohio,Oklahoma, South Dakota, Tennessee, and Wisconsin. PADD3 includes Alabama, Arkansas,Louisiana, Mississippi, New Mexico, and Texas. PADD4 includes Colorado, Idaho, Montana, Utah,and Wyoming. PADD5 includes Alaska, Arizona, California, Hawaii, Nevada, Oregon, andWashington.Source: “Refining Concentration and Industry Dynamics,” Petroleum Industry Research Foundation,Inc., N.Y., April 2002. p. 2-4, Energy Information Administration, [http://www.eia.doe.gov].
The table shows that, on the national level, the share of the industry held by thelargest five firms has increased from 32% in 1996 to 44% in 2002 and to 49% by2006. However, the top five firms were different in 2006 than in 1996. The topsection of the table shows that concentration is generally higher on a regional levelthan on the national level. The bottom part of the table reveals, however, that thefirms that dominate refining at the national level are not necessarily the same firmsthat hold the largest shares of refining capacity in the PADDs.
PADD 3, which is the Gulf Coast, has the lowest regional concentration, 48%.This region also has the second largest share held by the leading national refiners,and the share of the national leaders has increased by 27% since 1996. However,PADD 3 production is far greater than regional demand and pipelines connect themajor Gulf Coast refiners to other major consumption markets. As a result, refiners
CRS-17
13 As a result of the Conoco Phillips merger the share of Conoco, which was the largestregional refiner, grew to 25% from 21%. This caused the top five share to rise to 66%.
in this region compete not only among themselves to satisfy local demand, butagainst refiners in other PADDs.
PADD 5, the West Coast, presents unique features. The share held by the topfive regional refiners is over 70%, and the share held by the largest national refinersis 57%. Several features also isolate the region from the rest of the nation. First,there is no major finished product pipeline between PADD 5 and the rest of thecountry. This effectively isolates the market from competition from other areas,especially PADD 3, with its large refineries that compete in other regions of thenation. Second, PADD 5 is characterized by the CARB (California Air ResourcesBoard) gasoline, a unique, state-mandated formulation which adds to the relativeisolation of this market by making gasoline from other areas generally unsuitable inlarge portions of PADD 5. As a result, the Federal Trade Commission has beenespecially active in requiring divestiture during mergers and acquisitions in thisPADD to assure continued competition. For example, both the Exxon Mobil and theChevron Texaco mergers required divestiture of PADD 5 refining assets by at leastone of the merging firms. Many other mergers, acquisitions, and joint ventures inPADD 5 only achieved Federal Trade Commission approval after divestiture. Insome cases, these actions brought new competitors into the region, as when BPacquired ARCO’s refineries.
PADD 1, the East Coast, could be characterized as an open market. While it isconnected, via pipeline, to the large refineries on the Gulf Coast, it is also accessibleto imports from overseas. Within the region the largest five national refiners havea 49% share of the market, while the leading refiner, Sunoco, has approximately a5% share of the national market.
PADD 4, the Rocky Mountain area, is again, similar to PADD 5, an isolatedmarket, but in this case the top five regional refiners hold a 51% share while thenational leaders hold a 27% share.13 PADD 2, the Midwest, has had a relativelystable pattern of market share, and it shares with PADD 1 the characteristic of beingan open market. It is tied by pipeline to PADD 3, which supplies the region withapproximately 20% of its supplies.
In summary, even though there has been significant merger and acquisitionactivity in the refining sector, the data for the period 1996 to 2001 do not indicatesharply different patterns of industry concentration at the national or regional levels,while concentration has increased from 2002 to 2006. Because of the economicrationalization and concentration on core competencies that these mergers andacquisitions seem to imply, the firms that remain in the industry might well be betterpositioned for market competition.
CRS-18
14 D.J. Peterson and Sergej Mahnovski, New Forces at Work in Refining, Industry Views osCritical Business and Operations Trends, RAND Science and Technology, 2003, p. 14.15 The effect of environmental requirements on industry profitability is analyzed in EnergyInformation Administration, The Impact of Environmental Compliance Costs on U.S.Refining Profitability 1995-2001, May 2003.
Challenges Facing the Refining Industry
Historically, the major oil companies treated the refining activity as anintegrated part of a production stream that ran from exploration to final retail sale ofpetroleum products. One implication of this business model was that the refiningsector was not necessarily considered to be a stand-alone profit center. Refineryprofits or losses could be integrated with other parts of the business. This model haschanged in the 2000s to one requiring each component of the supply chain to pullits own weight, or generate sufficient profitability, to satisfy investors’ requirementsfor return on invested capital. This changed business model results, at least partly,from the entrance into the refining market of large, independent companies whosemajor interest in the petroleum industry is downstream refining and marketing.14
Given the place of refined products in the economy, earning sufficient return oninvested capital in the refining industry should be possible. After all, the industry’soutput is largely characterized by products that are essential to modern life: motorgasoline, diesel fuel, jet fuel, and other products whose demand has generally beengrowing. The industry has also made significant progress in controlling operatingcosts, although the most significant cost, that of crude oil, is beyond its control. Thebasic challenge to the industry is to maintain a competitive ROI at the same time thatadequate capital is allocated to technological improvements, refinery expansion isundertaken to meet forecasted increases in demand, and investments to keep refineryproducts and sites consistent with environmental laws and regulations are made.15 If the refining industry is successful in meeting this challenge, a more stable marketwill likely prevail. If industry is unsuccessful in meeting this challenge the marketis more likely to experience instability, characterized by supply disruptions and pricespikes, as well as an increasing dependence on foreign supplies of refined products.
Environmental Requirements
From a refiner’s point of view, most environmental requirements, whether theyaffect product specification or site compliance, affect business operations in a similarmanner. They require capital investment in additional stages, or technical processes,to be added to the refinery. The investment process begins with certification andpermit approval with regulatory agencies and, ultimately, moves to design andconstruction at the refinery to implement the new processes. Some of the current,or expected, product specification requirements that are likely to affect refiners overthe next several years include reduced sulfur content in gasoline and diesel fuels,reductions in smog-forming compounds released during handling (vapor pressure),reduced smog-forming emissions from vehicles (reformulated gasoline), reducedtoxics and chemical exposure during handling and storage (methyl tertiary butylether (MTBE) bans), improved engine performance (drivability index), and the use
CRS-19
16 Ibid., p. 22.
of non-petroleum based feedstocks (ethanol).16 The goal in this report is not toevaluate the net benefit of any of these requirements, or environmental siterequirements which form an additional set of restrictions, but to recognize that theyall have a similar impact on the refining industry: they require an allocation ofresources to capital investment that does not result in lower costs or increased output,and are, therefore, likely to affect the ability of the industry to meet economicperformance expectations.
Capital Investment
Capital expenditures in the refining industry serve a variety of purposes. First,they may augment capacity or upgrade technological capability, either through theconstruction of new refineries or through the modification of existing refineries.Second, they may be required to allow both, or either, the produced products or thesite itself to meet environmental requirements. Third, capital expenditures may beused for mergers and acquisitions.
As discussed earlier in this report, there has been no significant investment innew refineries in the United States in the past twenty five years. However,investment has taken place to enhance the capacity of existing facilities. Investmentin capacity expansion and technology is expected to generate profits enhancing thenet margin and yielding a positive ROI. Environmental investments are different.They are required to allow the refinery to stay in operation, but they yield little or nodirect financial return for the refiner. They are either absorbed from profits or passedon to the consumer, or both. Since they increase the capital value of the refinery, butyield no net revenue, they can reduce the overall ROI, depending on cost pass-through to the consumer.
Capital expenditure for merger and acquisition has dominated the investmentpicture in the refining industry since the late 1990s. These expenditures are made fora variety of reasons, from entering or expanding a firm’s presence in the industry, torationalizing refining strategy, to production and marketing goals, or by legaldirective as in conjunction with the stipulations to complete a merger or acquisition.Firms expect these expenditures also to be profitable, at least in the longer term.
Even though refining and marketing profitability has grown with the oil priceincreases since 2004, the profit and cash rich position of integrated oil companies anddomestic refining companies may not translate into capital investment in the refiningsector. The choice to invest in a new refinery is actually a decision to produce anadditional barrel of refined petroleum products for the U.S. market. Growth inproduct demand, especially gasoline, suggests that the demand for the additionalproduct is fairly certain.
The question remains; what is the cheapest way to provide that extra product tothe market? Four possible answers exist. First, a company could decide to expandthe capacity of an existing refinery. Second, a company could build a new refinery.Third, a company could decide to import the extra production into the United States.
CRS-20
17 Sarah Reynolds, East County Oil Refinery Will Move, The Yuma Sun, February 8, 2008.Available at [http://www.arizonacleanfuels.com/2008/020508_YS.htm].18 New York Times, Refinery Considered for South Dakota, June 14, 2007. Available at[http://www.nytimes.com/2007/06/14/business/14oil.html].
Fourth, a company could acquire the refinery of another company. The fundamentaleconomics, as well as the market and regulatory environments, suggest that, all otherthings equal, construction of new refineries is not likely to be the chosen alternative.
Over the past two decades refiners have chosen to expand existing refineries inpreference to new construction. The reasons are part economic and part regulatory.Economic rationales favor expansion over new construction, because the fixed costassociated with a new facility can be avoided and economies of scale at the expandedfacility can be realized. Satisfying regulatory requirements for an expansion at anexisting facility are likely to be less costly, less time consuming, and less subject tochallenge by local groups compared to a new facility.
Given the economics of the oil market, it may remain cheaper to import extrapetroleum products than to produce them in the United States. Excess capacity forgasoline that meets U.S. specifications is available in Europe and other parts of theworld. Similarly, it may also be cheaper for any given company to expand itsrefining capacity by purchasing assets from other companies. While this strategymay improve the supply position of the acquiring firm, it does little to improve thesupply position of the U.S. market as a whole.
Special circumstances may justify construction of a new facility. Such a facilityis planned for construction in Arizona.17 In the case of the Arizona facility, therefinery is positioned to supply products to the persistently tight southern Californiamarket, where high margins might be earned, using Mexican crude oil as an input.Although the permitting process for this facility is nearing completion, it has been inprocess for over five years.
Another new proposed U.S. refinery project is to be located in South Dakota,and produce ultra low sulfur gasoline and diesel fuel. The source of crude oil wouldbe from Canadian oil sands, and the refinery is expected to use about 400,000 b/d ofcrude oil. The cost of the refinery has been estimated at between $8 and $10billion.18
CRS-21
19 The Energy Information Administration, The Impact of Environmental Compliance Costson U.S. Refining Profitability 1995-2001, May, 2003, p. 1. [http://www.eia.doe.gov/emeu/perfpro/ref_pi2/refpi2.pdf]
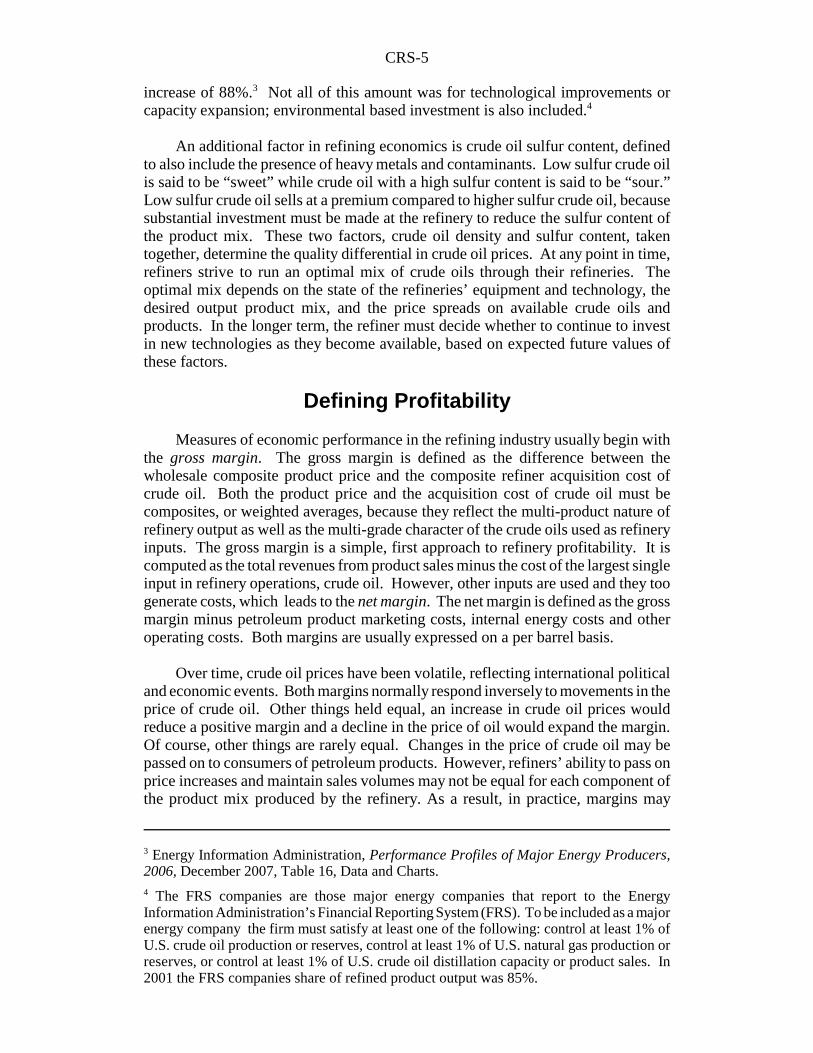
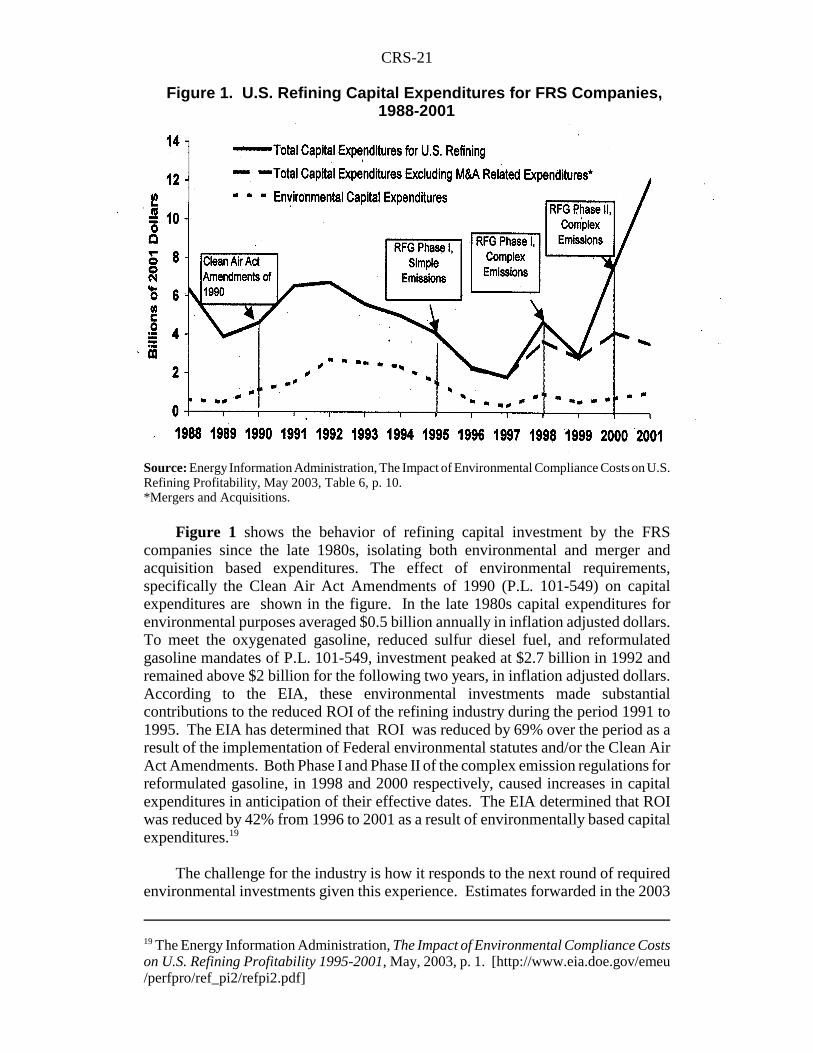
Figure 1. U.S. Refining Capital Expenditures for FRS Companies, 1988-2001
Source: Energy Information Administration, The Impact of Environmental Compliance Costs on U.S.Refining Profitability, May 2003, Table 6, p. 10. *Mergers and Acquisitions.
Figure 1 shows the behavior of refining capital investment by the FRScompanies since the late 1980s, isolating both environmental and merger andacquisition based expenditures. The effect of environmental requirements,specifically the Clean Air Act Amendments of 1990 (P.L. 101-549) on capitalexpenditures are shown in the figure. In the late 1980s capital expenditures forenvironmental purposes averaged $0.5 billion annually in inflation adjusted dollars.To meet the oxygenated gasoline, reduced sulfur diesel fuel, and reformulatedgasoline mandates of P.L. 101-549, investment peaked at $2.7 billion in 1992 andremained above $2 billion for the following two years, in inflation adjusted dollars.According to the EIA, these environmental investments made substantialcontributions to the reduced ROI of the refining industry during the period 1991 to1995. The EIA has determined that ROI was reduced by 69% over the period as aresult of the implementation of Federal environmental statutes and/or the Clean AirAct Amendments. Both Phase I and Phase II of the complex emission regulations forreformulated gasoline, in 1998 and 2000 respectively, caused increases in capitalexpenditures in anticipation of their effective dates. The EIA determined that ROIwas reduced by 42% from 1996 to 2001 as a result of environmentally based capitalexpenditures.19
The challenge for the industry is how it responds to the next round of requiredenvironmental investments given this experience. Estimates forwarded in the 2003
CRS-22
20 D.J. Peterson and Sergej Mahnovski, New Forces at Work in Refining, Industry Views ofCritical Business and Operations Trends, RAND Science and Technology, 2003, p. 64.21 Michael A. Lobue, Challenges Facing U.S. Refiners,NEMS/AEO Conference, March 18,2003.22 Energy Information Administration, Annual Energy Outlook, 2007, Table A11, p. 156.
RAND study of refiners are $4-13 billion to meet the on-road ultra low sulfur dieselrequirements by 2006, and perhaps $10-15 billion additional to meet othermandates.20 The American Petroleum Institute sees the total cost of meeting the 2006on-road ultra low sulfur diesel requirements at $8 billion. It sees an additional $8billion investment to meet gasoline sulfur reduction requirements.21 The range ofinvestment cited is large and significant uncertainty remains concerning actualvalues. If accurate, there could be some concern that environmentally based claimson capital expenditure might crowd out other investments. In that case, investmentin capacity expansion might not be funded, even though potentially profitable. Thatlack of investment could drive up capacity utilization rates even higher which wouldlikely increase the fragility of the market and make it more open to price volatilityand quantity disruption.
The strength of the crowding-out argument diminishes when the rapid increasein capital expenditure shown in Figure 1 for mergers and acquisitions from 1999 to2001 is considered. Clearly, the ability to raise capital, either in the form of debt orequity, must have been available to the industry to fund the approximately threefoldincrease in investment from 1999 to 2001, much of it to finance mergers andacquisitions. The ability of the industry to manage and balance its capital investmentbudget between competing claims may well be an important determinant of how wellthe industry is able to meet increasing demand with new, environmentally compatiblecapacity.
Production and Growth
In its reference case forecast, the EIA projects that refined products consumedwill increase from 20.7 million barrels per day in 2004 to 22.7 million barrels per dayin 2015 and 26.9 million barrels per day in 2030.22 This growth implies an averageannual growth rate of 1.1% over the period. Another way of looking at the projectedgrowth is to note that if it were to be met by domestic refining capacity, it wouldrequire capacity increments of approximately 238,000 barrels per day, per year. Thiswould be equivalent to the production capacity of one new, large, refinery. Anadditional, similarly sized refinery would have to be added to the capacity base eachyear to meet projected market requirements. Alternatively, capacity expansion basedon technological improvements would have to continue at a high rate for the 26-yearperiod.
Set against this forecast of increasing demand is the incrementally increasingcapacity of the industry, as well as the declining number of refineries. The last newrefinery to open in the United States was the Petro Star refinery in Valdez, Alaska,in 1993, which had an original capacity of 38,000 barrels per day and was a simplerefinery. The last refinery of significant capacity (200,000 barrels per day, or more)
CRS-23
23 Data provided by the Energy Information Administration, Office of Oil and Gas,Petroleum Division by personal communication, September 12, 2003.24 D.J. Peterson and Sergej Mahnovski, New Forces at Work in Refining, Industry Views ofCritical Business and Operations Trends, RAND Science and Technology, 2003, p. xv.
to open in the United States was the Marathon refinery in Garyville, Louisiana,which opened in 1977, more than 30 years ago.23 With this historical record,construction of a new 400,000 barrel-per-day capacity refinery per year to meetprojected demand growth would appear to be a major challenge.
Several factors come into play in the refining industry’s plan to meet forecastedmarket requirements. Even though no new refineries were constructed during the1990s, and the number of refineries declined, refinery capacity increased on average1.5% per year. If projected into the future, this growth is sufficient to meet the EIAlong term forecast of demand increases for refined products. These increases incapacity are due to investment in new processing units, marginal expansion (knownas capacity creep) obtained through bottleneck removal, and more intensive use ofexisting capacity by lengthening time between maintenance and overhaul. This typeof expansion ultimately could encounter diminishing returns, although the record ofthe industry suggests that even more capacity might be squeezed out of the existingstock of refineries.
Another key factor in maintaining production is capacity utilization. Capacityutilization rates remain high, approximately 93% in 2003, and almost 91% in 2002.The capacity utilization rate has remained above 90% every year since 1993. Excesscapacity is a luxury no refiner seems anxious to support, because of its effect onprofitability. This view is borne out by executives who participated in the RANDstudy.24
Imports
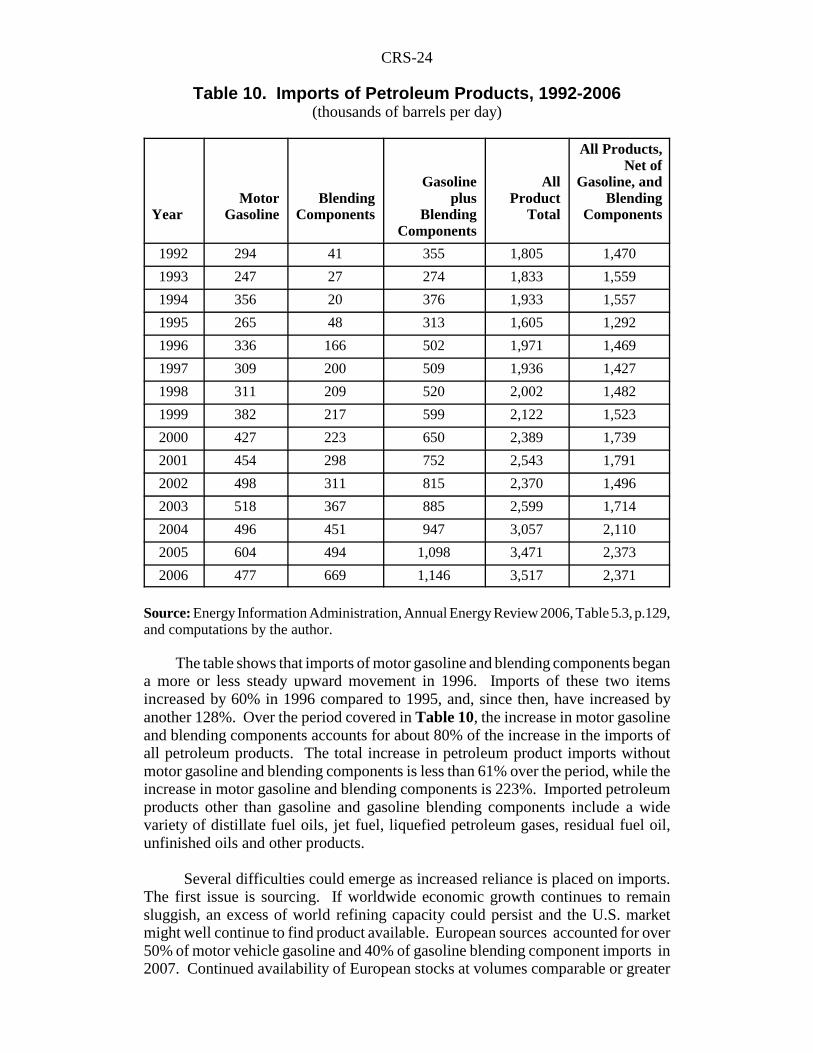
With capacity utilization rates near a maximum, no new refinery constructionlikely, and growth through capacity creep less than the growth in EIA projecteddemand, imports of petroleum products would seem to play an increasingly importantrole in the supply of refined products. Refined product imports, mostly from Canada,the Caribbean and Europe have been an important component of the total supplyequation for some years. In 2006, petroleum product imports of all types, totaledabout 3.5 million barrels per day, which amounted to approximately 17% of totalproduct supplied to the U.S. market. Import dependence on refined products hasaveraged approximately 6% of total product supplied since 1992. However, thepercentage has increased in each of the past six years. Most observers feel that thereis sufficient short run capacity in the world market to expand U.S. imports, with theexpansion of specific blends of motor gasoline for specific regional or state marketsposing the greatest potential challenge. Table 10 shows data from 1992 to 2006 fortotal petroleum product imports, as well as the most significant sector, motorgasoline, and blending components.
CRS-24
Table 10. Imports of Petroleum Products, 1992-2006(thousands of barrels per day)
YearMotor
GasolineBlending
Components
Gasolineplus
BlendingComponents
AllProduct
Total
All Products,Net of
Gasoline, andBlending
Components
1992 294 41 355 1,805 1,470
1993 247 27 274 1,833 1,559
1994 356 20 376 1,933 1,557
1995 265 48 313 1,605 1,292
1996 336 166 502 1,971 1,469
1997 309 200 509 1,936 1,427
1998 311 209 520 2,002 1,482
1999 382 217 599 2,122 1,523
2000 427 223 650 2,389 1,739
2001 454 298 752 2,543 1,791
2002 498 311 815 2,370 1,496
2003 518 367 885 2,599 1,714
2004 496 451 947 3,057 2,110
2005 604 494 1,098 3,471 2,373
2006 477 669 1,146 3,517 2,371
Source: Energy Information Administration, Annual Energy Review 2006, Table 5.3, p.129,and computations by the author.
The table shows that imports of motor gasoline and blending components begana more or less steady upward movement in 1996. Imports of these two itemsincreased by 60% in 1996 compared to 1995, and, since then, have increased byanother 128%. Over the period covered in Table 10, the increase in motor gasolineand blending components accounts for about 80% of the increase in the imports ofall petroleum products. The total increase in petroleum product imports withoutmotor gasoline and blending components is less than 61% over the period, while theincrease in motor gasoline and blending components is 223%. Imported petroleumproducts other than gasoline and gasoline blending components include a widevariety of distillate fuel oils, jet fuel, liquefied petroleum gases, residual fuel oil,unfinished oils and other products.
Several difficulties could emerge as increased reliance is placed on imports.The first issue is sourcing. If worldwide economic growth continues to remainsluggish, an excess of world refining capacity could persist and the U.S. marketmight well continue to find product available. European sources accounted for over50% of motor vehicle gasoline and 40% of gasoline blending component imports in2007. Continued availability of European stocks at volumes comparable or greater
CRS-25
than these levels may not be sustainable. Europe is undergoing a transformation ofits transportation fuels mix. While its refinery capacity is largely oriented towardgasoline production due to past investment decisions, the European vehicle fleet israpidly moving toward diesel fuel. The implication is that, until refinery conversionis completed, European refiners will have an excess supply of gasoline to sell on theworld market. As a result, the long term availability of European supplies of gasolinemay diminish as the U.S. demand for gasoline continues to grow. Slow growth in theAsian economies, excluding China, continues to hold back the growth of demand forgasoline in the region. Before the financial crisis in 1997, Asian gasoline growthrates were the highest in the world. Until economic recovery is complete anddemand growth comparable to pre-crisis levels returns, the Asian market is alsolikely to have excess refining capacity. Near term sourcing of imports then, fromEurope as well as Asia, seems relatively secure. In the longer term structural changein the European fuel mix and the recovery of Asian demand growth may limitavailable imports.
The second factor influencing the viability of increased reliance on imports isthe segmented nature of the U.S. gasoline market. Gasoline in the United States isno longer a fungible, or easily transferable, product. Differing U.S., regional, andstate air quality standards with respect to fuel specifications have produced a marketwhere shortages may appear because gasoline of a particular specification is tight,even though gasoline of other specifications might be available. As the large U.S.market is divided into smaller sub-markets that demand fuels not required in otherregions, or other parts of the world, it might become difficult to find refiners on theworld market willing to customize production to satisfy particular U.S. demands. Theresult can be that spot shortages and price spikes, similar to those that occurred inChicago in 2002 in conjunction with the elimination of MTBE as a gasoline additive.Availability, as well as price considerations, suggest that if gasoline were astandardized commodity rather than a specialized good, it would be less likely to belinked to local market instability.
A final factor regarding imports has to do with long and short run matching ofdemand and supply. The EIA forecast indicates a long term need for importedrefined products, mainly gasoline and blending components. Recently, there hasbeen a growing market in very short run “target of opportunity” cargoes of refinedproducts. That is, an almost speculative market has developed in which a tankermight load a cargo without a firm buyer at a port where gasoline is available at anattractive price. The owner of the cargo then directs the tanker to the port at whichthe best price might be earned. On the one hand, this type of activity representsmarket forces directing supply to areas with high demand. On the other hand, theprocess may represent a somewhat opportunistic, and uncertain way of securingsupplies. It is not hard to imagine a scenario where this type of supply dependencymight periodically lead to market disruptions complete with shortages and pricespikes.
Permits and Regulatory Uncertainty
An important concern of the refining industry is largely administrative andregulatory. As noted earlier in this report, the refining industry is working within along term program of implementing congressionally mandated environmental
CRS-26
25 D.J. Peterson and Sergej Mahnovski, New Forces at Work in Refining, RAND Science andTechnology, p. 85.26 Ibid., p. 70-79.27 Ibid.
standards. Some see the regulated environment as an opportunity. Some participantsin the RAND study noted that regulations formed a barrier to entry into the market.The result might be higher profits, for which they cite California refiners who arefaced with the most stringent set of federal, state, and local environmental regulationsin the nation, and yet operate the most profitable refineries in the nation.25 In general,however, the RAND study reports significant concern in the industry regarding theadministration and implementation of the regulatory process.26
According to the RAND study, the best case regulatory process from theindustry’s point of view is one that minimizes uncertainty and maximizes flexibility.The industry’s preference is to see a regulatory roadmap laid out which covered anadequately long planning horizon, say a decade. They would like to see a plan whereno regulations contradict or compete with one another. They would like to seephasing in of regulations in a manner that minimizes pressure put on construction orinvestment timetables and plans. They would like to see a smooth, timely permittingprocess in which administrative delays are minimized. Industry would also prefer tohave flexibility in how, technologically, to meet environmental standards.27
Conclusions
The petroleum refining industry forms a critical infrastructure in the U.S.economy. It provides products which allow America to move, whether by air, land,or sea, but it must accomplish this while maintaining national and regionalenvironmental standards. The industry has demonstrated that this is possible. Therehas been minimal market disruption that can be traced to the refining sector, over thepast twenty years. However, the EIA Annual Energy Forecast 2006 suggests that theindustry is unlikely to be able to maintain this performance over the planning periodto 2030 without the domestic market becoming significantly more dependent onimported motor gasolines and blending components. Increased import dependencyimplies the potential for both supply disruption as well as national energy securityconcerns.
The EIA has found that the legacy of past environmental requirements on theindustry have been substantially reduced ROI. The industry has been able to absorbthese lower rates of return in the past largely because of the ownership structure ofthe industry and the associated business model. A new market structure and businessmodel might implicitly require better economic performance from the industry. Tothe extent that the performance of ROI negatively affects decisions concerningcontinued capacity expansion and technological investment in the industry, the effectof the structural changes in the industry might have national energy policyimplications.