Embed Size (px)
Citation preview
PETROLEUM LEASING AND FISCALISATION, AND THEIR IMPACT ON INDUSTRY
STRUCTURE, COMPETITION, PRODUCTION AND GOVERNMENT REVENUES IN THE US
GULF OF MEXICO
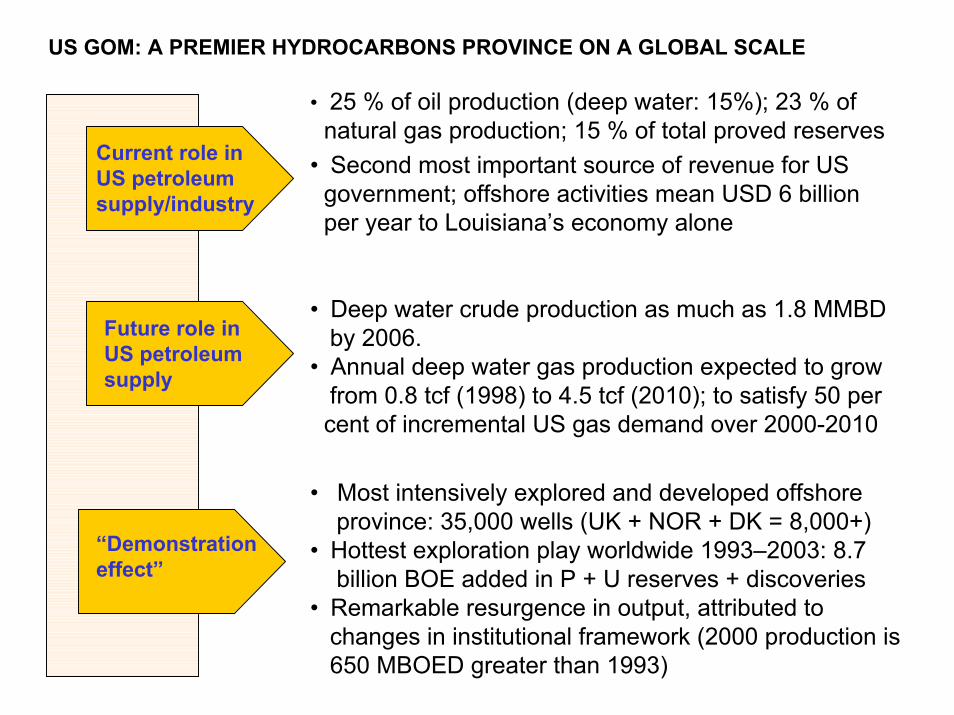
US GOM: A PREMIER HYDROCARBONS PROVINCE ON A GLOBAL SCALE
Current role inUS petroleumsupply/industry
Future role inUS petroleumsupply
“Demonstrationeffect”
• 25 % of oil production (deep water: 15%); 23 % of natural gas production; 15 % of total proved reserves
• Second most important source of revenue for US government; offshore activities mean USD 6 billion per year to Louisiana’s economy alone
• Deep water crude production as much as 1.8 MMBD by 2006.
• Annual deep water gas production expected to growfrom 0.8 tcf (1998) to 4.5 tcf (2010); to satisfy 50 per cent of incremental US gas demand over 2000-2010
• Most intensively explored and developed offshore province: 35,000 wells (UK + NOR + DK = 8,000+)
• Hottest exploration play worldwide 1993–2003: 8.7billion BOE added in P + U reserves + discoveries
• Remarkable resurgence in output, attributed to changes in institutional framework (2000 production is 650 MBOED greater than 1993)

PETROLEUM GOVERNANCE IN GOM IS HIGHLY IDIOSYNCRATIC
Institutional Framework
Leasing Practices
Fiscal Regime
• Based on unique conception of subsoil tenure: ownership of minerals vested in possessor of the surface
• Legally structured around lease contracts governed by private law
• Out of synchrony with federalist character of US political system
• Frequent lease offerings, assignation of blocks through competitive cash bidding
• Limited primary term for leases (5 years, 10 in deep water); unlimited lease tenure so long as oil and gas found in paying quantities
• Reliant on signature bonuses rather than resource rent taxes as key vehicle for capturing excess profits
• Has generated USD 129 billion to 2000; 54% royalties,46% signature bonuses (but 67% up to 1982 inclusive)
GOM Petroleum
Governance

THE POLITICAL CONTEXT OF OIL AND GAS ACTIVITIES IN GOM IS NOTABLEFOR ITS ANTI-FEDERALIST CHARACTER
• The USA is the country with the strongest federal tradition of all
• The Federal government is generally obliged to distribute share of royalty and bonus receipts “to help state and local governments meet their costs of supporting development activities on public lands”
Onshore federal leases stipulate 50 per cent revenue-sharing for royalties (sole exception Alaska, which gets 90 per cent)
AND YET…
• OCS oil leasing ONLYFederal programme for
“leasing, sale or disposal of public resources” where NOprovision made for revenue sharing
• Coastal states receive money from OCS oil/gas only through congressional CZMA/OCSLA appropriations
• Coastal states face many risks associated to OCS oil activities and pay large bills for onshore support services and infrastructure, but cannot tax OCS facilities

• Administrative simplicity, low cost
• No ring fencing, no definition problems: “ledger and bank” exercise
• Sunk cost character • No perverse expenditure incentives (goldplating); may allow high fiscal takes
• Investment neutrality • Bonus: NPV of excess profits, net of tax (projects are the same pre- and post-tax)•
• Transparency andunambiguous
• Arm’s-length (objective) assignation,not open to litigation
•unambiguous
• Arm’s-•unambiguous
• -•unambiguousness
• -
ADVANTAGES
HOW DO CASH BONUSES WORK AS RENT COLLECTION DEVICES?
• Cost frontloading • Deterrent effect on potential entrants
• Meant to capture expected rents
• Rents may not materialise, affectingflow of investment
• Minimum knowledgethreshold • Requires ballpark figure calculation
of excess profits• Evaluation of informational content
of bids (collusive signalling)
•
DISADVANTAGES
• Control and auditsophistication
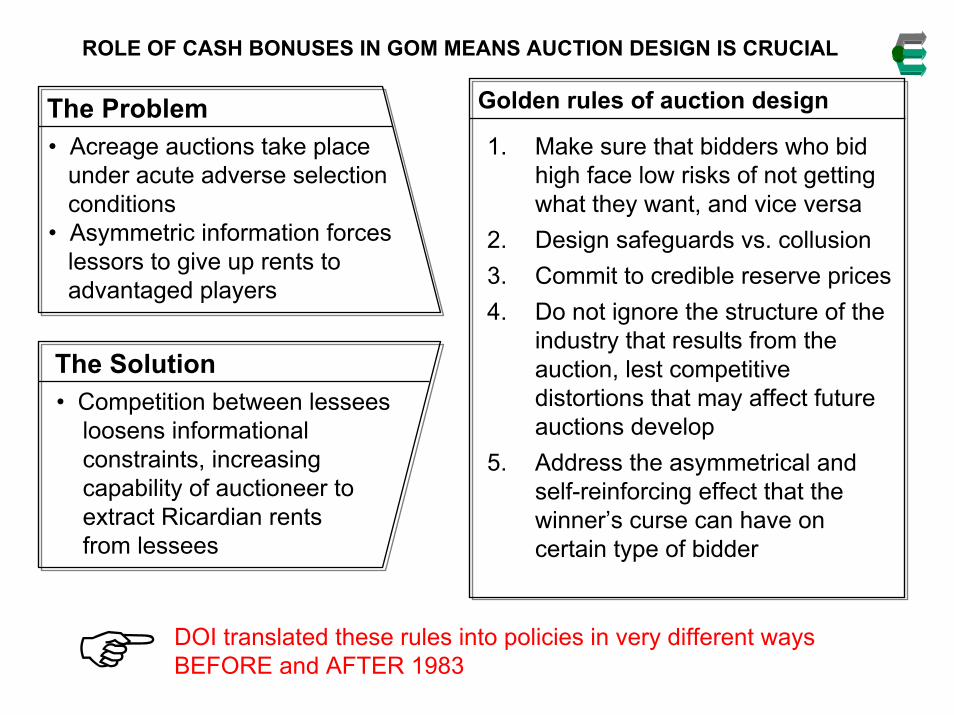
• Acreage auctions take place under acute adverse selection conditions
• Asymmetric information forces lessors to give up rents to advantaged players
• Competition between lesseesloosens informational constraints, increasing capability of auctioneer to extract Ricardian rents from lessees
1. Make sure that bidders who bid high face low risks of not getting what they want, and vice versa
2. Design safeguards vs. collusion3. Commit to credible reserve prices4. Do not ignore the structure of the
industry that results from the auction, lest competitive distortions that may affect future auctions develop
5. Address the asymmetrical and self-reinforcing effect that the winner’s curse can have on certain type of bidder
The Problem
The Solution
Golden rules of auction design
ROLE OF CASH BONUSES IN GOM MEANS AUCTION DESIGN IS CRUCIAL
DOI translated these rules into policies in very different waysBEFORE and AFTER 1983
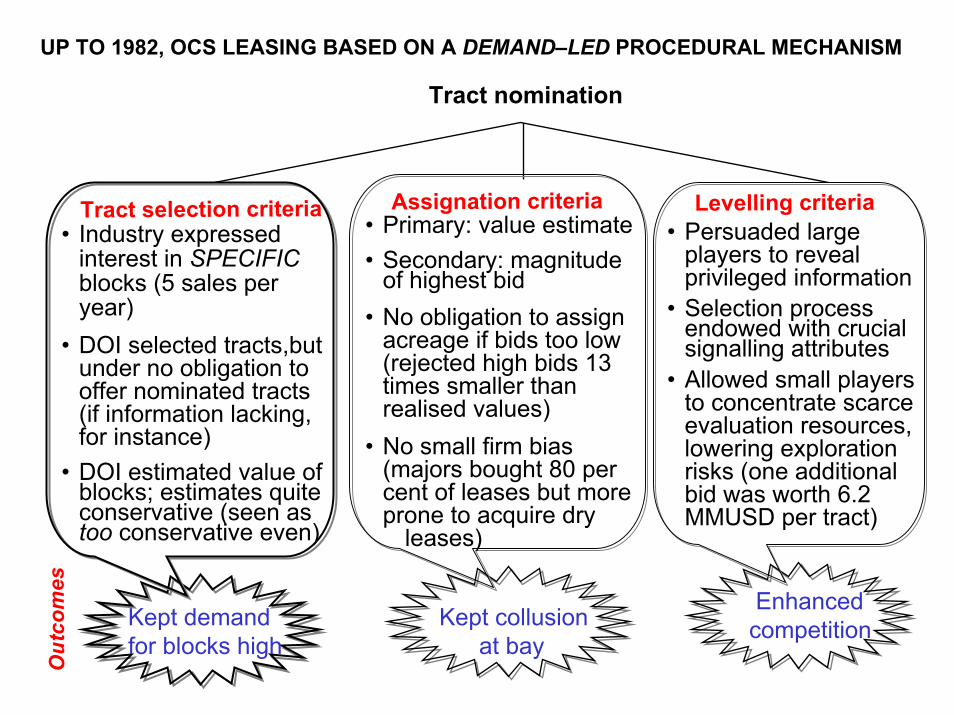
UP TO 1982, OCS LEASING BASED ON A DEMAND–LED PROCEDURAL MECHANISM
Tract nomination
• Industry expressed interest in SPECIFICblocks (5 sales per year)
• DOI selected tracts,but under no obligation to offer nominated tracts (if information lacking, for instance)
• DOI estimated value of blocks; estimates quite conservative (seen as too conservative even)
• Primary: value estimate • Secondary: magnitude
of highest bid• No obligation to assign
acreage if bids too low (rejected high bids 13 times smaller than realised values)
• No small firm bias (majors bought 80 per cent of leases but more prone to acquire dry
leases)
• Persuaded large players to reveal privileged information
• Selection process endowed with crucial signalling attributes
• Allowed small players to concentrate scarce evaluation resources, lowering exploration risks (one additional bid was worth 6.2 MMUSD per tract)
Kept demandfor blocks high
Assignation criteria
Kept collusionat bay
Enhancedcompetition
Tract selection criteria Levelling criteria
Out
com
es

TN SYSTEM PROVED HIGHLY SUCCESSFUL, ESPECIALLY IN FISCAL TERMS
105
1953-1982, USD Billions
41.4
17.1
46.5
55 per cent
• Oil output from zero to peak of 1.1 MMBD; gas to 13.2 BCFD
• Over 1972-81, fiscaltake at unsustainable levels (78 per cent), onaccount of exuberantcash bonus payments (peak = 6.7 billion,1981)
• Upfront payments seenas compromising furtheroutput expansion
OCS Gross Income
SignatureBonuses
Royalties Industry Profits and Costs
• In 1978, OCSLA amended to reduce the upfront leasing amounts, in a way that would “require the holder of the lease to pay the government a larger share of any follow-on production”.
• DOI to use alternative leasing systems for at least 20 per cent (up to 60 per cent) of tracts offered between 1980-83. 215 GOM tracts leased with profit sharing, but use abandoned due to complexity (and changing political circumstances)
Source: Minerals Management Service

THE REAGAN ADMINISTRATION SAW THE TN SYSTEM AS A MAJOR CAUSE BEHIND THE 1970s ENERGY CRISIS
The WakeUp Call
(1973–81)
- US oil output declining
- US dependence on imported oil increasing
- Oil price rises threatening USeconomy
- OPEC waging “moral equivalentof war” (gas lines, brownouts)
- Kissinger doctrine: “a political,indeed moral, conviction…to bringabout a reduction in oil prices bybreaking the power of OPEC…”
THE VICIOUS CIRCLE OF OCS
LEASING
OCS leasing used
to meet short-term
budget needs, no
consumer focus
-Restrictions
on number,
location of
tracts offered
to industry
Restrictions
on acreage that
could be opened to
exploration and
development
Imposition and
administration of restrictions
on entry, distorting optimal
price and output decisions.
ALTERNATIVE LEASING
RESTRICTIVE AND
COMPLICATED
The credo: “if you are interested in consumers, you want to deliver energy to them. If you are interested in national security, you want energy, and energy comes through competition, not through restricting supply” (J.W. Watt, Secretary of Interior, 1981–3)
The diagnose: TN shackled the oil industry (indirectly making American prosperity a hostage to OPEC); thus, a radical overhaul of the offshore leasing programme necessary, to restore competitive discipline to this vital sector

FROM 1983 ON, OCS LEASING BASED ON A SUPPLY–LED PROCEDURAL MECHANISM
Areawide leasing
• Entire planning areas offered (up to 50 MM acres)
• Tracts no longer evaluated individually
• At least 8 sales per year (entire OCS in first five years)
• Longer primary lease terms (8-10 years for deepwater acreage)
• Estimates prepared for tracts with less than 3 bids; high bid accepted if better than geometric average of estimate and all bids received
• High bid automaticallyaccepted: 3 or more bids or if tract deemed unviable (lack of map reason enough to classify as unviable)
• Minimum bid increased (25 to 150 per acre)*
*until 1986 only; current: USD 25 in shallow water, USD 37.50 in deep
• Reduce upfront stakes • Winners’ curse, info.
asymmetries ASSUMED AWAY(MMS def. of fair market value: “amount for which in all probability the property would be sold by knowledgeable owner willing but not obligated to sell to knowledgeable willing buyer not obligated to buy. This value is not hypothetical; insofar as it is possible to estimate it, it represents the actual selling price”)
Quick accessto resources
Assignation criteria
Lower entrybarriers
Tract selection criteria Levelling criteria
Obj
ectiv
es
More options for companies

AWL SYSTEM PROVED COSTLY IN FISCAL TERMS, AND FAILED TO DELIVER INOUTPUT TERMS
OCS Gross Income
SignatureBonuses
Royalties Industry Profits and Costs
315
Source: Minerals Management Service
1983-2000, USD Billions20
50.6
244.5
22 per cent
Average (1973-82): 3.5 billionExpected average: 2 billionAverage (1983-2000):1 billionLow: 84 MMUSD (1992)High: 5.7 billion (1983) Years of 1+ billion in bonuses: 1983, 1984, 1985, 1988 1997 (1.4), 1998
Average (1973-82): 1.5 billionExpected average: 3-4 billionYears of 3+ billion of royalty receipts: 1996, 1997, 2000
• AWL greatly increased the acreage offered and leased, despite vast OCS areas being put out of bounds by moratoria
Acres (millions)Period Offered Leased1953-82 58 231983-00 1,317 83
• Acreage prices declined accordingly
Period US Dollars per acre1953-82 1,2751973-82 2,2531983-00 2161993-00 131
• Output response did not follow: royalty estimates imply 50-60% increase in output to 1.8-2 billion BOE (with prices falling 25%) Real figure: 1.2 billion for 1983-2000; 1.4 billion 1993-2000.
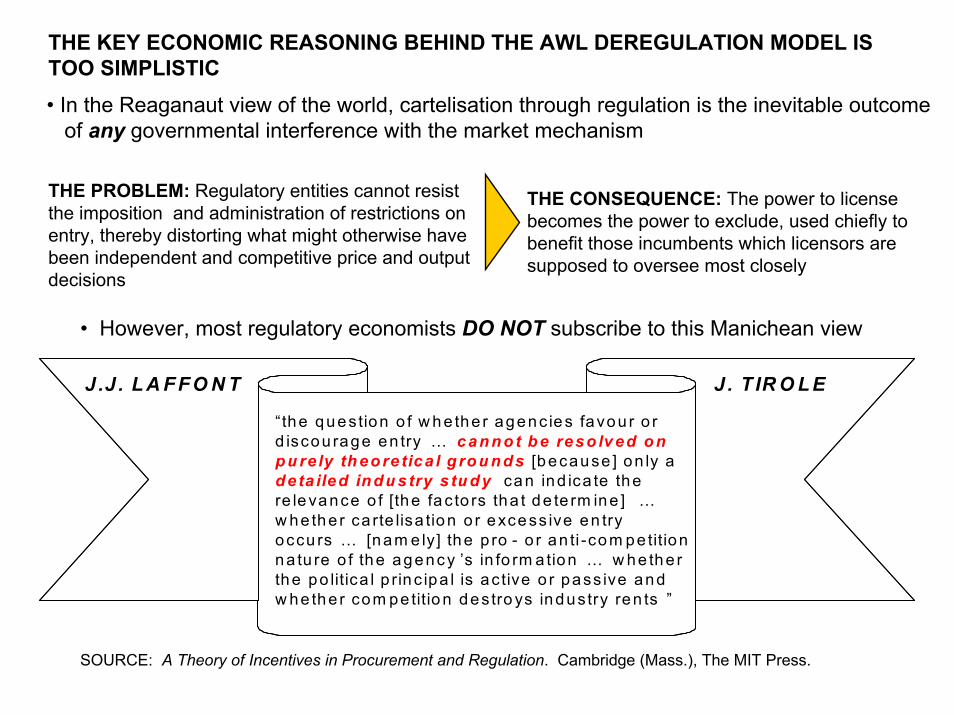
THE KEY ECONOMIC REASONING BEHIND THE AWL DEREGULATION MODEL IS TOO SIMPLISTIC• In the Reaganaut view of the world, cartelisation through regulation is the inevitable outcome
of any governmental interference with the market mechanism
THE PROBLEM: Regulatory entities cannot resist the imposition and administration of restrictions on entry, thereby distorting what might otherwise have been independent and competitive price and output decisions
THE CONSEQUENCE: The power to license becomes the power to exclude, used chiefly to benefit those incumbents which licensors are supposed to oversee most closely
“the question o f w h e the r agenc ies favou r o r d iscou rage en try … c an n o t b e reso lved o np u re ly th eo re tica l g ro u n d s [because ] on ly a deta iled ind u stry s tud y can ind ica te the re levance o f [the fa c to rs tha t de te rm ine ] …w he the r ca rte lisa tion o r excess ive en try occu rs … [nam e ly] the p ro - o r an ti -com pe titionna tu re o f the agency ’s in fo rm a tion … w he the rthe po litica l p rinc ipa l is ac tive o r pass ive andw he the r com pe titio n des tro ys industry ren ts ”
J .J . L A F F O N T J. T IR O L E
• However, most regulatory economists DO NOT subscribe to this Manichean view
SOURCE: A Theory of Incentives in Procurement and Regulation. Cambridge (Mass.), The MIT Press.
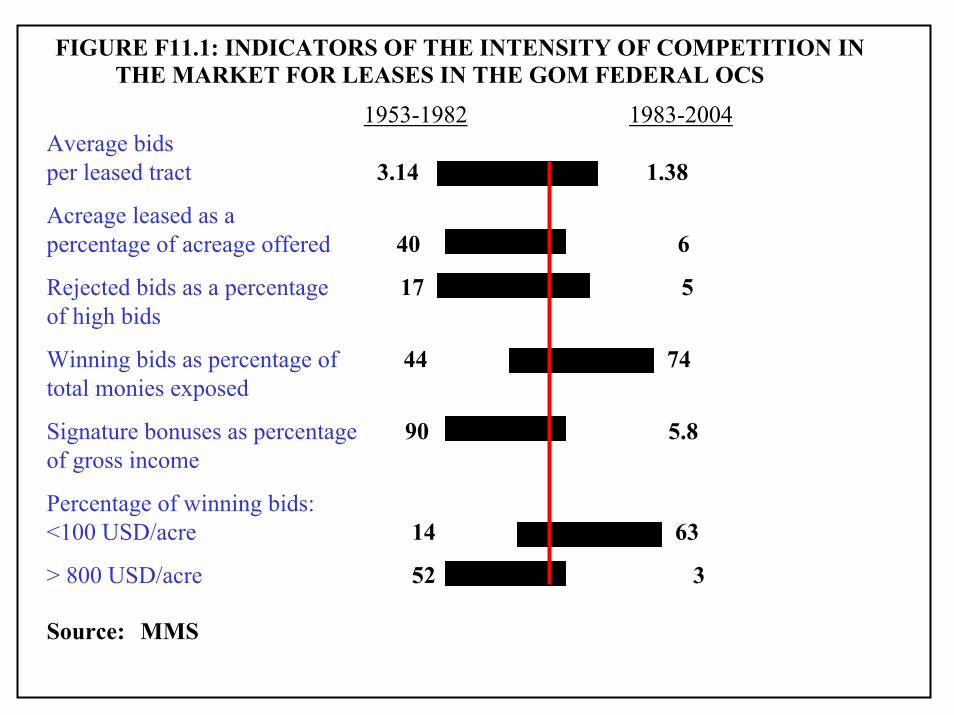
1953-1982 1983-2004Average bidsper leased tract 3.14 1.38
Acreage leased as apercentage of acreage offered 40 6
Rejected bids as a percentage 17 5of high bids
Winning bids as percentage of 44 74total monies exposed
Signature bonuses as percentage 90 5.8of gross income
Percentage of winning bids:<100 USD/acre 14 63
> 800 USD/acre 52 3
Source: MMS
FIGURE F11.1: INDICATORS OF THE INTENSITY OF COMPETITION IN THE MARKET FOR LEASES IN THE GOM FEDERAL OCS
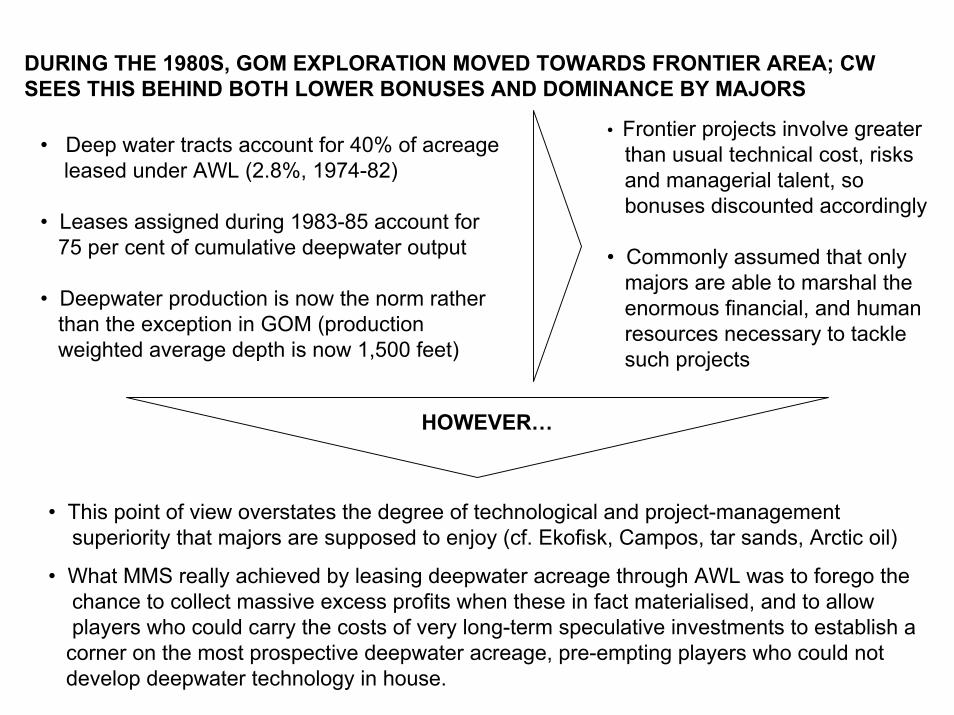
DURING THE 1980S, GOM EXPLORATION MOVED TOWARDS FRONTIER AREA; CW SEES THIS BEHIND BOTH LOWER BONUSES AND DOMINANCE BY MAJORS
• Deep water tracts account for 40% of acreageleased under AWL (2.8%, 1974-82)
• Leases assigned during 1983-85 account for 75 per cent of cumulative deepwater output
• Deepwater production is now the norm ratherthan the exception in GOM (production weighted average depth is now 1,500 feet)
HOWEVER…
• Frontier projects involve greater than usual technical cost, risks and managerial talent, so bonuses discounted accordingly
• Commonly assumed that only majors are able to marshal the enormous financial, and human resources necessary to tackle such projects
• This point of view overstates the degree of technological and project-management superiority that majors are supposed to enjoy (cf. Ekofisk, Campos, tar sands, Arctic oil)
• What MMS really achieved by leasing deepwater acreage through AWL was to forego the chance to collect massive excess profits when these in fact materialised, and to allow players who could carry the costs of very long-term speculative investments to establish a
corner on the most prospective deepwater acreage, pre-empting players who could not develop deepwater technology in house.

PROGRESSION OF OFFSHORE EXPLORATORY DRILLING AND PRODUCTION, 1947–2003
-10,000
-9,000
-8,000
-7,000
-6,000
-5,000
-4,000
-3,000
-2,000
-1,000
0
1947
1955
1959
1965
1967
1968
1969
1970
1974
1975
1976
1977
1978
1979
1982
1983
1984
1987
1988
1989
1991
1993
1994
1996
1997
1998
1999
2000
2001
2003
DE
PTH
IN F
EE
T
Kerr-McGee (Ship Shoal, GOM)
Exxon (California)
Shell (Gabon)
Esso (Thailand)
Esso (Surinam)
Shell (Mid-Atlantic OCS)
Shell (GOM, Mississippi Canyon)Shell (GOM, Alaminos Canyon)
Unocal (GOM, Alaminos Petrobrás (Campos)
Seagap (Congo)
Chevron (GOM, Atwater Valley)
Shell (GOM, Alaminos Canyon)
Shell (GOM, Cognac)
Shell (GOM, Bullwinkle)
Conoco (GOM, Jolliet)Shell (GOM, Auger, Mars, Ram/Powell)
Roncador
Shell (GOM, NaKika)
Shell (GOM, Mensa)
Exxon (California)
Marlim
Exploratory drilling
Deep water production(worldwide)
CFP (France)
Guaricema Enchova Garoupa Bonito Piraúna
Marimbá
Marlim Sul
Deep water production
(Brazil)
Sources: MMS, OTA, Shell, Petrobrás
EVOLUTION OF DEEP WATER E&P SHOWS THAT DEVELOPMENT IN GOM WOULD HAVE OCURRED WITHOUT AWL, WITH NON-MAJORS PLAYING PROMINENT ROLE
GOM deepwater development resumed when the oil industry acquired capability of workingworking in 2000+ ft. in other provinces (in 76 per cent of productive deepwater leases, first oil came after more than 8 years from assignation)
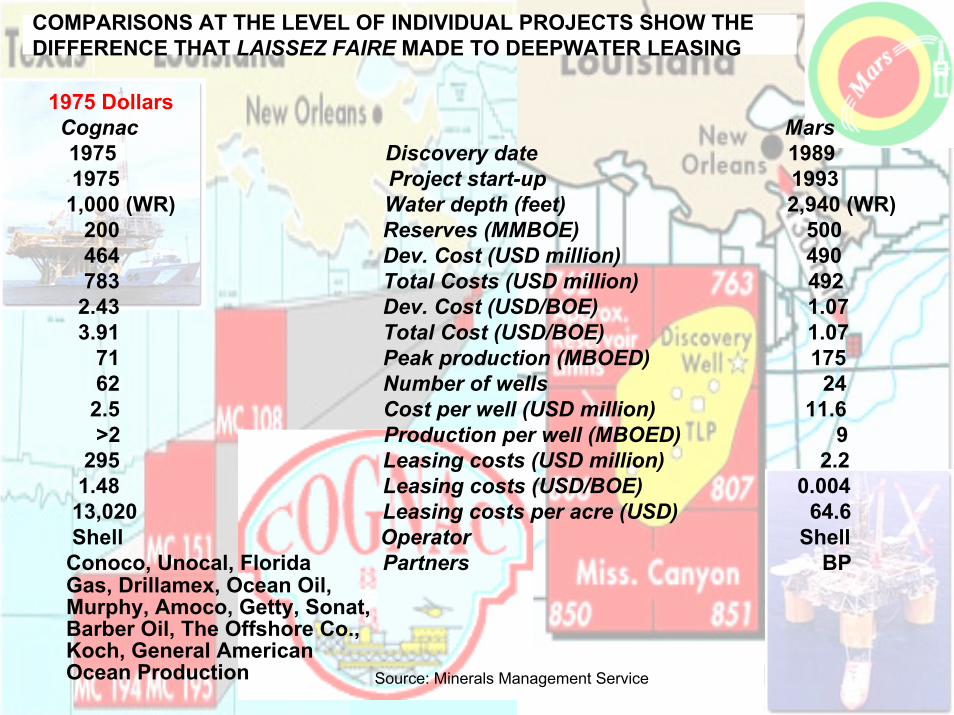
1975 DollarsCognac Mars1975 Discovery date 19891975 Project start-up 1993
1,000 (WR) Water depth (feet) 2,940 (WR)200 Reserves (MMBOE) 500464 Dev. Cost (USD million) 490783 Total Costs (USD million) 492
2.43 Dev. Cost (USD/BOE) 1.073.91 Total Cost (USD/BOE) 1.07
71 Peak production (MBOED) 17562 Number of wells 24
2.5 Cost per well (USD million) 11.6>2 Production per well (MBOED) 9
295 Leasing costs (USD million) 2.21.48 Leasing costs (USD/BOE) 0.004
13,020 Leasing costs per acre (USD) 64.6Shell Operator Shell
Conoco, Unocal, Florida Partners BPGas, Drillamex, Ocean Oil, Murphy, Amoco, Getty, Sonat,Barber Oil, The Offshore Co.,Koch, General AmericanOcean Production
COMPARISONS AT THE LEVEL OF INDIVIDUAL PROJECTS SHOW THE DIFFERENCE THAT LAISSEZ FAIRE MADE TO DEEPWATER LEASING
Source: Minerals Management Service
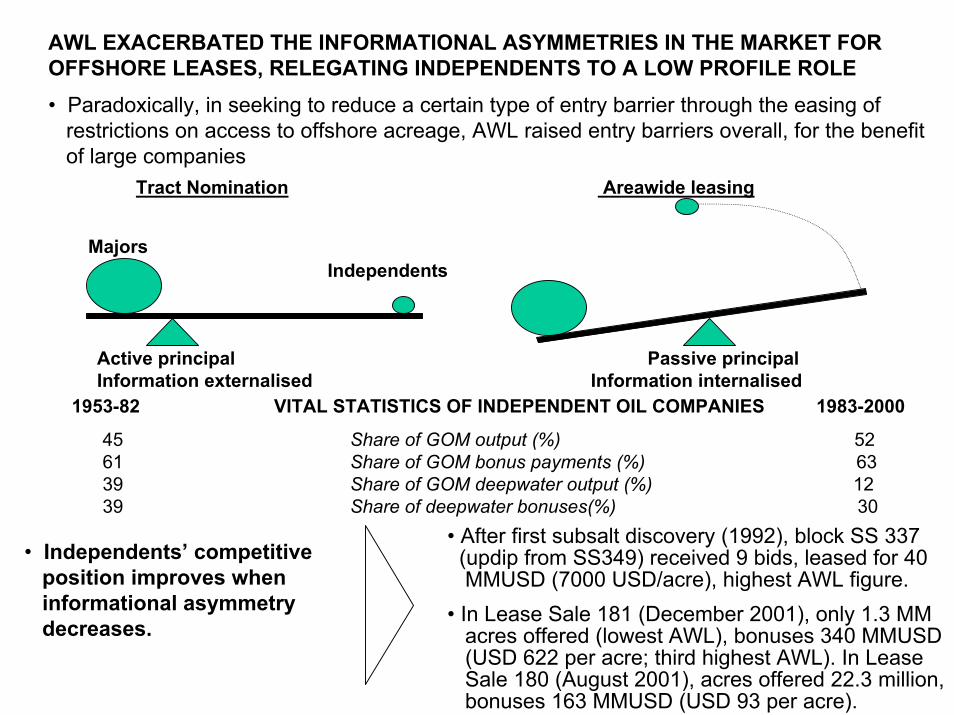
AWL EXACERBATED THE INFORMATIONAL ASYMMETRIES IN THE MARKET FOR OFFSHORE LEASES, RELEGATING INDEPENDENTS TO A LOW PROFILE ROLE• Paradoxically, in seeking to reduce a certain type of entry barrier through the easing of
restrictions on access to offshore acreage, AWL raised entry barriers overall, for the benefit of large companies
Tract Nomination Areawide leasing
Active principal Passive principalInformation externalised Information internalised
MajorsIndependents
1953-82 VITAL STATISTICS OF INDEPENDENT OIL COMPANIES 1983-2000
45 Share of GOM output (%) 5261 Share of GOM bonus payments (%) 6339 Share of GOM deepwater output (%) 1239 Share of deepwater bonuses(%) 30
• After first subsalt discovery (1992), block SS 337 (updip from SS349) received 9 bids, leased for 40 MMUSD (7000 USD/acre), highest AWL figure.
• In Lease Sale 181 (December 2001), only 1.3 MM acres offered (lowest AWL), bonuses 340 MMUSD (USD 622 per acre; third highest AWL). In Lease Sale 180 (August 2001), acres offered 22.3 million, bonuses 163 MMUSD (USD 93 per acre).
• Independents’ competitive position improves when informational asymmetry decreases.
WHAT LESSONS HAS THE INDUSTRY DRAWN FROM AREAWIDE LEASING?
• “The marketplace is the right place for decisions to be made regarding the allocation of natural resources” (James W. Watt, 1983)
• “The amount of money paid for an offshore lease depends on the level of interest that it manages to arouse in competing bidders, a factor more directly related to an area’s resource potential than to the method of leasing” (Office of Technology Assessment, US Congress, 1985).
• “Each leased tract from 1953 to 1981 drew an average of 3.3 bids, and this empirical evidence indicates that competition is effective in the OCS auction markets under conventional leasing conditions” (Walter J. Mead, 1994).
• “New leases should be awarded in perpetuity, effectively privatising the OCS oil resource,on the basis of a high pure bonus bid, capitalising royalty streams for a buyout”. (Walter J. Mead and Robert L. Bradley, 1998).
• “In 1997, Alaska changed the lease sale methodology. Formerly, the state offered areas for sale based on nominations by industry. Now all lease sales are areawide sales, in which all available acreage within a geographic region is included” (Alaska Department of Natural Resources, 2000)
• “The GOM licensing regime was radically changed in 1982, resulting in a system which became much more attractive than the previous out–dated system” (Arthur Andersen Petroleum Services, 2001)

WHAT LESSONS SHOULD WE DRAW FROM AWL? THE FISCAL DIMENSION
• Fiscally, true laissez faire leasing/licensing regimes are grievous (in GOM and UK North Sea, fiscal participation as a percentage of gross income is 19% and 16%, respectively)
• GOM lease payments are a fraction of US oil import bill (11% 1974-82, 8% 1983-2000),so US could afford to gamble with them in the pursuit of lower oil import dependence
But what about those governments for whom the real costs of oil production include the costs of running their respective countries?
Sources: Minerals Management Service, PEMEX
5%
15%
25%
35%
45%
55%
65%
75%
1976 1978 1980 1982 1984 1986 1988 1990 1992 1994 1996 1998 2000
MEXICO
US FEDERAL OCS
28%
1 percentage point at 2000 prices worth 737 MMUSD (0.47 USD/B)
FISCAL TAKE AS A PROPORTION OF GROSS E&P REVENUES FOR SELECTED PETROLEUM PROVINCES, 1976–2000
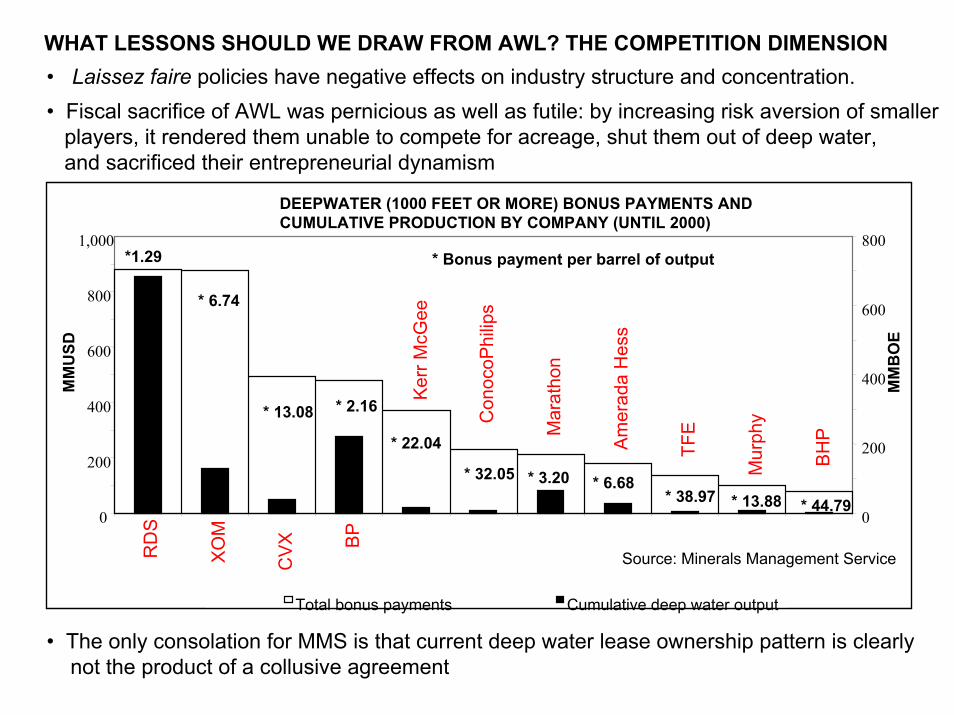
WHAT LESSONS SHOULD WE DRAW FROM AWL? THE COMPETITION DIMENSION• Laissez faire policies have negative effects on industry structure and concentration. • Fiscal sacrifice of AWL was pernicious as well as futile: by increasing risk aversion of smaller
players, it rendered them unable to compete for acreage, shut them out of deep water,and sacrificed their entrepreneurial dynamism
• The only consolation for MMS is that current deep water lease ownership pattern is clearly not the product of a collusive agreement
DEEPWATER (1000 FEET OR MORE) BONUS PAYMENTS AND CUMULATIVE PRODUCTION BY COMPANY (UNTIL 2000)
0
200
400
600
800
1,000X
OM
CV
X BP
Ker
r McG
ee
Con
ocoP
hilip
s
Mar
atho
n
Am
erad
a H
ess
TFE
Mur
phy
BH
P
MM
USD
0
200
400
600
800
MM
BO
E
Total bonus payments Cumulative deep water output
* Bonus payment per barrel of output*1.29
* 6.74
* 13.08 * 2.16
* 22.04
* 32.05 * 3.20 * 6.68* 38.97 * 13.88 * 44.79
RD
S
Source: Minerals Management Service
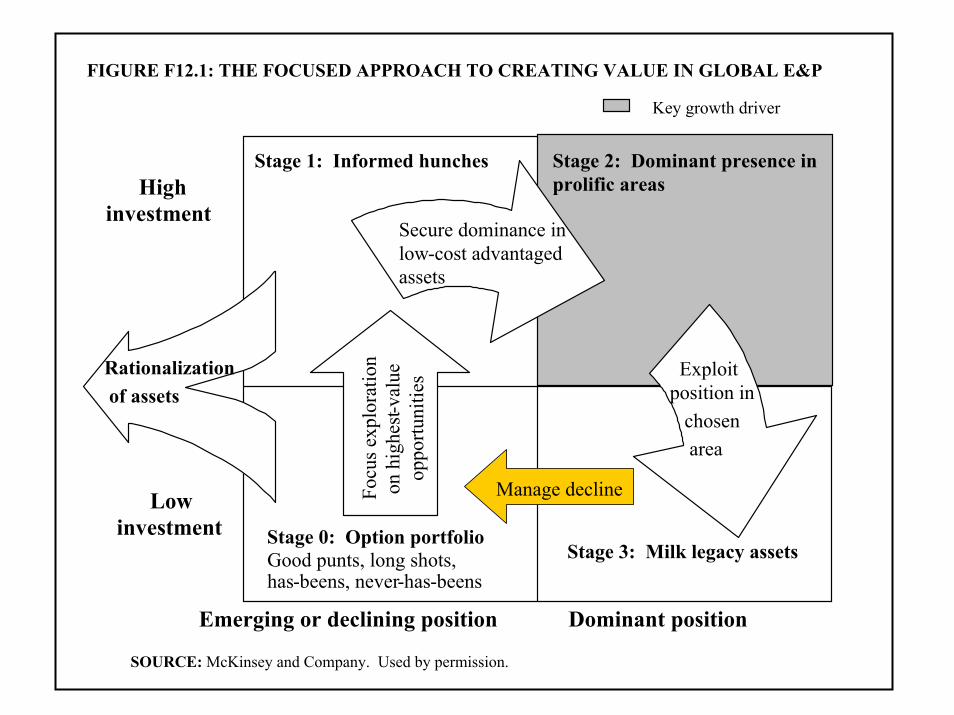
FIGURE F12.1: THE FOCUSED APPROACH TO CREATING VALUE IN GLOBAL E&P
Stage 1: Informed hunches Stage 2: Dominant presence in prolific areas
Rationalizationof assets
Emerging or declining position Dominant position
Stage 0: Option portfolioGood punts, long shots,has-beens, never-has-beens
Stage 3: Milk legacy assets
Focu
s exp
lora
tion
on h
ighe
st-va
lue
oppo
rtuni
ties
High investment
Low investment
Key growth driver
Exploit position in
chosen area
Secure dominance in low-cost advantaged assets
Manage decline
SOURCE: McKinsey and Company. Used by permission.

Stage 1: Informed hunches Stage 2: Dominant presence in prolific areas
Rationalizationof assets
Emerging or declining position Dominant position
Stage 0: Option portfolioGood punts, long shots,has-beens, never-has-beens
Stage 3: Milk legacy assets
Focu
s ex
plor
atio
n on
hi
ghes
t-val
ue
oppo
rtuni
ties
High investment
Low investment
Key growth driver
Exploit position in
chosen area
Secure dominance in low-cost advantaged assets
Manage decline
• Majors advantaged in placing wildcat bets on frontier plays
• Initial discoveries often made and developed by majors
What is the attraction of legacy assets?• For incumbent companies: lower operating/drilling costs (scale/experience), low tract acquisition costs, bargaining position against host and competitors enhanced•For governments: less competition for tracts, lower acreage prices, higher upstream entry barriers, increased fiscal dependence on fewer operators, potentially less
recovery of oil in place
• Approach to E&P based on “winner takes all”*notion: “playing to capture disproportionate share of value creation potential”• Objectives of WTA: owning best acreage/key infrastructure (control of basin development; rent extraction by infrastructure: 60% added to RDS field development value in GOM)• In oil, WTA creates entry barriers linked to land access and tenure (which are more difficult to surmount
than technology and capital barriers)
COMPANIES CAN ONLY SECURE SUCH DOMINANT POSITIONS IF GOVERNMENTS, AGAINST THEIR BEST INTERESTS, DO NOTHING TO PREVENT IT
* David Campbell and Ron Hulme “The Winner-Takes-All Economy”, The McKinsey Quarterly, 2001 (1)

THE POLITICAL LEGACY OF AWL IS PARALYSIS, CONFLICT AND LITIGATION
Evolution of OCS Drilling Moratoria1953-1982: 736,000 acres (CA)End 1983: 35 million acresEnd 1984: 52.2 million acresCurrently: 500 million acres
STATUS OF OCS LEASING PROGRAMME IN THE LOWER 48
SLA/OCSLA barred states from participating in developing OCS resources, and denied them fiscal compensation. AWL exacerbated tensions greatly.
Result?
USA failing to tap significant domestic energy resources despite concerns about oil imports
States/regions involved in court actions stemming from AWL
Source: Minerals Management Service
Q: Will something similar happen in countries stripped of the power to tax oil through legal fetters incorporated in PSAs, BITs and multinational investment agreements (like ECT)?
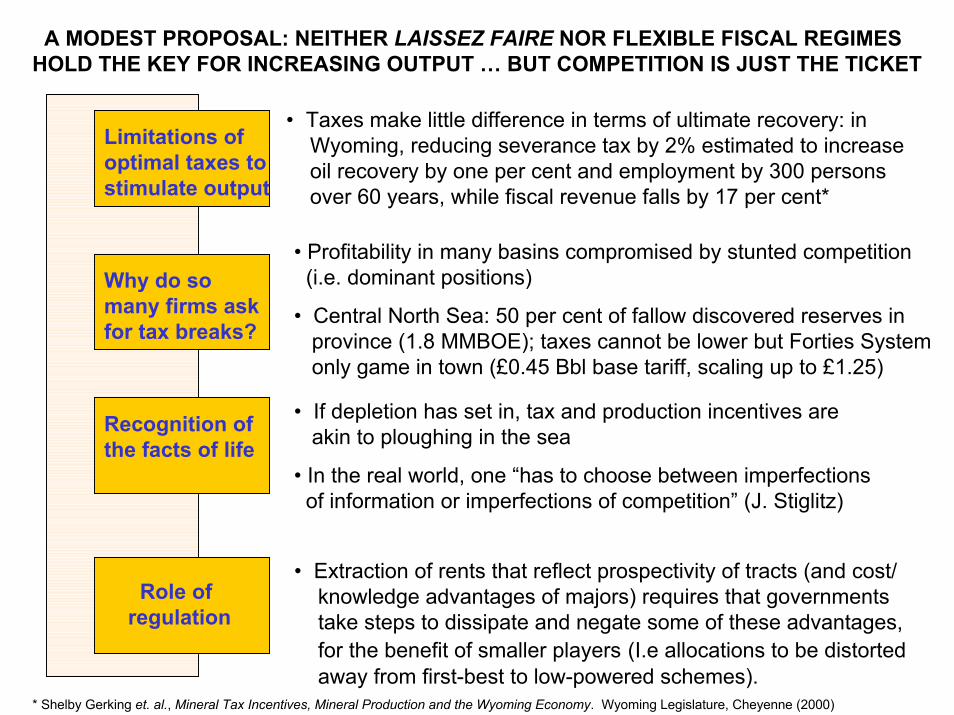
A MODEST PROPOSAL: NEITHER LAISSEZ FAIRE NOR FLEXIBLE FISCAL REGIMES HOLD THE KEY FOR INCREASING OUTPUT … BUT COMPETITION IS JUST THE TICKET
• Taxes make little difference in terms of ultimate recovery: in Wyoming, reducing severance tax by 2% estimated to increase oil recovery by one per cent and employment by 300 persons over 60 years, while fiscal revenue falls by 17 per cent*
• If depletion has set in, tax and production incentives are akin to ploughing in the sea
• In the real world, one “has to choose between imperfections of information or imperfections of competition” (J. Stiglitz)
• Extraction of rents that reflect prospectivity of tracts (and cost/ knowledge advantages of majors) requires that governments take steps to dissipate and negate some of these advantages,for the benefit of smaller players (I.e allocations to be distorted away from first-best to low-powered schemes).
Role of regulation
Recognition of the facts of life
Limitations of optimal taxes tostimulate output
Why do so many firms ask for tax breaks?
• Profitability in many basins compromised by stunted competition(i.e. dominant positions)
• Central North Sea: 50 per cent of fallow discovered reserves in province (1.8 MMBOE); taxes cannot be lower but Forties System only game in town (£0.45 Bbl base tariff, scaling up to £1.25)
* Shelby Gerking et. al., Mineral Tax Incentives, Mineral Production and the Wyoming Economy. Wyoming Legislature, Cheyenne (2000)

OIL PRODUCERS NEED TO DIGEST LESSONS OF AWL QUICKLY, BUT NONE MORE SO THAN MEXICO
BAHA (300+ MMBOE)
TRIDENT (300 MMBOE)
GREAT W HITE (500 MMBOE)
MEXICO
USA
• Soon (2010 at the latest, when drilling moratorium on western gap border expires) the Mexican government have to open the Mexican deepwater area to private investment, to prevent drainage of reserves from its side of the border.
• The Mexican government, unaccustomed to practicalities of granting licences, should look northwards (but at the TN system, not AWL!) for guidance on how to do it: small blocks, frequent block offerings, cash bonus bidding, vigorous regulatory presence
WESTERN
GAP
Strip covered bymoratorium