Embed Size (px)
Citation preview
Petrel Resources PlcAnnual Report and Accounts
Year ended 31 December 2011
Corporate Office:162 Clontarf Road, Dublin 3, Ireland.
Tel: +353 (0)1 833 2833Fax: + 353 (0)1 833 3505
Company Registration Number: 92622
www.petrelresources.com
Petrel Resou
rces Plc
An
nu
al Report &
Accou
nts
Year ended 31 D
ecember 2011
300668 Petrel Cover 21/06/2012 15:24 Page 1

Directors and Other Information
DIRECTORS J. Teeling (Chairman)D. Horgan (Managing Director)G. Delbes
SECRETARY J. Finn
REGISTERED OFFICE 162 Clontarf RoadDublin 3IrelandTelephone +353-1-833 2833Fax +353-1-833 3505Website: www.petrelresources.com
AUDITORS Deloitte & ToucheChartered Accountants and Registered AuditorsDeloitte & Touche HouseEarlsfort TerraceDublin 2
BANKERS Allied Irish Bank plcAnnesley BridgeNorth Strand RoadDublin 3
Commerzbank AGGallusanlage60329 Frankfurt
SOLICITORS Brown RudnickAlexandra HouseThe SweepstakesBallsbridgeDublin 4
NOMINATED ADVISOR & BROKER NorthlandCapital Partners Limited60 Gresham StreetLondonEC2V 7BB
REGISTRATION NUMBER 92622
AUTHORISED CAPITAL 200,000,000 €0.0125 Shares
CURRENT ISSUED CAPITAL 76,664,624 Shares
MARKET Alternative Investment Market
NUMBER OF SHAREHOLDERS 1,600
300668 Petrel Cover 21/06/2012 15:24 Page 2
Contents
Petrel Annual Report & Accounts 2011 1
Chairman’s Statement 2
Review of Operations 4
Directors’ Report 17
Statement of Directors’ Responsibilities 20
Independent Auditor’s Report 21
Consolidated Statement of Comprehensive Income 23
Consolidated Balance Sheet 24
Company Balance Sheet 25
Statements of Changes In Equity 26
Consolidated Cash Flow Statement 27
Company Cash Flow Statement 28
Notes to the Financial Statements 29
Notice of Annual General Meeting 48
Directors and Other Information Inside back cover
Petrel is an Irish Hydrocarbon exploration company with current activities in Iraq, Ghana and now offshore
Ireland. First formed in the 1980’s to explore offshore Ireland, Petrel entered into Iraq in 1999. We worked
diligently with the Iraqi Oil Ministry and in 2002 agreed an exploration lease on a 10,000 sq km area in the
Western Desert. This was approved by the Oil Ministry but not the supreme authority. Post 2004, Petrel was
successful in obtaining a large oil field construction contract, Subba and Luhais, and Technical Cooperation
Agreements on two undeveloped oil fields, Merjan and Dhufriyah. A local partner was imposed on Petrel at
the signing of the Subba and Luhais agreement. Difficulties arose in the execution of the contract and after
extensive negotiations Petrel withdrew from the contract with $7m in compensation and a 10% net profits
interest. The project is virtually complete but we expect no further payment.
Since 2008 we have applied to be pre-qualified for four licencing rounds. To date we have been unsuccessful.
When compared to the super-major and giant national oil companies who applied in the early rounds, our
small size militated against us – though we had strong in country experience. It must be said that even had
we pre-qualified there is no certainty that we would have completed a deal. Iraqi terms are very difficult and
it is not clear how economic they are for investors. But we remain committed to Iraq. It is the best and
cheapest place in the world to find oil and gas. The current political, economic and legal uncertainties will be
ironed out but it could take time. We have recognised that our existing structure has been unsuccessful so we
are in the process of establishing a new Baghdad based specialist oil team who will further our Block 6
interests as well as seeking out new opportunities.
In 2007 we got an opportunity to join with an associate company, Pan Andean Resources, now Clontarf
Energy, in an application to explore the Tano 2A Block onshore/offshore Ghana. Petrel brought a successful
body of technical experience to the application. Our share was, and is, 30% (Clontarf Energy 60%, local
Ghanaian interests 10%). An agreement was finalised in 2008 with the Ghanaian National Petroleum
Company (GNPC). The agreement was revised in 2010 and then awaited cabinet and parliamentary approval.
This has not yet been given. Delays in national resource agreements are common. Ghana has become in recent
years an emerging world class oil province. Close to the Tano 2A Block, the Jubilee field and surrounding
finds are estimated to contain billions of barrels of oil. Heightened levels of interest and activity in Ghanaian
oil places pressure on all parties involved. There is now far greater interest in the Tano area than there was in
2008. While accepting and understanding the delays, your directors have engaged directly with the GNPC to
determine how best to move the application through the process. We have agreed to certain guarantees and
bonds. We are hopeful that current efforts will lead to a successful conclusion in 2012.
Petrel began life in the early 1980’s as a minority partner in Irish offshore exploration. Given the technology
of the times, tough Irish terms, the oil price, and alternative opportunities, it was a brave initiative. It failed,
as it did for almost all offshore Irish drilling - only a few hits from 215 holes. But times change, exploration
technology improves, as have fiscal terms. In recent years there has been a revival of interest. Success in the
Corrib area of the Atlantic and more recently in the Celtic sea has sparked a revival. As always it is the juniors
who are first in. Using the best expertise in Irish offshore hydrocarbons, Petrel applied for and obtained
licence options over two groups of offshore blocks in the Porcupine Basin. Since the award of the licences,
2 Petrel Resources plc
Chairman’s Statement

Petrel Annual Report & Accounts 2011 3
Petrel has added to their large 1980’s database and began a seismic mapping and well analysis. We have
specific areas within the licences where we expect to identify promising targets. It is still very early days in
the revival but it is promising.
Looking Forward
For almost 30 years Petrel has been an oil explorer. Exploring is a high risk strategy which means we have a
high probability of failure. To date we have failed to deliver real value to our investors but we have survived.
In that time we have reinvented ourselves to work in three different continents, in Europe, Asia and Africa.
Where do we stand now? We have cash, over $4m, expertise, data, skills and live operations. We will continue
to work in Iraq, we are hopeful of a successful conclusion in Ghana and exciting prospects are opening up in
Ireland. But we are not satisfied. We are examining ways in which we can use all of the assets and expertise
in Petrel to revitalise interest in the company. In a time of massive economic uncertainty, Petrel, with cash, is
in a good position.
Chairman
25 June 2012
Chairman’s Statement (continued)
4 Petrel Resources plc
Review of Operations
Overview
Petrel has interests in Ghana, Iraq and offshore Ireland.
2012 was another difficult year for players working in Iraq. Official decision-making is drawn out. Productionhas been slow to expand.
Iraqi oil output is currently about 3 million barrels daily, or about the pre-2003 war level. Production targetsset since 2005 have been repeatedly missed.
Increasing production is essential for Iraq’s development. The authorities have repeatedly announced plansto increase output. But after a period of growth in 2010, output seems again to have flattened.
The geology is undoubted. Global demand is close to record high (at 91 million barrels daily of all liquids)and growing at close to long-term trend. OPEC quota limitations are no longer a serious constraint. The ArabSpring and sanctions on Iran have effectively removed any over-capacity among oil producers. There hasnever been a better time, in terms of demand and oil price outlook to be an explorer or developer of oilprojects.
In Ghana we continue to work towards ratification, having completed the initial technical work in 2011. Thiswork has highlighted a number of potential leads and prospects to pursue following ratification.
Petrel was also awarded licensing options over two groups of Irish offshore blocks (5.5 blocks in total) in thePorcupine Basin in the 2011 Atlantic Margin Licensing Round. High oil prices, new technology and recentdiscoveries demonstrate the potential in the Irish offshore. Our technical team has 30 years’ experience in thisregion. The key seismic and other data has been acquired and reprocessed, and already a number of leadsand prospects have been identified.
The global oil fundamentals are strong:
At a macro level, 2012 was another challenging year due to the ongoing European financial crisis. Globaldemand is close to historic highs at 91 million barrels daily of all liquids. Emerging markets especially Chinacontinued to grow but at a reduced rate.
The international oil price has corrected in the 2nd quarter of 2012, but this is due to out-flows of speculativeinvestments in commodities rather than to any underlying worsening of the supply-demand balance.Investors worry about the Eurozone crisis and recently slowing demand growth in the BRIC’s. But OECDdemand is now stable and no longer falling. Chinese growth remains strong, though not at the unsustainablelevel of recent years. Most industry planners anticipate average oil prices of circa $80. We do not anticipate areturn to long-run average prices.
The aftermath of the ‘Arab Spring’ has taken a net 1 million barrels out of the market while delaying anddeterring many new projects. Surplus capacity is at its lowest level in decades at circa 1.5 million barrels daily.
Petrel Annual Report & Accounts 2011 5
GHANA
Over the past year Ghana has solidified its status as the oil industry’s new hotspot; following the recentsuccess by Tullow / Kosmos in new (especially Cretaceous) plays generating an estimated 2.5 billion barrelsof recoverable oil. This production is concentrated in Cretaceous reservoirs of the Tano Basin in westernGhana.
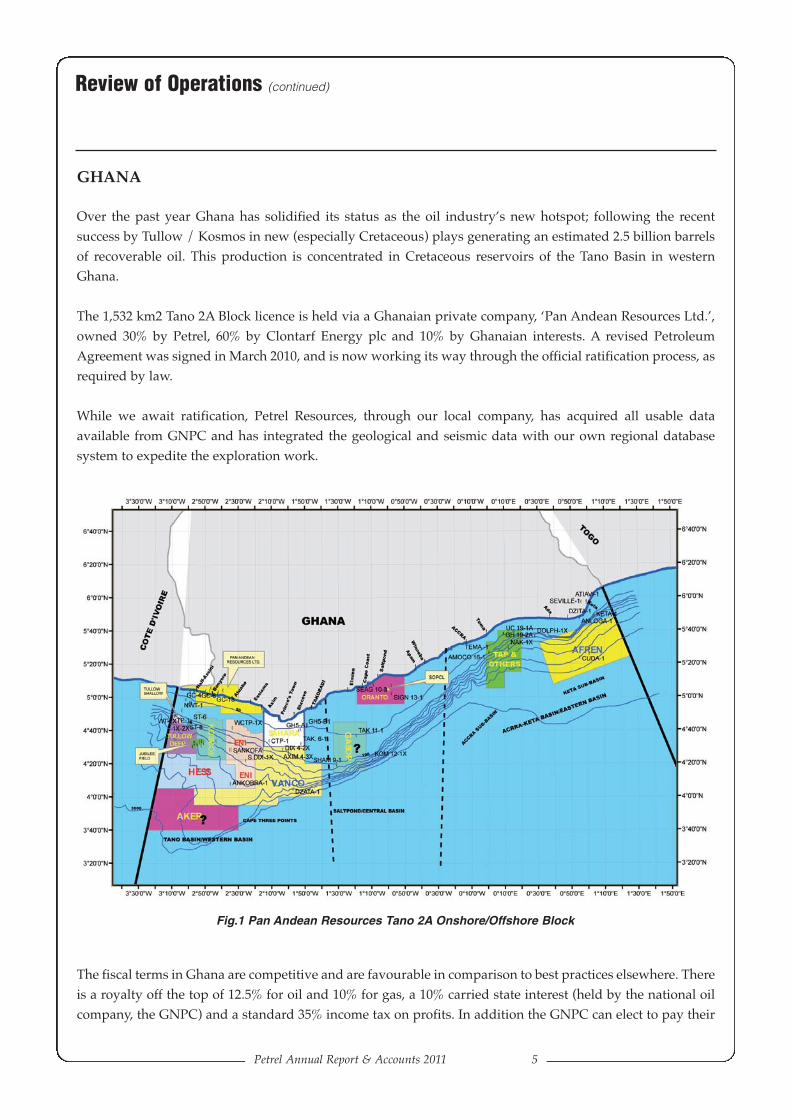
The 1,532 km2 Tano 2A Block licence is held via a Ghanaian private company, ‘Pan Andean Resources Ltd.’,owned 30% by Petrel, 60% by Clontarf Energy plc and 10% by Ghanaian interests. A revised PetroleumAgreement was signed in March 2010, and is now working its way through the official ratification process, asrequired by law.
While we await ratification, Petrel Resources, through our local company, has acquired all usable dataavailable from GNPC and has integrated the geological and seismic data with our own regional databasesystem to expedite the exploration work.
The fiscal terms in Ghana are competitive and are favourable in comparison to best practices elsewhere. Thereis a royalty off the top of 12.5% for oil and 10% for gas, a 10% carried state interest (held by the national oilcompany, the GNPC) and a standard 35% income tax on profits. In addition the GNPC can elect to pay their
Review of Operations (continued)
Fig.1 Pan Andean Resources Tano 2A Onshore/Offshore Block
6 Petrel Resources plc
Review of Operations (continued)
way for a further 15%. There is also a super-profits tax or ‘Additional Oil Entitlement (AOE)’ which is payableaccording to the overall Rate of Return. This extra ‘bonanza tax’ does not apply for a rate of return under12.5%. The Additional Oil Entitlement rises in a step function with returns to a maximum of 30% for projectand an IRR over 27.5%. There are also the normal, relatively modest land rentals plus Training Allowanceplus an additional ‘Technology Support’ one-time payment.
The primary terms of the renegotiated Tano Agreement are summarised as follows:
• The licence is divided into an initial period of three years (the “Initial Exploration Period”), a firstextension period of two years (“First Extension Period”) and a second extension period of one and ahalf years (“Second Extension Period”)
• During the Initial Exploration Period, the Contractor must;(1) Reprocess all existing 2D seismic data covering the licence area (now done);(2) Acquire, process and interpret at least 1,000 km2 of new 3D seismic data; and(3) Drill a minimum of one exploration well.
• The minimum expenditure during the initial exploration period is US$25 million for one well onshoreor US$35 million for an offshore well.
• A training allowance of $250,000 per annum and a one-off technology payment of $1 million.
This equates to a total state take of circa 50%, which compares well with other oil provinces.
There are risks in West Africa but contractors are well-remunerated if they discover and produce oil. We arenow focused on the ratification of the agreement. All Ghanaian Petroleum Agreements are subject to Cabinetapproval and ratification by Parliament. Ratification is a notoriously slow process in West Africa, so we usedthe time to push ahead with our technical work.
Operations
Our local company, Pan Andean Resources, purchased extensive data regarding the Tano 2A Block fromGNPC including 42 geological reports and 676km of 2D seismic data. We reviewed the four seismic surveydatasets – both onshore and offshore - which was shot and originally processed by different companies. Ourteam identified a significant number of leads and prospects from an analysis of the data. The initialinterpretation of the main seismic surveys was completed in the middle of 2011.
Data quality was generally poor to fair, so much work was required to maximise the value of the database.This reflects the data’s vintage, together with some apparent defects in the processing parameters. However,it also reflects the challenges in acquiring quality seismic data in the shallow water and surf zone conditionsimmediately offshore, and the frequently swampy nature of the coastal plain. Future reprocessing of diverseoriginal data would provide a more uniform database, and improve the seismic data in terms of statics,velocities, frequency content and multiple elimination. In turn, this will help to minimise the ‘mis-tie’problems between the different surveys that bedevil such exploration.
Petrel Annual Report & Accounts 2011 7
We interpreted five horizons of different depths, and produced ‘time structure maps’ of acceptable reliabilityfor two horizons. While these maps show the overall form of the basin, they are insufficiently detailed toallow prospect definition. Therefore a second analysis was conducted to scrutinise all seismic linesindividually. This work aimed to define areas of structural or stratigraphic potential, and develop play orprospect leads. This project was completed in May 2011. Data quality and grid spacing did not allow drillableprospects to be outlined, but we succeeded in identifying areas of greater promise within the Tano 2A Block.
There are numerous surface seeps and tar mats onshore and some of these were exploited by shallow wellsin the 1890’s and early 1900’s. This prompted Gulf in the 1950’s to drill four spaced onshore wells along thecoastline, but without the benefit of seismic control. These proved a southward thickening (>3,000 metres)Cretaceous-Cenozoic sedimentary section, with oil shows. In the 1980’s, under an assistance agreementGNPC/PetroCanada drilled a series of shallow (c. 600 metres) wells to gain further onshore control. Most ofthese wells, again drilled without seismic control, encountered oil shows. Seismic data acquired by GNPC inseveral short surveys after that time is only of poor to fair quality. One commercial well – Fusion 1X (1981) –drilled after the seismic acquisition – was located at the basin margin and had a Total Depth in Basement atonly 590 metres, without success. The drilled onshore sections have generally low source potential and nomature source sequence has been identified in the onshore wells. The onshore oil seeps are being fed by activesource systems in some part of the offshore area.
No wells have been drilled offshore on the Tano 2A Block and seismic data acquired by GNPC is of only fairquality. Wells drilled elsewhere on the Tano shelf in the 1960’s and 1970’s – generally located on LowerCretaceous fault structures – all encountered flows of oil. However, the Lower Cretaceous sand reservoirquality proved to be poor, and despite prolonged and concerted efforts during the 1980’s, it has not provedto be possible to bring these oil accumulations to production. After a period of relative inactivity, this picturehas dramatically changed in the last few years. The discovery in the deep water of the Tano Basin of largevolumes of oil in high quality Upper Cretaceous reservoirs has changed the outlook for the entire basin.
The following points can be made with respect to source rocks offshore in the Tano Basin:-• Active oil and gas kitchens are clearly operating on a regional scale.• Cenomanian-Turonian anoxic sediments have probably acted as the major source interval, whilst the
Campanian - Maastrichtian has good source potential in some wells.• Source rock sections in wells on the Tano shelf are in the oil window, particularly in the deeper off-
structure areas.• Upper Cretaceous source rocks probably entered the main oil generation phase in mid-Cenozoic time,
and the systems are still active.
Studies carried out earlier by offshore operators, particularly on the South Tano Field, and Dana WT-1x wellson the outer shelf, together with onshore oil samples, suggest that all these oils were sourced fromCenomanian-Turonian source rocks in deeper water. It is evident that large volumes of oil from UpperCretaceous source sequences on the outer shelf or slope have migrated shoreward and up-dip to the coast.When the licence is ratified, the challenge for the company is to improve the existing seismic database and toacquire new and better quality seismic data. The aim is to identify potential targets within which some of theshoreward migrating oil has been trapped, particularly within quality Upper Cretaceous reservoirs.
Review of Operations (continued)
8 Petrel Resources plc
Review of Operations (continued)
Accordingly, the initial work conducted so far has confirmed the prospectivity of the Block. We are ready topush ahead with the 2D seismic and other work as soon as the ratification is confirmed.
IRAQ
Petrel has a pre-2003 agreement in Iraq on the former Block 6 in the Western Desert between Baghdad andJordan.
The critical problem in Iraq so far has been the service contract system which effectively limits returns to alevel that is sub-economic in current circumstances. Qualification rules has effectively limited bidding to thelargest major and National Oil Companies – who are not the most agile in challenging situations.
Since 2005 the Iraqi authorities have awarded only service contracts, especially during the four bid roundsthat have been conducted so far. Production Sharing Agreements (PSAs) have been awarded by the KurdishRegional authorities, though their validity is contested by Baghdad – which controls the export pipelines.Iraqi reserves have been revised upwards to 143 billion barrels, equal to 130 years at current production. IraqiGas reserves are 127 trillion cubic feet, of which free gas is 34.6, and associated gas 92.1tcf. Official exportcapacity is 3.25 million barrels daily, of which 2.6 is from southern facilities.
Iraq has undertaken large-scale oil export projects, including development of new offshore loading facilitiesto deliver an additional 3.4 million barrels per day (bpd) in spare export capacity. A bottle-neck is waterinjection. But projects like ExxonMobil's water injection system, have been put in doubt by disputes betweencompanies and the authorities. Without delivery of such infrastructure Iraq's oil investments cannot beimplemented or generate adequate returns.
The authority of the central government has been eroded and it is possible that other regional authorities mayseek to follow the example of the Kurdish Regional Authorities and seek to negotiate their own oil & gascontracts. We are monitoring these developments and will adjust our approach as appropriate.
Long delays and bureaucracy have been frustrating in recent years. Petrel is a junior, and not a super-majoror NOC willing to subsidise projects for long-term strategic reasons yet we want to be involved. We arebuilding a new organisation structure in Baghdad to pursue new opportunities.
The difficulty is to do with the licensing terms and remuneration rather than technical or geological concerns.With the departure of international forces and a diminution of civil conflict, there is now no serious securityor logistical barrier to developing southern Iraqi oil fields or exploring in most of Iraq.
Most of Iraq's proven oil is in very large and fairly easy-to-access shallow oil fields convenient for transit linesand away from cities. This makes the hydrocarbons easy and cheap to lift, and thus profitable. But 32 yearsof conflict and sanctions have impacted infrastructure.
2010 Iraqi output averaged 2.36 million bpd, rising 12% to an average 2.65 million bpd in 2011. Current (June2012) exports are estimated at circa 2.7 million bpd, out of total output of 3.03.
Petrel Annual Report & Accounts 2011 9
Despite the progress, official production targets, such as 3.4 million bpd by end 2011 have been missed. Iraqhas not yet completed upgrades to export and storage facilities necessary for greater output. Iraqi oilproduction capacity is therefore effectively limited to export capacity, currently under 2 million bpd.
Iraq is working on expanding Basra's oil terminals’ export capacity to 4.8 million bpd by 2014. Four mooringfacilities, each of circa 0.9 million bpd of capacity, are due by 2014. Unfortunately, this key infrastructureproject has also suffered delays. It is clear therefore that the current licensing terms and approach have notyet achieved the planned major increases in output and exports.
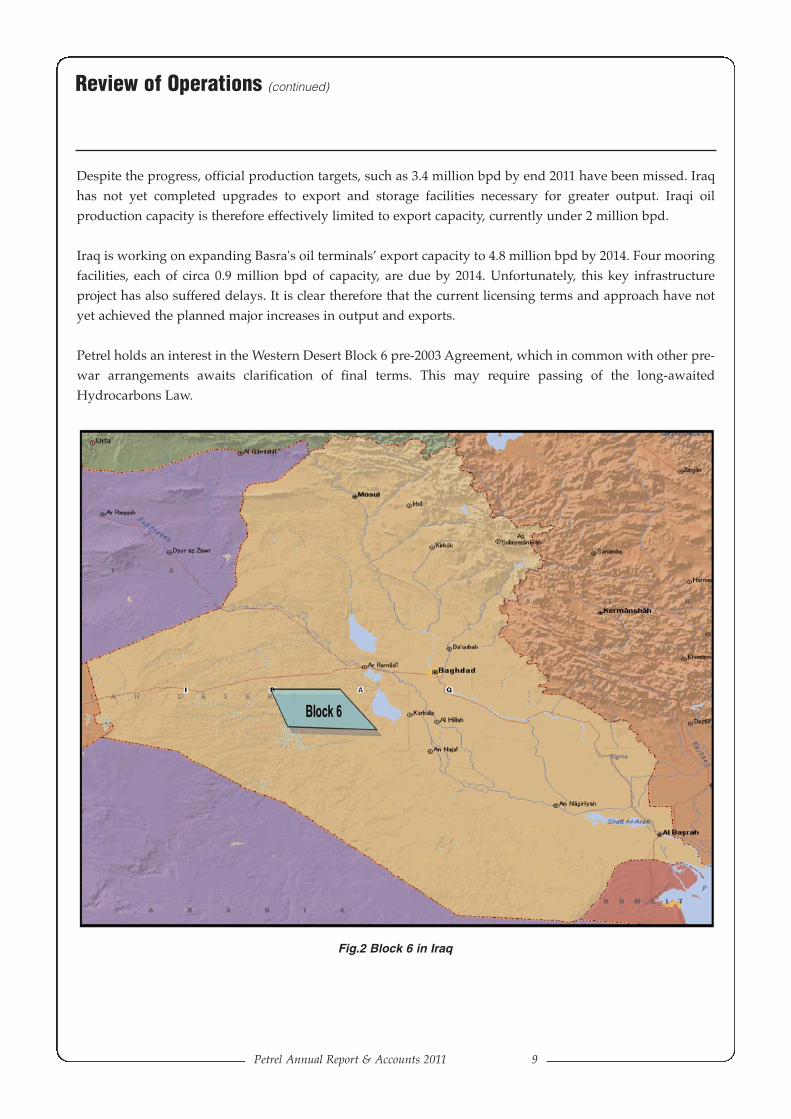
Petrel holds an interest in the Western Desert Block 6 pre-2003 Agreement, which in common with other pre-war arrangements awaits clarification of final terms. This may require passing of the long-awaitedHydrocarbons Law.
Review of Operations (continued)
Fig.2 Block 6 in Iraq
10 Petrel Resources plc
Review of Operations (continued)
OFFSHORE IRELAND
Recent drilling success has greatly enhanced the attractiveness of Offshore Ireland’s oil & gas explorationacreage. The high and sustained oil price, attractive fiscal terms, a strong local gas market linked byinterconnectors to Scotland and the greater European gas network and exploration successes in similar playselsewhere are transforming industry attitudes to Ireland. Several inter-related improvements in technologyhave improved the efficiency of seismic and wells, which in turn has reduced capital cost and risk.
Recent attention has focused on re-entry of 1970’s and 1980’s discoveries that were formerly deemed to besub-economic, culminating in the 2012 discovery at Ballyroe, offshore Cork in the Celtic Sea. Following theinitial results it now appears that output of 50,000 barrels per day may now require only four wells (costing$25 million each) rather than the up to 30 wells previously assumed. This, in turn, transforms the economicsand perceptions of offshore Irish oil production. However the really large potential lies in Atlantic waterswhere there is potential for much larger structures and stratigraphic traps. So the deeper water and morechallenging conditions is more than compensated by the much greater potential.
All the relevant technical parameters have improved in recent years: 3D seismic allows explorers to bettermap structures, Technology opens doors & minds. The recent discovery at Ballyroe in the Celtic Sea is anexample of this; shooting 3D seismic gave a clearer view of the structure, and connectivity of reservoirs. Thisallowed an increase in estimated reserves from a sub-economic level to 59 million barrels (P50) and possiblytwice that. The lesson for us is that we should re-look at everything in the data record and see where it canbe enhanced and what opportunities have arisen because of economic and technology changes. Explorationbegins again every 15 years.
Licence Award
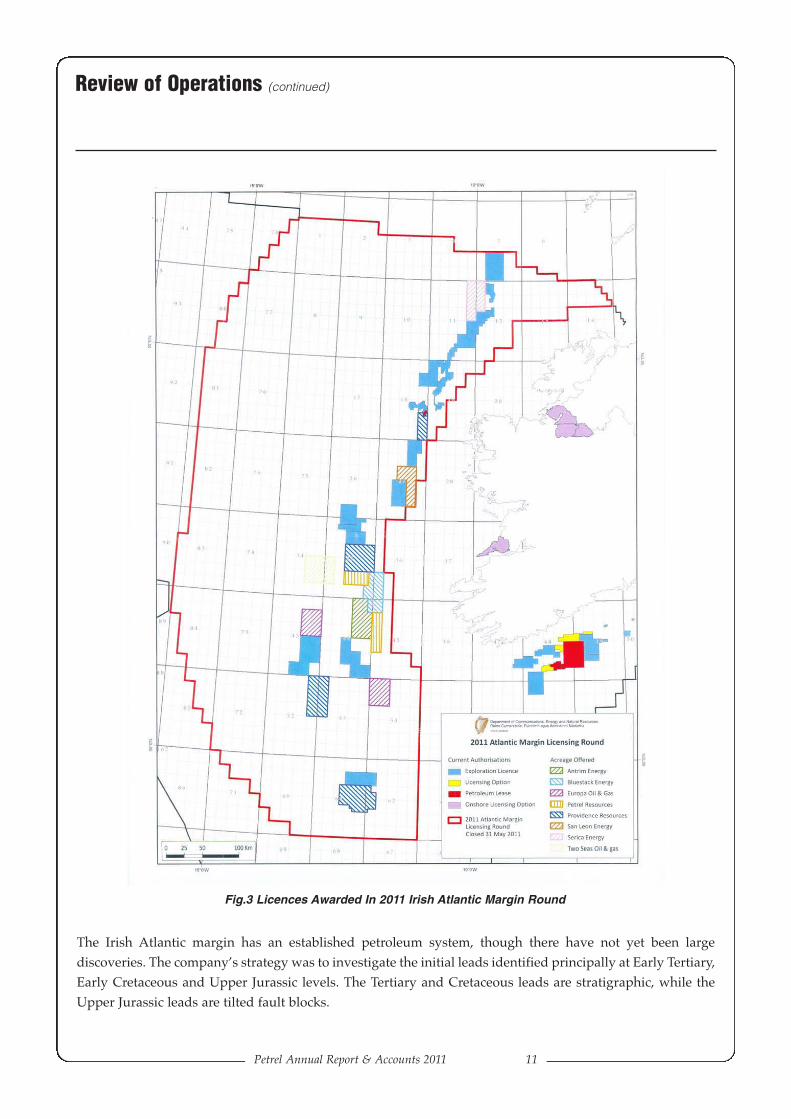
The 2011 Atlantic Margin Licensing Round saw a high number of applications for a frontier licensing roundin the Irish offshore. Petrel Resources were successful in being awarded (October 2011) licensing options overtwo sets of blocks in the Porcupine Basin: Blocks 35/23, 35/24 and the western half of 35/25, and also Blocks45/6, 45/11 and 45/16.
There was considerable industry interest in the current round and we are delighted to have been offered twoof our applications (figure 3). A combination of good geological potential and fiscal terms as well as a teamwith a long history in Irish petroleum geology made this an opportune time to re-discover opportunities inIrish offshore.
Evolving industry knowledge is part of the general development of the Atlantic transform margin idea thathas led to several major discoveries offshore Africa, which may extend further north to the northernEuropean offshore and even across the Atlantic. Explorers are now looking for more subtle structures andpotentially huge stratigraphic plays that were not visible on historic seismic.
Petrel Annual Report & Accounts 2011 11
The Irish Atlantic margin has an established petroleum system, though there have not yet been largediscoveries. The company’s strategy was to investigate the initial leads identified principally at Early Tertiary,Early Cretaceous and Upper Jurassic levels. The Tertiary and Cretaceous leads are stratigraphic, while theUpper Jurassic leads are tilted fault blocks.
Review of Operations (continued)
Fig.3 Licences Awarded In 2011 Irish Atlantic Margin Round
12 Petrel Resources plc
Review of Operations (continued)
Irish fiscal terms are competitive internationally. The tax regime is a special Corporate Tax rate of 25%applying to profits from petroleum production and an additional Profit Resource tax of between 5% and 15%that applies in the case of more profitable fields. The Profit Resource Tax is determined by the ratio of profitto capital invested.
The 2011 Atlantic Margin Licensing Round held by the Department of Communications, Energy and NaturalResources closed in May 2011 and awards were made in October 2011. Almost 1,000 blocks were on offer inthe Round comprising almost 500,000 km2 and covering most of the Irish Atlantic margin prospectiveacreage. Petrel Resources plc. held a significant seismic and well database for much of the Irish Atlanticmargin. For both geological and strategic reasons it was decided to concentrate efforts on seeking acreage inthe Porcupine Basin in the 2011 Irish Frontier Licensing Round. Using its database, the company carried outa regional assessment of the basin in order to identify potentially prospective prospects. Historically,exploration in the Porcupine Basin has been in pursuit of targets similar to those in the northern North Sea.Our regional study identified tilted Jurassic fault block prospects similar to those that have been a focus fordrilling in the past. The drilling effort by the exploration industry has unfortunately failed to locate Jurassicreservoirs to match those of the North Sea province, and a more innovative exploration approach was clearlyrequired. Therefore, while recognising that Jurassic structures held potential, Petrel Resources focused itsstudies on identifying prospects in the post-Jurassic succession within the basin. Significant pulses ofpotential reservoir sand input into the basin occurred during both Early Cretaceous and Early Tertiary timesyielding potential reservoir rocks. However, such leads have remained largely undrilled because of the subtlestratigraphic nature of most of the potential traps.
The exploration potential at both stratigraphic levels was further enhanced in the company’s regional study,and the decision taken to concentrate on potential plays and leads identified along the eastern margin of thebasin. To this end, further seismic and well data were purchased to strengthen the dataset in the areas ofinterest and aid in the application. The recent discoveries by Tullow in Ghana, as well as other explorationcompanies, in stratigraphic traps have shown the potential for these plays.
There have been significant technical changes since the main phase of Porcupine Basin drilling in the late1970’s and early 1980’s. Improved seismic techniques allow higher quality imaging than was possible at thattime. Also, the discovery during the last decade of large volumes of hydrocarbons in subtle stratigraphic trapsoffshore West Africa, South America, the North Sea, and elsewhere has given the industry the confidence topursue similar targets in other provinces and to move away from its traditional focus on drilling only closedstructural traps. Despite the indications of active petroleum systems, the Porcupine Basin is under-exploredand activity has languished in recent decades. The company feels the need to use its experience and beinvolved in the region. Re-appraisal of the basin is overdue, driven by higher oil prices, improved seismic anddrilling techniques, and by a better understanding of subtle deep water sand reservoirs. A commercialdiscovery would change the whole outlook for the basin.
Technical Work
Since the award of the blocks Petrel Resources has acquired additional necessary seismic and well data fromthe Petroleum Affairs Division of the Department of Communications, Energy and Natural Resources in
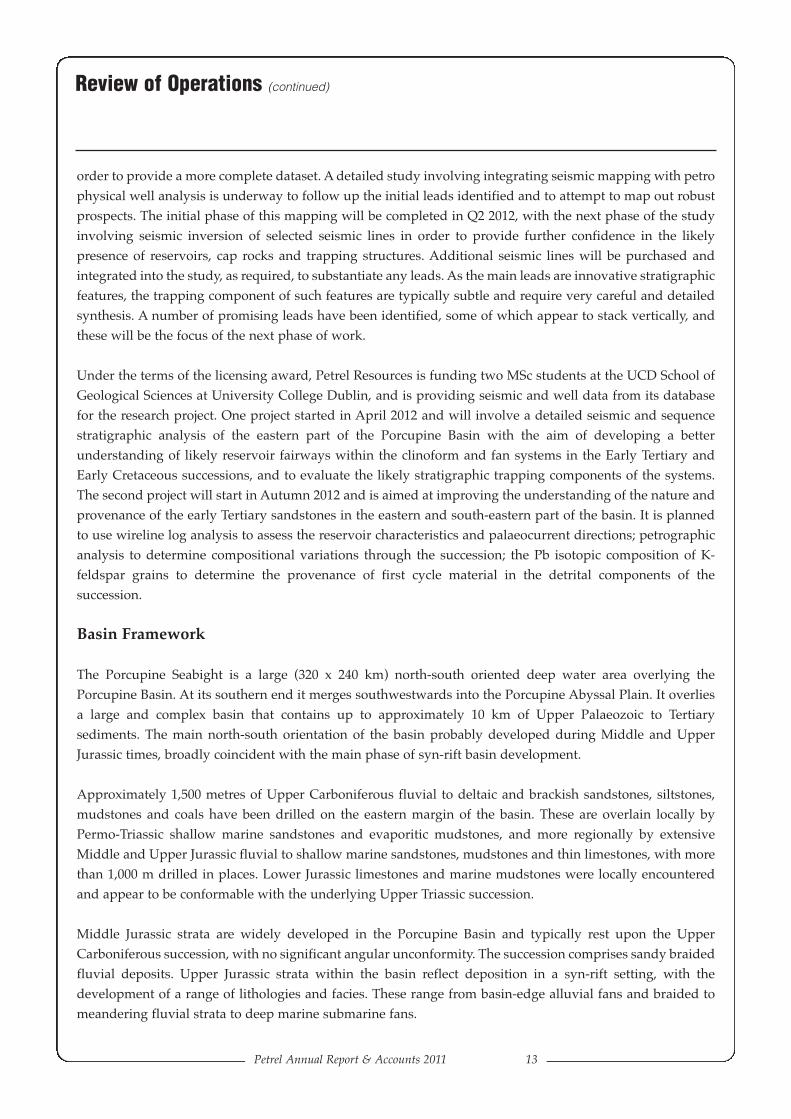
Petrel Annual Report & Accounts 2011 13
order to provide a more complete dataset. A detailed study involving integrating seismic mapping with petrophysical well analysis is underway to follow up the initial leads identified and to attempt to map out robustprospects. The initial phase of this mapping will be completed in Q2 2012, with the next phase of the studyinvolving seismic inversion of selected seismic lines in order to provide further confidence in the likelypresence of reservoirs, cap rocks and trapping structures. Additional seismic lines will be purchased andintegrated into the study, as required, to substantiate any leads. As the main leads are innovative stratigraphicfeatures, the trapping component of such features are typically subtle and require very careful and detailedsynthesis. A number of promising leads have been identified, some of which appear to stack vertically, andthese will be the focus of the next phase of work.
Under the terms of the licensing award, Petrel Resources is funding two MSc students at the UCD School ofGeological Sciences at University College Dublin, and is providing seismic and well data from its databasefor the research project. One project started in April 2012 and will involve a detailed seismic and sequencestratigraphic analysis of the eastern part of the Porcupine Basin with the aim of developing a betterunderstanding of likely reservoir fairways within the clinoform and fan systems in the Early Tertiary andEarly Cretaceous successions, and to evaluate the likely stratigraphic trapping components of the systems.The second project will start in Autumn 2012 and is aimed at improving the understanding of the nature andprovenance of the early Tertiary sandstones in the eastern and south-eastern part of the basin. It is plannedto use wireline log analysis to assess the reservoir characteristics and palaeocurrent directions; petrographicanalysis to determine compositional variations through the succession; the Pb isotopic composition of K-feldspar grains to determine the provenance of first cycle material in the detrital components of thesuccession.
Basin Framework
The Porcupine Seabight is a large (320 x 240 km) north-south oriented deep water area overlying thePorcupine Basin. At its southern end it merges southwestwards into the Porcupine Abyssal Plain. It overliesa large and complex basin that contains up to approximately 10 km of Upper Palaeozoic to Tertiarysediments. The main north-south orientation of the basin probably developed during Middle and UpperJurassic times, broadly coincident with the main phase of syn-rift basin development.
Approximately 1,500 metres of Upper Carboniferous fluvial to deltaic and brackish sandstones, siltstones,mudstones and coals have been drilled on the eastern margin of the basin. These are overlain locally byPermo-Triassic shallow marine sandstones and evaporitic mudstones, and more regionally by extensiveMiddle and Upper Jurassic fluvial to shallow marine sandstones, mudstones and thin limestones, with morethan 1,000 m drilled in places. Lower Jurassic limestones and marine mudstones were locally encounteredand appear to be conformable with the underlying Upper Triassic succession.
Middle Jurassic strata are widely developed in the Porcupine Basin and typically rest upon the UpperCarboniferous succession, with no significant angular unconformity. The succession comprises sandy braidedfluvial deposits. Upper Jurassic strata within the basin reflect deposition in a syn-rift setting, with thedevelopment of a range of lithologies and facies. These range from basin-edge alluvial fans and braided tomeandering fluvial strata to deep marine submarine fans.
Review of Operations (continued)
14 Petrel Resources plc
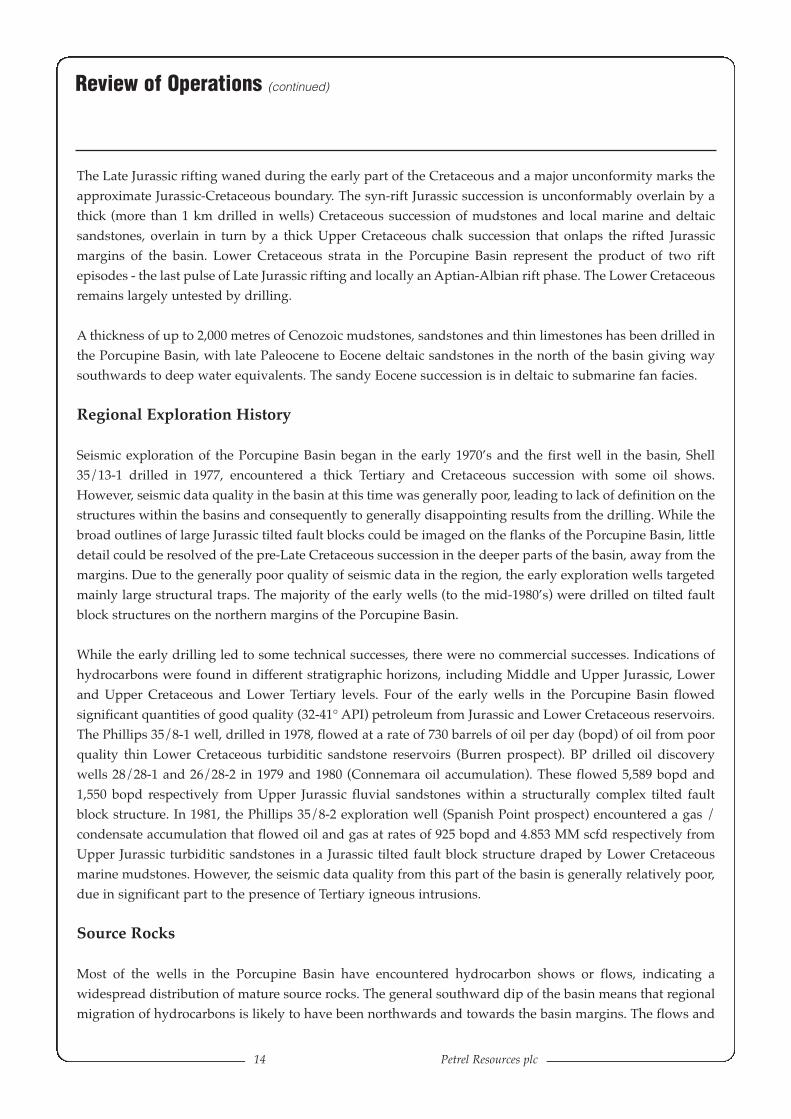
The Late Jurassic rifting waned during the early part of the Cretaceous and a major unconformity marks theapproximate Jurassic-Cretaceous boundary. The syn-rift Jurassic succession is unconformably overlain by athick (more than 1 km drilled in wells) Cretaceous succession of mudstones and local marine and deltaicsandstones, overlain in turn by a thick Upper Cretaceous chalk succession that onlaps the rifted Jurassicmargins of the basin. Lower Cretaceous strata in the Porcupine Basin represent the product of two riftepisodes - the last pulse of Late Jurassic rifting and locally an Aptian-Albian rift phase. The Lower Cretaceousremains largely untested by drilling.
A thickness of up to 2,000 metres of Cenozoic mudstones, sandstones and thin limestones has been drilled inthe Porcupine Basin, with late Paleocene to Eocene deltaic sandstones in the north of the basin giving waysouthwards to deep water equivalents. The sandy Eocene succession is in deltaic to submarine fan facies.
Regional Exploration History
Seismic exploration of the Porcupine Basin began in the early 1970’s and the first well in the basin, Shell35/13-1 drilled in 1977, encountered a thick Tertiary and Cretaceous succession with some oil shows.However, seismic data quality in the basin at this time was generally poor, leading to lack of definition on thestructures within the basins and consequently to generally disappointing results from the drilling. While thebroad outlines of large Jurassic tilted fault blocks could be imaged on the flanks of the Porcupine Basin, littledetail could be resolved of the pre-Late Cretaceous succession in the deeper parts of the basin, away from themargins. Due to the generally poor quality of seismic data in the region, the early exploration wells targetedmainly large structural traps. The majority of the early wells (to the mid-1980’s) were drilled on tilted faultblock structures on the northern margins of the Porcupine Basin.
While the early drilling led to some technical successes, there were no commercial successes. Indications ofhydrocarbons were found in different stratigraphic horizons, including Middle and Upper Jurassic, Lowerand Upper Cretaceous and Lower Tertiary levels. Four of the early wells in the Porcupine Basin flowedsignificant quantities of good quality (32-41° API) petroleum from Jurassic and Lower Cretaceous reservoirs.The Phillips 35/8-1 well, drilled in 1978, flowed at a rate of 730 barrels of oil per day (bopd) of oil from poorquality thin Lower Cretaceous turbiditic sandstone reservoirs (Burren prospect). BP drilled oil discoverywells 28/28-1 and 26/28-2 in 1979 and 1980 (Connemara oil accumulation). These flowed 5,589 bopd and1,550 bopd respectively from Upper Jurassic fluvial sandstones within a structurally complex tilted faultblock structure. In 1981, the Phillips 35/8-2 exploration well (Spanish Point prospect) encountered a gas /condensate accumulation that flowed oil and gas at rates of 925 bopd and 4.853 MM scfd respectively fromUpper Jurassic turbiditic sandstones in a Jurassic tilted fault block structure draped by Lower Cretaceousmarine mudstones. However, the seismic data quality from this part of the basin is generally relatively poor,due in significant part to the presence of Tertiary igneous intrusions.
Source Rocks
Most of the wells in the Porcupine Basin have encountered hydrocarbon shows or flows, indicating awidespread distribution of mature source rocks. The general southward dip of the basin means that regionalmigration of hydrocarbons is likely to have been northwards and towards the basin margins. The flows and
Review of Operations (continued)
Petrel Annual Report & Accounts 2011 15
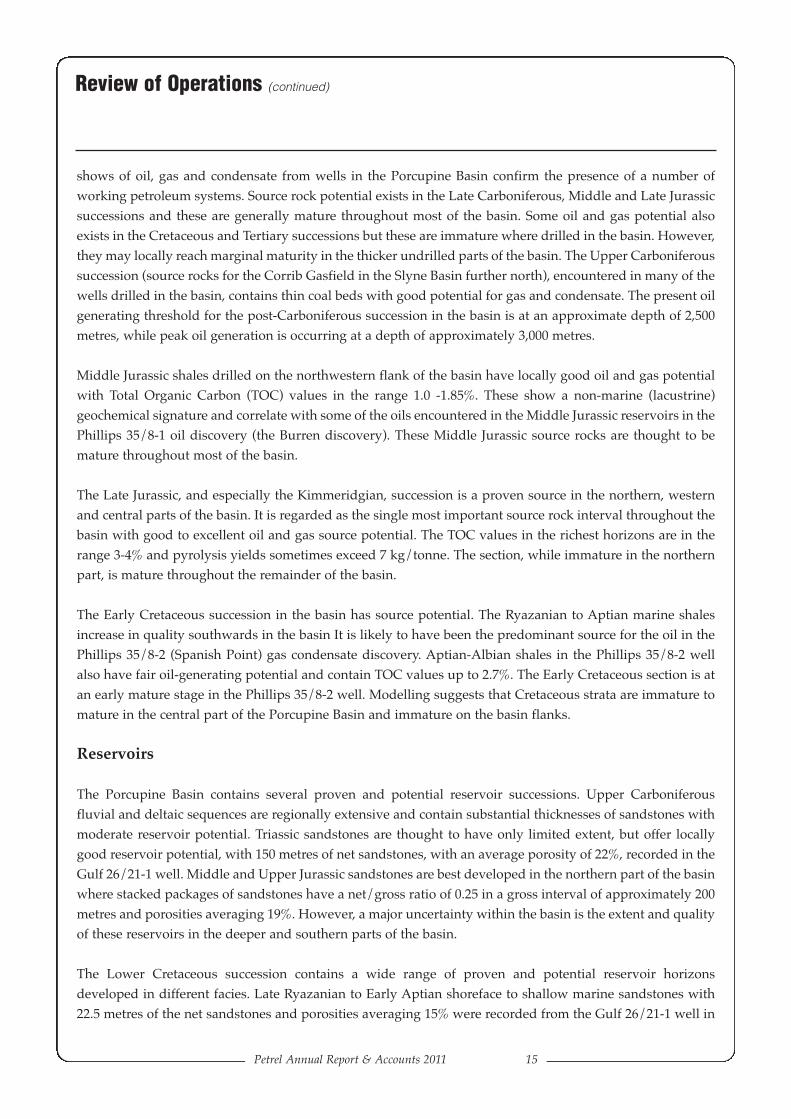
shows of oil, gas and condensate from wells in the Porcupine Basin confirm the presence of a number ofworking petroleum systems. Source rock potential exists in the Late Carboniferous, Middle and Late Jurassicsuccessions and these are generally mature throughout most of the basin. Some oil and gas potential alsoexists in the Cretaceous and Tertiary successions but these are immature where drilled in the basin. However,they may locally reach marginal maturity in the thicker undrilled parts of the basin. The Upper Carboniferoussuccession (source rocks for the Corrib Gasfield in the Slyne Basin further north), encountered in many of thewells drilled in the basin, contains thin coal beds with good potential for gas and condensate. The present oilgenerating threshold for the post-Carboniferous succession in the basin is at an approximate depth of 2,500metres, while peak oil generation is occurring at a depth of approximately 3,000 metres.
Middle Jurassic shales drilled on the northwestern flank of the basin have locally good oil and gas potentialwith Total Organic Carbon (TOC) values in the range 1.0 -1.85%. These show a non-marine (lacustrine)geochemical signature and correlate with some of the oils encountered in the Middle Jurassic reservoirs in thePhillips 35/8-1 oil discovery (the Burren discovery). These Middle Jurassic source rocks are thought to bemature throughout most of the basin.
The Late Jurassic, and especially the Kimmeridgian, succession is a proven source in the northern, westernand central parts of the basin. It is regarded as the single most important source rock interval throughout thebasin with good to excellent oil and gas source potential. The TOC values in the richest horizons are in therange 3-4% and pyrolysis yields sometimes exceed 7 kg/tonne. The section, while immature in the northernpart, is mature throughout the remainder of the basin.
The Early Cretaceous succession in the basin has source potential. The Ryazanian to Aptian marine shalesincrease in quality southwards in the basin It is likely to have been the predominant source for the oil in thePhillips 35/8-2 (Spanish Point) gas condensate discovery. Aptian-Albian shales in the Phillips 35/8-2 wellalso have fair oil-generating potential and contain TOC values up to 2.7%. The Early Cretaceous section is atan early mature stage in the Phillips 35/8-2 well. Modelling suggests that Cretaceous strata are immature tomature in the central part of the Porcupine Basin and immature on the basin flanks.
Reservoirs
The Porcupine Basin contains several proven and potential reservoir successions. Upper Carboniferousfluvial and deltaic sequences are regionally extensive and contain substantial thicknesses of sandstones withmoderate reservoir potential. Triassic sandstones are thought to have only limited extent, but offer locallygood reservoir potential, with 150 metres of net sandstones, with an average porosity of 22%, recorded in theGulf 26/21-1 well. Middle and Upper Jurassic sandstones are best developed in the northern part of the basinwhere stacked packages of sandstones have a net/gross ratio of 0.25 in a gross interval of approximately 200metres and porosities averaging 19%. However, a major uncertainty within the basin is the extent and qualityof these reservoirs in the deeper and southern parts of the basin.
The Lower Cretaceous succession contains a wide range of proven and potential reservoir horizonsdeveloped in different facies. Late Ryazanian to Early Aptian shoreface to shallow marine sandstones with22.5 metres of the net sandstones and porosities averaging 15% were recorded from the Gulf 26/21-1 well in
Review of Operations (continued)
16 Petrel Resources plc
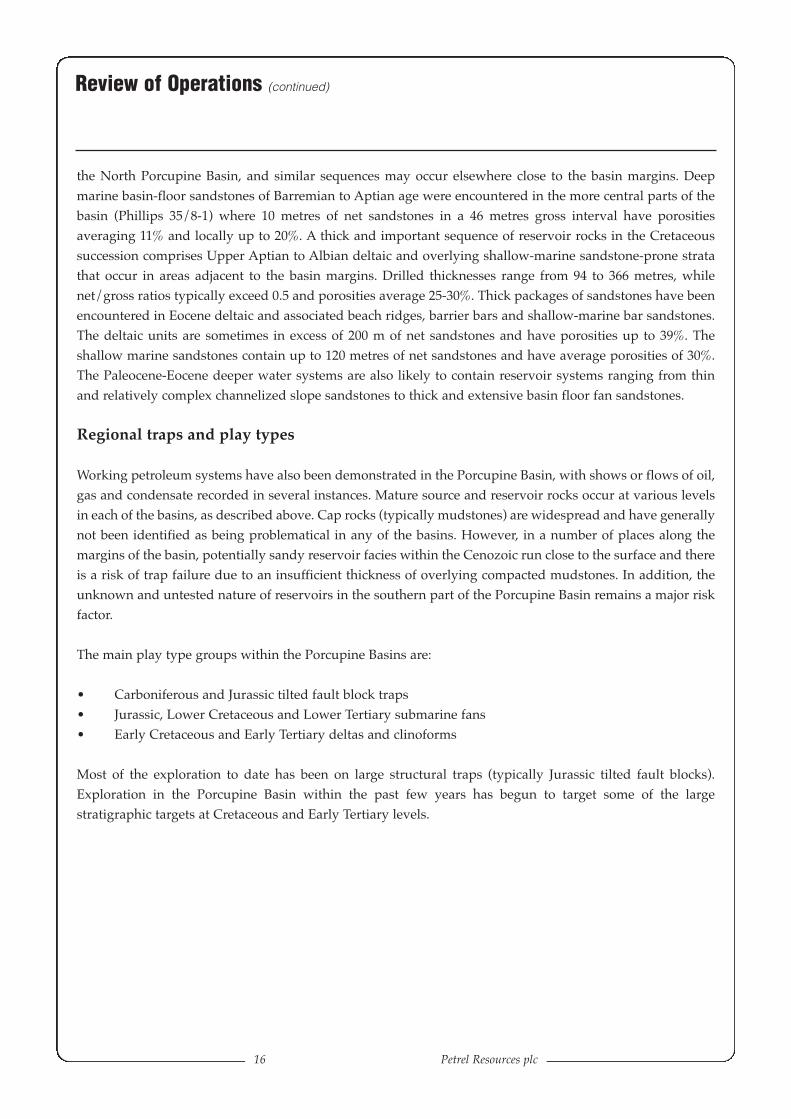
the North Porcupine Basin, and similar sequences may occur elsewhere close to the basin margins. Deepmarine basin-floor sandstones of Barremian to Aptian age were encountered in the more central parts of thebasin (Phillips 35/8-1) where 10 metres of net sandstones in a 46 metres gross interval have porositiesaveraging 11% and locally up to 20%. A thick and important sequence of reservoir rocks in the Cretaceoussuccession comprises Upper Aptian to Albian deltaic and overlying shallow-marine sandstone-prone stratathat occur in areas adjacent to the basin margins. Drilled thicknesses range from 94 to 366 metres, whilenet/gross ratios typically exceed 0.5 and porosities average 25-30%. Thick packages of sandstones have beenencountered in Eocene deltaic and associated beach ridges, barrier bars and shallow-marine bar sandstones.The deltaic units are sometimes in excess of 200 m of net sandstones and have porosities up to 39%. Theshallow marine sandstones contain up to 120 metres of net sandstones and have average porosities of 30%.The Paleocene-Eocene deeper water systems are also likely to contain reservoir systems ranging from thinand relatively complex channelized slope sandstones to thick and extensive basin floor fan sandstones.
Regional traps and play types
Working petroleum systems have also been demonstrated in the Porcupine Basin, with shows or flows of oil,gas and condensate recorded in several instances. Mature source and reservoir rocks occur at various levelsin each of the basins, as described above. Cap rocks (typically mudstones) are widespread and have generallynot been identified as being problematical in any of the basins. However, in a number of places along themargins of the basin, potentially sandy reservoir facies within the Cenozoic run close to the surface and thereis a risk of trap failure due to an insufficient thickness of overlying compacted mudstones. In addition, theunknown and untested nature of reservoirs in the southern part of the Porcupine Basin remains a major riskfactor.
The main play type groups within the Porcupine Basins are:
• Carboniferous and Jurassic tilted fault block traps• Jurassic, Lower Cretaceous and Lower Tertiary submarine fans• Early Cretaceous and Early Tertiary deltas and clinoforms
Most of the exploration to date has been on large structural traps (typically Jurassic tilted fault blocks).Exploration in the Porcupine Basin within the past few years has begun to target some of the largestratigraphic targets at Cretaceous and Early Tertiary levels.
Review of Operations (continued)
Petrel Annual Report & Accounts 2011 17
Directors’ Report
The directors present their annual report and the audited financial statements for the year ended 31 December 2011.
PRINCIPAL ACTIVITIES AND FUTURE DEVELOPMENTS
The main activity of Petrel Resources plc and its subsidiaries (the Group) is oil and gas exploration. The Group has
exploration interests in Iraq, Ghana and Ireland.
Further information concerning the activities of the Group during the year and its future prospects is contained in the
Chairman’s Statement and the Review of Operations.
RESULTS FOR THE YEAR
The consolidated loss after taxation for the year, transferred to reserves, amounted to €459,821 (2010: loss of €448,872).
The directors do not recommend that a dividend be declared for the year ended 31 December 2011 (2010: €Nil).
PERFORMANCE REVIEW
The performance review is set out in the Chairman’s Statement and the Review of Operations.
RISKS AND UNCERTAINTIES
The Group is subject to a number of significant potential risks including:
• Foreign exchange risks;
• Uncertainties over development and operational costs;
• Political and legal risks, including arrangements for licences, profit sharing and taxation;
• Foreign investment risks including increases in taxes, royalties and renegotiation of contracts;
• Liquidity risks;
• Operations and environmental risks and;
• Going Concern risks.
In addition to the above there can be no assurance that current exploration programmes will result in profitable
operations. The recoverability of the carrying value of exploration and evaluation assets is dependent upon the successful
discovery of economically recoverable reserves, the achievement of profitable operations, and the ability of the Group to
raise additional financing, if necessary, or alternatively upon the Group’s and company’s ability to dispose of its interests
on an advantageous basis. Changes in future conditions could require material write down of the carrying values of the
Group’s assets.
KEY PERFORMANCE INDICATORS
The Group reviews expenditure incurred on exploration projects and successes thereon, and ongoing operating costs.
18 Petrel Resources plc
Directors’ Report (continued)
DIRECTORS
On 21 May 2012 Stefano Borgi resigned as director.
The current directors are listed on the inside back cover.
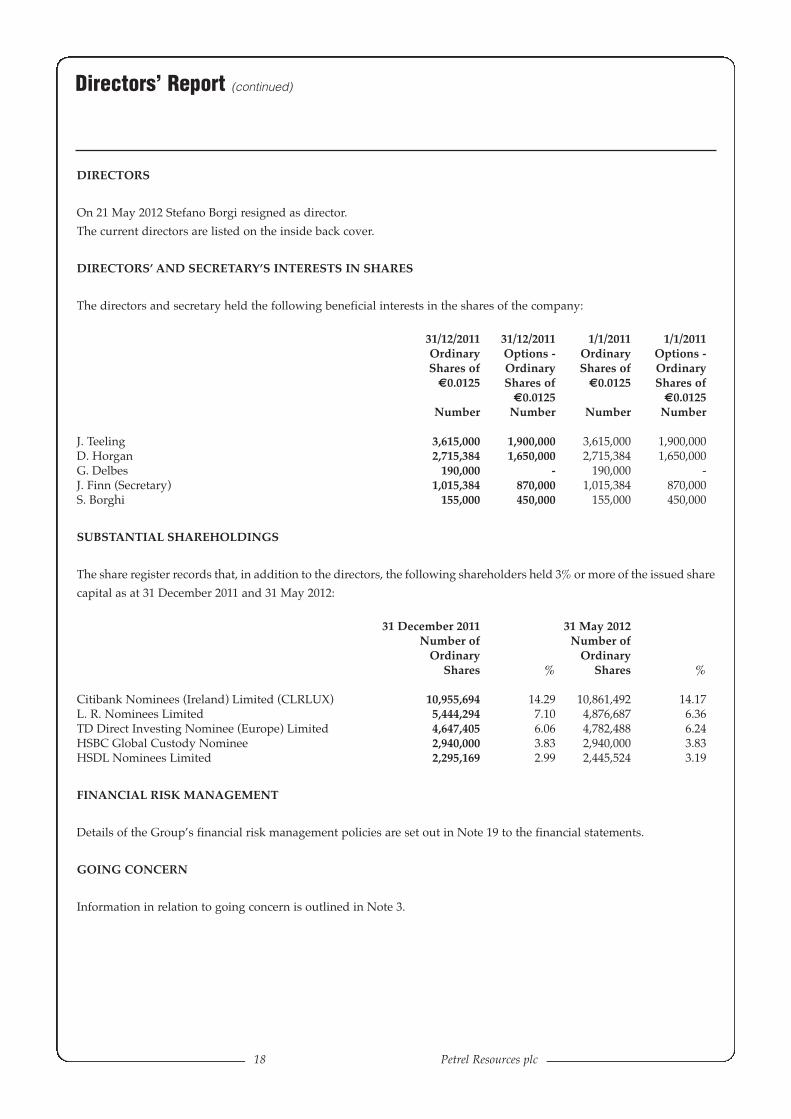
DIRECTORS’ AND SECRETARY’S INTERESTS IN SHARES
The directors and secretary held the following beneficial interests in the shares of the company:
31/12/2011 31/12/2011 1/1/2011 1/1/2011Ordinary Options - Ordinary Options -Shares of Ordinary Shares of Ordinary
€0.0125 Shares of €0.0125 Shares of€0.0125 €0.0125
Number Number Number Number
J. Teeling 3,615,000 1,900,000 3,615,000 1,900,000D. Horgan 2,715,384 1,650,000 2,715,384 1,650,000G. Delbes 190,000 - 190,000 -J. Finn (Secretary) 1,015,384 870,000 1,015,384 870,000S. Borghi 155,000 450,000 155,000 450,000
SUBSTANTIAL SHAREHOLDINGS
The share register records that, in addition to the directors, the following shareholders held 3% or more of the issued share
capital as at 31 December 2011 and 31 May 2012:
31 December 2011 31 May 2012Number of Number of
Ordinary OrdinaryShares % Shares %
Citibank Nominees (Ireland) Limited (CLRLUX) 10,955,694 14.29 10,861,492 14.17L. R. Nominees Limited 5,444,294 7.10 4,876,687 6.36TD Direct Investing Nominee (Europe) Limited 4,647,405 6.06 4,782,488 6.24HSBC Global Custody Nominee 2,940,000 3.83 2,940,000 3.83HSDL Nominees Limited 2,295,169 2.99 2,445,524 3.19
FINANCIAL RISK MANAGEMENT
Details of the Group’s financial risk management policies are set out in Note 19 to the financial statements.
GOING CONCERN
Information in relation to going concern is outlined in Note 3.
Petrel Annual Report & Accounts 2011 19
Directors’ Report (continued)
CORPORATE GOVERNANCE
The Board is committed to maintaining high standards of corporate governance and to managing the company
in an honest and ethical manner.
The Board approves the Group’s strategy, investment plans and regularly reviews operational and financial performance,
risk management, and Health, Safety, Environment and Community (HSEC) matters.
The Chairman is responsible for the leadership of the Board, whilst the Executive Directors are responsible for
formulating strategy and delivery once agreed by the Board.
SUBSIDIARIES
Details of the company’s significant subsidiaries are set out in Note 13 to the financial statements.
CHARITABLE AND POLITICAL DONATIONS
The company made no political or charitable contributions during the year.
BOOKS OF ACCOUNT
To ensure that proper books and accounting records are kept in accordance with Section 202 of the Companies Act, 1990,
the directors have involved appropriately qualified accounting personnel and have maintained appropriate computerised
accounting systems. The books of account are located at the company’s office at 162 Clontarf Road, Dublin 3.
SUBSEQUENT EVENTS
Details of significant subsequent events are outlined in Note 25.
AUDITORS
Deloitte & Touche, Chartered Accountants, will continue in office as auditors in accordance with Section 160(2) of the
Companies Act 1963.
Signed on behalf of the Board:
John Teeling David Horgan
Director Director
25 June 2012
20 Petrel Resources plc
Statement of Directors’ Responsibilities
Irish company law requires the directors to prepare financial statements for each financial year which give a true and fair
view of the state of affairs of the company and the Group and of the profit or loss of the Group for that period. In
preparing those financial statements, the directors are required to:
• select suitable accounting policies for the Group and the Parent Company Financial Statements and then apply
them consistently;
• make judgments and estimates that are reasonable and prudent; and
• prepare the financial statements on the going concern basis unless it is inappropriate to presume that the company
will continue in business.
The directors are responsible for keeping proper books of account which disclose with reasonable accuracy at any time
the financial position of the company and to enable them to ensure that the financial statements are prepared in
accordance with International Financial Reporting Standards (IFRSs) as adopted by the European Union and comply with
Irish statute comprising the Companies Acts, 1963 to 2009. They are also responsible for safeguarding the assets of the
company and hence for taking reasonable steps for the prevention and detection of fraud and other irregularities. The
directors are responsible for the maintenance and integrity of the corporate and financial information included on the
company’s website. Legislation in the Republic of Ireland governing the preparation and dissemination of financial
statements may differ from legislation in other jurisdictions.
Petrel Annual Report & Accounts 2011 21
Independent Auditor’s Reportto the Members of Petrel Resources Plc
We have audited the financial statements of Petrel Resources Plc for the year ended 31 December 2011 which comprise
the Group Financial Statements: the Consolidated Statement of Comprehensive Income, the Consolidated Balance Sheet,
the Group Statement of Changes in Equity and the Consolidated Cash Flow Statement and the Company Financial
Statements: the Company Balance Sheet, the Company Statement of Changes in Equity, the Company Cash Flow
Statement and the related notes 1 to 26. These financial statements have been prepared under the accounting policies set
out therein.
This report is made solely to the company’s members, as a body, in accordance with Section 193 of the Companies Act,
1990. Our audit work has been undertaken so that we might state to the company’s members those matters we are
required to state to them in an auditors’ report and for no other purpose. To the fullest extent permitted by law, we do
not accept or assume responsibility to anyone other than the company and the company’s members as a body, for our
audit work, for this report, or for the opinions we have formed.
Respective responsibilities of directors and auditors
The directors are responsible, as set out in the Statement of Directors’ Responsibilities, for preparing the Annual Report,
including the preparation of the Group Financial Statements and the Company Financial Statements in accordance with
applicable law and International Financial Reporting Standards (IFRSs) as adopted by the European Union.
Our responsibility, as independent auditors, is to audit the financial statements in accordance with relevant legal and
regulatory requirements and International Standards on Auditing (UK and Ireland).
We report to you our opinion as to whether the Group Financial Statements and the Company Financial Statements give
a true and fair view, in accordance with IFRSs as adopted by the European Union, and are properly prepared in
accordance with Irish statute comprising of the Companies Acts, 1963 to 2009. We also report to you whether in our
opinion: proper books of account have been kept by the company; whether, at the balance sheet date, there exists a
financial situation requiring the convening of an extraordinary general meeting of the company; and whether the
information given in the Directors’ Report is consistent with the financial statements. In addition, we state whether we
have obtained all the information and explanations necessary for the purpose of our audit and whether the company’s
balance sheet is in agreement with the books of account.
We also report to you if, in our opinion, other information specified by law regarding directors’ remuneration and
directors’ transactions is not disclosed and, where practicable, include such information in our report.
We read the other information contained in the Annual Report and consider the implications for our report if we become
aware of any apparent misstatement or material inconsistencies with the financial statements. The other information
comprises only the Chairman’s Statement, the Review of Operations and the Directors’ Report. Our responsibilities do
not extend to any other information.
Basis of audit opinion
We conducted our audit in accordance with International Standards on Auditing (UK and Ireland) issued by the Auditing
Practices Board. An audit includes examination, on a test basis, of evidence relevant to the amounts and disclosures in the
financial statements. It also includes an assessment of the significant estimates and judgments made by the directors in
the preparation of the financial statements and of whether the accounting policies are appropriate to the company’s and
the Group’s circumstances, consistently applied and adequately disclosed.
22 Petrel Resources plc
Independent Auditor’s Reportto the Members of Petrel Resources Plc (continued)
We planned and performed our audit so as to obtain all the information and explanations which we considered necessary
in order to provide us with sufficient evidence to give reasonable assurance that the financial statements are free from
material misstatement, whether caused by fraud or other irregularity or error. In forming our opinion we evaluated the
overall adequacy of the presentation of information in the financial statements.
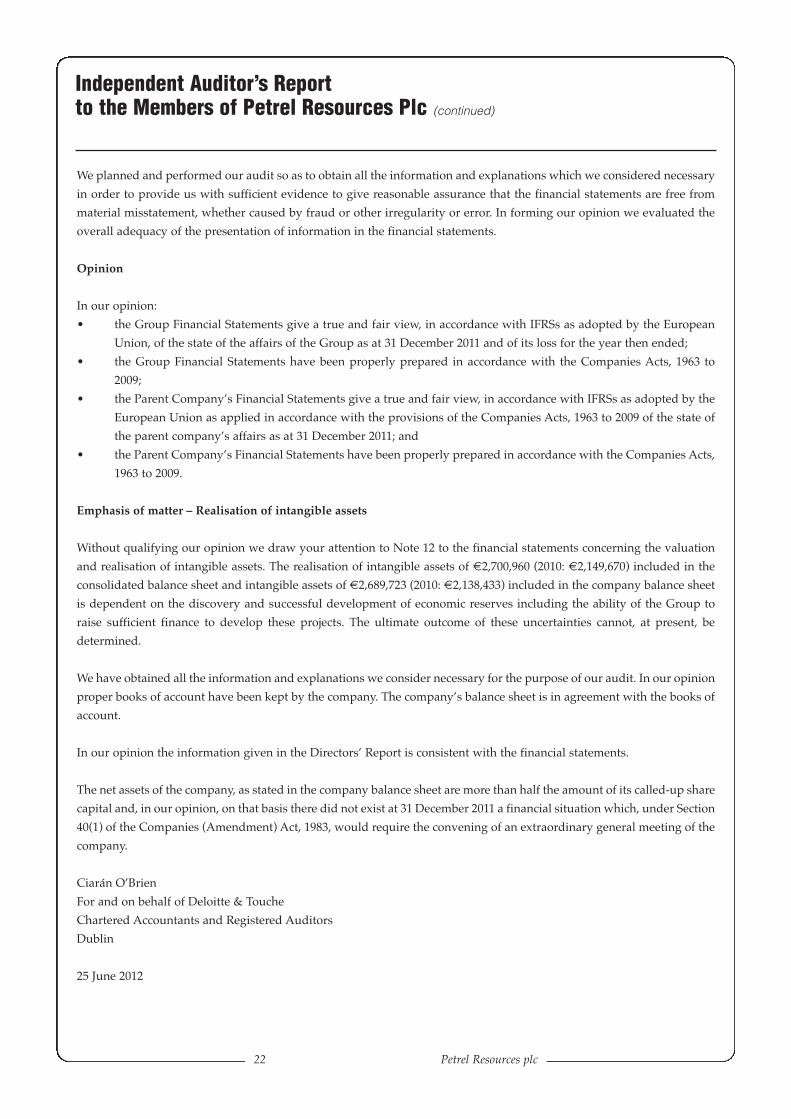
Opinion
In our opinion:
• the Group Financial Statements give a true and fair view, in accordance with IFRSs as adopted by the European
Union, of the state of the affairs of the Group as at 31 December 2011 and of its loss for the year then ended;
• the Group Financial Statements have been properly prepared in accordance with the Companies Acts, 1963 to
2009;
• the Parent Company’s Financial Statements give a true and fair view, in accordance with IFRSs as adopted by the
European Union as applied in accordance with the provisions of the Companies Acts, 1963 to 2009 of the state of
the parent company’s affairs as at 31 December 2011; and
• the Parent Company’s Financial Statements have been properly prepared in accordance with the Companies Acts,
1963 to 2009.
Emphasis of matter – Realisation of intangible assets
Without qualifying our opinion we draw your attention to Note 12 to the financial statements concerning the valuation
and realisation of intangible assets. The realisation of intangible assets of €2,700,960 (2010: €2,149,670) included in the
consolidated balance sheet and intangible assets of €2,689,723 (2010: €2,138,433) included in the company balance sheet
is dependent on the discovery and successful development of economic reserves including the ability of the Group to
raise sufficient finance to develop these projects. The ultimate outcome of these uncertainties cannot, at present, be
determined.
We have obtained all the information and explanations we consider necessary for the purpose of our audit. In our opinion
proper books of account have been kept by the company. The company’s balance sheet is in agreement with the books of
account.
In our opinion the information given in the Directors’ Report is consistent with the financial statements.
The net assets of the company, as stated in the company balance sheet are more than half the amount of its called-up share
capital and, in our opinion, on that basis there did not exist at 31 December 2011 a financial situation which, under Section
40(1) of the Companies (Amendment) Act, 1983, would require the convening of an extraordinary general meeting of the
company.
Ciarán O’Brien
For and on behalf of Deloitte & Touche
Chartered Accountants and Registered Auditors
Dublin
25 June 2012
Petrel Annual Report & Accounts 2011 23
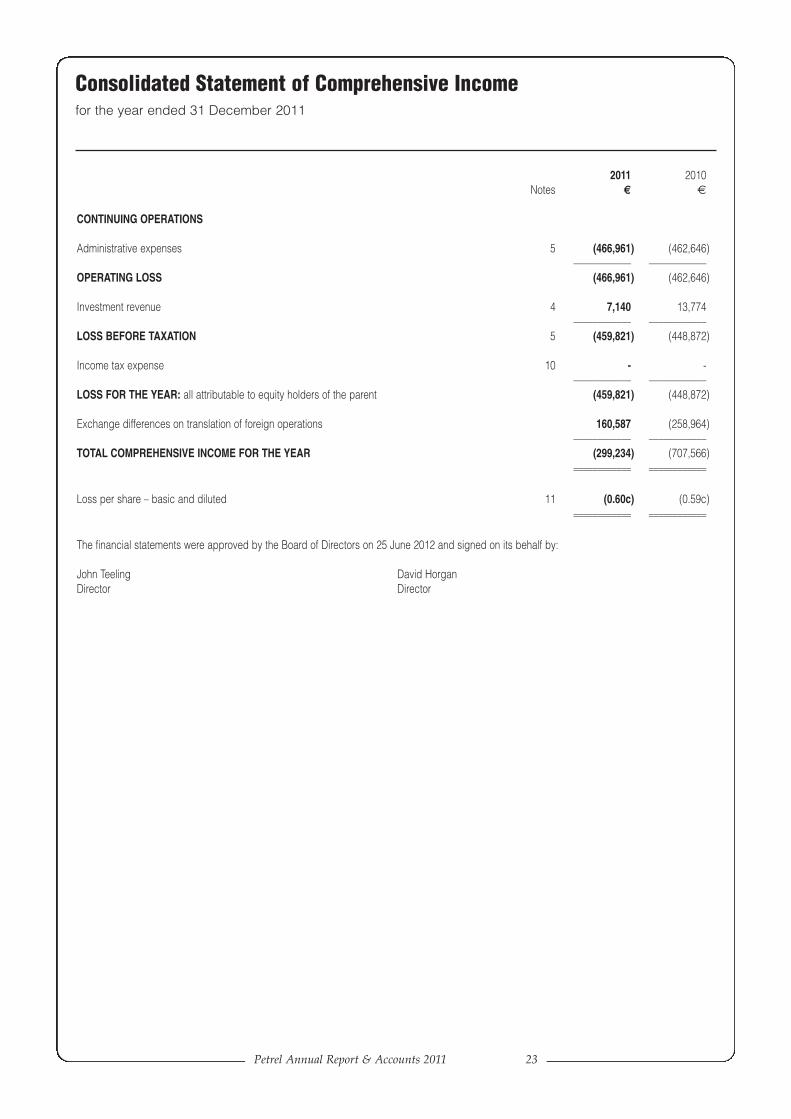
2011 2010Notes € €
CONTINUING OPERATIONS
Administrative expenses 5 (466,961) (462,646)–––––––––––– ––––––––––––
OPERATING LOSS (466,961) (462,646)
Investment revenue 4 7,140 13,774–––––––––––– ––––––––––––
LOSS BEFORE TAXATION 5 (459,821) (448,872)
Income tax expense 10 - -–––––––––––– ––––––––––––
LOSS FOR THE YEAR: all attributable to equity holders of the parent (459,821) (448,872)
Exchange differences on translation of foreign operations 160,587 (258,964)–––––––––––– ––––––––––––
TOTAL COMPREHENSIVE INCOME FOR THE YEAR (299,234) (707,566)–––––––––––– –––––––––––––––––––––––– ––––––––––––
Loss per share – basic and diluted 11 (0.60c) (0.59c)–––––––––––– –––––––––––––––––––––––– ––––––––––––
The financial statements were approved by the Board of Directors on 25 June 2012 and signed on its behalf by:
John Teeling David HorganDirector Director
Consolidated Statement of Comprehensive Incomefor the year ended 31 December 2011
24 Petrel Resources plc
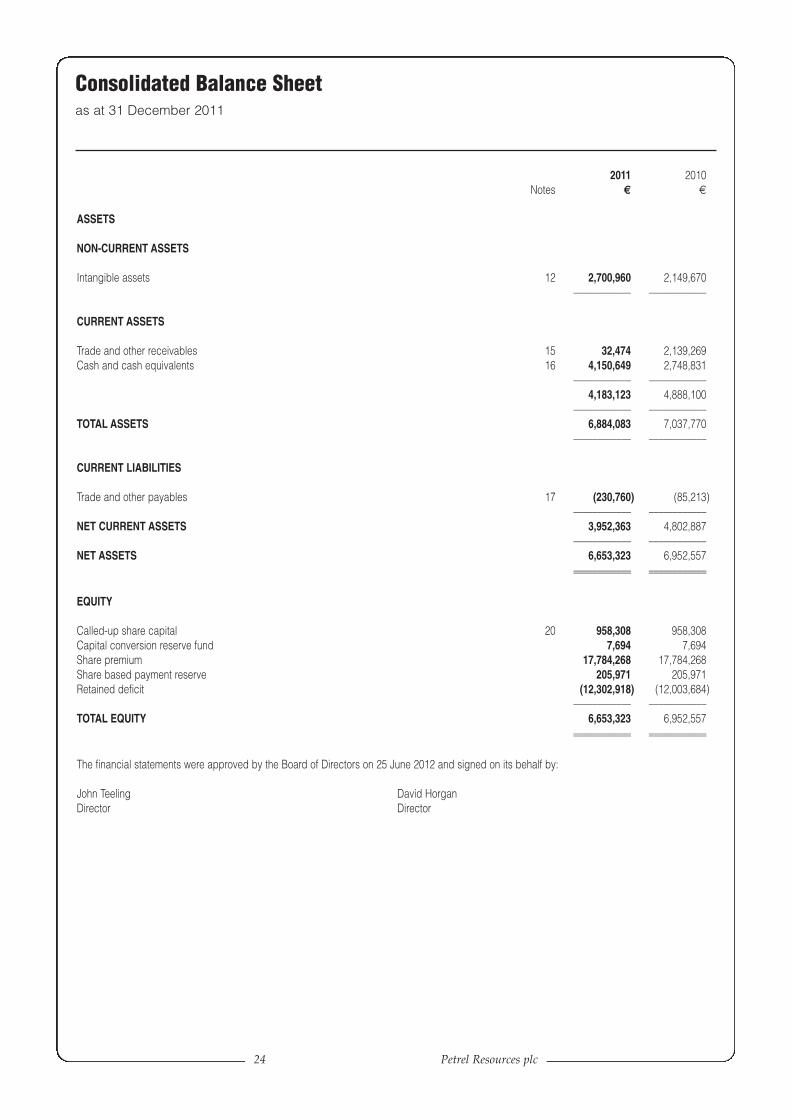
2011 2010Notes € €
ASSETS
NON-CURRENT ASSETS
Intangible assets 12 2,700,960 2,149,670–––––––––––– ––––––––––––
CURRENT ASSETS
Trade and other receivables 15 32,474 2,139,269Cash and cash equivalents 16 4,150,649 2,748,831
–––––––––––– ––––––––––––4,183,123 4,888,100
–––––––––––– ––––––––––––TOTAL ASSETS 6,884,083 7,037,770
–––––––––––– ––––––––––––
CURRENT LIABILITIES
Trade and other payables 17 (230,760) (85,213)–––––––––––– ––––––––––––
NET CURRENT ASSETS 3,952,363 4,802,887–––––––––––– ––––––––––––
NET ASSETS 6,653,323 6,952,557–––––––––––– –––––––––––––––––––––––– ––––––––––––
EQUITY
Called-up share capital 20 958,308 958,308Capital conversion reserve fund 7,694 7,694Share premium 17,784,268 17,784,268Share based payment reserve 205,971 205,971Retained deficit (12,302,918) (12,003,684)
–––––––––––– ––––––––––––TOTAL EQUITY 6,653,323 6,952,557
–––––––––––– –––––––––––––––––––––––– ––––––––––––
The financial statements were approved by the Board of Directors on 25 June 2012 and signed on its behalf by:
John Teeling David HorganDirector Director
Consolidated Balance Sheetas at 31 December 2011
Petrel Annual Report & Accounts 2011 25
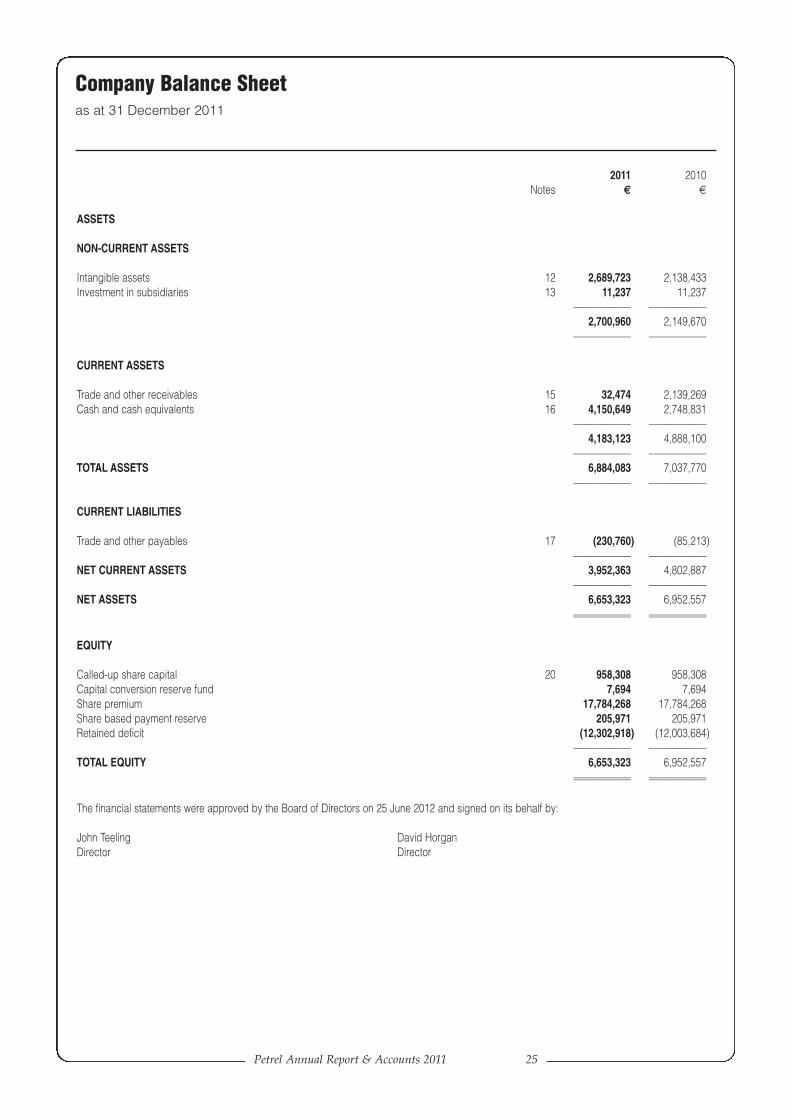
2011 2010Notes € €
ASSETS
NON-CURRENT ASSETS
Intangible assets 12 2,689,723 2,138,433Investment in subsidiaries 13 11,237 11,237
–––––––––––– ––––––––––––2,700,960 2,149,670
–––––––––––– ––––––––––––
CURRENT ASSETS
Trade and other receivables 15 32,474 2,139,269Cash and cash equivalents 16 4,150,649 2,748,831
–––––––––––– ––––––––––––4,183,123 4,888,100
–––––––––––– ––––––––––––TOTAL ASSETS 6,884,083 7,037,770
–––––––––––– ––––––––––––
CURRENT LIABILITIES
Trade and other payables 17 (230,760) (85,213)–––––––––––– ––––––––––––
NET CURRENT ASSETS 3,952,363 4,802,887–––––––––––– ––––––––––––
NET ASSETS 6,653,323 6,952,557–––––––––––– –––––––––––––––––––––––– ––––––––––––
EQUITY
Called-up share capital 20 958,308 958,308Capital conversion reserve fund 7,694 7,694Share premium 17,784,268 17,784,268Share based payment reserve 205,971 205,971Retained deficit (12,302,918) (12,003,684)
–––––––––––– ––––––––––––TOTAL EQUITY 6,653,323 6,952,557
–––––––––––– –––––––––––––––––––––––– ––––––––––––
The financial statements were approved by the Board of Directors on 25 June 2012 and signed on its behalf by:
John Teeling David HorganDirector Director
Company Balance Sheetas at 31 December 2011
26 Petrel Resources plc
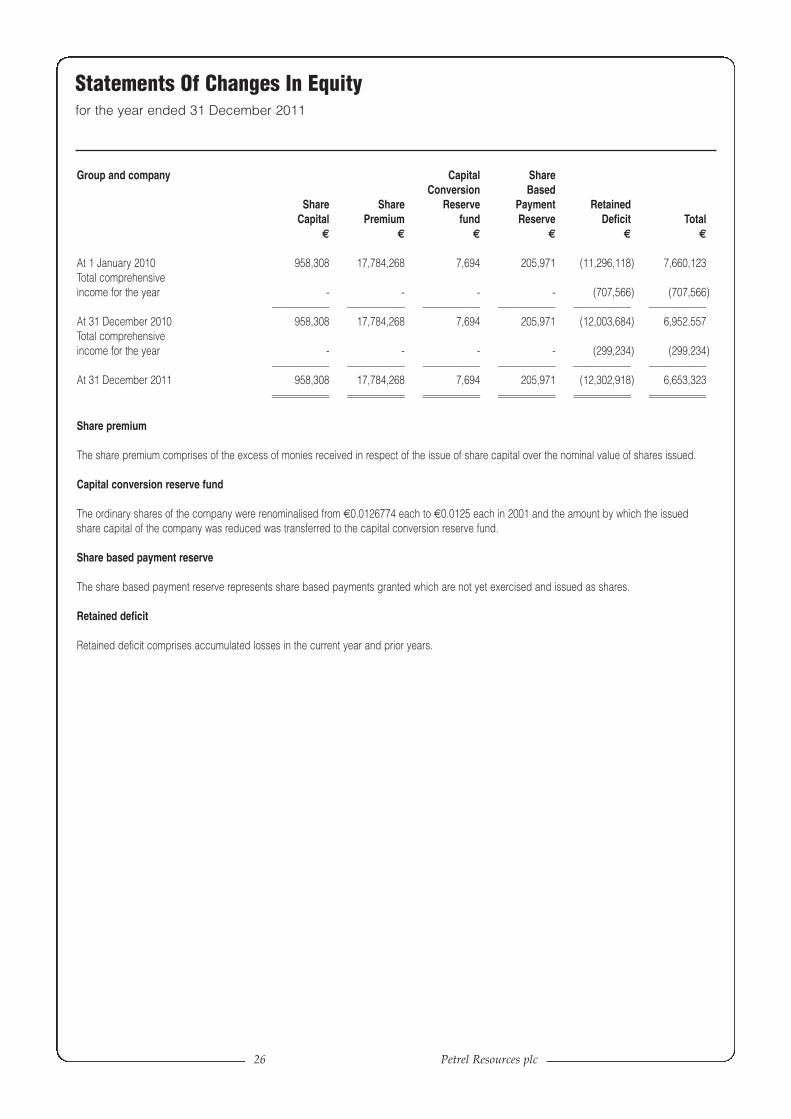
Group and company Capital ShareConversion Based
Share Share Reserve Payment RetainedCapital Premium fund Reserve Deficit Total
€ € € € € €
At 1 January 2010 958,308 17,784,268 7,694 205,971 (11,296,118) 7,660,123Total comprehensiveincome for the year - - - - (707,566) (707,566)
–––––––––––– –––––––––––– –––––––––––– –––––––––––– –––––––––––– ––––––––––––At 31 December 2010 958,308 17,784,268 7,694 205,971 (12,003,684) 6,952,557Total comprehensiveincome for the year - - - - (299,234) (299,234)
–––––––––––– –––––––––––– –––––––––––– –––––––––––– –––––––––––– ––––––––––––At 31 December 2011 958,308 17,784,268 7,694 205,971 (12,302,918) 6,653,323
–––––––––––– –––––––––––– –––––––––––– –––––––––––– –––––––––––– –––––––––––––––––––––––– –––––––––––– –––––––––––– –––––––––––– –––––––––––– ––––––––––––
Share premium
The share premium comprises of the excess of monies received in respect of the issue of share capital over the nominal value of shares issued.
Capital conversion reserve fund
The ordinary shares of the company were renominalised from €0.0126774 each to €0.0125 each in 2001 and the amount by which the issuedshare capital of the company was reduced was transferred to the capital conversion reserve fund.
Share based payment reserve
The share based payment reserve represents share based payments granted which are not yet exercised and issued as shares.
Retained deficit
Retained deficit comprises accumulated losses in the current year and prior years.
Statements Of Changes In Equityfor the year ended 31 December 2011
Petrel Annual Report & Accounts 2011 27
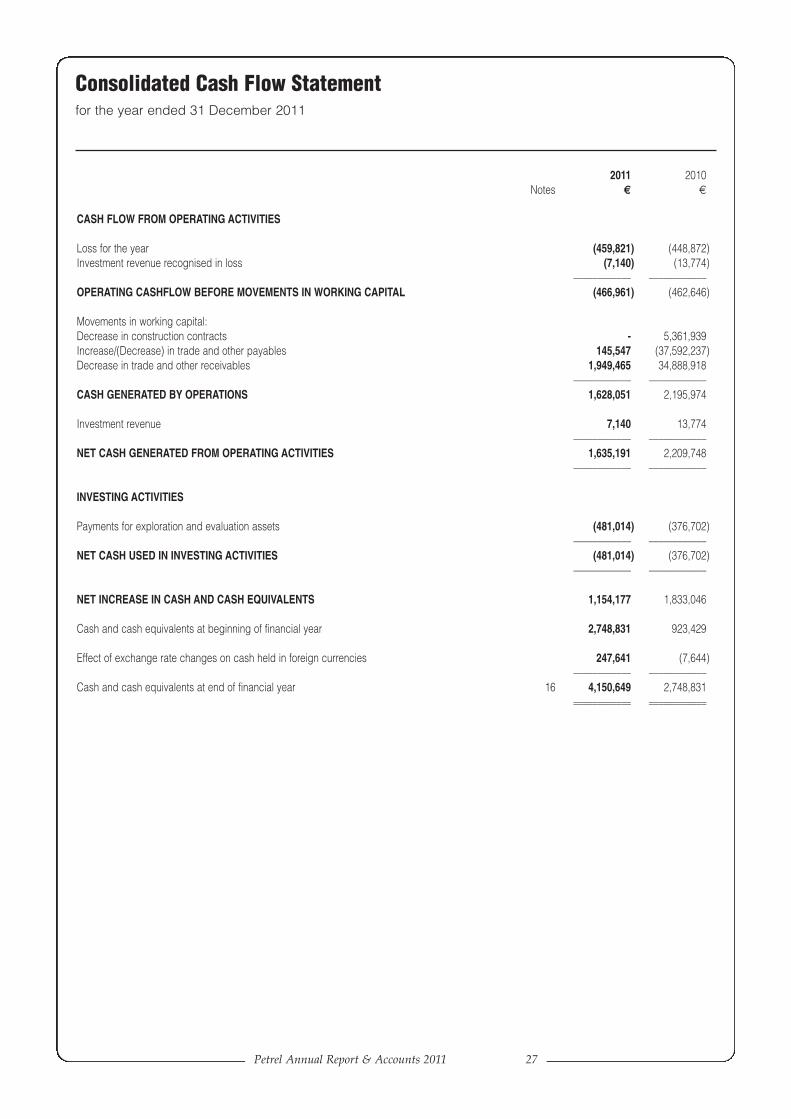
2011 2010Notes € €
CASH FLOW FROM OPERATING ACTIVITIES
Loss for the year (459,821) (448,872)Investment revenue recognised in loss (7,140) (13,774)
–––––––––––– ––––––––––––OPERATING CASHFLOW BEFORE MOVEMENTS IN WORKING CAPITAL (466,961) (462,646)
Movements in working capital:Decrease in construction contracts - 5,361,939Increase/(Decrease) in trade and other payables 145,547 (37,592,237)Decrease in trade and other receivables 1,949,465 34,888,918
–––––––––––– ––––––––––––CASH GENERATED BY OPERATIONS 1,628,051 2,195,974
Investment revenue 7,140 13,774–––––––––––– ––––––––––––
NET CASH GENERATED FROM OPERATING ACTIVITIES 1,635,191 2,209,748–––––––––––– ––––––––––––
INVESTING ACTIVITIES
Payments for exploration and evaluation assets (481,014) (376,702)–––––––––––– ––––––––––––
NET CASH USED IN INVESTING ACTIVITIES (481,014) (376,702)–––––––––––– ––––––––––––
NET INCREASE IN CASH AND CASH EQUIVALENTS 1,154,177 1,833,046
Cash and cash equivalents at beginning of financial year 2,748,831 923,429
Effect of exchange rate changes on cash held in foreign currencies 247,641 (7,644)–––––––––––– ––––––––––––
Cash and cash equivalents at end of financial year 16 4,150,649 2,748,831–––––––––––– –––––––––––––––––––––––– ––––––––––––
Consolidated Cash Flow Statementfor the year ended 31 December 2011
28 Petrel Resources plc
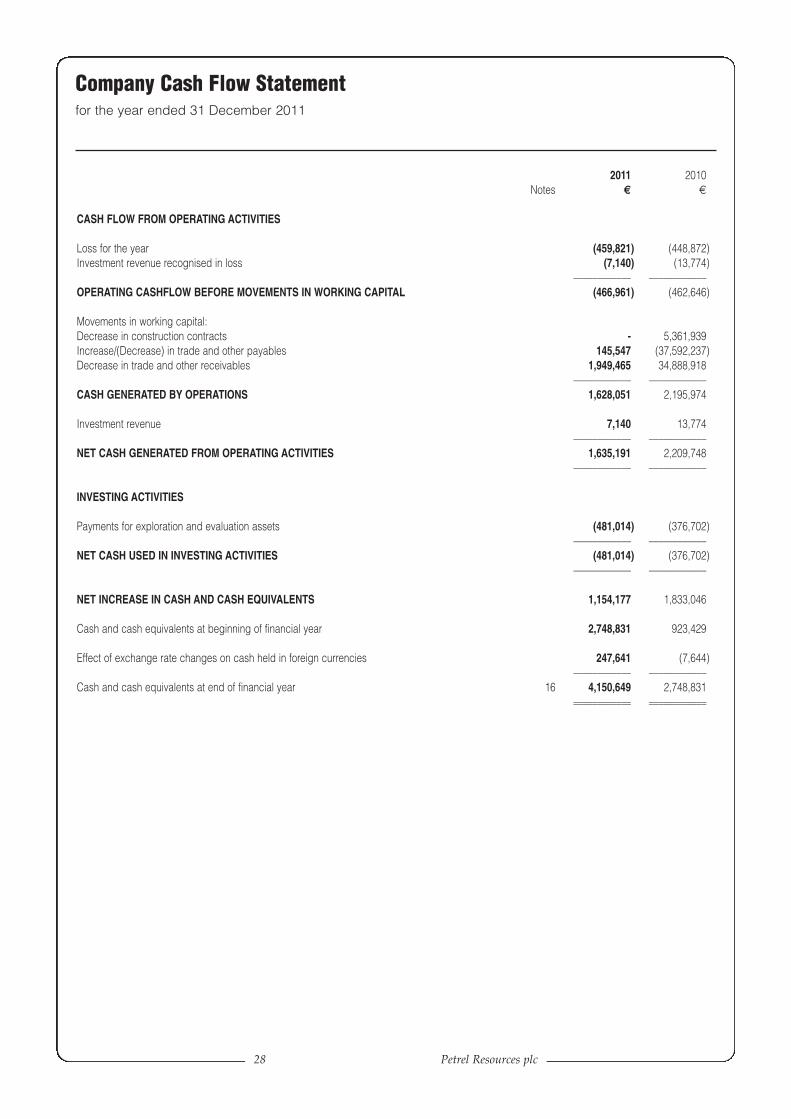
2011 2010Notes € €
CASH FLOW FROM OPERATING ACTIVITIES
Loss for the year (459,821) (448,872)Investment revenue recognised in loss (7,140) (13,774)
–––––––––––– ––––––––––––OPERATING CASHFLOW BEFORE MOVEMENTS IN WORKING CAPITAL (466,961) (462,646)
Movements in working capital:Decrease in construction contracts - 5,361,939Increase/(Decrease) in trade and other payables 145,547 (37,592,237)Decrease in trade and other receivables 1,949,465 34,888,918
–––––––––––– ––––––––––––CASH GENERATED BY OPERATIONS 1,628,051 2,195,974
Investment revenue 7,140 13,774–––––––––––– ––––––––––––
NET CASH GENERATED FROM OPERATING ACTIVITIES 1,635,191 2,209,748–––––––––––– ––––––––––––
INVESTING ACTIVITIES
Payments for exploration and evaluation assets (481,014) (376,702)–––––––––––– ––––––––––––
NET CASH USED IN INVESTING ACTIVITIES (481,014) (376,702)–––––––––––– ––––––––––––
NET INCREASE IN CASH AND CASH EQUIVALENTS 1,154,177 1,833,046
Cash and cash equivalents at beginning of financial year 2,748,831 923,429
Effect of exchange rate changes on cash held in foreign currencies 247,641 (7,644)–––––––––––– ––––––––––––
Cash and cash equivalents at end of financial year 16 4,150,649 2,748,831–––––––––––– –––––––––––––––––––––––– ––––––––––––
Company Cash Flow Statementfor the year ended 31 December 2011
Petrel Annual Report & Accounts 2011 29
1. PRINCIPAL ACCOUNTING POLICIES
The significant accounting policies adopted by the Group and company are as follows:
(i) Basis of preparation
The financial statements are prepared under the historical cost convention. The consolidated financialstatements are presented in Euro.
(ii) Statement of compliance
The financial statements of Petrel Resources plc and all its subsidiaries (“the Group”) have been preparedin accordance with International Financial Reporting Standards (IFRS) as adopted by the European Union.The financial statements have also been prepared in accordance with International Financial ReportingStandards (IFRSs) issued by the International Accounting Standards Board (IASB) and InternationalFinancial Reporting Interpretations Committee (IFRIC) as adopted by the European Union.
The financial statements are prepared under the Companies Acts, 1963 to 2009.
(iii) Basis of consolidation
The consolidated financial statements incorporate the financial statements of the Company and entitiescontrolled by the Company (its subsidiaries) made up to 31 December each year. Control is achieved wherethe Company has the power to govern the financial and operating policies of an investee entity so as toobtain benefits from its activities.
All intra-Group transactions, balances, income and expenses are eliminated on consolidation.
(iv) Investment in subsidiaries
Investment in subsidiaries is stated at cost less any provision for impairment.
(v) Intangible assets
Exploration and evaluation assetsExploration expenditure relates to the initial search for mineral deposits with economic potential in Iraq,Ireland and Ghana. Evaluation expenditure arises from a detailed assessment of deposits that have beenidentified as having economic potential.
The costs of exploration properties and leases, which include the cost of acquiring prospective propertiesand exploration rights and costs incurred in exploration and evaluation activities, are capitalised asintangible assets as part of exploration and evaluation assets.
Exploration costs are capitalised as an intangible asset until technical feasibility and commercial viabilityof extraction of reserves are demonstrable, when the capitalised exploration costs are re-classed to propertyplant and equipment. Exploration costs include an allocation of administration and salary costs (includingshare based payments) as determined by management, where they relate to specific projects.
Prior to reclassification to property, plant and equipment exploration and evaluation assets are assessed forimpairment and any impairment loss is recognised immediately in the statement of comprehensive income.
Notes To The Financial Statementsfor the year ended 31 December 2011
30 Petrel Resources plc
1. PRINCIPAL ACCOUNTING POLICIES (continued)
(v) Intangible assets (continued)
Impairment of intangible assetsExploration and evaluation assets are assessed for impairment when facts and circumstances suggest thatthe carrying amount may exceed its recoverable amount. The Company reviews and tests for impairmenton an ongoing basis and specifically if the following occurs:
a) the period for which the group has a right to explore in the specific area has expired during theperiod or will expire in the near future, and is not expected to be renewed;
b) substantive expenditure on further exploration for and evaluation of oil or gas resources in thespecific area is neither budgeted nor planned;
c) exploration for an evaluation of resources in the specific area have not led to the discovery ofcommercially viable quantities of oil or gas resources and the group has decided to discontinue suchactivities in the specific area; and
d) sufficient data exists to indicate that although a development in the specific area is likely to proceedthe carrying amount of the exploration and evaluation asset is unlikely to be recovered in full fromsuccessful development or by sale.
(vi) Foreign currencies
The individual financial statements of each Group company are maintained in the currency of the primaryeconomic environment in which it operates (its functional currency). The functional currency of thecompany is US Dollars. However, for the purpose of the consolidated financial statements, the results andfinancial position of the Group are expressed in Euro (the presentation currency). This is for the benefit ofthe Group’s shareholders, the majority of whom reside in the Eurozone.
In preparing the financial statements of the individual companies, transactions in currencies other than theentity’s functional currency (foreign currencies) are recorded at the rates of exchange prevailing on thedates of the transactions. At each balance sheet date, monetary assets and liabilities that are denominatedin foreign currencies are retranslated at the rates prevailing on the balance sheet date. Non-monetary itemscarried at fair value that are denominated in foreign currencies are retranslated at the rates prevailing at thedate when the fair value was re-determined. Non-monetary items that are measured in terms of historicalcost in a foreign currency are not retranslated.
Exchange differences arising on the settlement of monetary items, and on the retranslation of monetaryitems, are included in the statement of comprehensive income for the period. Exchange differences arisingon the retranslation of non-monetary items carried at fair value are included in the statement ofcomprehensive income for the period except for differences arising on the retranslation of non-monetaryitems in respect of which gains and losses are recognised directly in equity.
For the purpose of presenting consolidated financial statements, the assets and liabilities of the Group’sforeign operations are translated at exchange rates prevailing on the balance sheet date. Income andexpense items are translated at the average exchange rates for the period, unless exchange rates fluctuatesignificantly during that period, in which case the exchange rates at the date of transactions are used.
(vii) Taxation
The tax expense represents the sum of the tax currently payable and deferred tax.
Notes To The Financial Statementsfor the year ended 31 December 2011
Petrel Annual Report & Accounts 2011 31
1. PRINCIPAL ACCOUNTING POLICIES (continued)
(vii) Taxation (continued)
Current tax is based on taxable profit for the year. Taxable profit differs from net profit as reported in thestatement of comprehensive income because it excludes items of income or expense that are taxable ordeductible in other years and it further excludes items that are never taxable or deductible. The Group’sliability for current tax is calculated using tax rates that have been enacted or substantively enacted by thebalance sheet date.
Deferred tax is the tax expected to be payable or recoverable on differences between the carrying amountsof assets and liabilities in the financial statements and the corresponding tax bases used in the computationof taxable profit, and is accounted for using the balance sheet liability method. Deferred tax liabilities aregenerally recognised for all taxable temporary differences and deferred tax assets are recognised for alldeductible temporary differences, carry forward of unused tax assets and unused tax losses to the extentthat it is probable that taxable profits will be available against which deductible temporary differences andthe carry forward of unused tax credits and unused tax losses can be utilised. Such assets and liabilities arenot recognised if the temporary difference arises from the initial recognition of goodwill or from the initialrecognition (other than in a business combination) of other assets and liabilities in a transaction that affectsneither the taxable profit nor the accounting profit.
Deferred tax liabilities are recognised for taxable temporary differences arising on investments insubsidiaries and associates, except where the Group is able to control the reversal of the temporarydifference and it is probable that the temporary difference will not reverse in the foreseeable future.
Deferred tax assets are recognised for deductible temporary differences arising on investments insubsidiaries and associates, only to the extent that it is probable that the temporary difference will reversein the foreseeable future and taxable profit will be available against which the temporary difference can beutilised.
Unrecognised deferred tax assets are reassessed at each balance sheet date and are recognised to the extentthat it has become probable that future taxable profits will allow the deferred tax asset to be recovered.
Deferred tax is calculated at the tax rates that are expected to apply in the period when the liability is settledor the asset is realised, based on tax rates (and tax laws) that have been enacted or substantively enacted atthe balance sheet date. Deferred tax is charged or credited in the statement of comprehensive income,except when it relates to items charged or credited directly to equity, in which case the deferred tax is alsodealt with in equity.
Deferred tax assets and liabilities are offset when there is a legally enforceable right to set off current taxassets against current tax liabilities and when they relate to income taxes levied by the same taxationauthority and the Group intends to settle its current tax assets and liabilities on a net basis.
(viii) Share-based payments
The Group and Company have applied the requirements of IFRS 2 “Share-Based Payments”. In accordancewith the transitional provisions, IFRS 2 has been applied to all equity instruments vesting after 1 January2006.
Notes To The Financial Statementsfor the year ended 31 December 2011
32 Petrel Resources plc
1. PRINCIPAL ACCOUNTING POLICIES (continued)
(viii) Share-based payments (continued)
The Group and Company issue equity-settled share based payments to directors and certain consultants.Equity settled share-based payments are measured at fair value at the date of grant. The fair value excludesthe effect of non-market based vesting conditions. The fair value determined at the grant date of the equity-settled share-based payments is expensed on a straight-line basis over the vesting period based on theGroup and Company’s estimate of shares that will eventually vest. At the balance sheet date the Groupreviews its estimate of the nature of equity instruments expected to vest as a result of the effect of non-market based vesting conditions.
Where the value of the goods or services received in exchange for the share-based payment cannot bereliably estimated the fair value is measured by use of a Black-Scholes model.
(ix) Operating loss
Operating loss comprises general administrative costs incurred by the Company, which are not specific toevaluation and exploration projects. Operating loss is stated before finance income, finance costs and othergains and losses.
(x) Financial instruments
Financial assets and financial liabilities are recognised in the Group and Company balance sheet when theGroup and Company becomes a party to the contractual provisions of the instrument.
Trade receivablesTrade receivables are measured at initial recognition at invoice value, which approximates to fair value.Appropriate allowances for estimated irrecoverable amounts are recognised in the consolidated statementof comprehensive income when there is objective evidence that the carrying value of the asset exceeds therecoverable amount. Subsequently, trade receivables are classified as loans and receivables which aremeasured at amortised cost, using the effective interest method.
Cash and cash equivalentsCash and cash equivalents comprise cash held by the Group and Company and short-term bank depositswith a maturity of three months or less from the date of acquisition.
Financial liabilitiesFinancial liabilities are classified according to the substance of the contractual arrangements entered into.
Trade payablesTrade payables are classified as financial liabilities, are initially measured at fair value, and aresubsequently measured at amortised cost using the effective interest rate method.
Equity instrumentsEquity instruments issued by the Company are recorded at the proceeds received, net of direct issue costs.
(xi) Comparative Amounts
Comparative amounts have been re-classified, where necessary, on the same basis as the current year.
Notes To The Financial Statementsfor the year ended 31 December 2011
Petrel Annual Report & Accounts 2011 33
1. PRINCIPAL ACCOUNTING POLICIES (continued)
(xii) Critical accounting judgments and key sources of estimation uncertainty
Critical judgments in applying the Group and Company accounting policiesIn the process of applying the Group and Company accounting policies above, management has identifiedthe judgmental areas as those that have the most significant effect on the amounts recognised in thefinancial statements (apart from those involving estimations, which are dealt with below):
Exploration and evaluationThe assessment of whether general administration costs and salary costs are capitalised or expensedinvolves judgement. Management considers the nature of each cost incurred and whether it is deemedappropriate to capitalise it within intangible assets.
Costs which can be demonstrated as project related are included within exploration and evaluation assets.Exploration and evaluation assets relate to exploration and related expenditure in Ireland, Iraq and Ghana.
The Group and Company’s exploration activities are subject to a number of significant and potential risksincluding:
• Foreign exchange risks;• Uncertainties over development and operational costs;• Political and legal risks, including arrangements for licences, profit sharing and taxation;• Foreign investment risks including increases in taxes, royalties and renegotiation of contracts;• Liquidity risks;• Operation and environmental risks;• Going Concern.
The recoverability of these exploration and evaluation assets is dependent on the discovery and successfuldevelopment of economic reserves, including the ability to raise finance to develop future projects. Shouldthis prove unsuccessful, the value included in the balance sheet would be written off as an impairment tothe statement of comprehensive income.
Impairment of intangible assetsThe assessment of intangible assets for any indications of impairment involves judgement. If an indicationof impairment exists, a formal estimate of recoverable amount is performed and an impairment lossrecognised to the extent that the carrying amount exceeds the recoverable amount. Recoverable amount isdetermined as the higher of fair value less costs to sell and value in use.
The assessment requires judgements as to the likely future commerciality of the assets and when suchcommerciality should be determined, future revenue and operating costs and the discount rate to beapplied to such revenues and costs.
Deferred tax assetsThe assessment of availability of future taxable profits involves judgement. A deferred tax asset isrecognised to the extent that it is probable that taxable profits will be available against which deductibletemporary differences and the carry forward of unused tax credits and unused tax losses can be utilised.
Going ConcernThe preparation of financial statements requires an assessment on the validity of the going concernassumption. The validity of the going concern assumption is dependent on finance being available for thecontinuing working capital requirements of the Group and Company and finance for the development ofthe Group’s projects.
Notes To The Financial Statementsfor the year ended 31 December 2011
34 Petrel Resources plc
1. PRINCIPAL ACCOUNTING POLICIES (continued)
(xii) Critical accounting judgments and key sources of estimation uncertainty (continued)
Key sources of estimation uncertaintyThe preparation of financial statements requires management to make estimates and assumptions thataffect the amounts reported for assets and liabilities at the balance sheet date and the amounts reported inthe statement of comprehensive income for the year. The nature of estimation means that actual outcomescould differ from those estimates. The key sources of estimation uncertainty that have a significant risk ofcausing material adjustment to the carrying amounts of assets and liabilities within the next financial yearare discussed below.
Share-based paymentsThe estimation of share-based payment costs requires the selection of an appropriate valuation model andconsideration as to the inputs necessary for the valuation model chosen. The Group and Company havemade estimates as to the volatility of its own shares, the probable life of options granted and the time ofexercise of those options. The model used by the Group and Company is the Black-Scholes valuationmodel.
Impairment of Intangible AssetsThe assessment of intangible assets for any indication of impairment involves uncertainty. There isuncertainty as to whether the exploration activity will yield any economically viable discovery. Aspects ofuncertainty surrounding the group’s intangible assets include the amount of potential reserves, ability tobe awarded exploration licences, and the ability to raise sufficient finance to develop the group’s projects.
2. INTERNATIONAL FINANCIAL REPORTING STANDARDS
The Group did not adopt any new International Financial Reporting Standards (IFRS) or Interpretations in the yearthat had a material impact on the Group’s Financial Statements. The following IFRS became effective since the lastAnnual Report but had no material impact on the Financial Statements:
IFRS 1 (amendment) First-time adoption of International Financial Reporting Standards 1 July 2010IFRS 1 (amendment) First-time adoption of International Financial Reporting Standards 1 January 2011IFRS 3 (amendment) Business Combinations 1 July 2010IFRS 7 (amendment) Financial Instruments: Disclosures – Improving Disclosures
about Financial Instruments 1 January 2011IAS 1 (amendment) Presentation of Financial Statements 1 January 2011IAS 24 (amendment) Related Party Transactions 1 January 2011IAS 27 (amendment) Consolidated and Separate Financial Statements 1 July 2010IAS 32 (amendment) Financial Statements Presentation 1 July 2010IAS 34 (amendment) Interim Financial Reporting 1 January 2011IFRIC 13 (amendment) Customer Loyalty Programmes – Amendments resulting
from May 2010 Annual Improvements to IFRSs 1 January 2011IFRIC 14 (amendment) IAS 19 – The Limit on a Defined Benefit Asset,
Minimum Funding Requirements and their Interaction 1 January 2011IFRIC 19 (amendment) Extinguishing Financial Liabilities with Equity Instruments 1 July 2010
Notes To The Financial Statementsfor the year ended 31 December 2011
Petrel Annual Report & Accounts 2011 35
2. INTERNATIONAL FINANCIAL REPORTING STANDARDS (continued)
At the date of authorisation of these financial statements, the following Standards and Interpretations which havenot been applied in these financial statements were in issue but not yet effective:
IAS 32 (amendment) Offsetting Financial Assets and Financial Liabilities 1 January 2014IFRS 7 (amendment) Disclosures – Offsetting Financial Assets and
Financial Liabilities 1 January 2013IAS 1 (amendment) Presentation of Items of Other Comprehensive Income 1 July 2012IAS 19 (amendment) Employee Benefits 1 January 2013IFRS 13 (amendment) Fair Value Measurement 1 January 2013IFRS 12 (amendment) Disclosure of Interests in Other Entities 1 January 2013IFRS 11 (amendment) Joint Arrangements 1 January 2013IFRS 10 (amendment) Consolidated Financial Statements 1 January 2013IAS 28 (amendment) Investments in Associates and Joint Ventures 1 January 2013IAS 27 (amendment) Separate Financial Statements 1 January 2013IFRS 7 (amendment) Disclosures – Initial Application of IFRS 9 1 January 2015IAS 12 (amendment) Deferred Tax Recovery of Underlying Assets 1 January 2012IFRS 1 (amendment) Government Loans 1 January 2013IFRS 9 Financial Instruments 1 January 2015IFRIC 20 Stripping Costs in the Production Phase of a Surface Mine 1 January 2013
The Directors are currently assessing the impact in relation to the adoption of these Standards and Interpretationsfor future periods of the Group, however, at this point they do not believe they will have a significant impact onthe financial statements of the Group in the period of initial application.
3. GOING CONCERN
The Group and Company incurred a loss for the year of €459,821 (2010: loss of €448,872) and had a retainedearnings deficit of €12,302,918 (2010: deficit of €12,003,684), at the balance sheet date leading to doubt about theGroup and Company’s ability to continue as a going concern.
The Group and Company had a cash balance of €4,150,649 at the balance sheet date. Accordingly the directors aresatisfied that it is appropriate to continue to prepare the financial statements of the Group and Company on thegoing concern basis, as the group has sufficient cash resources that can be used to develop exploration projectsalong with the day to day running of the Group. The financial statements do not include any adjustment to thecarrying amount, or classification of assets and liabilities, which would be required if the Group or Company wasunable to continue as a going concern.
4. INVESTMENT REVENUE2011 2010
€ €
Interest on bank deposits 7,140 13,774–––––––––––– –––––––––––––––––––––––– ––––––––––––
Notes To The Financial Statementsfor the year ended 31 December 2011
36 Petrel Resources plc
5. LOSS BEFORE TAXATION2011 2010
€ €
The loss before taxation is stated after charging/(crediting) the following items:
Administrative expenses:Professional fees 137,132 206,851Staff costs - salaries 254,839 182,535
- payroll taxes 19,885 21,390Other administration expenses 55,105 51,870
–––––––––––– ––––––––––––466,961 462,646
–––––––––––– –––––––––––––––––––––––– ––––––––––––
Details of auditor’s and directors’ remuneration are set out in Notes 6 and 7 respectively
6. AUDITOR’S REMUNERATION
Auditor’s remuneration for work carried out for the Group and Company in respect of the financial year is asfollows:
2011 2010€ €
Group
Audit of Group accounts 19,000 18,000Other assurance services 1,500 1,000Tax advisory services 1,600 3,300Other non-audit services - -
–––––––––––– ––––––––––––Total 22,100 22,300
–––––––––––– –––––––––––––––––––––––– ––––––––––––
Company
Audit of individual company accounts 9,750 9,000Other assurance services 9,750 9,000Tax advisory services 1,600 3,300Other non-audit services - -
–––––––––––– ––––––––––––Total 21,100 21,300
–––––––––––– –––––––––––––––––––––––– ––––––––––––
Notes To The Financial Statementsfor the year ended 31 December 2011
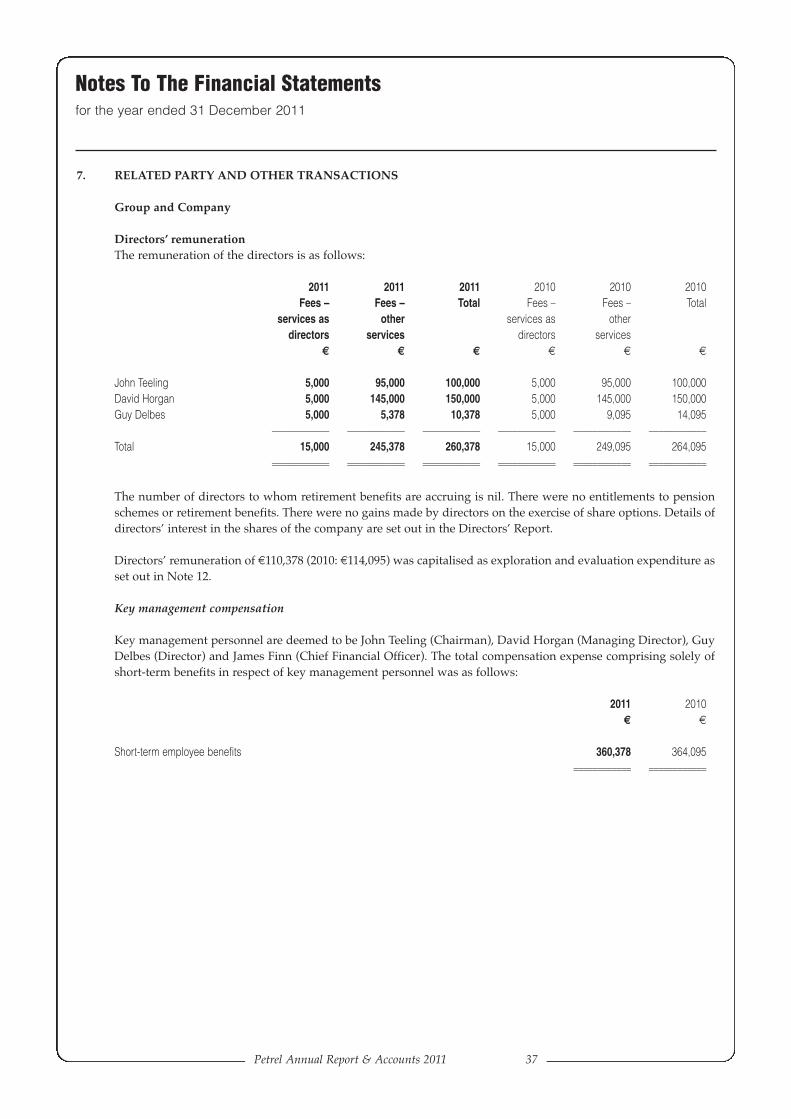
Petrel Annual Report & Accounts 2011 37
7. RELATED PARTY AND OTHER TRANSACTIONS
Group and Company
Directors’ remunerationThe remuneration of the directors is as follows:
2011 2011 2011 2010 2010 2010Fees – Fees – Total Fees – Fees – Total
services as other services as otherdirectors services directors services
€ € € € € €
John Teeling 5,000 95,000 100,000 5,000 95,000 100,000David Horgan 5,000 145,000 150,000 5,000 145,000 150,000Guy Delbes 5,000 5,378 10,378 5,000 9,095 14,095
–––––––––––– –––––––––––– –––––––––––– –––––––––––– –––––––––––– ––––––––––––Total 15,000 245,378 260,378 15,000 249,095 264,095
–––––––––––– –––––––––––– –––––––––––– –––––––––––– –––––––––––– –––––––––––––––––––––––– –––––––––––– –––––––––––– –––––––––––– –––––––––––– ––––––––––––
The number of directors to whom retirement benefits are accruing is nil. There were no entitlements to pensionschemes or retirement benefits. There were no gains made by directors on the exercise of share options. Details ofdirectors’ interest in the shares of the company are set out in the Directors’ Report.
Directors’ remuneration of €110,378 (2010: €114,095) was capitalised as exploration and evaluation expenditure asset out in Note 12.
Key management compensation
Key management personnel are deemed to be John Teeling (Chairman), David Horgan (Managing Director), GuyDelbes (Director) and James Finn (Chief Financial Officer). The total compensation expense comprising solely ofshort-term benefits in respect of key management personnel was as follows:
2011 2010€ €
Short-term employee benefits 360,378 364,095–––––––––––– –––––––––––––––––––––––– ––––––––––––
Notes To The Financial Statementsfor the year ended 31 December 2011
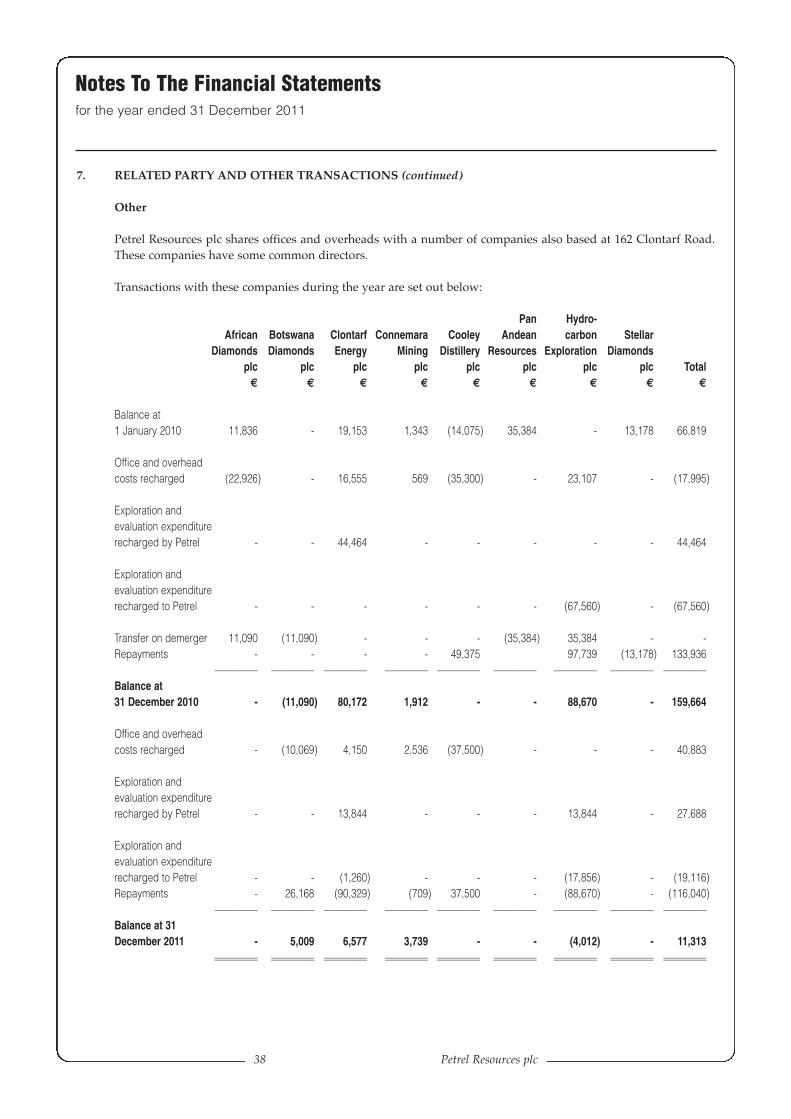
38 Petrel Resources plc
7. RELATED PARTY AND OTHER TRANSACTIONS (continued)
Other
Petrel Resources plc shares offices and overheads with a number of companies also based at 162 Clontarf Road.These companies have some common directors.
Transactions with these companies during the year are set out below:
Pan Hydro-African Botswana Clontarf Connemara Cooley Andean carbon Stellar
Diamonds Diamonds Energy Mining Distillery Resources Exploration Diamondsplc plc plc plc plc plc plc plc Total
€ € € € € € € € €
Balance at1 January 2010 11,836 - 19,153 1,343 (14,075) 35,384 - 13,178 66,819
Office and overheadcosts recharged (22,926) - 16,555 569 (35,300) - 23,107 - (17,995)
Exploration andevaluation expenditurerecharged by Petrel - - 44,464 - - - - - 44,464
Exploration andevaluation expenditurerecharged to Petrel - - - - - - (67,560) - (67,560)
Transfer on demerger 11,090 (11,090) - - - (35,384) 35,384 - -Repayments - - - - 49,375 97,739 (13,178) 133,936
––––––––– ––––––––– ––––––––– ––––––––– ––––––––– ––––––––– ––––––––– ––––––––– –––––––––Balance at31 December 2010 - (11,090) 80,172 1,912 - - 88,670 - 159,664
Office and overheadcosts recharged - (10,069) 4,150 2,536 (37,500) - - - 40,883
Exploration andevaluation expenditurerecharged by Petrel - - 13,844 - - - 13,844 - 27,688
Exploration andevaluation expenditurerecharged to Petrel - - (1,260) - - - (17,856) - (19,116)Repayments - 26,168 (90,329) (709) 37,500 - (88,670) - (116,040)
––––––––– ––––––––– ––––––––– ––––––––– ––––––––– ––––––––– ––––––––– ––––––––– –––––––––Balance at 31December 2011 - 5,009 6,577 3,739 - - (4,012) - 11,313
––––––––– ––––––––– ––––––––– ––––––––– ––––––––– ––––––––– ––––––––– ––––––––– –––––––––––––––––– ––––––––– ––––––––– ––––––––– ––––––––– ––––––––– ––––––––– ––––––––– –––––––––
Notes To The Financial Statementsfor the year ended 31 December 2011
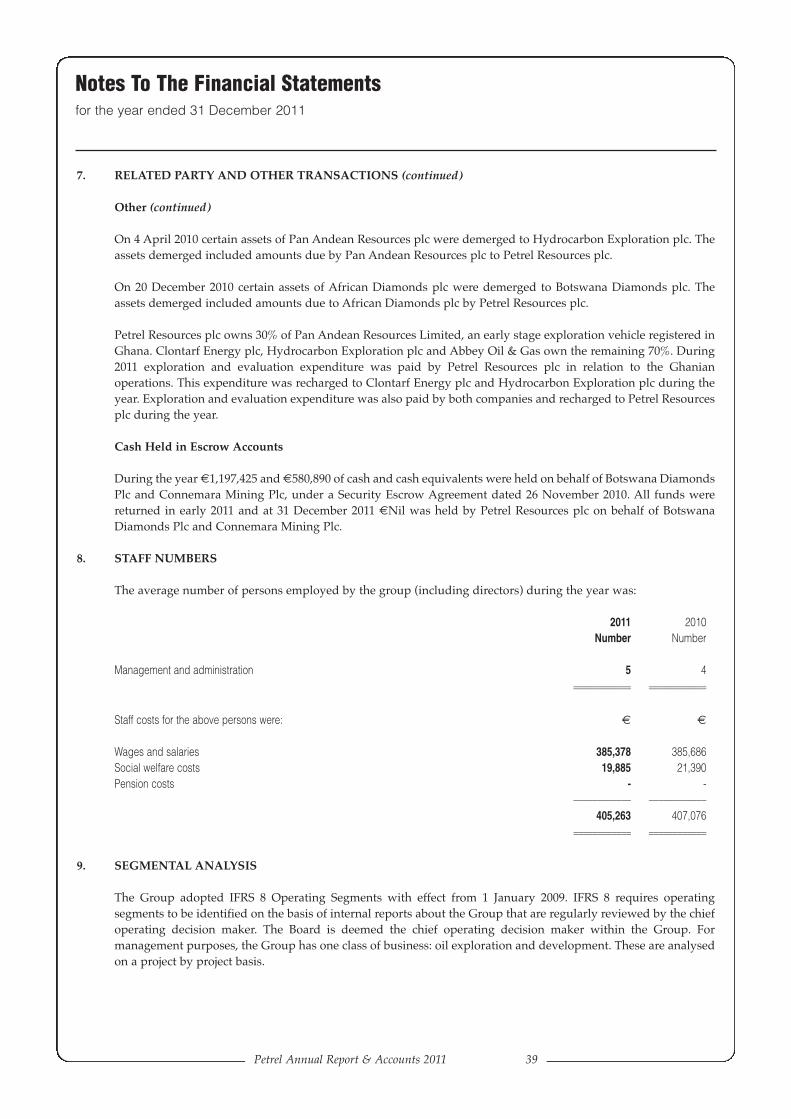
Petrel Annual Report & Accounts 2011 39
Notes To The Financial Statementsfor the year ended 31 December 2011
7. RELATED PARTY AND OTHER TRANSACTIONS (continued)
Other (continued)
On 4 April 2010 certain assets of Pan Andean Resources plc were demerged to Hydrocarbon Exploration plc. Theassets demerged included amounts due by Pan Andean Resources plc to Petrel Resources plc.
On 20 December 2010 certain assets of African Diamonds plc were demerged to Botswana Diamonds plc. Theassets demerged included amounts due to African Diamonds plc by Petrel Resources plc.
Petrel Resources plc owns 30% of Pan Andean Resources Limited, an early stage exploration vehicle registered inGhana. Clontarf Energy plc, Hydrocarbon Exploration plc and Abbey Oil & Gas own the remaining 70%. During2011 exploration and evaluation expenditure was paid by Petrel Resources plc in relation to the Ghanianoperations. This expenditure was recharged to Clontarf Energy plc and Hydrocarbon Exploration plc during theyear. Exploration and evaluation expenditure was also paid by both companies and recharged to Petrel Resourcesplc during the year.
Cash Held in Escrow Accounts
During the year €1,197,425 and €580,890 of cash and cash equivalents were held on behalf of Botswana DiamondsPlc and Connemara Mining Plc, under a Security Escrow Agreement dated 26 November 2010. All funds werereturned in early 2011 and at 31 December 2011 €Nil was held by Petrel Resources plc on behalf of BotswanaDiamonds Plc and Connemara Mining Plc.
8. STAFF NUMBERS
The average number of persons employed by the group (including directors) during the year was:
2011 2010Number Number
Management and administration 5 4–––––––––––– –––––––––––––––––––––––– ––––––––––––
Staff costs for the above persons were: € €
Wages and salaries 385,378 385,686Social welfare costs 19,885 21,390Pension costs - -
–––––––––––– ––––––––––––405,263 407,076
–––––––––––– –––––––––––––––––––––––– ––––––––––––
9. SEGMENTAL ANALYSIS
The Group adopted IFRS 8 Operating Segments with effect from 1 January 2009. IFRS 8 requires operatingsegments to be identified on the basis of internal reports about the Group that are regularly reviewed by the chiefoperating decision maker. The Board is deemed the chief operating decision maker within the Group. Formanagement purposes, the Group has one class of business: oil exploration and development. These are analysedon a project by project basis.
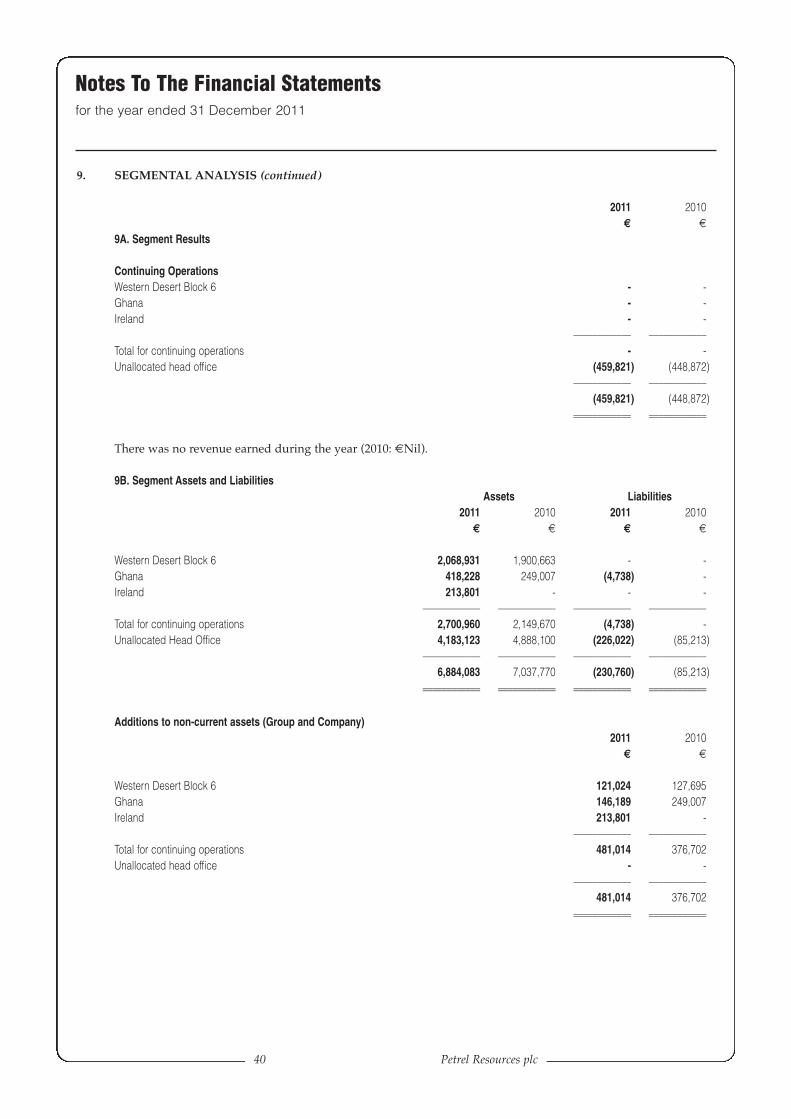
40 Petrel Resources plc
9. SEGMENTAL ANALYSIS (continued)
2011 2010€ €
9A. Segment Results
Continuing OperationsWestern Desert Block 6 - -Ghana - -Ireland - -
–––––––––––– ––––––––––––Total for continuing operations - -Unallocated head office (459,821) (448,872)
–––––––––––– ––––––––––––(459,821) (448,872)
–––––––––––– –––––––––––––––––––––––– ––––––––––––
There was no revenue earned during the year (2010: €Nil).
9B. Segment Assets and LiabilitiesAssets Liabilities
2011 2010 2011 2010€ € € €
Western Desert Block 6 2,068,931 1,900,663 - -Ghana 418,228 249,007 (4,738) -Ireland 213,801 - - -
–––––––––––– –––––––––––– –––––––––––– ––––––––––––Total for continuing operations 2,700,960 2,149,670 (4,738) -Unallocated Head Office 4,183,123 4,888,100 (226,022) (85,213)
–––––––––––– –––––––––––– –––––––––––– ––––––––––––6,884,083 7,037,770 (230,760) (85,213)
–––––––––––– –––––––––––– –––––––––––– –––––––––––––––––––––––– –––––––––––– –––––––––––– ––––––––––––
Additions to non-current assets (Group and Company)2011 2010
€ €
Western Desert Block 6 121,024 127,695Ghana 146,189 249,007Ireland 213,801 -
–––––––––––– ––––––––––––Total for continuing operations 481,014 376,702Unallocated head office - -
–––––––––––– ––––––––––––481,014 376,702
–––––––––––– –––––––––––––––––––––––– ––––––––––––
Notes To The Financial Statementsfor the year ended 31 December 2011
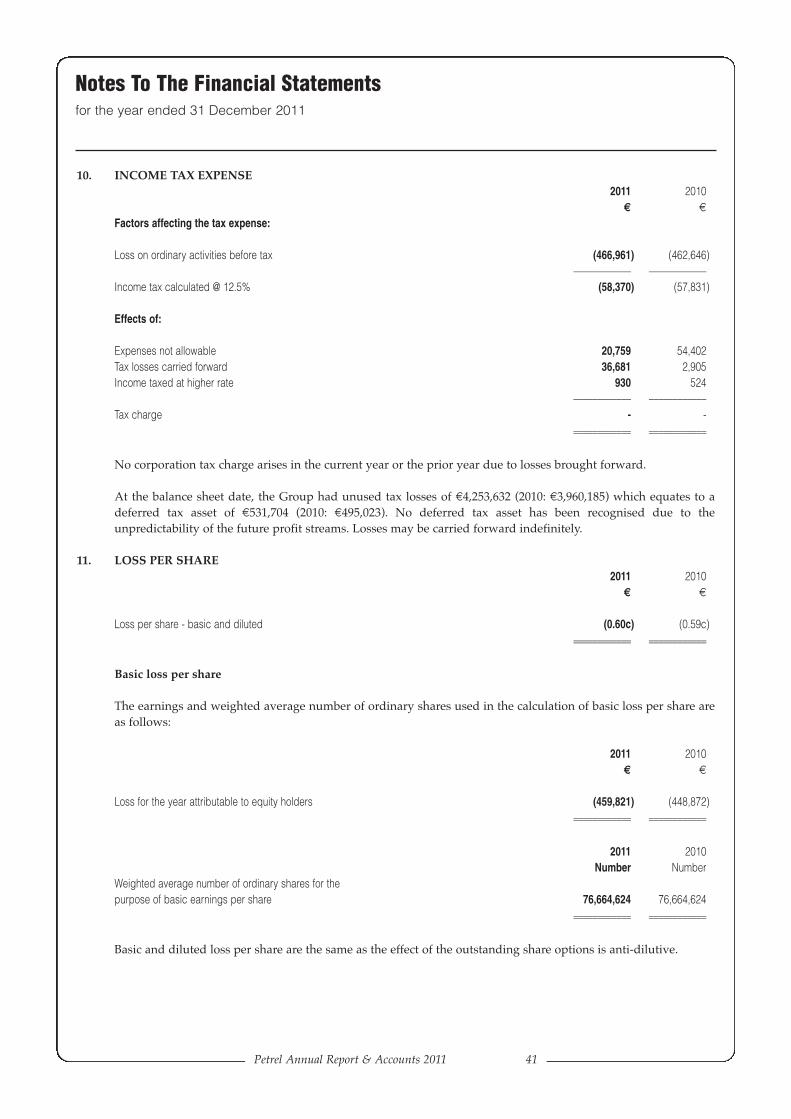
Petrel Annual Report & Accounts 2011 41
10. INCOME TAX EXPENSE2011 2010
€ €
Factors affecting the tax expense:
Loss on ordinary activities before tax (466,961) (462,646)–––––––––––– ––––––––––––
Income tax calculated @ 12.5% (58,370) (57,831)
Effects of:
Expenses not allowable 20,759 54,402Tax losses carried forward 36,681 2,905Income taxed at higher rate 930 524
–––––––––––– ––––––––––––Tax charge - -
–––––––––––– –––––––––––––––––––––––– ––––––––––––
No corporation tax charge arises in the current year or the prior year due to losses brought forward.
At the balance sheet date, the Group had unused tax losses of €4,253,632 (2010: €3,960,185) which equates to adeferred tax asset of €531,704 (2010: €495,023). No deferred tax asset has been recognised due to theunpredictability of the future profit streams. Losses may be carried forward indefinitely.
11. LOSS PER SHARE2011 2010
€ €
Loss per share - basic and diluted (0.60c) (0.59c)–––––––––––– –––––––––––––––––––––––– ––––––––––––
Basic loss per share
The earnings and weighted average number of ordinary shares used in the calculation of basic loss per share areas follows:
2011 2010€ €
Loss for the year attributable to equity holders (459,821) (448,872)–––––––––––– –––––––––––––––––––––––– ––––––––––––
2011 2010Number Number
Weighted average number of ordinary shares for thepurpose of basic earnings per share 76,664,624 76,664,624
–––––––––––– –––––––––––––––––––––––– ––––––––––––
Basic and diluted loss per share are the same as the effect of the outstanding share options is anti-dilutive.
Notes To The Financial Statementsfor the year ended 31 December 2011
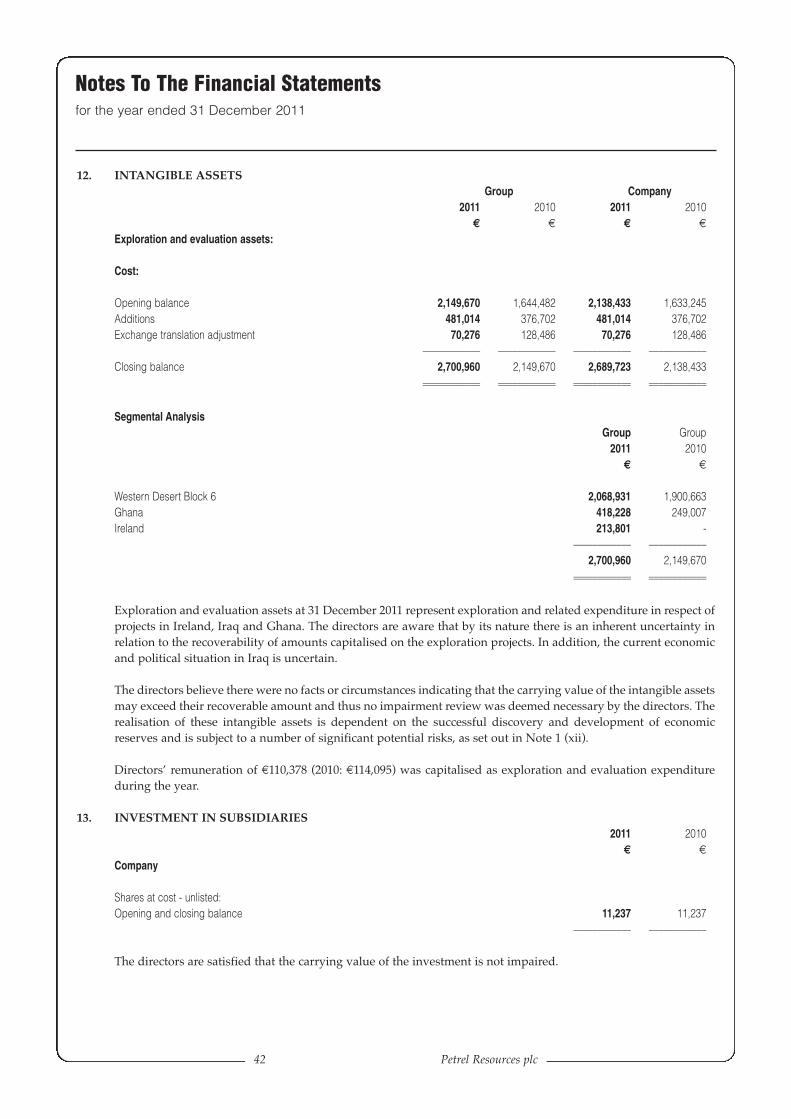
42 Petrel Resources plc
12. INTANGIBLE ASSETSGroup Company
2011 2010 2011 2010€ € € €
Exploration and evaluation assets:
Cost:
Opening balance 2,149,670 1,644,482 2,138,433 1,633,245Additions 481,014 376,702 481,014 376,702Exchange translation adjustment 70,276 128,486 70,276 128,486
–––––––––––– –––––––––––– –––––––––––– ––––––––––––Closing balance 2,700,960 2,149,670 2,689,723 2,138,433
–––––––––––– –––––––––––– –––––––––––– –––––––––––––––––––––––– –––––––––––– –––––––––––– ––––––––––––
Segmental AnalysisGroup Group
2011 2010€ €
Western Desert Block 6 2,068,931 1,900,663Ghana 418,228 249,007Ireland 213,801 -
–––––––––––– ––––––––––––2,700,960 2,149,670
–––––––––––– –––––––––––––––––––––––– ––––––––––––
Exploration and evaluation assets at 31 December 2011 represent exploration and related expenditure in respect ofprojects in Ireland, Iraq and Ghana. The directors are aware that by its nature there is an inherent uncertainty inrelation to the recoverability of amounts capitalised on the exploration projects. In addition, the current economicand political situation in Iraq is uncertain.
The directors believe there were no facts or circumstances indicating that the carrying value of the intangible assetsmay exceed their recoverable amount and thus no impairment review was deemed necessary by the directors. Therealisation of these intangible assets is dependent on the successful discovery and development of economicreserves and is subject to a number of significant potential risks, as set out in Note 1 (xii).
Directors’ remuneration of €110,378 (2010: €114,095) was capitalised as exploration and evaluation expenditureduring the year.
13. INVESTMENT IN SUBSIDIARIES2011 2010
€ €
Company
Shares at cost - unlisted:Opening and closing balance 11,237 11,237
–––––––––––– ––––––––––––
The directors are satisfied that the carrying value of the investment is not impaired.
Notes To The Financial Statementsfor the year ended 31 December 2011
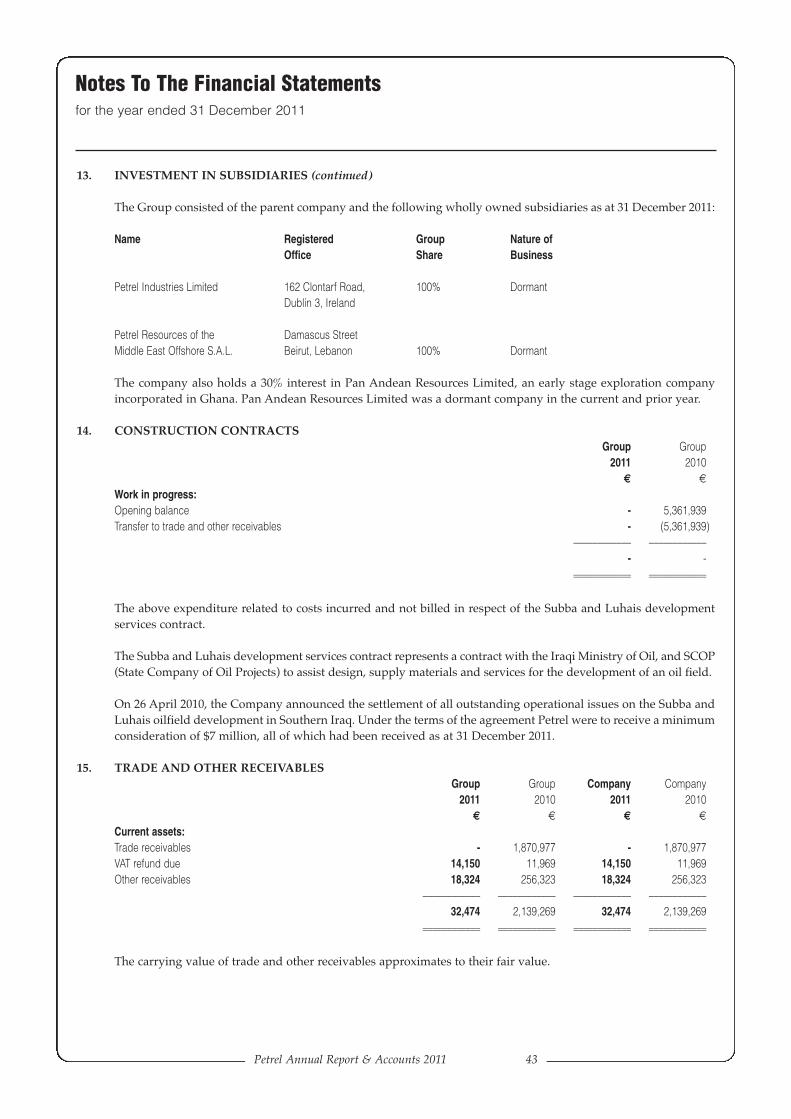
Petrel Annual Report & Accounts 2011 43
13. INVESTMENT IN SUBSIDIARIES (continued)
The Group consisted of the parent company and the following wholly owned subsidiaries as at 31 December 2011:
Name Registered Group Nature ofOffice Share Business
Petrel Industries Limited 162 Clontarf Road, 100% DormantDublin 3, Ireland
Petrel Resources of the Damascus StreetMiddle East Offshore S.A.L. Beirut, Lebanon 100% Dormant
The company also holds a 30% interest in Pan Andean Resources Limited, an early stage exploration companyincorporated in Ghana. Pan Andean Resources Limited was a dormant company in the current and prior year.
14. CONSTRUCTION CONTRACTSGroup Group
2011 2010€ €
Work in progress:Opening balance - 5,361,939Transfer to trade and other receivables - (5,361,939)
–––––––––––– ––––––––––––- -
–––––––––––– –––––––––––––––––––––––– ––––––––––––
The above expenditure related to costs incurred and not billed in respect of the Subba and Luhais developmentservices contract.
The Subba and Luhais development services contract represents a contract with the Iraqi Ministry of Oil, and SCOP(State Company of Oil Projects) to assist design, supply materials and services for the development of an oil field.
On 26 April 2010, the Company announced the settlement of all outstanding operational issues on the Subba andLuhais oilfield development in Southern Iraq. Under the terms of the agreement Petrel were to receive a minimumconsideration of $7 million, all of which had been received as at 31 December 2011.
15. TRADE AND OTHER RECEIVABLESGroup Group Company Company
2011 2010 2011 2010€ € € €
Current assets:Trade receivables - 1,870,977 - 1,870,977VAT refund due 14,150 11,969 14,150 11,969Other receivables 18,324 256,323 18,324 256,323
–––––––––––– –––––––––––– –––––––––––– ––––––––––––32,474 2,139,269 32,474 2,139,269
–––––––––––– –––––––––––– –––––––––––– –––––––––––––––––––––––– –––––––––––– –––––––––––– ––––––––––––
The carrying value of trade and other receivables approximates to their fair value.
Notes To The Financial Statementsfor the year ended 31 December 2011
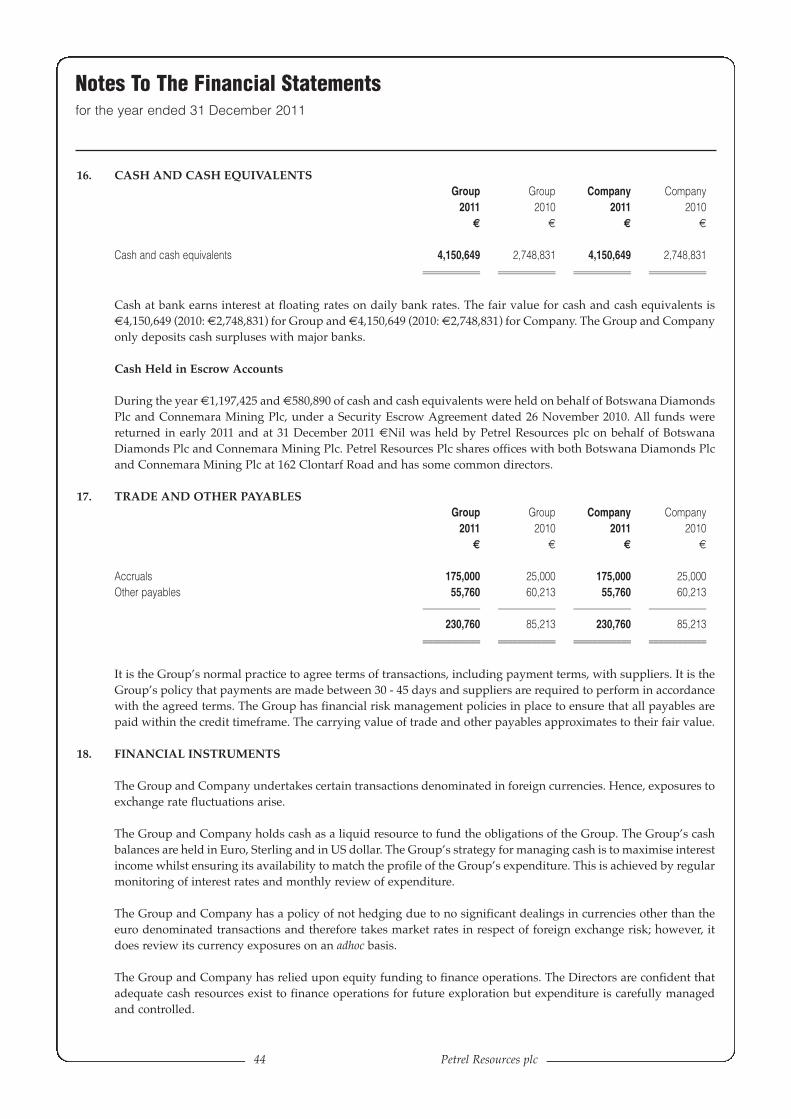
44 Petrel Resources plc
16. CASH AND CASH EQUIVALENTSGroup Group Company Company
2011 2010 2011 2010€ € € €
Cash and cash equivalents 4,150,649 2,748,831 4,150,649 2,748,831–––––––––––– –––––––––––– –––––––––––– –––––––––––––––––––––––– –––––––––––– –––––––––––– ––––––––––––
Cash at bank earns interest at floating rates on daily bank rates. The fair value for cash and cash equivalents is€4,150,649 (2010: €2,748,831) for Group and €4,150,649 (2010: €2,748,831) for Company. The Group and Companyonly deposits cash surpluses with major banks.
Cash Held in Escrow Accounts
During the year €1,197,425 and €580,890 of cash and cash equivalents were held on behalf of Botswana DiamondsPlc and Connemara Mining Plc, under a Security Escrow Agreement dated 26 November 2010. All funds werereturned in early 2011 and at 31 December 2011 €Nil was held by Petrel Resources plc on behalf of BotswanaDiamonds Plc and Connemara Mining Plc. Petrel Resources Plc shares offices with both Botswana Diamonds Plcand Connemara Mining Plc at 162 Clontarf Road and has some common directors.
17. TRADE AND OTHER PAYABLESGroup Group Company Company
2011 2010 2011 2010€ € € €
Accruals 175,000 25,000 175,000 25,000Other payables 55,760 60,213 55,760 60,213
–––––––––––– –––––––––––– –––––––––––– ––––––––––––230,760 85,213 230,760 85,213
–––––––––––– –––––––––––– –––––––––––– –––––––––––––––––––––––– –––––––––––– –––––––––––– ––––––––––––
It is the Group’s normal practice to agree terms of transactions, including payment terms, with suppliers. It is theGroup’s policy that payments are made between 30 - 45 days and suppliers are required to perform in accordancewith the agreed terms. The Group has financial risk management policies in place to ensure that all payables arepaid within the credit timeframe. The carrying value of trade and other payables approximates to their fair value.
18. FINANCIAL INSTRUMENTS
The Group and Company undertakes certain transactions denominated in foreign currencies. Hence, exposures toexchange rate fluctuations arise.
The Group and Company holds cash as a liquid resource to fund the obligations of the Group. The Group’s cashbalances are held in Euro, Sterling and in US dollar. The Group’s strategy for managing cash is to maximise interestincome whilst ensuring its availability to match the profile of the Group’s expenditure. This is achieved by regularmonitoring of interest rates and monthly review of expenditure.
The Group and Company has a policy of not hedging due to no significant dealings in currencies other than theeuro denominated transactions and therefore takes market rates in respect of foreign exchange risk; however, itdoes review its currency exposures on an adhoc basis.
The Group and Company has relied upon equity funding to finance operations. The Directors are confident thatadequate cash resources exist to finance operations for future exploration but expenditure is carefully managedand controlled.
Notes To The Financial Statementsfor the year ended 31 December 2011
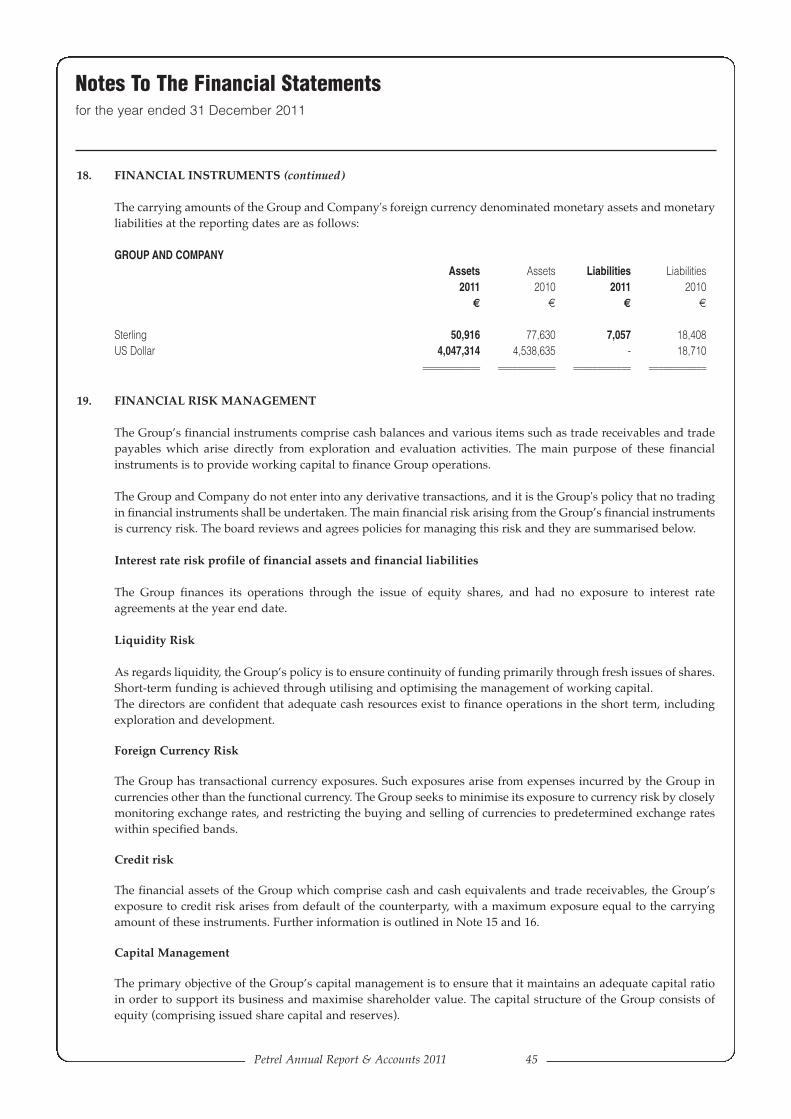
Petrel Annual Report & Accounts 2011 45
18. FINANCIAL INSTRUMENTS (continued)
The carrying amounts of the Group and Company's foreign currency denominated monetary assets and monetaryliabilities at the reporting dates are as follows:
GROUP AND COMPANYAssets Assets Liabilities Liabilities
2011 2010 2011 2010€ € € €
Sterling 50,916 77,630 7,057 18,408US Dollar 4,047,314 4,538,635 - 18,710
–––––––––––– –––––––––––– –––––––––––– –––––––––––––––––––––––– –––––––––––– –––––––––––– ––––––––––––
19. FINANCIAL RISK MANAGEMENT
The Group’s financial instruments comprise cash balances and various items such as trade receivables and tradepayables which arise directly from exploration and evaluation activities. The main purpose of these financialinstruments is to provide working capital to finance Group operations.
The Group and Company do not enter into any derivative transactions, and it is the Group's policy that no tradingin financial instruments shall be undertaken. The main financial risk arising from the Group’s financial instrumentsis currency risk. The board reviews and agrees policies for managing this risk and they are summarised below.
Interest rate risk profile of financial assets and financial liabilities
The Group finances its operations through the issue of equity shares, and had no exposure to interest rateagreements at the year end date.
Liquidity Risk
As regards liquidity, the Group’s policy is to ensure continuity of funding primarily through fresh issues of shares.Short-term funding is achieved through utilising and optimising the management of working capital.The directors are confident that adequate cash resources exist to finance operations in the short term, includingexploration and development.
Foreign Currency Risk
The Group has transactional currency exposures. Such exposures arise from expenses incurred by the Group incurrencies other than the functional currency. The Group seeks to minimise its exposure to currency risk by closelymonitoring exchange rates, and restricting the buying and selling of currencies to predetermined exchange rateswithin specified bands.
Credit risk
The financial assets of the Group which comprise cash and cash equivalents and trade receivables, the Group’sexposure to credit risk arises from default of the counterparty, with a maximum exposure equal to the carryingamount of these instruments. Further information is outlined in Note 15 and 16.
Capital Management
The primary objective of the Group’s capital management is to ensure that it maintains an adequate capital ratioin order to support its business and maximise shareholder value. The capital structure of the Group consists ofequity (comprising issued share capital and reserves).
Notes To The Financial Statementsfor the year ended 31 December 2011
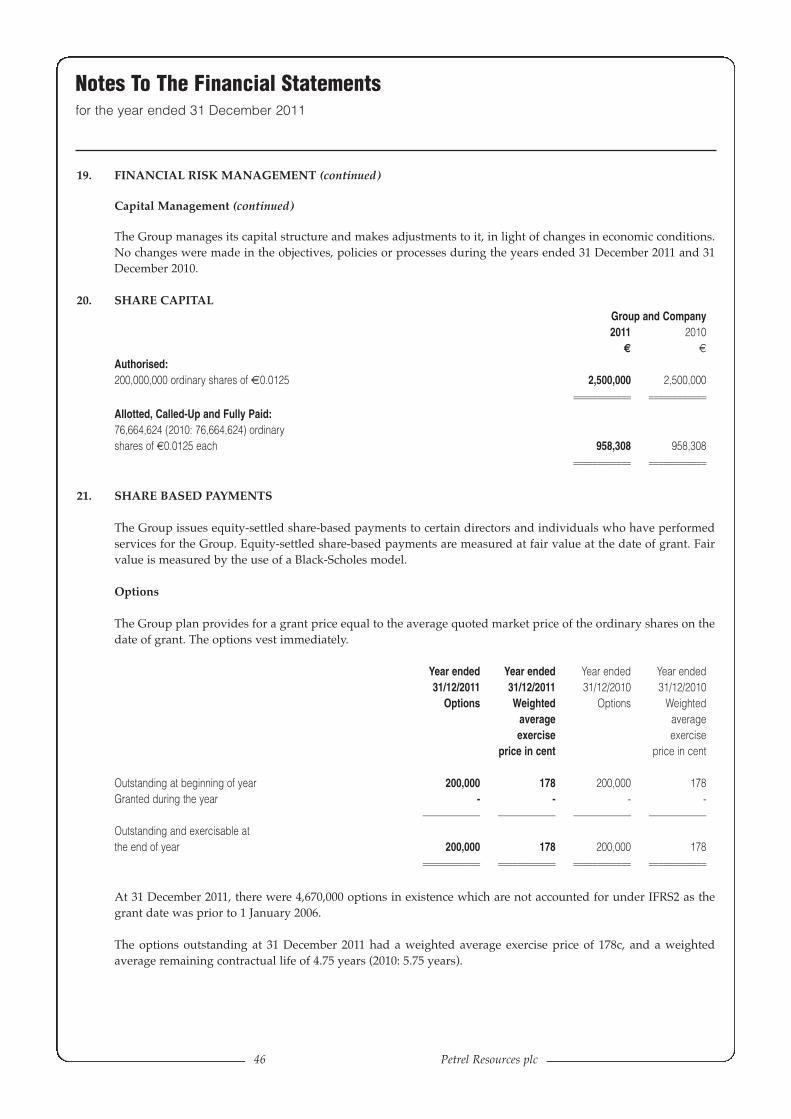
46 Petrel Resources plc
19. FINANCIAL RISK MANAGEMENT (continued)
Capital Management (continued)
The Group manages its capital structure and makes adjustments to it, in light of changes in economic conditions.No changes were made in the objectives, policies or processes during the years ended 31 December 2011 and 31December 2010.
20. SHARE CAPITALGroup and Company2011 2010
€ €
Authorised:200,000,000 ordinary shares of €0.0125 2,500,000 2,500,000
–––––––––––– –––––––––––––––––––––––– ––––––––––––Allotted, Called-Up and Fully Paid:76,664,624 (2010: 76,664,624) ordinaryshares of €0.0125 each 958,308 958,308
–––––––––––– –––––––––––––––––––––––– ––––––––––––
21. SHARE BASED PAYMENTS
The Group issues equity-settled share-based payments to certain directors and individuals who have performedservices for the Group. Equity-settled share-based payments are measured at fair value at the date of grant. Fairvalue is measured by the use of a Black-Scholes model.
Options
The Group plan provides for a grant price equal to the average quoted market price of the ordinary shares on thedate of grant. The options vest immediately.
Year ended Year ended Year ended Year ended31/12/2011 31/12/2011 31/12/2010 31/12/2010
Options Weighted Options Weightedaverage averageexercise exercise
price in cent price in cent
Outstanding at beginning of year 200,000 178 200,000 178Granted during the year - - - -
–––––––––––– –––––––––––– –––––––––––– ––––––––––––Outstanding and exercisable atthe end of year 200,000 178 200,000 178
–––––––––––– –––––––––––– –––––––––––– –––––––––––––––––––––––– –––––––––––– –––––––––––– ––––––––––––
At 31 December 2011, there were 4,670,000 options in existence which are not accounted for under IFRS2 as thegrant date was prior to 1 January 2006.
The options outstanding at 31 December 2011 had a weighted average exercise price of 178c, and a weightedaverage remaining contractual life of 4.75 years (2010: 5.75 years).
Notes To The Financial Statementsfor the year ended 31 December 2011

Petrel Annual Report & Accounts 2011 47
22. PROFIT ATTRIBUTABLE TO PETREL RESOURCES PLC
In accordance with Section 148 (8) of the Companies Act, 1963 and Section 7 (1A) of the Companies (Amendment)Act, 1986, the company is availing of the exemption from presenting its individual profit and loss account to theAnnual General Meeting and from filing it with the Registrar of Companies. The loss for the year in the parentcompany was €459,821 (2010: €448,872).
23. NON-CASH TRANSACTIONS
There were no significant non-cash transactions during 2011.
24. CAPITAL COMMITMENTS
There were no capital commitments at the balance sheet date.
25. POST BALANCE SHEET EVENTS
There were no material post balance sheet events.
26. CONTINGENT LIABILITIES
There are no contingent liabilities (2010: €Nil).
Notes To The Financial Statementsfor the year ended 31 December 2011

48 Petrel Resources plc
Notice of Annual General Meeting
Notice is hereby given that an Annual General Meeting of Petrel Resources plc will be held on Thursday, 26th July 2012in The Ballsbridge Hotel, Pembroke Road, Ballsbridge, Dublin 4 at 11.00am for the following purposes:
1. To receive and consider the Directors Report, Audited Accounts and Auditors Report for the year ended December31, 2011.
2. To re-appoint director: John Teeling retires in accordance with Article 95 and seeks re-election.
3. To authorise the directors to fix the remuneration of the auditors.
4 To transact any other ordinary business of an annual general meeting.
By order of the Board:
James FinnSecretary
25 June 2012
Note: A member of the company who is unable to attend and vote at the above Annual General Meeting is entitled toappoint a proxy to attend, speak and vote in his stead. A proxy need not be a member of the Company.
To be effective, the Form of Proxy duly signed, together with the power of attorney (if any) under which it issigned, must be deposited at the Company’s Registrars, Computershare Investor Services (Ireland) Ltd., HeronHouse, Corrig Road, Sandyford Industrial Estate, Dublin 18, not less than forty- eight hours before the timeappointed for the Meeting or any adjournment thereof at which the person named in the Form of Proxy is to vote.
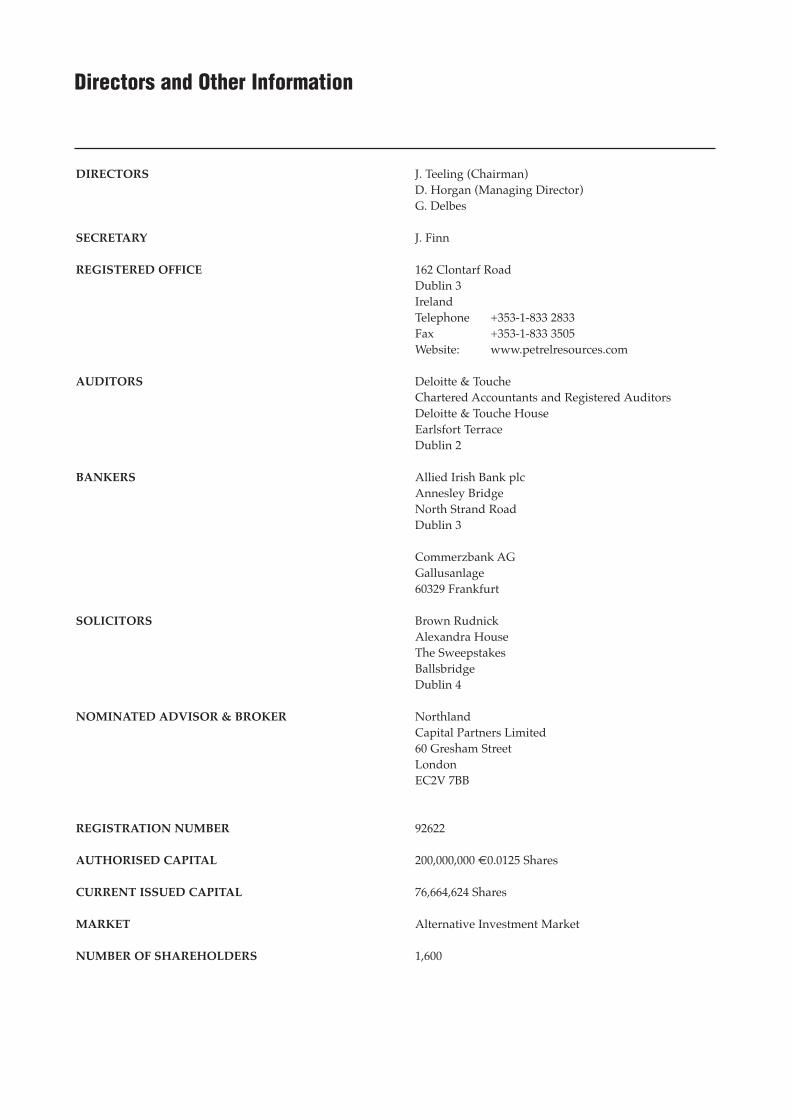
Directors and Other Information
DIRECTORS J. Teeling (Chairman)D. Horgan (Managing Director)G. Delbes
SECRETARY J. Finn
REGISTERED OFFICE 162 Clontarf RoadDublin 3IrelandTelephone +353-1-833 2833Fax +353-1-833 3505Website: www.petrelresources.com
AUDITORS Deloitte & ToucheChartered Accountants and Registered AuditorsDeloitte & Touche HouseEarlsfort TerraceDublin 2
BANKERS Allied Irish Bank plcAnnesley BridgeNorth Strand RoadDublin 3
Commerzbank AGGallusanlage60329 Frankfurt
SOLICITORS Brown RudnickAlexandra HouseThe SweepstakesBallsbridgeDublin 4
NOMINATED ADVISOR & BROKER NorthlandCapital Partners Limited60 Gresham StreetLondonEC2V 7BB
REGISTRATION NUMBER 92622
AUTHORISED CAPITAL 200,000,000 €0.0125 Shares
CURRENT ISSUED CAPITAL 76,664,624 Shares
MARKET Alternative Investment Market
NUMBER OF SHAREHOLDERS 1,600
300668 Petrel Cover 21/06/2012 15:24 Page 2

Petrel Resources PlcAnnual Report and Accounts
Year ended 31 December 2011
Corporate Office:162 Clontarf Road, Dublin 3, Ireland.
Tel: +353 (0)1 833 2833Fax: + 353 (0)1 833 3505
Company Registration Number: 92622
www.petrelresources.com
Petrel Resou
rces Plc
An
nu
al Report &
Accou
nts
Year ended 31 D
ecember 2011
300668 Petrel Cover 21/06/2012 15:24 Page 1