Embed Size (px)
Citation preview

Peter’s & Co. Oil and Gas Conference – SEPTEMBER 2005
A Platform for Growth

Overview
TSX symbol: BVI Average daily trading volume (2005): 346,000 Market capitalization: $950 million Shares outstanding:
Basic – 94.9 million Fully diluted – 101.1 million Management / Directors
Basic – 16% Fully diluted – 20%

Strategy
Focus on Canadian Oilsands Growth through the drillbit Maintain a healthy balance sheet

0
1,000
2,000
3,000
4,000
5,000
6,000
7,000
0
5
10
15
20
25
30
35
History of Growth – Production
00 01 02 03 04 00 01 02 03 04
12.4
21.118.7
20.4
26.1
1,828
3,1263,414
4,080
5,795
Production (bbl/day) Production per Share(bbl/1,000 shares)
Average growth rate of 26%/year
Average growth rate of 16%/year

0.00
0.05
0.10
0.15
0.20
0.25
0.30
0.35
0.40
0
5
10
15
20
25
30
History of Growth – Cash Flow
00 01 02 03 04 00 01 02 03 04
0.10 0.10
0.18 0.19
0.32
5.2 5.6
12.314.1
25.6
Cash Flow ($ millions) Cash Flow per Share ($/share)
Average growth rate of 38%/year
Average growth rate of 26%/year

$0.00
$2.00
$4.00
$6.00
$8.00
$10.00
History of Growth – Share Price
00 01 02 03 04
0.93 0.99
2.36
4.15
7.35
Average increase of 53%/year
share price

$0.00
$2.00
$4.00
$6.00
$8.00
$10.00
$12.00
$14.00
$16.00
$18.00
Finding and Development Costs (Proved + Probable)
BVI Industry* BVI Industry*
$4.03
$17.25
$4.65
$11.06
1 year 3 year
Top Quartile Performance
*Source: First Energy Capital Corp. Study for 2004

Recycle Ratio
*Source: First Energy Capital Corp. Study for 2004
BVI Industry* BVI Industry*
3.4
1.2
2.8
1.3
1 year 3 year avg Recycle Ratios Comparable to Gas and Light Oil

0
5,000
10,000
15,000
20,000
25,000
30,000
35,000
40,000
45,000
A Platform for Growth – Production
03 04 05 (E) 07 (E) 09 (E)
bbl/day
Hilda Lake (Orion)SealLloydminster
Over the next five years production is expected to increase from 10,000 bbl/day to 40,000 bbl/day from existing
inventory of projects

Core Oilsands Areas
LLOYDMINSTER
HILDA LAKE (ORION)
SEAL
20,000 bopd potential
20,000 bopd potential
3,000 bopd potential
ALBERTA SASKATCHEWAN
CHIPMUNKNew Area

Peace River Oilsands – Seal
Summary Located in the Peace
River Oilsands 80,000 net acres 9° - 13° API oil High rate horizontal wells
(125 - 350 bbl/day) Established infrastructure
23,000 bbl/day battery 58,000 bbl/day pipeline
50% - 100% WI
PEACE RIVER NORTH
PEACE RIVER
CADOTTE
NORTHERN
CENTRAL
WESTERN
EASTERN
R17
T85
T84
T83
T82
R16 R15 R14W5

Seal – Operating Characteristics
Operating in an oilsands region No steam required No mining
1% royalty until payout Low operating costs
2004 - $5.58/bbl No sand production
F&D costs - approx. $4.00/bbl

0
5
10
15
20
25
30
35
Seal – Exposure to a Large Resource Base
8
14
20
30+
% recovery
800 million barrels of oilHow much of this oil
is recoverable is a key factor in determining the value of the Seal property
Sproule(initial
production)
Sproule(with prod.
history)
LabStudies
WaterfloodPotential

Central Block (76 wells)
Eastern Block (45-50 wells)
Peace River Block (50-80 wells)
Cadotte Block (25-40 wells)
Northern Block (25-40 wells)
Waterflood Potential
2003 2004 2005 2006 2007 2008 2009
Seal – Development Timetable

Cold Lake Oilsands – Orion SAGD
CALGARY
ALBERTA
Summary Located in the Cold Lake
Oilsands Large resource base
Internal estimate of 190 million recoverable barrels
20,000 bbl/day project 25 year life
Established infrastructure 4 heavy oil pipelines
nearby 100% owned
EDMONTON
CNRL(40,000 bbl/day)
Imperial Oil(150,000 bbl/day)
Husky Tucker Lake(30,000 bbl/day)
BlackRockOrion SAGD at Hilda Lake

Orion SAGD – Per Barrel Economics
Operating marginRoyaltiesNatural gas costsOperating costsCapital costs
Wellhead $21.50/bbl
$6.80
Wellhead $39.50/bbl
$2.40
$7.05
$2.75$2.50
$16.78
$5.74
$11.73
$2.75$2.50
Base Case Current Price Environment

Orion SAGD – Commercial Project
Base Case Economics 21% after tax IRR Payout in six years
(Phase 1 and Phase 2) In excess of $1 billion in free BT
cash flowAssumptions: WTI US$30/bbl Differential US$7/bbl Gas price $6/mcf Fx – 0.80 In the current price environment, the
project generates an IRR of 40% and > $3 billion in BT cash flow

WTI ± $1.00 US/bbl
Differential ± $1.00 US/bbl
Gas prices ± $1.00 Cdn/mcf
Capital costs ± 20%
Diluent prices ± $1.00 US/bbl
US / Cdn exchange rate ± $0.01
Steam / oil ratio ± 10%
-3.0% -2.0% -1.0% 0.0% 1.0% 2.0% 3.0%
Orion SAGD – Key Economic Drivers
+2.21-1.75
+3.05-2.7
+1.9-1.45
+1.49-1.16
+.9-.9
+.55-.55
+1.2-1.3
Change in IRR (%)
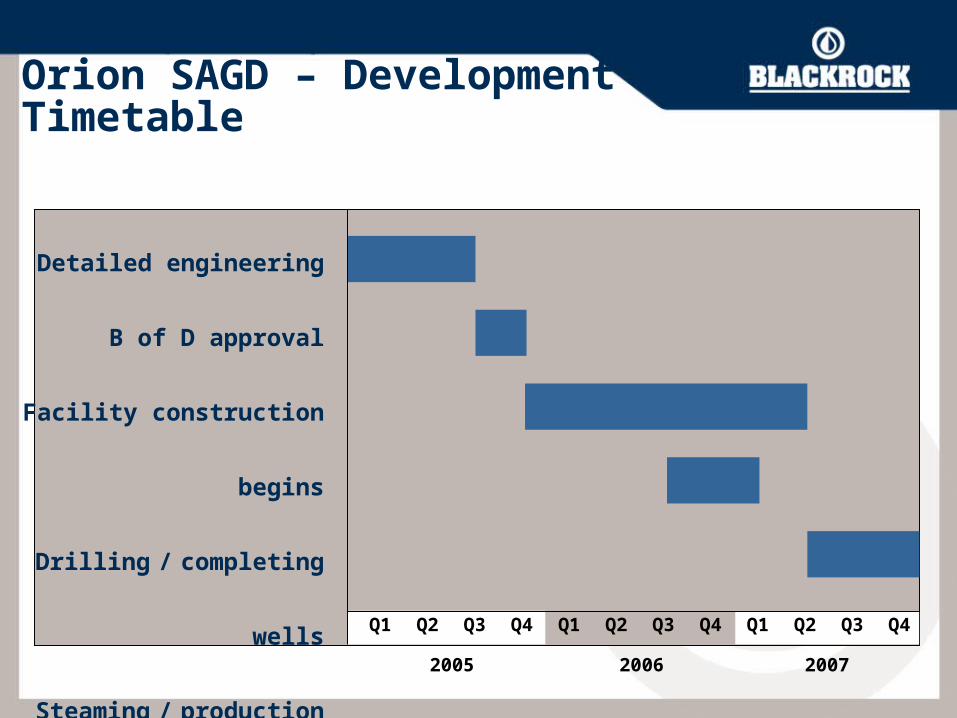
Detailed engineering
B of D approval
Facility construction begins
Drilling / completing wells
Steaming / production begins
Q1 Q2 Q3 Q4
2005 2006 2007
Orion SAGD – Development Timetable
Q1 Q2 Q3 Q4 Q1 Q2 Q3 Q4

New Discovery – Chipmunk(Peace River Oilsands)
Characteristics Located 15 miles from our Seal property 3 successful wells - 960 bbl/day 65,000 gross acres of land acquired 78 reef-like structures identified 55% working interest Talisman Energy is our partner 2005 Activities
$2.5 mm 3D seismic program Test up to 5 reef structuresEASTERN
2005 3D Program

Core Area – Lloydminster
Established heavy oil area 2,000 - 3,000 bbl/day potential 20 wells planned in 2005 Allocate $5 - $10 million of
our capital budget per year for this area

Current Financial Position
Working capital $128 mm Long-term debt – Hedged production none
Financial Philosophies Maintain a strong balance sheet
Minimize the use of debt Maintain exposure to oil prices
Do not hedge production

Capital Requirements / Funding
Use of Capital Expenditure program
over next two years (06-07) $350 - $400 mm
Potential Sources of Capital Existing working capital $128 mm Other sources:
Cash flow from operations $150 - $200 mm Debt $50 - $100 mm Sale of non-core assets $40 - $100 mm Equity

Indicative Heavy Oil Pricing5 yr Average 1st H 2005 Current
WTI $30.92 $51.52 $65.00Lloyd heavy oil differential (9.53) (20.40) (19.00)
$21.39 $31.12 $46.00Converted to Cdn$ $30.07 $37.47 $54.42Diluent costs (6.83) (15.15) (14.78)Transportation (2.00) (2.00) (2.00)Wellhead price (Cdn$) $21.24 $20.32 $37.64% of WTI 47% 32% 48%
Heavy oil differentials and diluent costs are key determinants in realized well-head pricesGenerally, Seal / Orion prices average 45-50% of WTI prices
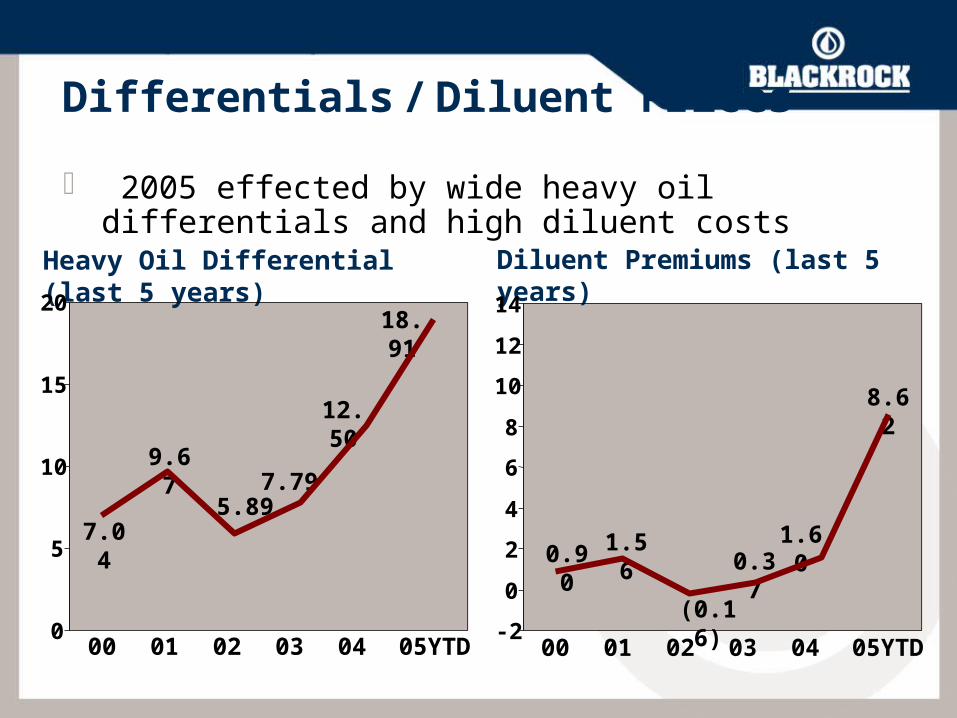
Differentials / Diluent Prices
2005 effected by wide heavy oil differentials and high diluent costs
0.90 1.56
(0.16)
0.371.607.04
9.67
5.897.79
12.50
Heavy Oil Differential (last 5 years) Diluent Premiums (last 5 years)
18.91
00 01 02 03 04 05YTD 00 01 02 03 04 05YTD
8.62
-2
0
2
4
6
8
10
12
14
0
5
10
15
20

Area $ MMSeal 55Orion 20Lloydminster 10Chipmunk 5Other 5Total 95
2005 Activities
Year-end production target of 14,000 bbl/day, 40% increase from 2004
Capital budget recently increased to $95 million

In Summary – A Platform for Growth
Opportunities Seal
Higher recovery rates Waterflood potential Additional discoveries
Chipmunk More Chipmunks
Risks Oil prices Execution (people) Money (financial planning)

This presentation contains forward-looking statements that may be identified by words like “forecast”, “estimated”, “expected” “plans”, “potential”, “targeting” or similar expressions. These forward-looking statements are based on certain assumptions that involve a number of risks and uncertainties and are not guarantees of future performance. Actual results could differ materially as a result of changes in BlackRock’s plans, changes in commodity prices, regulatory changes, general economic, market and business conditions as well as production, development and operating performance and other risks associated with oil and gas operations.
Forward-Looking Statements