Embed Size (px)
Citation preview

2017 UKHOUSINGREVIEWBriefing Paper
Steve Wilcox, John Perry, Mark Stephens and Peter Williams
25 YEARS
1993-2017

Source: Authors’ investigations with assistance from the two parliamentary libraries.
Roll-call of post-war English housing ministers
Aneurin Bevan
Harold Macmillan
Duncan Sandys
Henry Brooke
Charles Hill
Keith Joseph
Richard Crossman
Anthony Greenwood
Robert Mellish
Peter Walker
Julian Amery
Paul Channon
Reginald Freeson
1945 1950 1955 1960 1965 1970 1975
1980 1985 1990 1995 2000 2005 2010
Ian Gow
John Stanley
John Patten
William Waldegrave
Earl of Caithness
Michael Howard
Michael Spicer
George Young
Viscount U
llswater
David Curry
Nick Raynsford
Hilary Armstrong
Lord Falconer
Lord Rooker
Keith Hill
Yvette Cooper
Caroline Flint
Margaret Beckett
John Healey
Grant Shapps
Mark Prisk
Kris Hopkins*
Brandon Lewis
Gavin Barwell
Alok Sharma
1980 - Right to buy starts 1989 – New HA finance regime 1991 – 75,000 repossessions 1995 – Buy to Let starts 2003 - Lowest social housing built 2008 – 2.5m right to buy sales Modest recovery in housebuilding
2015
Hung parliament
1949 – Bevan visits new homes 1953 – Peak council house building 1957 – Private rents decontrolled 1963 – Home property taxes end 1968 – 350,000 homes built 1973 – Private tenants get HB 1976 – IMF austerity measures
KEY: Names in light blue/light red were not members of the cabinet (*not a Minister of State) Local authoritiesGRAPH KEY: Housing associations Private sector
400350300250200150100500Ho
using
comp
letion
s sinc
e 194
6 (00
0s)
400350300250200150100500Ho
using
comp
letion
s sinc
e 194
6 (00
0s)
1968 – Ronan Point disaster
Rachmann slums
Completions
Starts
Grenfell Tower fire

1
Contents
Introduction 3
Uncertain economic prospects 4
Public spending: An end to austerity? 5
Post-election housing blues? 6
Household growth under the shadow of Brexit 7
It’s supply, supply and supply – or is it? 8
England’s affordable housing supply: what does ‘affordable’ mean? 9
Home truths? 10
How affordable is the market for first-time buyers? 11
Private rented sector insecurity – how big a factor in homelessness? 12
Private renting – taxing times for landlords 13
Homelessness – can prevention work have a lasting impact? 14
The unfolding welfare reform challenges 15
Housing, taxation and the generations 16
Scotland leads on private rented sector reform 17
Wales develops distinctive housing policies 18
Northern Ireland’s political uncertainty 19
Updates to the 2017 Compendium of Tables 20

2
The Chartered Institute of Housing
The Chartered Institute of Housing (CIH) is the independent voice for housing and the
home of professional standards. Our goal is simple – to provide housing professionals
and their organisations with the advice, support and knowledge they need to be brilliant.
CIH is a registered charity and not-for-profit organisation. This means that the money we
make is put back into the organisation and funds the activities we carry out to support
the housing sector. We have a diverse membership of people who work in both the
public and private sectors, in 20 countries on five continents across the world.
Chartered Institute of Housing
Octavia House, Westwood Way, Coventry CV4 8JP
Tel: 024 7685 1700
Email: [email protected]
Website: www.cih.org
UK Housing Review Briefing Paper 2017Authors: Steve Wilcox, John Perry, Mark Stephens and Peter WilliamsContributors: Suzanne Fitzpatrick and Beth Watts (page 14); Tamsin Stirling (page 18)
UK Housing Review website: www.ukhousingreview.org.uk
© CIH 2017
Published by the Chartered Institute of Housing
The facts presented and views expressed in the Briefing, however, are those of the
author(s) and not necessarily those of the CIH.
Layout by Jeremy Spencer
Printed by Hobbs the printers, Totton
Inside front cover pictures: 1945: PA; 1950: John M*; 1955: LA archive; 1960: Albert Bridge*;1965: Derek Voller*; 1970: Lukee/Dreamstime; 1975: PA; 1980: PAS; 1985: Jaggery*; 1990:Philip Kinsey/Fotolia; 1995: David Fowler/Dreamstime; 2000: Gerald England*; 2005: M&AHogg*; 2010: istockphoto; 2015: Stephen Richards*. * = www.geograph.org.uk/

3
Introduction
During 2017 the UK Housing Review is celebrating 25 years of publication. The first edition(then called the Housing Finance Review) first appeared in 1993. This mid-year Briefing is
the eighth in a series, complementing the main Review now published annually in the earlySpring. This edition of the Briefing has been held back to allow it to reflect developmentssince June’s general election.
Last year’s Briefing went to press just before the referendum on Britain’s membership of theEU, whose outcome is now seen to have major – if still unclear – implications for theeconomy, for migration and for the housing market. In the month in which the 2017 Reviewwas published (March), there was a new Budget and also devolved government elections inScotland, Wales and Northern Ireland. The last resulted in frustration, however, as theNorthern Ireland Assembly was suspended for the fourth time since the 1998 PeaceAgreement.
Then, in June, an unexpected general election result was followed only a week later by thehorrendous fire that consumed the Grenfell Tower in Kensington & Chelsea. Both events carryimplications for housing policy that are discussed in this Briefing, albeit that their full impactswill take time to emerge.
Drawing on the latest statistics, the Briefing assesses the implications of new policy andmarket developments in thirteen key topic areas, together with dedicated pages on Scotland,Wales and Northern Ireland. Our final page provides a list of updated tables now available onthe Review’s website (www.ukhousingreview.org.uk).
Housing demand and supply
New housing supply continues to fall behind new household growth across Great Britain.Projecting future housing need is fraught with difficulty, even more so now that the Brexitvote seems to be having an early impact on migration levels. All of the UK administrationshave housing supply targets after elections this year, but none will be easily achieved. InEngland, annual supply remains some 30,000 short of the ‘break even’ point with householdgrowth. The Briefing argues that while supply is of critical importance, so is the rather moreneglected issue of affordability, in both the private and the social housing sectors.
Homeownership, affordability and mortgage access
The Westminster government has shifted slightly away from promoting homeownership as itsmain housing priority, but our reassessment of total housing investment up to 2020/21 stillshows support for the private market totalling some £32 billion, as against affordablehousing investment of £8 billion.
The Briefing looks at the other policy shifts towards homeownership and away from renting,but does not conclude that they yet show signs of any decisive alteration in tenure trends.
While government assistance schemes for homeownership undoubtedly help, the barriers to entering the market – though different from a decade ago – are still considerable.
Affordable rented housing
Scotland, Wales and Northern Ireland continue to put considerable emphasis in policies andin their budgets on the delivery of affordable housing, with Scotland in particular investingand delivering proportionately many more homes than England. The Scottish and Welshelections reinforced affordable housing targets; affordable housing provision in NorthernIreland though has been set back by the political crisis and budget changes.
In England, the government has given a modest boost to affordable housing investment.While output has increased, it is still a long way short of what is required to meet needs.
Homelessness
Following the early successes of a new and wider homelessness prevention policy in Wales,parallel provisions have now been legislated for in England and should start to take effectfrom 2018 onwards. While these changes are positive, many concerns remain abouthomelessness pressures, especially in London, and these are reinforced by analysis suggestingthere will be substantial increases in ‘core’ homelessness in years to come.
Welfare reform
One of the more immediate concerns about welfare reform policies is about the way the newlower ‘benefit cap’ has more than trebled (to nearly 70,000) the numbers affected. Thesehouseholds’ benefits are capped below the level of their scale-rate entitlements, with all thehardship that entails. Looking ahead there are also concerns about the impact of the localhousing allowance caps due to apply to social sector tenants, and in particular the effects onyounger, single people only entitled to the much lower ‘shared accommodation rate’.
■
In March next year the UK Housing Review 2018 will aim to provide a considered appraisal ofthe Westminster government’s housing and welfare policy changes, including any resultingfrom the Autumn Budget, as well as assessments of the latest policy developments inScotland, Wales and Northern Ireland.
Meanwhile, this edition of the Briefing has been compiled with the assistance of SuzanneFitzpatrick and Beth Watts (on homelessness), Tamsin Stirling (on Wales), Justin Cartwright(on Northern Ireland) and Paul Cosgrove (on the revised tables listed on page 20).
Steve Wilcox, John Perry, Mark Stephens and Peter Williams September 2017

4
The pattern of the UK’s economic performance in the aftermath of the global financialcrisis (GFC) is now well-established: employment growth has yet to restore earnings to
pre-downturn levels.
Since the outcome of the EU referendum in June 2016, the pound has fallen, puttingupward pressure on inflation, and the future is shrouded in uncertainty. As the Office forBudgetary Responsibility commented in March, ‘... there is no meaningful basis forpredicting the precise end-point of the [Brexit] negotiations as a basis for our forecast.’1
Mark Carney, governor of the Bank of England, has said that uncertainty ‘...weighs on thedecisions of businesses and households and holds down both demand and supply.’2
The OECD also attributed the slowing of the UK economy to ‘uncertainty about the Brexitnegotiations.’3 It charts the decline in real economic growth from 3.1 per cent in 2014 to ananticipated one per cent in 2018 – so the UK moves from outstripping the USA, OECD andeuro area to lagging behind them all. The Bank of England’s central forecast for the threeyears up to 2020 never has the growth rate reaching two per cent in any quarter until then.
Meanwhile monetary policy has continued to take the strain. The effect of sterling’sdevaluation has been to increase inflation, which the Bank of England expects to peak atthree per cent in October 2017 before returning to target. The Monetary Policy Committeehas so far not raised interest rates in response. In August its members voted 6-2 tomaintain the bank rate at the historic low of 0.25 per cent. However, with economicforecasts generally anticipating slowing growth rates, the MPC noted unanimously that anyfuture rate rises would ‘be at a gradual pace and to a limited extent.’5
UK economic management since 2010 has therefore relied on monetary policy – boththrough interest rates and quantitative easing (QE) – to maintain demand in the economy.The MPC introduced the Term Funding Scheme from September 2016 to encourage banksto pass on money at low interest rates to customers, and this continues to February 2018when it then tapers down. QE in general is designed to support asset prices, and thusinhibited the early ambitions of the coalition government to reorient the economy awayfrom relying on rising property prices – and in particular on house price inflation.
The UK economy is also weakened by the so-called ‘productivity puzzle.’ This describes theslow-down in the rate of productivity growth following the GFC. Whilst this has happenedacross the advanced economies, it is especially acute in the UK. By 2015, the UK’sproductivity was 15.2 per cent below pre-downturn trend, the largest gap in the G7 andtwice the average.6 Additionally, the ‘wage share’ has been falling in advanced economies,so labour market incomes have lagged behind the diminished rate of productivity growth.The ILO and other organisations report that this has been most acute in the USA,Germany and Japan, but has also occurred in the UK.7 According to provisional figuresreleased by ONS, in May real average earnings in the UK were 7.4 percentage points lowerthan the February 2008 peak.8
Whilst Brexit casts an extra shadow of uncertainty over the UK’s economic prospects,longer-standing structural problems in the labour market continue to depress disposableincomes and economic growth.
References1 Office for Budget Responsibility (2017) Economic and fiscal outlook, March, Cm 9419. London: OBR.
2 Quoted in Financial Times, ‘Carney warns Brexit uncertainty is weighing on UK economy’, 3 August 2017.
3 OECD (2017) United Kingdom – Economic forecast summary. Paris: OECD.
4 OBR (2017), op.cit., Table 1.2.
5 Bank of England (2017) Monetary Policy Summary, August. London: BoE.
6 ONS (2017) International comparisons of UK productivity (ICP), final estimates: 2015. London: ONS.
7 ILO, IMF, OECD, World Bank (2015) Income inequality and labour income share in G20 countries: Trends,Impacts, Causes. Paper prepared for G20 employment and finance ministers. Geneva: ILO.
8 ONS, op.cit.
Uncertain economic prospects
Whilst the government’s deficit (Public Sector Net Borrowing) is expected to fall belowthree per cent of GDP in 2017/18, total debt (Public Sector Net Debt) will continue to riseto 88.8 per cent of GDP.4 Nevertheless, the government has given some indication of beingprepared to soften its ‘austerity’ policy of fiscal consolidation. This could take the form ofeither extending the target date for deficit reduction or reducing expenditure cuts viahigher taxes. The policy of freezing working-age benefits at cash value for 2016-20 is likelyto come under scrutiny as inflation rises, as it squeezes the real incomes of low-incomehouseholds, although loosening the public sector pay cap might be a policy change moreattractive to the government's supporters. The DUP may also exercise influence over thedirection of policy. Any policy changes are likely to be announced in November – themonth to which the Budget has now been moved.
The UK’s declining growth rate3.5
3.0
2.5
2.0
1.5
1.0
0.5
0
Source: OECD Economic Outlook.
Gro
wth
rate
(per
cen
t)
2014 2015 2016 2017 2018
Euro area
UK
USOECD
5
August 2017 marked the tenth anniversary of the credit crunch, when uncertainty aboutthe veracity of US mortgage-backed securities caused the wholesale market to seize up
overnight. The credit crunch morphed into the Global Financial Crisis with the failure ofLehman Brothers in October 2008. As governments borrowed to rescue banks and stave offcatastrophe, a sovereign debt crisis arose in some countries as markets became reluctant tolend to heavily indebted governments. The negotiations over the formation of the 2010-15coalition government took place against the backdrop of the Greek sovereign debt crisis,which appears to have persuaded the Liberal Democrats to join the Conservatives inprioritising deficit reduction, arguing that the UK faced a similar fate unless it brought itspublic finances under control.
And so the policy of ‘austerity’ was born. An emergency budget in June 2010 made tax andspending decisions intended to restore the government’s financial health. Under the self-imposed ‘fiscal mandate’ the cyclical deficit was meant to disappear in 2015/16, and publicsector net debt was forecast to peak at 70.3 per cent in 2013/14 and fall thereafter.1 WhilstDepartmental Expenditure Limits would increase in line with inflation, there would be £83billion of cuts to Annually Managed Expenditure – which of course includes social security.
Things did not work out quite as planned, as economic growth fell below expectations andfiscal targets were missed. By the time of the 2011 Autumn Statement, some newspaperswere speculating about the end of austerity. They had little reason to do so. The AutumnStatement confirmed that ‘...the Government plans a total consolidation of £147 billion peryear by 2016-17, consisting of total reductions in spending of £116 billion and a netincrease in taxes of £31 billion.’2 Back in 2011/12 just over half the consolidation came inthe form of spending cuts and the rest from tax rises, but the contribution from expenditurecuts was forecast to rise to almost 80 per cent in 2016-17.3 So austerity was continuing andits impact was shifting towards lower-income households.
The pattern of missed fiscal targets has been repeated since 2011. The 2016 AutumnStatement once again confirmed that targets had been missed – this time due to insipid taxrevenues as well as lower economic growth. Now the government intended to ‘return thepublic finances to balance as soon as possible in the next Parliament, with an interimobjective of reducing the structural deficit to less than 2% of GDP.’4 Debt as a percentage of GDP, originally to have peaked at 70 per cent in 2013/14, was now forecast to peak at 90 per cent in 2017/18. The 2017 Budget also promised to ‘maintain discipline on publicspending.’5
Following June’s unexpected general election result, there was renewed speculation aboutausterity coming to an end. During the campaign, the Conservative Party faced the ignominyof having to retract key expenditure cuts proposed in its manifesto (means-testing winter fuel
payments and ending the ‘triple lock’ on state pensions). Even then the manifesto foresaw abalanced budget ‘by the middle of the next decade.’ Following the election the chancellorfuelled speculation when he said that the public was ‘weary’ of austerity.
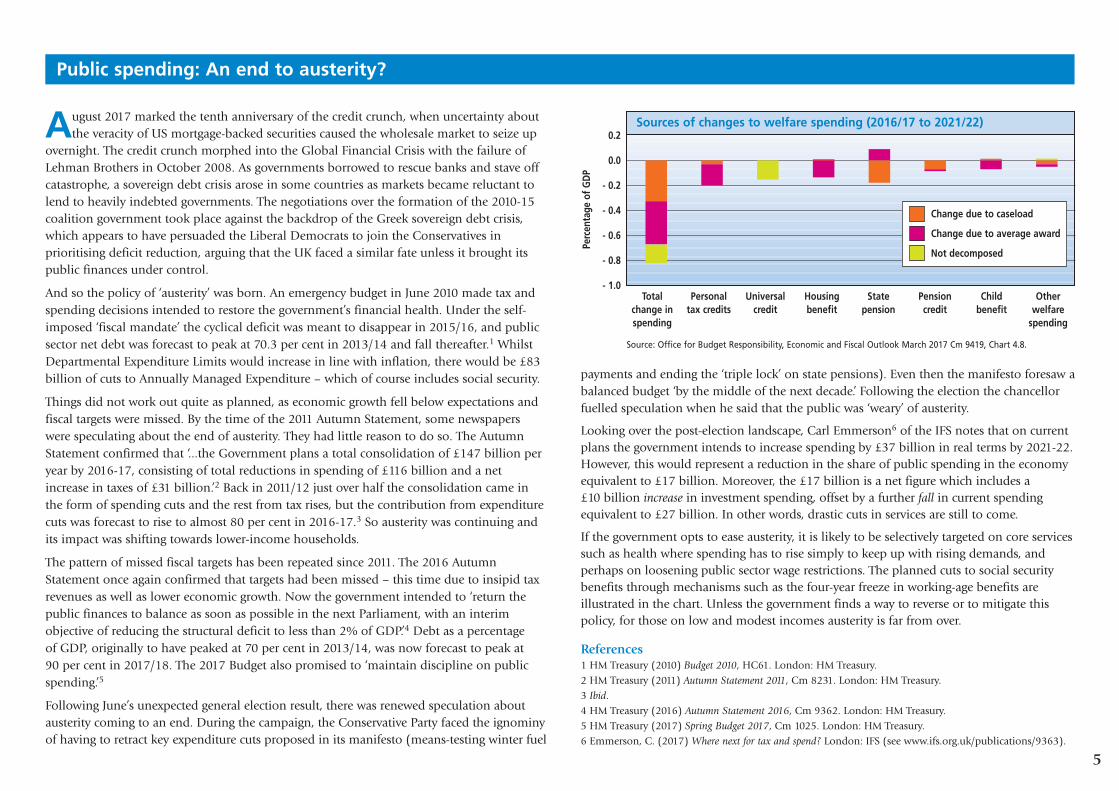
Looking over the post-election landscape, Carl Emmerson6 of the IFS notes that on currentplans the government intends to increase spending by £37 billion in real terms by 2021-22.However, this would represent a reduction in the share of public spending in the economyequivalent to £17 billion. Moreover, the £17 billion is a net figure which includes a £10 billion increase in investment spending, offset by a further fall in current spendingequivalent to £27 billion. In other words, drastic cuts in services are still to come.
If the government opts to ease austerity, it is likely to be selectively targeted on core servicessuch as health where spending has to rise simply to keep up with rising demands, andperhaps on loosening public sector wage restrictions. The planned cuts to social securitybenefits through mechanisms such as the four-year freeze in working-age benefits areillustrated in the chart. Unless the government finds a way to reverse or to mitigate thispolicy, for those on low and modest incomes austerity is far from over.
References1 HM Treasury (2010) Budget 2010, HC61. London: HM Treasury.2 HM Treasury (2011) Autumn Statement 2011, Cm 8231. London: HM Treasury.3 Ibid.4 HM Treasury (2016) Autumn Statement 2016, Cm 9362. London: HM Treasury.5 HM Treasury (2017) Spring Budget 2017, Cm 1025. London: HM Treasury.6 Emmerson, C. (2017) Where next for tax and spend? London: IFS (see www.ifs.org.uk/publications/9363).
Public spending: An end to austerity?
Sources of changes to welfare spending (2016/17 to 2021/22)0.2
0.0
- 0.2
- 0.4
- 0.6
- 0.8
- 1.0
Perc
enta
ge o
f GD
P
Source: Office for Budget Responsibility, Economic and Fiscal Outlook March 2017 Cm 9419, Chart 4.8.
Totalchange inspending
Personaltax credits
Universalcredit
Housingbenefit
Statepension
Pensioncredit
Childbenefit
Otherwelfare
spending
Change due to caseload
Change due to average award
Not decomposed

6
For a government already in difficulties following the failure to secure a clear majorityin the June General Election, the Grenfell Tower tragedy a week later compounded
their problems. Grenfell and its aftermath have huge implications for governmentspending: not only for the housing budget and the retreat from social housing provision,but also for the housing white paper and its priorities. Politics was refocussed and thoughGrenfell will slowly move out of the headlines the delays in helping residents, the on-going inquiry and huge public sympathy are likely to mean that it remains asignificant influence on policy and investment decisions.
The new housing minister Alok Sharma, MP (the 37th since AneurinBevan, see inside front cover) was plunged into the crisis andtargeted by Grenfell protesters for delays in providing permanenthousing. It is clear that not only Kensington & Chelsea butmany other social landlords across the UK expect governmentto fund replacement and other work in tower blocks now atrisk. It was already striking that February’s housing whitepaper contained no discussion of public investment andnow the issue looms large. Set in the context of Brexit andcontinuing (if perhaps slightly reduced) austerity, thisseems certain to cause considerable problems. If the extrawork needed receives no or insufficient governmentsupport, costs will fall on landlords’ rental incomes andwill inevitably displace other investment. If the governmentoffers support but without adding to the national pot, therewould be a similar effect but at national level. Only a new,specific grant or subsidy for post-Grenfell works will ensure theyare not done at the expense of other affordable housing investment.
The background is an ambitious government housing programme butwith the priorities largely those set by the previous chancellor, George Osborne.The pie chart summarises the current investment picture, updating the detailed version inthe UK Housing Review 2017 (page 80). It shows the overwhelming emphasis on supportfor the private market, taking 79% of the total. This shifted only slightly in favour ofaffordable housing in Philip Hammond’s Autumn Statement, despite its announcementof extra funding for new build at Affordable Rents.
So far, carrying forward the proposals in the white paper has been slow: consultationshave taken place and official responses issued, but as yet there have been few concretechanges. This may be the inevitable result of current pressures, with Brexit making hugedemands on the civil service, the aftermath of Grenfell being an understandable priority
for DCLG, the HCA and local authorities, and the general election both suspendingdetailed policy announcements and then resulting in a hung parliament, in which theprevious housing minister lost his seat.
While Gavin Barwell had begun to earn a reputation for being willing to widen thehousing agenda beyond the private housing market, the new minister has notsurprisingly begun by saying he will take ‘an opportunity over the summer to think
carefully’ about his brief. However, he added that ‘the start has to be buildingmore houses.’ While this again might be expected, it avoids two glaring
investment priorities which have to be taken on board (along withother post-Grenfell lessons like addressing failures in
communication between social landlords and tenants).
The first priority is the need for much greater investment in theexisting housing stock, an issue highlighted by the Grenfelltragedy. Not only has the Decent Homes Standard not beenupdated for a decade, but resources for keeping homes up tothe standard are being eroded and achievement of it isslipping. Social landlords are also failing to keep up withthe task of raising the energy efficiency of their homes andreducing fuel poverty among tenants, made more technicallychallenging post-Grenfell but still vital in meeting statutory
carbon emissions targets. Essentially, investment in theexisting social stock has been left for landlords to finance from
rents, while government has been cutting their rental income andwill continue to do so for another two years.
The second priority is more investment in genuinely affordablehousing, which appears to continue to take second place to increasing the
overall supply of housing, despite the fact that more than three million UKhouseholds now spend over a third of their income on housing costs. As the summaryon page 9 shows, affordable output via government programmes in England is running at half the levels of six years ago, with social rent output only a fraction of what it was then.
Overall government housing investment has grown considerably but the chart showsthat it is still seriously unbalanced. This does at least give the government the option – if it decides to take it – of making a significant increase in affordable investment byshifting resources away from private sector support, without necessarily having toincrease overall commitments to housing in the coming Budget.
Post-election housing blues?
Text
Support for private market 79%
Sharedownershipand affordablehomesprogramme£4.3 bn Other
programmes£4.3 bn
Otherprogrammes
£7.7 bn
Housinginfra-
structurefund
£2.3 bn
Helpto buy
mortgageguarantee
£2.3 bnPRS
guarantee£3.5 bn
Help to buyand Lifetime ISAs
£4.2 bn
Help to buyequity loans
£12.5 bn
Support for affordable housing21%

7
It has long been the case that net migration is the most volatile and difficult-to-forecastfactor in making household projections. The Brexit vote has now further complicated
the picture. The long-term outcome of the Brexit negotiations and the future regulatoryarrangements on migration to and from other EU countries (the EU27) are still unknown, but the vote and the resulting uncertainty are already having an impact onmigration flows.
In the last half of 2016 there was a very sharp drop in international net migration to theUK. In the year ending March 2017, migration was down by a quarter (to 246,000)compared to the year ending in March 2016 (when the rolling annual figures were virtuallyunchanged over the previous year). This implies that net migration fell about one-thirdbetween the quarter that ended with the Brexit vote and the quarter ending March 2017.
Not all of this can be directly related to Brexit uncertainties. Only two-thirds of the net fallin migration in the year ending March 2017 (compared to the previous year) relates toflows to/from the EU27. And only about half of the fall in net migration was work-related;over a quarter was study-related. Nonetheless concerns about the potential impact of Brexit,both on UK economic prospects and on the likely tightening of immigration rules, haveclearly played a part. And now they have been reinforced by slow economic growth in thefirst half of 2017, and a sharp fall in the value of the pound against the euro, furtheraffecting the attractiveness of the UK as a work destination.
The sharp fall in net EU migration is remarkable given that nothing has yet been settled,and when the indications are that any major change in the UK immigration regime may not take place for several years. However this sharp fall is actually broadly in line with theassumptions made in the 2014-based household projections. Further ahead there areinevitable questions about how much further it might decline, especially given that there arealready many sectors of the economy facing recruitment problems due to lower migration.
This uncertainty is a major headache for the production of the next round of populationand household projections. Both the severe economic and housing market dislocations ofthe last decade, and the significant but volatile contribution from net migration, make itimpossible to rely on past demographic trends from steadier times. However none of thisuncertainty provides any short-term basis for reducing current targets for house building inEngland, given the very substantial shortfall in dwellings against households (see page 8).
Another key question about the latest round of UK household projections is:1 how far werehousehold growth rates frustrated and slowed down by difficult housing market andeconomic conditions over the last decade? As a corollary, will growth rates resume in theevent of any economic and housing market recovery? – albeit that recovery now looks someway off given the impact of Brexit uncertainties (see page 4).
There has been a long-term trend towards smaller households and thus larger householdnumbers relative to the size of the population. This reflects a number of factors including arising proportion of older households, greater prosperity and rising levels of divorce andseparation. However, during the downturn the fall in ‘headship rates’ (the average numberof people in a household) drastically slowed: they are now higher than was anticipated inearlier rounds of projections. While the consensus is that headship rates will continue todecline, there is considerable uncertainty about how quickly this will happen. In Wales, forexample, the (latest) 2014 household projections show the headship rate gradually fallingfrom 2.29 in 2014 to 2.23 in 2024 and 2.19 in 2034.2 In contrast, in the last set ofhousehold projections based on pre-credit-crunch trends, the headship rate was projected to fall from 2.20 in 2008, to 2.10 in 2023 and 2.02 by 2033.
Even if housebuilding rates still need to rise in the short term, the reality is that in themedium and longer term two important drivers of household growth – migration andhousehold size – lie uncertainly beneath the shadow of Brexit.
References1 See Commentary Chapter 2 in the 2017 edition of the UK Housing Review for a further discussion ofhousehold projections across the UK.
2 Welsh Government (2017) Local Authority Household Projections (2014-based). Cardiff: Welsh Government.
Household growth under the shadow of Brexit
Factors underlying current projections of English household growth50
40
30
20
10
0
Perc
enta
ges
Source: DCLG: English 2014-based household projections.Note: Headship rates are the average number of people in a household.
Headship rates Migration Internal population growth
30.634.1 35.3

8
Successive housing ministers and indeed prime ministers have rooted England’s housingproblems in the failure of housing supply, rightly arguing that governments have
regularly fallen short in building enough homes to keep pace with growing householdnumbers. Taking vacants and second homes into account, there is a crude shortage ofaround 1.25 million homes. At the simplest level we can all agree that supply is crucial butthe reality is far more complex, as former minister Nick Raynsford argues cogently inSubstance not Spin.1
As we show in the chart, supply is rising but still lags behind overall demand based onprojected household growth. The government and most commentators now use the annualdata on net additions to measure supply, i.e. new completions minus demolitions plusconversions and changes of use. They appear more reliable than the quarterly housebuildingstatistics, which consistently underestimate output, triggering a DCLG review.2
Even if we can agree on the numbers being achieved, we have to ask ‘what is being suppliedand where?’ Across England the supply/demand imbalance varies greatly. In some areasoutput is close to what is needed and the big issue is improving the quality of the existingstock. Then there is the question of what is being built – it is not only a debate about socialversus private output but also where the new private supply is concentrated. Evidencesuggests it is increasingly focussed on the more affluent end of the market. And some of this may be driven in part by the purchasing power of overseas investors and schemes suchas Help to Buy.
We therefore cannot assume more supply is the sole answer to ‘the problem’. Indeed as theevidence to the Redfern Review from Oxford Economics reminds us, it is unlikely to bringhouse prices down except in the very long term and with sustained high output of newhomes relative to household growth.3 Even boosting (UK) housing supply to 310,000homes per annum in their model only brings a five per cent fall in the baseline forecast ofhouse prices. Oxford Economics says this has ‘important implications for a policy debatethat has focused heavily on supply as both the cause of the problem of high house pricesand its solution.’ Incomes and the cost and supply of credit are also key factors, and herethe constraints being imposed by mortgage regulation and a range of macro-prudentialcontrols from the Bank of England and elsewhere come into the equation.
Then of course there is the question of taxation, one revisited annually in the Review.Owners still experienced net tax benefits of the order of £32 billion in 2015/16 (see page16). Stamp duty has been or will be reformed across the UK and to a degree is now muchmore progressive. As it stands the absence of capital gains tax on the primary residence,alongside the absence of any tax on the imputed rental return on an owner-occupiedproperty, are two obvious areas where policy might shift. The council tax regime is anotherexample of a regressive tax which remains unreformed despite calls for a proper propertytax. And of course there is an unresolved debate on land-value tax. Recently thegovernment reduced the rate of capital gains tax (CGT) on all asset sales excludingresidential property, in effect penalising residential investment. In 2015 it also imposed anew CGT on the sale of UK residential property so it is paid by all non-residents on allvalues of property (but only on gains since April that year). What both indicate is ahardening of the tax agenda, and the market reaction and softening in house prices are inpart a result of the tougher tax regime.
As political pressure to fix a ‘broken’ housing market increases and as the limits of asupply-only agenda are exposed, so there may be more appetite to consider tax and subsidyreform. Clearly it carries huge political risks. With other issues dominating and no overallmajority it seems unlikely that the Whitehall government will go there, although in thedevolved administrations there is more appetite for reform. In the next decade, might wesee the mantra of ‘supply, supply and supply’ replaced by a policy that is both morecomprehensive and more sophisticated, and hence more effective?
References1 Raynsford, N. (2017) Substance not Spin – An insider’s view of success and failure in government. Bristol:Policy Press.2 See www.hbf.co.uk/media-centre/hbf-in-the-news/hbf-in-the-news-single-display-page/view/ghost-townsthe-true-level-of-housing-supply/3 Oxford Economics (2016) Forecasting UK House Prices and Home Ownership; A Report For The RedfernReview Into The Decline Of Home Ownership. London: Oxford Economics.
It’s supply, supply and supply – or is it?
English dwelling supply lags projected household growth240,000
220,000
200,000
180,000
160,000
140,000
120,000
100,000
80,000
60,000
Num
ber o
f dw
ellin
gs
Source: DCLG Annual net additions to supply statistics. These reveal much higher annual new build figures thanshown in the longstanding quarterly statistics. Other net additions are from conversions, change of use andother additions; net of demolitions.
2011/12 2012/13 2013/14 2014/15 2015/16
2014-based projected annual household growth
Other net additions
New build

9
Shifting policies and definitions are making it difficult to use the term ‘affordablehousing’ in a way which has a consistent meaning. While there used to be consensus
that any housing at significantly below market price was ‘affordable,’ rising house pricesand rents mean that a yardstick based on them (such as Affordable Rents being no morethan 80 per cent of market levels) may no longer deliver prices that lower-incomehouseholds can afford. Nor is there any longer the expectation that the difference will becovered by housing benefit. Some ‘affordable’ products, such as Starter Homes, are in anycase aimed at somewhat higher income groups.
part of Peabody) are deliberately cross-subsidising AR to keep it close to ‘formula’ or socialrent levels. Indeed, the GLA is now offering grant of £60,000 per unit for ‘LondonAffordable Rent’ schemes, which will have rents close to social rent levels. In effect theGLA’s new programme will force providers to choose between social and intermediaterents (now called ‘London Living Rents’, at 80 per cent of market levels), with the latteraimed at somewhat higher income groups. The GLA’s concern with affordability shouldproduce a more targeted output, especially given the higher grant and its prohibition onfurther conversion of existing social lettings to AR.
However, outside London, there is no such prohibition and the embargo on using grantfor social rent remains. AR tends to be set close to the maximum of 80 per cent of marketlevels, but in some regions such as Yorkshire and East Midlands this may not place them atlevels very much higher than social rents.3
There are wider concerns about the affordability even of social rents, whether set byassociations or by local authorities. The Review has shown that these have drifted upwardsfor the last decade as a proportion of average earnings. This drift will have been halted bythe four-year cut (of one per cent annually) in social rents imposed by government inApril 2016. But the main beneficiary of these cuts is the government’s welfare bill,4 withany benefit to working tenants being complicated by other changes taking place in thewelfare system.
In an economic context in which real incomes are stagnant (see page 4), the risks to theaffordability of social housing are considerable. The first is that sub-market supply isinsufficient in the first place. The second is that output from investment programmes andfrom ‘planning gain’ continues to shift away from lettings at genuinely affordable rents(although the policy shift in London is a positive sign here). The third is that social andAR rents resume their upward trajectory when the current cuts end in 2020/21. And thefourth is that welfare benefit changes – notably the imposition of local housing allowancecaps on social rent claims from 2019 – further undermine the support available to low-income tenants to pay their rent. The promised review of rents policy must surely both paystrong heed to affordability and take proper account of welfare benefit changes, as well asacknowledging the need for social landlords to have stable income streams to underpinnew investment.
References1 NHF (2017) How many homes did housing associations build in 2016/17? London: NHF.
2 See discussion in Commentary Chapter 2 of the Review in both the 2017 and 2016 editions.
3 See UK Housing Review 2017, Table 74d.
4 See Adam, S., Chandler, D., Hood, A. and Joyce, R. (2015) Social rents policy: choices and trade-offs. London: IFS.
England’s affordable housing supply: what does ‘affordable’ mean?
This means that the government’s affordable housing supply statistics for England have tobe treated with caution (see chart). The latest totals show that grant-funded new supply isrunning at about half the level it was six years ago, and that whereas two-thirds of the totalthen was let at social rents, that has now fallen to only four per cent. Three-quarters is nowat Affordable Rents (AR). New starts in 2016/17 (not shown) were more encouraging, atlevels higher than for the last two years.
A fuller picture needs to include homes produced without grant. Pending the availabilityof official figures (DCLG live table 1000), the NHF’s useful survey of main housingassociations suggests that total affordable supply delivered by associations (includingshared ownership) in 2016/17 was a higher 32,381, with 4,775 (15 per cent) being forsocial rent: the difference is due to most social rent output no longer being grant-aided.1
The total is less than half of the projected 80,000 units needed in England annually at sub-market prices.2 But it also raises the question of whether the output is itself ‘affordable’? InLondon, where the current average for AR new build rents is 56 per cent of market levels,there is considerable variation. Some housing associations (notably Family Mosaic, now
Affordable housing completions funded by the HCA and GLA60,000
50,000
40,000
30,000
20,000
10,000
0
Com
plet
ions
Source: DCLG Live Table 1012.
2010/11 2011/12 2012/13 2013/14 2014/15 2015/16 2016/17
Affordablehomeownership
Intermediate rent
Affordable Rent
Social rent

10
Trying to predict the future of homeownership and the housing market is now morechallenging than ever. Housing supply continues to lag behind effective demand (see
page 8). House prices have slowed though the picture is complexly varied across the UK.1
London’s price growth is easing, with the outer boroughs now more buoyant than centralLondon. The South and Midlands could see continued growth but there are still areasthat have not ‘caught up’, notably Northern Ireland.
Measures of affordability give contrasting views depending upon how they are calculated.ONS recently showed that 25 per cent of neighbourhoods in England and Wales wereinaccessible to prospective homeowners last year with average incomes lower than thecost of buying an entry-level property.2 However, based on dual-earner incomes,affordability has eased to a degree (see page 11) – reflecting falling mortgage rates. Ofcourse, affordability is no longer a complete measure of access to the market becauseborrowers fail stress tests and other checks.3
A significant proportion of first-time buyers (FTBs) rely on Help to Buy equity loans, stillavailable until 2021. With a five per cent deposit, they effectively allow the borrower toenter the market with a 75 per cent loan rather than pay a premium for a 95 per centone. Though FTB numbers remain below the long-term average, this market has grown –boosted by Help to Buy and the ‘bank of Mum and Dad’.4 The number of 95 per centmortgage packages on offer has recently topped 300, up from just six in June 2009, butstill well behind the 900 in June 2007 (see chart).5 Recent analysis of Bank of Englandstatistics suggests that there has been a 15 per cent increase in households taking outloans of 4.5 times income in the last 12 months.
These changes reflect a deeply competitive mortgage market where new and existingplayers have to ‘innovate’ to get market share. They may also show that the FinancialPolicy Committee’s macro-prudential rule – that the proportion of new mortgages withLTVs at or above 4.5 must be under 15 per cent of all loans – are impacting on somelenders, given that they will always impose their own buffer beneath this to ensurecompliance. With tighter affordability tests, the imposition of a three per cent stress test6
and closer scrutiny of incomes and outgoings it is a challenge to secure a high-LTV loan.As the Legal and General’s 2017 report makes clear,7 the proportion of buyers who expectto get help from family or friends in the future has been rising, up from a third in 2016to more than 40 per cent in 2017 with about half (48 per cent) of FTBs expecting to getsome help.
Recently there have been predictions of a major readjustment in house prices. Clearlythere is some downward pressure reflecting uncertainty and the costs of stamp duty andof moving, with sellers having to adjust prices or hold back from selling. This in turn hascreated opportunities for gazumping to return as sellers seek to capture what demandexists. However the fundamentals would suggest that, despite wage growth laggingbehind prices, any correction will be modest. With new instructions from existing ownersfalling, in some areas there will be competition but overall we are seeing transactionsdecline. A report on Missing Movers highlights the fact that before the downturn therewere about 1.6 million home sales in the UK, falling to 860,000 in 2009 and recoveringto 1.2 million in 2014, a level that has changed little since.8 This suggests we are ‘short of’an average of 400,000 transactions and most of these will be by mortgaged-movers.
This raises a myriad of questions about growing labour market/housing market frictionsand the extent to which the latter is holding back the former. There will be a growingnumber of households who are frustrated at the lacklustre housing market and, just aswith Generation Rent, will begin to feel the government is doing little to help.
References1 PwC (2017) UK Economic Outlook, July. London: PwC.
2 ONS (2017) Prospective home owners struggling to get onto property ladder, 24th February. Newport: ONS.
3 Typically borrowers still cite the cause as ‘affordability’, see DCLG (2017) English Housing Survey: Futurehome owners, 2015-16. London: DCLG.
4 Legal and General (2017) The Bank of Mum and Dad. London: L&G.
5 Which? (2017) ‘First-time buyers rejoice – 95 per cent mortgages are surging’, in Which?, 8th June.London: Consumers’ Association.
6 A test of ability to pay if interest rates were to be three per cent higher.
7 L&G, op.cit.
8 Hudson, N. & Green, B. (2017) Missing Movers- A long term decline in housing transactions? CML ResearchReport. London: CML (now UK Finance – www.ukfinance.org.uk/).
Home truths?
Low deposit mortgages for first-time buyers return to pre-deregulation levels80
70
60
50
40
30
20
10
0
Perc
enta
ges
Source: Council of Mortgage Lenders.
19791981
19831985
19871989
19911993
19951997
19992001
20032005
20072009
20112013
2015
95% and over
90 – 94%
High loan-to-value mortgages

11
Just when attention is focussed on the accessibility of the housing market to first-timebuyers (FTBs), there is a dearth of statistics. The ONS’s new mix-adjusted house price
series is much better than its predecessor, but sadly ONS no longer provide a specific seriesfor FTBs. The Halifax series is only now available commercially. This leaves the Nationwidemix-adjusted FTB house-price series as the only publically available tool for assessingchanges in affordability at this end of the market, not distorted by changes in the mix ofdwellings purchased over time.
Nationwide shows that while FTB house prices in London are now more than 60 per centhigher than they were in 2007 before the housing market crash, in other parts of the UKthe recovery has been far more modest. Indeed in the three northern regions of England,and in Scotland, Wales and Northern Ireland, house prices were still lower in 2016 thanthey were in 2007.
Across the UK as a whole, house-price-to-income ratios in 2016 had returned to 2007levels. However, once account is taken of the fall in interest rates over that period, mortgagecosts as a proportion of incomes can be seen (first chart) to have remained steady at2003/04 levels, albeit rather higher than earlier in the decade. It should be noted that thesefigures are measured against average working-household incomes, as a high proportion ofFTB households have dual incomes. Measures based solely on individual incomes havetheir uses but inevitably exaggerate the affordability barriers to homeownership.
The UK figures reflect to a degree the sharp rise in London house prices in recent years. Thesecond chart shows just how much the London picture differs from the rest of the UK. Inparticular it shows that it is only in London that mortgage-cost-to-income ratios havereturned to 2007 levels. In other parts of Great Britain these ratios have fallen back to onlya little above the levels prevailing early in the new millennium.
The story in Northern Ireland is rather different as the very sharp spike in mortgage-cost-to-income ratios in 2007 reflected the way house prices there trebled between 2001 and 2007,and then collapsed far more than in other parts of the UK. Indeed house prices in NorthernIreland in 2006 were barely 60 per cent of their 2007 levels. In this the Northern Irelandhousing market was clearly more influenced by the similarly volatile market south of itsborder, rather than movements elsewhere in the UK.
In 2017 there are indications that London house prices are beginning to fall, and clearly thesqueeze on real incomes and anxieties about post-Brexit economic prospects are a factor.Such uncertainty is likely to keep interest rates low for a while yet, but eventually they mustbe expected to rise from their current exceptionally low levels. This should act as a furthercheck on future house-price growth.
How affordable is the market for first-time buyers?
Housing market affordability in the UK4.0
3.5
3.0
2.5
2.0
1.5
1.0
0.5
0.0
40
35
30
25
20
15
10
5
0
Ratio
s
Perc
enta
ges
Source: Nationwide FTB house prices; Living Costs and Food Survey Working-Household Incomes.
Mortgage-cost-to-incomes(right-hand scale)
House-price-to-incomes (left-hand scale)
19941995
19961997
19981999
20002001
20022003
20042005
20062007
20082009
20102011
20122013
20142015
2016
19941995
19961997
19981999
20002001
20022003
20042005
20062007
20082009
20102011
20122013
20142015
2016
Regional mortgage-cost-to-income ratios35.0
30.0
25.0
20.0
15.0
10.0
5.0
0.0
Ratio
s
Source: Nationwide FTB house prices; Living Costs and Food Survey Working-Household Incomes.Note: Shows selected regions and countries, partly for clarity and partly because the Nationwide series does notprovide figures for England or the South East. It provides data for standard statistical regions whereas householdincome data used by the UK Housing Review are for government office regions.
London South West West Midlands Northern Ireland
Yorks & The Humber Wales Scotland

12
The recent sharp rise in levels of court orders for possession against private tenants, anda similar rise in the levels of homelessness resulting from the ending of assured
shorthold tenancies (ASTs) have focused attention on the very limited security of tenureprovided to private tenants.
It should be mentioned that court orders and AST homelessness relate only to a smallproportion of tenancies that end in any year – nearly four-fifths end voluntarily. Just over afifth can be said to result from landlord pressure, the most common reason being thedesire to sell the property.1
18,750 households were accepted as homeless in England in 2016 as a result of ASTsending, almost one-third of all statutory homelessness cases. This is a remarkable fourfoldincrease since 2009, although today’s level is only slightly higher than in 2001. Indeed overthat longer period homelessness due to the ending of ASTs has declined relative to theoverall size of the sector, although a fuller reckoning also needs to take account of localauthorities’ homelessness prevention activities.
Similarly, PRS court orders rose from just under 27,000 in 2009 to nearly 46,000 in 2015,before easing back to just over 43,000 in 2016. But again the 2009 level was a bit of a post-credit-crunch dip and, over the whole period from the millennium, court order numbershave risen roughly in line with growth in the size of the PRS (see chart).
The Cambridge Centre for Housing and Planning Research has recently examinedpossession claims in the PRS in some detail.2 They show that the growth rate of acceleratedactions through section 21 claims is fastest in London, the East and South East, with
virtually no growth in the rest of England; four out five claims occur in the three worst-affected regions. This mirrors the UK Housing Review breakdown of homelessnesstrends, which also shows acceptances increasingly sharply in London and slightly less in therest of the South, with only small increases in the Midlands and North. This can be related to the greater impact in London and the south of welfare policies bearing down on eligiblerents for housing benefit in the PRS, both through the ‘caps’ and the failure to increase LHA rates in line with market changes (see page 15).
The ending of tenancies through accelerated procedures is, however, just one expression ofprivate tenants’ lack of security. It also puts tenants at a negotiating disadvantage, whether in respect of rents or requiring landlords to undertake repairs or meet other obligations.Indeed the Cambridge report cites cases where landlord evictions followed tenants makingcomplaints about disrepair.
When the current tenancy regime was introduced in 1989 it reflected concerns aboutproviding terms that could restore investor confidence and grow the sector, following its longdecline (see page 13). Nearly three decades on, with the sector having nearly tripled in size, t is reasonable to ask whether that regime is still appropriate. Indeed Scotland has alreadydecided to change, and from this December all new private tenancies will have extra securitywith the abolition of ‘no cause’ evictions. But alongside the usual grounds for possession i.e. rent arrears) landlords will still be able to regain possession if they intend to sell.
Similar provisions form part of the long-standing security of tenure in the PRS in Germany.This has not been detrimental to investment in the sector, which accounts for half of allhousing provision. More recently (2004) Ireland introduced a four-year period of security of tenure, following the initial six months of a tenancy, during which landlords can onlyobtain possession if they show good cause. Again a provision allows landlords to obtainpossession if they wish to sell the property. This legal regime is backed by a regulatory regime(a ‘Residential Tenancies Board’). While there are indications that some landlords are leaving the sector, this may relate to tax changes, as overall the sector has grownsignificantly since 2006.3
With Scotland taking the lead it is open to the other UK countries to consider reforms that would not only improve the experience and quality of the PRS offer for the –predominantly younger – households in the sector, but also enhance the sector’s reputation.
References1 DCLG (2017) English Housing Survey: Private rented sector 2015-16. London: DCLG.
2 Clarke, A., Hamilton, C., Jones, M. and Muir, K. (2017) Poverty, evictions and forced moves. York: JRF.
3 Moore, T. and Dunning, R. (2017) Regulation of the private rented sector in England using lessons from Ireland.York: JRF.
Private rented sector insecurity – how big a factor in homelessness?
Sharp rise in PRS court orders in England post 200950,000
45,000
40,000
35,000
30,000
25,000
20,000
15,000
10,000
5,000
0
5.0
4.5
4.0
3.5
3.0
2.5
2.0
1.5
1.0
0.5
0.0
No.
of c
ourt
ord
ers
Dw
ellin
gs (m
illio
ns)
Sources: Ministry of Justice; UK Housing Review Table 17. Note: The great majority of accelerated orders relate to private renting.
20002001
20022003
20042005
20062007
20082009
20102011
20122013
20142015
2016
Accelerated orders
Private landlord orders
PRS sector size (right hand scale)
13
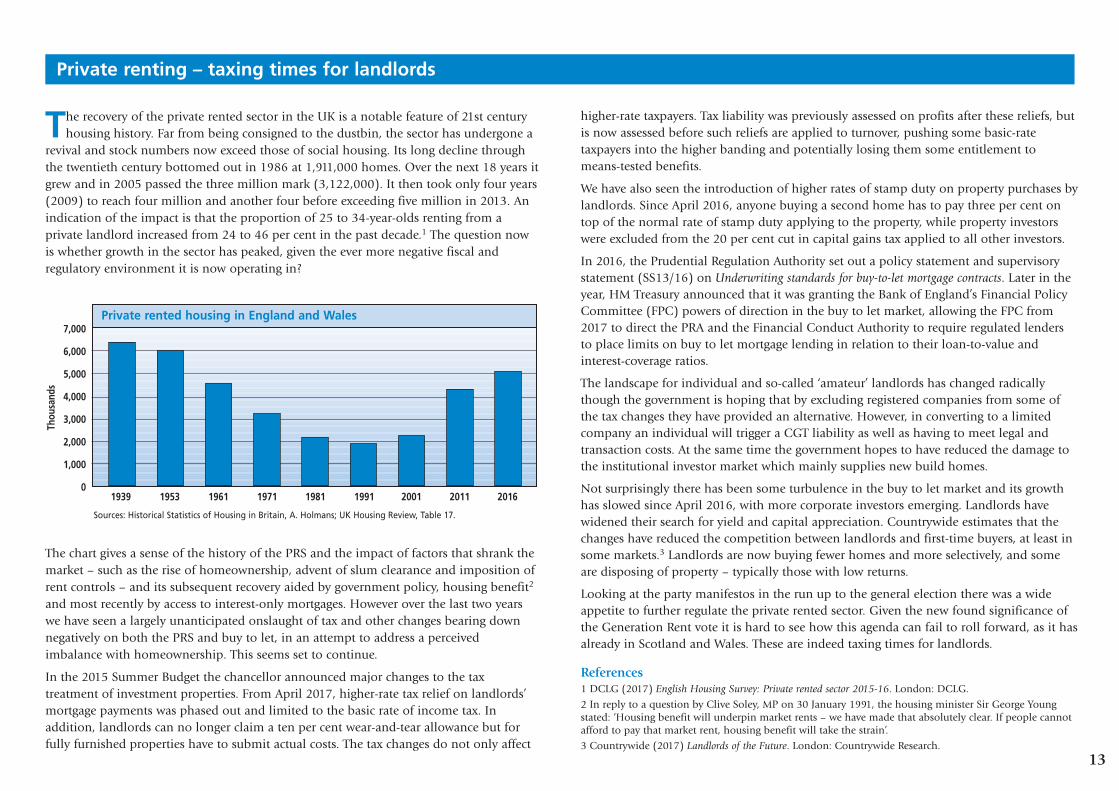
The recovery of the private rented sector in the UK is a notable feature of 21st centuryhousing history. Far from being consigned to the dustbin, the sector has undergone a
revival and stock numbers now exceed those of social housing. Its long decline throughthe twentieth century bottomed out in 1986 at 1,911,000 homes. Over the next 18 years itgrew and in 2005 passed the three million mark (3,122,000). It then took only four years(2009) to reach four million and another four before exceeding five million in 2013. Anindication of the impact is that the proportion of 25 to 34-year-olds renting from aprivate landlord increased from 24 to 46 per cent in the past decade.1 The question nowis whether growth in the sector has peaked, given the ever more negative fiscal andregulatory environment it is now operating in?
higher-rate taxpayers. Tax liability was previously assessed on profits after these reliefs, butis now assessed before such reliefs are applied to turnover, pushing some basic-ratetaxpayers into the higher banding and potentially losing them some entitlement tomeans-tested benefits.
We have also seen the introduction of higher rates of stamp duty on property purchases bylandlords. Since April 2016, anyone buying a second home has to pay three per cent ontop of the normal rate of stamp duty applying to the property, while property investorswere excluded from the 20 per cent cut in capital gains tax applied to all other investors.
In 2016, the Prudential Regulation Authority set out a policy statement and supervisorystatement (SS13/16) on Underwriting standards for buy-to-let mortgage contracts. Later in theyear, HM Treasury announced that it was granting the Bank of England’s Financial PolicyCommittee (FPC) powers of direction in the buy to let market, allowing the FPC from2017 to direct the PRA and the Financial Conduct Authority to require regulated lendersto place limits on buy to let mortgage lending in relation to their loan-to-value andinterest-coverage ratios.
The landscape for individual and so-called ‘amateur’ landlords has changed radicallythough the government is hoping that by excluding registered companies from some ofthe tax changes they have provided an alternative. However, in converting to a limitedcompany an individual will trigger a CGT liability as well as having to meet legal andtransaction costs. At the same time the government hopes to have reduced the damage tothe institutional investor market which mainly supplies new build homes.
Not surprisingly there has been some turbulence in the buy to let market and its growthhas slowed since April 2016, with more corporate investors emerging. Landlords havewidened their search for yield and capital appreciation. Countrywide estimates that thechanges have reduced the competition between landlords and first-time buyers, at least insome markets.3 Landlords are now buying fewer homes and more selectively, and someare disposing of property – typically those with low returns.
Looking at the party manifestos in the run up to the general election there was a wideappetite to further regulate the private rented sector. Given the new found significance ofthe Generation Rent vote it is hard to see how this agenda can fail to roll forward, as it hasalready in Scotland and Wales. These are indeed taxing times for landlords.
References1 DCLG (2017) English Housing Survey: Private rented sector 2015-16. London: DCLG.
2 In reply to a question by Clive Soley, MP on 30 January 1991, the housing minister Sir George Youngstated: ‘Housing benefit will underpin market rents – we have made that absolutely clear. If people cannotafford to pay that market rent, housing benefit will take the strain’.
3 Countrywide (2017) Landlords of the Future. London: Countrywide Research.
Private renting – taxing times for landlords
The chart gives a sense of the history of the PRS and the impact of factors that shrank themarket – such as the rise of homeownership, advent of slum clearance and imposition ofrent controls – and its subsequent recovery aided by government policy, housing benefit2
and most recently by access to interest-only mortgages. However over the last two yearswe have seen a largely unanticipated onslaught of tax and other changes bearing downnegatively on both the PRS and buy to let, in an attempt to address a perceivedimbalance with homeownership. This seems set to continue.
In the 2015 Summer Budget the chancellor announced major changes to the taxtreatment of investment properties. From April 2017, higher-rate tax relief on landlords’mortgage payments was phased out and limited to the basic rate of income tax. Inaddition, landlords can no longer claim a ten per cent wear-and-tear allowance but forfully furnished properties have to submit actual costs. The tax changes do not only affect
Private rented housing in England and Wales 7,000
6,000
5,000
4,000
3,000
2,000
1,000
0
Sources: Historical Statistics of Housing in Britain, A. Holmans; UK Housing Review, Table 17.
Thou
sand
s
1939 1953 1961 1971 1981 1991 2001 2011 2016

14
Statutory homelessness acceptances have been growing in England since 2010, albeit thatthe rate of increase has significantly slowed. Homelessness acceptances had also been
rising in Northern Ireland, but fell in 2016. As a result of policy changes, there have beenrecent falls in formal homelessness acceptances in Scotland and Wales, though that patternhas now stabilised in Scotland and may have started to reverse in Wales (see chart).
Levels of rough sleeping appear to be rising in Wales,6 as well as in Scotland. In Glasgowa Rough Sleeping Taskforce has been established and there have been hints of action inthe Scottish Government’s next Programme for Government.
In Northern Ireland, statutory homelessness is relatively high because the homelessness‘route’ is regularly used to rehouse older people no longer able to maintain a familyhome. Statutory homelessness figures in the first quarter of 2017 were significantly higherthan in the same quarter in 2016, though this may turn out to be a statistical anomaly asoverall trends continue downward. Northern Ireland has had a rolling sequence ofnational homelessness strategies in place since 2002, with the latest published in April2017. The previous strategy was said to be ‘widely perceived as moving homelessnesspolicy in the right directions... [but] Gaps remained in service provision and progress indelivering the Strategy had not always been rapid, including the development ofpreventative services.’ 7
New statistical modelling for Crisis by Glen Bramley predicts that levels of ‘core’homelessness will continue to rise in the medium term in Great Britain, with thepossibility of a slight levelling-off in the short term due to housing market correctionsand a favourable labour market.8 In the longer term it is likely that numbers will increasefurther, particularly in London, with greater use of unsuitable temporary accommodationas well as rough sleeping and sofa-surfing. Drivers include the availability of affordableaccommodation, the extent to which prevention measures are used, and thedemographics of people experiencing homelessness. But the most important driver ofhomelessness in all its forms is poverty.9
References1 Crisis (2016) The Homelessness Legislation: An independent review of the legal duties owed to homeless people.London: Crisis. 2 Dobie, S., Sanders, B., & Teixeira, L. (2014) Turned Away: The treatment of single homeless people by localauthority homelessness services in England. London: Crisis; Mackie, P. & Thomas, I. (2014) Nations Apart?Experiences of Single Homeless People across Great Britain. London: Crisis.3 Fitzpatrick, S. & Pawson, H. (2016) ‘Fifty years since Cathy Come Home: critical reflections on the UKhomelessness safety net’, in International Journal of Housing Policy, 16(4): 543-555.4 Mackie, P.K., Thomas, I. and Bibbings, J. (2017) ‘Homelessness prevention: reflecting on a year ofpioneering Welsh legislation in practice’, in European Journal of Homelessness, 11(1): 81-107.5 See http://gov.wales/docs/caecd/research/2017/170808-post-implementation-evaluation-homelessness-legislation-interim-summary-en.pdf6 Welsh Government (2017) National Rough Sleeper Count, November 2016 – Experimental Statistics. Cardiff:Welsh Government. 7 See www.nihe.gov.uk/homelessness_strategy_evaluation.pdf; see also Fitzpatrick, S. et al (2016)Homelessness Monitor Northern Ireland. London: Crisis.8 Bramley, G. (2017) Homelessness projections: Core homelessness in Great Britain. London: Crisis.9 See also Bramley, G. & Fitzpatrick, S. (2017) ‘Homelessness in the UK: Who is most at risk?’ in HousingStudies, 1-21. DOI: 10.1080/02673037.2017.1344957
Homelessness – can prevention work have a lasting impact?
The big policy story on homelessness in England is the passing of the HomelessnessReduction Act 2017, based on recommendations from an independent panel convened byCrisis.1 The panel focused on the distinction between ‘priority’ and ‘non-priority’ groups,which results in most single homeless people only receiving advice and assistance.Research has consistently demonstrated that this support is often very poor.2 While inScotland the priority need criterion has now been abolished, so that virtually allhomeless people are entitled to rehousing, this was judged unviable in England’s morepressured housing market.3
The panel instead recommended the approach encapsulated in the Housing (Wales) Act(2014): more robust homelessness prevention and relief duties owed to all eligiblehouseholds, regardless of priority need status.4 Its key proposals were incorporated into aprivate members bill, and gained the government’s backing together with £61 milliontowards its implementation, which is likely to begin in 2018.
An interim evaluation of the 2014 homelessness legislation in Wales found stakeholders‘overwhelmingly positive’ about its impact,5 and the 2016/17 official statistics indicatedhigh levels of success with both prevention (62 per cent) and relief (41 per cent)interventions. The number of priority-need households assisted under the full duty iscorrespondingly much lower now in Wales than statutory homeless ‘acceptance’ levelsunder the pre-2015 system, although it has risen somewhat in the most recent year.
Homelessness acceptances 2005-2016140
120
100
80
60
40
20
0
Source: Official homelessness statistics from the four administrations.
Inde
x of
hom
eles
snes
sac
cept
ance
s (2
005=
100)
2005 2006 2007 2008 2009 2010 2011 2012 2013 2014 2015 2016
England
Wales
Northern Ireland
Scotland

15
The welfare reforms made by the coalition and Conservative governments continue toroll out across Great Britain, presenting ever greater challenges both to claimants and
to the social landlords trying to assist low-income households. The most immediate newchallenge is the sharp cut in the maximum benefit cap, applied to out-of-work householdsbelow pension age, but other tests are also in train.
Introduced in November 2016, the benefit cap has already seen more than a trebling inthe numbers whose benefit is restricted (now totalling over 68,000 households – seechart). The greatest numbers affected are in London, reflecting the higher housing costs inthe capital. But proportionately the increases have been greater in other parts of thecountry, as the lower caps impact to a much greater extent on larger households, even inareas with relatively low housing costs. The cap is now also affecting smaller families, withalmost half of all cases involving lone parents with a child no more than three years old.
current UC figures. A clearer picture will emerge as the September UC statistics will include,for the first time, a tenure breakdown.
A survey undertaken for Crisis clearly indicates the difficulties being experienced by low-income households in accessing the PRS, which continue to deepen.3 This evidence isunderlined by the sharp increase in numbers of homeless acceptances that result from theending of a PRS assured shorthold tenancy, along with the decline in the extent to whichhomeless prevention action enables households to retain their tenancies (see page 12).
Looking ahead, there are also major concerns about the proposal to extend the LHA limitsto social sector tenants from April 2019. This policy is to be phased in, but will apply to allUC cases, and also to housing benefit cases where tenancies commenced – or have beenrenewed – after March 2016. There has been considerable debate about the provisions toexempt supported housing from this regime, but its impact goes far wider than this,especially in those areas (the north of England and parts of Scotland and Wales) wheresocial sector rents are not far below market levels.
In England it has been found that only in a small number of areas is there any overlapbetween council rents and LHA rates, but with housing association rents there are overlapsin almost two-fifths of local authority areas. Within those figures, more detailed analysisindicates that by far the biggest effects will be on single people aged under 35, soon eligibleonly for the lower SAR rather than the much higher one-bedroom LHA rate.4
Across Great Britain as a whole it is estimated that the SAR-based caps will impact on closeto 50,000 young single people in the social sector. This will put pressure on social landlordsto consider the retrograde step of providing shared accommodation for young single people,however inappropriate, and which is often problematic in terms of the more intensivemanagement such tenancies require, with their faster turnover and hence higher costs.
These new challenges come, of course, on top of those resulting from other, ongoing welfarereforms that already affect low-income tenants and social landlords. These wider reforms areconsidered in more detail in the UK Housing Review 2017 and will continue to be assessed infuture editions.
References1 Savills (2017) Impact of the LHA Freeze. London: Savills Research.
2 See Wilcox, S. (2017) ‘Another turn of the screw: the further effects of welfare reforms’, in Wilcox et al, UK Housing Review 2017. Coventry: CIH.
3 Reeve, K., Cole, I., Batty, B., Foden, N., Green, S. and Pattison, B. (2016) Home: No less will do; Homelesspeople’s access to the private rented sector. London: Sheffield Hallam University and Crisis.
4 Wilson, W. and Barton, C. (2017) Local Housing Allowance caps and the social rented sector. London: Houseof Commons Library.
The unfolding welfare reform challenges
While less dramatic, other welfare cuts continue to deepen, with the freeze (until 2020) onlocal housing allowance (LHA) rates for private tenants already seeing LHA fall furtherbelow average market levels. A recent analysis by Savills found that in some two-fifths to ahalf of all areas, LHA rates are now more than ten per cent lower than the ‘30th percentile’rates at which they were set in 2011.1
Previous analyses of DWP statistics clearly showed the impact of the LHA limits inreducing the numbers of housing benefit claimants able to secure tenancies in innerLondon, and in particular the impact on young single people (aged under 35) subject tothe much lower shared accommodation rate (SAR).2 However it is difficult to assess thoseimpacts as more and more claimants are moved on to universal credit (UC). As a resultthey no longer feature in the housing benefit statistics, nor can they be identified in the
Sharp rise in the numbers of households caught by the benefit cap18,00016,00014,00012,00010,0008,0006,0004,0002,000
0
No.
of h
ouse
hold
s
Source: DWP benefit cap statistics
North North Yorks & The East West East London South South Wales Scotland East West Humber Midlands Midlands East West
May 2017October 2016

16
Housing tax provisions are complex. Not only do they vary between and withintenures, but they also impact very differently on younger and older households.
Recognition that Britain’s acute housing market problems cannot be dealt with simply byincreasing supply (see page 8) has focused attention on the tax issues that inflate anddistort housing demand: this raises some prospect of reform. If it were to happen, a keydimension would be to look at the way taxes affect different age groups.
The two primary tax reliefs for homeowners are the absence of capital gains tax (CGT) onthe primary residence, and the absence of any tax on the ‘use value’ of owners living inthe home they own. The latter (originally known as Schedule A tax) was abolished in theUK over 50 years ago. Logically, mortgage interest tax relief (MITR) existed to provide anoffset to Schedule A tax, but it lingered on for homeowners for a further 35 years. Whilehistorically the valuations on which Schedule A tax was levied had been allowed to fallwell below market values, at full value it would raise significant sums – even after anyoffsetting tax relief.
inflated house prices, further benefitting established owners but increasing the ‘entryprice’ for new first-time buyers.
CGT relief helps those who have been owners for a long period, and in particular thosewhose ownership dates from before the sharp rise in house prices over the decade to2007. It is also of greater benefit to those who bought more expensive homes.
The absence of a use-value tax also benefits established owners, either those who havepaid off their mortgage or have seen it shrink to a small proportion of their home’scurrent value. In their case they would be liable to the tax without any, or any significant,MITR offset. In contrast first-time buyers would rarely pay any use-value tax if it existed,as in their case MITR would likely offset their gross tax liability in full.
There are, of course, some taxes that relate to property values. Inheritance tax doescapture some of the housing wealth accumulated by homeowners over a lifetime – butonly to a very modest degree. In 2015/16 the value of inheritance tax based on housingwealth was just £1.7 billion. Stamp duty also reflects property values – and is moresignificant in that it raised £7.5 billion in 2015/16 – but this is still significantly belowthe amount that would be raised by CGT. It also has the disadvantage that it is not anincentive to mobility because it is levied every time someone moves, and is more of aburden to frequent movers. This anomaly would be removed by CGT.
The other tax that is, at least in part, related to property values is council tax. However thelimited council tax property value bands, and the differentials in the tax rates appliedwithin each band, both serve to make the tax a regressive one and have more impact onthose in lower-value dwellings. Nor is it based on ownership – it applies equally toprivate and social sector tenants, as well as to homeowners. Moreover, the way thatcentral government’s financial support to local government is structured also softens theimpact of the council tax in higher-value areas. For all these reasons council tax should beseen as something of a flawed hybrid, rather than as a property tax as such.
Property taxes are, of course, highly sensitive. Longstanding and authoritative critiques ofthe existing arrangements have so far borne little fruit. At best the recent flurry of stampduty reforms have made the tax a little more progressive and have removed the anomaliescreated by its old ‘slab’ structure, but its differential impact on frequent movers still exists.
However gradual, a move towards CGT and use-value taxes, with reduced reliance onstamp duty and council tax, would be a step towards a property tax regime morecoherently related to property values. It would also be a step towards a tax system morebalanced in its impact on younger compared with older households.
Housing, taxation and the generations
The sums involved are considerable. Taken together and even after making provisionfor ‘rollover relief’ for CGT, and for MITR against a use-value tax, these two homeownertax reliefs were together worth more than £35 billion in 2015/16 (see chart). Bothbenefit established homeowners rather than recent or would-be first-time buyers.Moreover such is the extent of the tax benefits they are to some degree reflected in
Value of homeowner tax reliefs25
20
15
10
7
0
£ bi
llion
s
Source : UK Housing Review 2017 (updated). Capital gains tax (CGT) is shown net of a 40% provision for ‘rolloverrelief’; use value tax is shown net of provision for offsetting mortgage-interest tax relief.
2012/13 2013/14 2014/15 2015/16
Use-value tax reliefCapital gains tax relief

17
As the Review has consistently pointed out, Scotland’s housing policy is now clearlydiverging from that of the UK government. For example, the right to buy in Scotland
has ended with remarkably little fuss, and an affordable housebuilding target for the newparliament is now in place. Reforms in the private rented sector are in hand, includingambitious energy-efficiency standards, and are discussed here.
House prices in Scotland returned to their 2007 peak in April 2017, and moved above itin May.1 The annual increase was 3.5 per cent to May 2017, compared to 4.7 per cent forthe UK as a whole. Nonetheless, the housing market generally has shown signs ofweakening. Sales fell by 17 per cent in the year to March 2017, although this decrease wasthe smallest among the UK’s four nations. Private construction has slowed: starts fell byfive per cent in 2016.2 Across the country as a whole, completions are above projectedhousehold growth to 2037, but there were deficits in Glasgow, Edinburgh and Aberdeen.3
The Scottish Government is committed to delivering 50,000 units of affordable housingover the 2016-21 parliament. Within this, 35,000 homes will be social rented. There was amarked upswing in social sector starts in 2016/17, to 6,332, the highest recorded in thepost-devolution era.4 Overall there were 9,308 affordable starts in 2016/17 which is closeto the overall affordable target, albeit that the balance needs to shift towards socialrenting.5 In June, local authorities were given funding allocations for the next three years,in part to improve their ability to deliver the affordable homes target.6
Tenants will also be able to refer proposed rent increases to a rent officer, and the act alsomakes provision for ‘rent pressure zones’ where rents are rising too quickly, are causingtenants difficulties or are increasing pressure on the local authority to provide morehousing or to subsidise housing costs. Edinburgh has already started to make the case forone. If ministers agree to such zones, rent increases on existing tenancies will be cappedfor a maximum of five years, with the cap set at no lower than CPI +1 per cent.
Meanwhile, a Scottish Government consultation on minimum energy-efficiency standardsin the PRS took place between April and June. New tenancies would be required to meetEPC band E from April 2019, and all PRS lettings would have to meet it by 2022.7 Itenvisages the standard being raised to EPC band D for new tenancies from 2022 and forall private tenancies by 2025. It is estimated that some 30,000 dwellings will be affectedby the initial requirement and a further 95,000 to reach the higher standard.8 Sub-standard properties are associated with lack of a mains gas boiler and older detacheddwellings with stone walls, both of which are prevalent in rural areas. The consultationalso sought views on a possible upper limit on the cost of improvements, as well as lowerenergy standards being required in properties where they are technically or legallydifficult to achieve (e.g. listed buildings).
Finally, the Scottish Government’s Rent Income Guarantee Scheme is still beingdeveloped in an effort to support the build to rent sector, which has been slower to takeoff than in England. The government believes that it will help to support thedevelopment of some 2,500 properties and generate £500 million of investment. Thegovernment’s maximum exposure is ten per cent of rental income, and this forms thebasis of the contingent liability of £15 million.9
References1 ONS House Price Index.
2 Rettie Housing Market Bulletin, July 2017 (see www.rettie.co.uk).
3 Ibid.
4 Scottish Government Social Sector New Build Statistics.
5 Scottish Government Affordable Housing Supply Tables.
6 Scottish Government (2017) £1.75 billion boost for investment in affordable housing, press release, 13 June.Edinburgh: Scottish Government.
7 Scottish Government (2017) Energy efficiency and condition standards in private rented housing: A Scotlandenergy efficiency programme consultation. Edinburgh: Scottish Government. ‘EPC’ means ‘Energy PerformanceCertificates’ and the bands range from ‘G’ (very poor) to ‘A’ (highly efficient).
8 Centre for Housing Market Analysis (2017) Scottish Housing Market Review, Q2. Edinburgh: ScottishGovernment.
9 Scottish Government (2017) Rental Income Guarantee Scheme, Build-to-Rent Programme: FOI release, 1 August. Edinburgh: Scottish Government.
Scotland leads on private rented sector reform
The Private Housing (Tenancies) (Scotland) Act 2016 marks the most significant reformof private renting in more than a quarter of a century and is expected to come into forcein December 2017. New PRS tenancies will be open-ended and significantly more securethrough the virtual ending of ‘no fault’ evictions (see page 12).
Scotland’s affordable housing programme (approvals)6,000
5,000
4,000
3,000
2,000
1,000
0
App
rova
ls
Scottish Government Affordable Housing Supply Tables.
Q12014
Q22014
Q32014
Q42014
Q12015
Q22015
Q32015
Q42015
Q12016
Q22016
Q32016
Q42016
Q12017
Affordable homeownership
Affordable rent
Social rent

18
Differences between the UK government’s housing policies and those emerging in Walescontinue to grow. Two substantial pieces of housing legislation were passed during the
fourth term of the Welsh Government: the Housing (Wales) Act 2014 and the RentingHomes (Wales) Act 2016, which have significantly changed the housing landscape.
The first year of a new government term has seen legislation heralding the abolition ofboth the right to buy and the right to acquire.1 Five authorities, including Cardiff, havealready taken advantage of powers in the Housing (Wales) Measure 2011 to apply tosuspend the right to buy in their areas in order to ‘protect social housing assets’. However,as the chart shows, without extra incentives such as those added to right to buy in Englandin 2012, sales are already running at very low levels.
The new government is also developing a land transaction tax to replace stamp duty (ratesand bands will be set in autumn 2017).2 There is also now a commitment to reform theregulatory controls over housing associations in Wales following the ONS decision toreclassify them as public bodies for accounting purposes.
Social rents have continued to rise, rather than being cut by one per cent annually as inEngland. A review of rent policy is ongoing, part of the context for which is the comingapplication of LHA rates to the social housing sector. This will have major implications, inparticular for some housing associations operating in the South Wales Valleys, notablythose set up through stock transfers. Welsh local authorities have in the meantime taken apragmatic approach to increasing their rents,3 seeing the opportunity to invest in newcouncil housing as well as in existing stock (for the eleven councils that still own housing).For example, Flintshire Council has plans to build 500 new homes by 2021, 300 forAffordable Rent and 200 for social rent.
Affordable housing delivery is very much in the spotlight, with a target of 20,000 for theperiod 2016-21. Although this includes Help to Buy (to support the purchase of 6,000homes), it still represents a significant increase on the previous target of 10,000. Housingsupply pacts have been signed by the Welsh Government, first with Community HousingCymru and the Welsh LGA and, more recently, with the Home Builders Federation and theFederation of Master Builders. The pacts make commitments aimed at increasing supply.
The Welsh Government has continued its normal practice of adding to the Social HousingGrant budget during the year. During 2016/17, £30 million was added, taking the total toabout £100 million. In addition, £20 million from reserves has been targeted specificallyat innovative models of housing that can be built quickly and reduce or eliminate fuelbills, with an expected 1,000 affordable homes to be supported via this mechanism. A steering group has overseen the development of criteria and a bidding process, and thereare indications that, dependent on delivery, a bigger scheme could be forthcoming.
The government’s affordable housing programme also includes co-operative housing ofvarious tenures and a Rent to Own model. The latter provides tenants with the option tobuy via shared ownership. The aim is to provide at least 1,000 homes on this basis duringthe current government’s term of office.
How likely is it that the 20,000 affordable supply target will be achieved? Looking first atHelp to Buy, given that more than 2,000 homes have already been bought using agovernment shared equity loan since May 2016, a target of 6,000 purchases by 2021 seemsif anything rather cautious.
Turning to affordable housing delivery, statistics for 2016/17 are not yet available but in2015/16 local authorities reported 2,400 additional affordable homes across Wales, with94 per cent of these delivered by housing associations. Providing 14,000 additionalaffordable homes over five years therefore looks quite challenging, even if everything inthe economy goes smoothly. In this context, an August 2017 briefing paper fromCommunity Housing Cymru, the Home Builders Federation and Federation of MasterBuilders4 makes a series of recommendations on public land disposal and various aspectsof planning, all aimed at securing the 20,000 target.
What is positive, and another contrast to the position in England, is a significant degree ofconsensus about the importance of affordable and social housing and a considerableamount of joint working being invested in its delivery.
References1 See www.senedd.assembly.wales/mgIssueHistoryHome.aspx?IId=17260 2 See www.assembly.wales/laid%20documents/pri-ld10747-ra/pri-ld10747-ra-e.pdf 3 Current Welsh Government policy allows councils to raise rents by CPI plus 1.5% plus £2 per week to‘bring historically low rents in line with “target” rent levels.’4 See https://chcymru.org.uk/uploads/general/Briefing__20000-Homes__ENG__Final-2.pdf
Wales develops distinctive housing policies
Decline in right to buy in Wales8,000
7,000
6,000
5,000
4,000
3,000
2,000
1,000
0
Sale
s
Source: Welsh Government, social landlord housing sales statistics.
2003/042004/05
2005/062006/07
2007/082008/09
2009/102010/11
2011/122012/13
2013/142014/15
2015/162016/17
Housing associations
Local authorities

19
Unlike Scotland and Wales, Northern Ireland shares with England an uncertainpolitical environment which is hampering both decision-making and progress in
tackling housing and welfare issues. After elections in March, the Northern IrelandAssembly was suspended for the fourth time in 19 years, as a result of a misfiredrenewable heat incentive scheme. Agreement on restarting the assembly is nowcomplicated by the deal made by the Democratic Unionist Party to sustain the minorityWestminster government, but also by disagreement between the parties on equality issuessuch as the Irish language and same-sex marriage.
In the meantime, there is no minister responsible for housing nor is there a budget forthe current financial year. Normal operations continue but without the assembly therewill be little progress on pressing issues such as the Northern Ireland Housing Executive’sfuture, and its need to bring its homes up to the Decent Homes Standard.
Rent levels present a major challenge when it comes to reinvestment in the HousingExecutive’s stock. Its rents are much lower than those of housing associations, and around£20 per week less than the average rent for similar local authority housing in England.Rent freezes (following the examples from England) have not helped. There has also beena lack of political agreement on a new governance model that could permit the HousingExecutive to borrow, stalling any reforms. Despite this, NIHE is exploring the possibilityof building new homes in its estates, to help deal with unfitness in the stock and increasethe number of new units. Any proposals will however need approval from theDepartment for Communities (DfC).
Another important issue is the potential impact of Westminster’s welfare reforms. Thebedroom tax and benefits cap will continue to be almost fully mitigated in NorthernIreland until March 2020, with a review scheduled in 2018/19. However stakeholders are
calling for this mitigation to be extended to the UK government’s plan to apply localhousing allowance rates to social sector rents from 2019 (see page 15). A recent report byCIH Northern Ireland showed that the change will make new social housing less viable incertain areas. The problem is that any mitigation will inevitably affect Northern Ireland’sblock grant.
In the meantime Northern Ireland persists in having a housing market distinct from therest of the UK, not least in the slowness of its recovery from the credit crunch. Such wasthe plunge from their (unrealistically high) pre-2007 levels that house prices are nowbarely 60 per cent of what they were, and are forecast by PwC to grow more slowly thanthe rest of the UK over the next five years (see page 11). Market sales fell by 25 per cent inthe first quarter of 2017, although this may have been an anomaly and there was anencouraging rise in private-sector new build starts compared to the first quarter of 2016.Nevertheless any recovery is fragile given that the Northern Ireland market seemsparticularly vulnerable to the uncertainty of the current political stalemate and the UK’sdecision to leave the EU.
DfC originally set targets for social housing starts of 1,600 in 2016/17, 2,000 in 2017/18and 2,200 in 2018/19. The 2016/17 target was achieved, with 1,604 starts, although thisdepended to a considerable extent on acquisitions and refurbishment, which accountedfor 36 per cent of the total. Completions in 2016/17 were 1,387 units, of which 955 werenew build.
However this year’s target has now been cut to 1,750 as the DfC’s capital budget is onlytwo-thirds of its original bid. After pre-existing commitments were met, the remainderwas directed to housing but this still only provides £106 million for the Social HousingDevelopment Programme – the same as 2016/17. In order to raise output, DfC is givinglower priority to advanced land purchases, possibly risking future years’ targets. It isunlikely that housing associations will achieve more than 1,750 starts in any case, due tolate confirmation of the programme and the deferral of revisions to total cost indicatorsand housing association grant.
Given the growing evidence of housing need and the fragile private market it is perhapssurprising that social housing investment has not featured more strongly in NorthernIreland’s budget. When the DUP negotiated its £1.5 billion ‘confidence and supply’ dealwith the Westminster government, housing did not feature. Strains on housing-relatedbudgets have been apparent from recent cuts in supported housing services in thevoluntary sector, combined with continued uncertainty about dealing with welfarereforms. Additional social housing supply is urgently needed, but is there the budgetarycapacity – or the development capacity within the still-small housing association sector –to provide the increased supply that Northern Ireland now requires?
Northern Ireland’s political uncertainty
Social Housing Development Programme (SHDP) social housing dwellings2,500
2,000
1,500
1,000
500
0
No.
of d
wel
lings
Source: Department for Communities, Northern Ireland Housing Bulletin.
2010/11 2011/12 2012/13 2013/14 2014/15 2015/16 2016/17
STARTSOtherNew build
COMPLETIONSOtherNew build

20
Table 1 Key economic trends
Table 11 Office for Budget Responsibility 2017 Spring Budget Economic Forecast
Table 19 (a-l) Housing starts and completions in the United Kingdom
Table 33 Tenure, cars, consumer durables and second dwellings in Great Britain
Table 37 Tenure and sources of income in United Kingdom in 2015/16
Table 38 Tenure and gross weekly household income in United Kingdom in2015/16
Table 39b Numbers of property transactions in the United Kingdom
Table 40 Numbers of mortgage advances per year in Great Britain
Table 42 (a-d) Advances to first-time buyers and moving owner-occupiers
Table 43 (a&b) Mortgage-cost-to-income ratios for first-time buyers and movingowner-occupiers
Table 47 (a&b) Average regional house prices and index of prices
Table 48 Median regional house prices by size of dwelling in 2016
Table 51 Mortgage arrears and repossessions
Table 55 Buy to let loans
Table 91 (a-c) Homeless households in temporary accommodation in England,Scotland and Wales
Table 92 Reasons for homelessness in England
Table 93 Homelessness: Categories of need in England
Table 94 (a&b) Homelessness by region in England
Table 95 (a&b) Rough sleepers in England
Table 96 Landlord possession claims in England and Wales
Table 103 Welsh social landlord lettings
Table 117 Housing benefit caseload and payments by tenure and region atMay 2016
Updates to the 2017 Compendium of Tables
Alongside, and contributing to, the preparation of the Briefing Paper, 26 tables from the Compendium of Tables in the main Review have been updated. They are listed below.
The new tables can be seen and downloaded at the Review’s website, www.ukhousingreview.org.uk

The UK Housing Review is the key source of information for those involved in housing.
Celebrating 25 years of publishing comprehensive housing statistics covering England (and its regions), Wales, Scotland and Northern Ireland,
the latest Review looks at the implications of Brexit, housing in the European Union and the further effects of welfare reform. It also has Steve
Wilcox's reflections on key issues from 25 editions of the Review.
The Review does of course include its regular chapters of analysis of UK housing issues as well as more than 120 tables of comprehensive
housing data.
Price: £25 plus postage.
Order online: www.cih.org/thebookshop
For further information: phone 024 7685 1752 or email [email protected]

The UK Housing Review published each year provides a key resource for managers andpolicy-makers across the public and private housing sectors. It is now in its 25th year.
The UK Housing Review 2017 Briefing Paper updates key issues and data from this year’sfull Review, focusing on these themes:
• The economy, public spending and the post-election environment
• Household growth and housing supply
• House prices, mortgages and affordability
• Affordable housing supply in England
• The private rented sector
• Homelessness
• Welfare reform
The Briefing Paper also takes a closer look at housing in Scotland, Wales and NorthernIreland.
The UK Housing Review 2017 Briefing Paper is available to download at www.cih.org
Tables from the full Review and recent updates to themare available on the UKHR website:www.ukhousingreview.org.uk
See inside the back cover for details of how to obtain yourcopy of the full UK Housing Review 2017. Next year’sedition is planned for March 2018.
Published by the Chartered Institute of Housing. Theauthors and CIH are grateful to the Scottish Government,
the Welsh Government, the Northern Ireland HousingExecutive and to the organisations below for sponsoring
the research and publication of the Review.
����������� �������� ��������