Embed Size (px)
Citation preview
DOI 10.1515/hf-2013-0042 Holzforschung 2014; 68(2): 203–216
Peter Stapel* and Jan-Willem G. van de Kuilen
Efficiency of visual strength grading of timber with respect to origin, species, cross section, and grading rules: a critical evaluation of the common standards
Abstract: Strength grading is essential for the efficient use of structural timber. Although international stand-ards exist for machine strength grading, visual grad-ing is still regulated based on national rules, which are expected to allow safe and economic grading results. Although there are large differences in the graded output because the species, the cross section, and the origin of the timber influence the results, some of these standards are considered to be applicable universally. The present article demonstrates how the chosen standards influ-ence the grading results. Depending on the parameters, the yields or the mechanical properties are low com-pared with the declared values. The results also show the efficiency and applicability of different national stand-ards for strength grading of timber from various origins. Furthermore, it is recommended to reconsider the exist-ing limits for source areas and cross sections given in the standard EN 1912.
Keywords: grading standard, mechanical properties, sawn timber, timber grading, timber source
*Corresponding author: Peter Stapel, Technical University of Munich, Winzererstrasse 45, 80797 München, Germany, Phone: +49 89 2180 6420, e-mail: [email protected] G. van de Kuilen: Technical University of Munich, Winzererstrasse 45, 80797 München, Germany; Faculty of Civil Engineering and Geosciences, Delft University of Technology, 2600 GA Delft, The Netherlands
IntroductionThe major part of structural timber on the European market is graded visually. While European standards are commonly used (EN 14081-2 and EN 14081-3) for machine-graded timber, visual grading is done mainly based on national standards. These national standards are sup-posed to optimize the grading results for the timber resources of the country, taking into account growth conditions, local preferences for certain cross sections,
silvicultural differences, and historical developments concerning structural applications. National grading rules are assessing differently the knot size, growth ring width, or (local) slope of grain. Depending on the stand-ard, the raw material can be graded into up to four grades, for instance, according to the Scandinavian standard INSTA 142.
To facilitate the exchange structural timber between different markets, European standard EN 1912 lists how national grades are related to strength classes as given in EN 338. Assignments are restricted not only for certain species but also for geographical areas or certain cross sections for which the national grading rules are valid. For additional entries in EN 1912, scientific reports or a proven record of long experience are required con-cerning a certain wood species in its application. It is required that the test material be representative for the whole population with regard to timber source, sizes, and qualities. To cover these aspects, physical testing usually requires a considerable amount of test pieces. A large variation in physical properties is to be expected, as wood species generally grow over large geographi-cal areas on different soils and under various climatic conditions.
The testing efforts of today are in contrast to the assignments that have been introduced 15 years ago, when the European market was created. For some grading standards, large growth areas were specified at the same time. An extreme example is spruce originating from the growth area Central, North, and Eastern Europe (CNE Europe).
There are only a few publications focusing on the comparison of national grading rules. Johansson et al. (1992) compared INSTA, DIN, and ECE rules. Spruce timber from Germany and Sweden (SE) was graded and tested in bending (255 pieces) and tension (245 pieces). When compared with published strength values for the highest grade of INSTA and DIN, the reached bending strength values were much higher than the declared values. INSTA T3 class reached a 5% characteristic bending strength of 38.5 MPa and DIN S13 class reached 36.9 MPa in bending, as compared with 30 MPa declared
- 10.1515/hf-2013-0042Downloaded from De Gruyter Online at 09/28/2016 08:57:02PM
via Technische Universität München
204 P. Stapel and J.W.G. van de Kuilen: Visual strength grading of timber
for both grades. Also, all lower classes showed signifi-cantly higher values than expected from the current strength class assignments in EN 1912. Similar effects were found for modulus of elasticity (MoE) and density. However, the results were not analyzed separately for the different origins. Small-scale comparisons for a limited number of specimens were carried out by Almazán et al. (2008) for German pine graded by DIN 4074 and UNE 56544 or by Riberholt (2008) for European spruce graded according to Chinese visual rules. Visual grading is addressed in several available CIB-W18 timber structures publications (Fewell 1984; Uzielli 1986; Barrett et al. 1992; Stapel et al. 2010), but none of these focused on the comparison of different grading rules and the assign-ment according to EN 1912.
Verification of the validity of grading standards for such large growth areas as CNE is the main goal of the present article. Softwoods (spruce, pine, larch, Douglas fir, and Sitka spruce) will be graded and tested in tension or by edgewise bending. The following grading standards will be in focus: DIN 4074-1:2012-06, BS 4978:2007+A1:2011, DS/INSTA 142:2009 (E), NF B 52-001-1:2011, and SIA 265/1:2009. Three main factors will be analyzed, with particular emphasis on the available cross sections, the applied grading standards, and the geographical source of the timber.
Materials and methodsA total of 12 837 specimens were analyzed. The data set is divided for two loading modes (edgewise bending and tension) and for two knot descriptions. In 60% of all cases, every single knot of the spec-imen was measured, and this is classified as single knots available (SKA, abbreviations are summarized in Table 1). These SKA data formed the basis for analyzing the influence of the cross section and the grading standard. For the remaining 40%, no single-knot data were available, but the total (largest) knot area ratio (tKAR) could be measured. The influence of the geographical source of the timber was analyzed based on the tKAR data. Table 2 summarizes the available data sets. The used material was sampled on sawmill level. No requirements for the log quality were defined, but regional available logs were used. The boards of the logs are considered as sawfalling material, which is in line with the procedure used for the derivation of mechanical properties of sawn timber or the deriva-tion of machine settings. All specimens with available SKA values were tested at Holzforschung München between 1995 and 2012. The remaining specimens were tested at various laboratories around Europe during the Gradewood project, which finished in 2011 (Ran-ta-Maunus et al. 2011).
Destructive tests were performed according to EN 408:2010 for both bending (symmetrical two point loading; span: 18 times the depth) and tension (span: 9 times the depth). The orientation of the board in edgewise bending tests was chosen randomly. The modifi-
Table 1 List of symbols and abbreviations.
Symbol Definition
BS British visual grading standardCE Central EuropeCH SwitzerlandCNE Central, North, and Eastern Europecov Coefficient of variationDEK Important knot parameter used for DIN gradingDIN German visual grading standardDIN-B Grading rules for boards given in DINDIN-K Grading rules for joists given in DINE0 Modulus of elasticity (MPa)E0,mean Modulus of elasticity, mean value (MPa)EE Eastern Europefm Bending strength (MPa)fm,k Bending strength, 5th percentile value (MPa)FI FinlandFR Franceft Tension strength (MPa)ft,k Tension strength, 5th percentile value (MPa)INSTA Scandinavian visual grading standardLV LatviaMoE Modulus of elasticityn Number of specimensNF French visual grading standardPL PolandRU RussiaR2 Coefficient of determinationρ Density (kg m-3)ρk Density – 5th percentile value (kg m-3)SE SwedenSI SloveniaSIA Swiss visual grading standardSKA Single-knot data are availabletKAR Total knot area ratioUK United Kingdom
Table 2 Summary of the available data.
Data Bending Tension Total
Number of specimens 5773 7064 12 837Only tKAR data available 2719 2477 5196tKAR and SKA data available 3054 4587 7641
cation factors for test setup and specimen sizes given in EN 384:2010 have been applied (kh is the factor for depth and kl is the factor for length). Whenever possible, the weakest section along the beam axis was tested. The original beam length from which the specimens were cut was in most cases more than 4000 mm.
The most important visual grading parameters for the SKA data are knots, knot clusters, and growth ring width. The knots’ position was determined with an accuracy of 1 mm. Knots small-er than 5 mm were not recorded. For the bending tests, the knots were only analyzed in the section between or close to the loading points, whereas for the tension tests, the knots were analyzed
- 10.1515/hf-2013-0042Downloaded from De Gruyter Online at 09/28/2016 08:57:02PM
via Technische Universität München
P. Stapel and J.W.G. van de Kuilen: Visual strength grading of timber 205
between the grips. Visual grading for the analysis of geographi-cal origin has been performed based on the tKAR value, as SKA data were not available for all specimens (Table 2). The tKAR is defined as the knot area within 150 mm projected on the end grain divided by the area of the cross section (BS 4978). Over-lapping knot areas are counted only once. Table 3 summarizes the available data and gives the mean values and coefficients of variation (cov) for strength, MoE, density, and tKAR (CE = Cen-tral Europe, EE = Eastern Europe). Values for strength are always rounded to one decimal place; for density values, no decimal places are presented. The MoE data are rounded to the nearest hundred. Although mean values and cov are presented for the ungraded data set, these figures are not given for the grading re-sults to keep the tables clear. However, the variation within one grade is a quality feature of the material and is briefly addressed when appropriate.
It is necessary to differentiate between SKA and tKAR-only data sets. For pieces with SKA data, more grading rules have been con-sidered. For the tKAR data set, thresholds have been defined for dif-ferent grades based on the visual grading standards DIN 4074-1 and BS 4978. For these standards, many geographical sources are listed in EN 1912. The 5th percentile values of the strength and density are determined nonparametrically in accordance with EN 384; for MoE, the mean is determined. Specimens tested in edgewise bending and tension were considered for the analysis, although assignments in EN 1912 are based on bending strength only. Tension test results are compared with those given in EN 338, which in turn are based on bending strength multiplied by the factor 0.6, which is expected to be on the safe side.
The available SKA data are separated for thickness of pieces to check the influence of the dimensions on the grading results for the DIN and BS standards. The thickness was favored over the width or the cross-sectional area of the specimens because it has the strongest influence on the grading of joists according to DIN rules. The frequency of the thickness is shown in Figure 1 for pieces tested in bending and in tension. In a first step, six dif-ferent categories were formed with an equal number of pieces in each group. This was done for spruce independently of the load-ing mode. In a second step, the results for spruce tested by bend-ing were analyzed more precisely, forming four different thickness groups: ≤37, 38–45, 46–60, and > 61 mm. The boundaries were chosen to cover the important size of 38–45 mm for timber frame and 46–60 and > 61 mm for typical roof structures in CE. For these pieces, the resulting strength in the different classes was analyzed additionally.
The following grading standards have been applied based on SKA data: DIN 4074-1, BS 4978, INSTA 142, NF B 52-001-1, and SIA 265. DIN 4074-1 includes different sets of grading rules for the Ger-man designations “Kantholz” (joists), “Brett/Bohle” (boards), and “Latten” (battens). The joist grading is used for all pieces loaded in edgewise bending. Both grading rules for joists and boards have been applied, depending on the sizes and cross-section shape (DIN 4074-1). Unless the boards are for glulam production, edge knots have to be considered in a special way. This optional criterion, called in German “Schmalseitenast”, has been applied as well.
Differences between grading rules are partly due to the param-eters of knot measurements, which can be done by determining the minimum knot diameter, the knot projected on the end grain of the board, or the knot size measured parallel to the edge of the board. Not only single knots but also knot clusters are considered in all of
the standards. The length of the board over which the single knots are added up to a knot cluster is, for some standards, equal to the width of the board, whereas other standards consider a common length of 150 mm. Additional parameters are growth ring width, compression wood, and the appearance of a pith when such parameters are speci-fied as grade-determining features in the respective standards. Some of these parameters have to be taken into account only for certain species or sizes.
The SIA rules allow for different measuring principles for grad-ing of boards or joists. Our analysis is limited to the grading of joists. The INSTA rules depend on the shape of the cross section. Timber with thicknesses between 25 and 45 mm and a width between 50 and 75 mm has not been considered. This lowers the number of available pieces for INSTA analysis, but 6921 pieces were still available. The French standard NF B 52-001 refers to EN 1310 for the measurement of features. The NF itself considers different thresholds depending on the species. Only spruce and pine will be analyzed. For both stand-ards, the definitions of knot types are not unambiguous and leave some room for interpretation. The standards were discussed with grading experts from the respective countries and applied to the best of our knowledge.
The differences between grading standards are not only caused by different ways of determining knot sizes but also because the num-ber of classes vary. Where BS has two classes, INSTA and NF have four, not counting the reject. This fact influences the assignment of visual grades to strength classes in EN 338 as given in EN 1912.
The strength classes that correspond to the visual grades for the main softwood species spruce, fir, and pine are listed in Table 4. For a better overview, minor differences for single species are not differ-entiated in this table. The SIA classes are not included in EN 1912, but corresponding strength classes are given directly in the SIA. The grade allocation given in Table 4 is only valid for a specified source area. DIN and BS are valid for timber from CNE, INSTA for Northern Europe and Northeastern Europe, and NF for France (FR) only. SIA does not specify a certain area for which its grading rules can be ap-plied.
In the first instance, C classes were mainly in focus. Later, the actual strength class assignments are given for all grades, species, and loading modes according to EN 1912 or national standards. For some species or loading modes, there are no assignments. In this case, the assignments are linked to the grades given in Table 4.
More data are available if only tKAR values are used. These require the derivation of fixed threshold values (tKAR) because, other than for national grading rules, there are no grades based on tKAR only. The thresholds are derived for DIN and BS. The yield was matched for both grading options based on the SKA data set. As an example, SKA and tKAR data are available for 2447 pieces graded according to DIN (joists). For the DIN grading into S13, a maximum knot value of 0.2 is allowed. In addition, other parameters also need to be considered during grading. If DIN grading results in a yield of 18%, an appropriate KAR value is chosen, leading approximately to the same yield.
The grading results from the tKAR data set are analyzed with special respect to the geographical source of the timber, as speci-mens from many regions were available with tKAR values. The cross section itself, which may be relevant, is not considered during this step. This seems acceptable because both DIN and BS do not have restrictions for the cross sections. For this part of the analysis, the focus is on spruce and pine tested in bending. For timber loaded in tension, single aspects are highlighted.
- 10.1515/hf-2013-0042Downloaded from De Gruyter Online at 09/28/2016 08:57:02PM
via Technische Universität München

206 P. Stapel and J.W.G. van de Kuilen: Visual strength grading of timber
Table 3 Mean values and coefficient of variation (cov) for bending or tension strength (fm,t), modulus of elasticity (E0), density ( ρ), and tKAR given for different testing modes, species, and sources.
Load mode and species
Source Total n SKA Mean values and cova
fm/t
(MPa)E0
(MPa)ρ
(kg m-3)tKAR
(-)
Bending Pine PL 219 0 39.0 12 500 515 0.26
0.42 0.28 0.10 0.59SE 209 0 45.1 11 300 481 0.21
0.34 0.24 0.09 0.47 Sitka UK 607 607 29.6 7900 404 0.37
0.31 0.29 0.10 0.35 Spruce CE 1880 1880 39.1 11 500 438 0.27
0.33 0.26 0.12 0.42EE 840 0 35.7 10 000 396 0.30
0.31 0.24 0.10 0.35FR 115 0 42.8 11 800 440 0.22
0.26 0.20 0.10 0.40PL 433 432 38.5 11 400 434 0.32
0.31 0.25 0.11 0.32SE 345 135 42.5 11 800 450 0.26
0.36 0.26 0.13 0.42SI 1125 0 43.7 12 000 445 0.25
0.30 0.24 0.10 0.40Tension Douglas CE 324 324 24.8 10 900 493 0.36
0.50 0.25 0.11 0.33 Larch CE 326 326 26.8 10 400 540 0.31
0.47 0.27 0.11 0.39 Pine CE 264 264 25.3 10 400 525 0.31
0.42 0.25 0.12 0.39FI 257 0 31.7 11 400 492 0.25
0.39 0.20 0.11 0.41FR 239 0 20.3 9000 512 0.32
0.41 0.25 0.09 0.37PL 456 455 28.6 11 300 529 0.26
0.44 0.26 0.11 0.53RU 171 0 20.4 9600 442 0.33
0.43 0.22 0.10 0.34SE 206 0 29.7 10 400 485 0.24
0.39 0.22 0.09 0.41 Spruce CE 2895 2895 30.4 11 500 448 0.28
0.40 0.23 0.11 0.40CH 442 0 25.1 10 900 439 0.28
0.45 0.24 0.12 0.41EE 844 0 26.2 10 300 395 0.30
0.42 0.21 0.10 0.34LV 106 106 30.4 11 700 466 0.33
0.38 0.24 0.11 0.37PL 219 217 28.5 11 600 446 0.30
0.37 0.23 0.12 0.38SE 211 0 27.4 10 100 415 0.24
0.38 0.23 0.12 0.46SI 104 0 34.0 12 300 442 0.25
0.44 0.22 0.09 0.43
acov values are in italics.
- 10.1515/hf-2013-0042Downloaded from De Gruyter Online at 09/28/2016 08:57:02PM
via Technische Universität München

P. Stapel and J.W.G. van de Kuilen: Visual strength grading of timber 207
Results and discussion
Cross-section analysis
Figure 2 shows the influence of the thickness for the most important grading parameters of DIN (DEK value) and BS (tKAR value). Based on the increasing R2 values, it is obvious that with higher thicknesses, the results from knot measurement rules slowly converge, even though the correlation remains low. This means that single pieces graded according to BS and DIN will be more likely assigned to the same strength class for high thicknesses rather than for small thicknesses. At higher thicknesses, very large knot values are not detectable by any of the standards.
The influence of the cross sections on the strength was tested, and in Figure 3, the thicknesses are grouped again
Thickness (mm)200150100500
Freq
uenc
y
1400
1200
1000
800
600
400
200
0
SKA n=2447
tKAR n=2291
Testing mode: bending
Thickness (mm)706050403020
SKA n=3218
tKAR n=1603
Testing mode: tension
Figure 1 Frequency distribution for thickness divided by bending and tension, showing the available knot data.
Table 4 Strength class requirements for characteristic values of bending strength (fm,k), modulus of elasticity (E0,mean), and density ( ρk) according to EN 338 and corresponding visual grades as given in EN 1912 for main softwood species.
EN 338
fm,k (MPa)
E0,mean (MPa)
ρk (kg m-3)
DIN BS INSTA NF SIA
C35 35.0 13 000 400 – – – – –C30 30.0 12 000 380 S13 – T3 ST1 –C27 27.0 11 500 370 – – – – –C24 24.0 11 000 350 S10 SS T2 ST2 FKI and FKIIC20 20.0 9500 330 – – – – FKIIIC18 18.0 9000 320 S7 – T1 ST3 –C16 16.0 8000 310 – GS – – –C14 14.0 7000 290 – – T0 ST4 –
DIN-DEK (-)
1.00.80.60.40.20
BS-
tKA
R (
-)
0.8
0.6
0.4
0.2
0
61+50-6046-4942-4539-41≤3861+50-6046-4942-4539-41≤38
Thickness≤38: R2 Linear =0.18539-41: R2 Linear= 0.22842-45: R2 Linear= 0.26546-49: R2 Linear= 0.34650-60: R2 Linear= 0.328
61+: R2 Linear= 0.366
n=5665
Figure 2 Important grading parameters tKAR (BS) and DEK (DIN) influenced by the thickness.
and plotted against the strength, focusing on the main DIN and BS grading parameter. The quality of strength predic-tion is higher for BS. Both DEK and tKAR promise higher strength prediction accuracy for small thicknesses. The grade-determining properties are not only based on the knot values presented in Figure 3. The results obtained under consideration of other grade-determining properties are presented in Table 5. All MoE and density values in Table 5 meet the requirements. The strength values are slightly below or above the required strength values for thickness classes of 38–45 mm and 46–60 mm. The worst case within these two groups results from 384 pieces graded into C24. The characteristic strength reaches a value of 21.9 MPa or 10% below the required value. The strength values for the largest and smallest thickness class are too low for several
- 10.1515/hf-2013-0042Downloaded from De Gruyter Online at 09/28/2016 08:57:02PM
via Technische Universität München

208 P. Stapel and J.W.G. van de Kuilen: Visual strength grading of timber
grades. The class 60+ shows the lowest values for the cov of the bending strength in strength classes C30 and C24, inde-pendently of the standard.
This is in-line with a lower variation of the ungraded material. However, the low variation of the graded mate-rial does not guarantee high characteristic strength values, because for the 60+ class, 164 pieces are graded into C30, reaching a characteristic bending strength of merely 26.9 MPa. Grading results for large and small thicknesses often do not fulfill the requirements. For large thicknesses, this is related to the knots, usually not reaching values of above 0.5 (DEK and tKAR) as can be seen in Figure 3.
Downgrading of boards into C24 mainly based on relative knot sizes is apparently not accurate enough. However, for BS, the strength values for C24 are high, compared with the 38–45-mm and 46–60-mm thickness classes, as the larger cross sections seem to lead to a homogeniza-tion of the material. Trying to assign higher classes than C24 according to BS rules would also cause problems, as the current grade may not fulfill the C24 requirements anymore. Considering absolute knot sizes like in EN 1310 could help to obtain higher strength values for larger timber dimensions. Actually, NF, which is based on EN 1310, reaches the required values for larger thicknesses,
DIN-DEK (-)
1.00.80.60.40.20
Ben
ding
str
engt
h (M
Pa)
100
80
60
40
20
0
≤37.00: R2 Linear=0.22538.00-45.00: R2 Linear=0.23146.00-60.00: R2 Linear=0.235
61.00+: R2 Linear=0.144
n=2447
BS-tKAR (-)
0.80.60.40.20
61.00+
46.00-60.00
38.00-45.00
≤37.00
61.00+46.00-60.00
38.00-45.00
≤37.00
Thicknessn=2447 ≤37.00: R2 Linear=0.362
38.00-45.00: R2 Linear=0.29946.00-60.00: R2 Linear=0.279
61.00+: R2 Linear=0.216
Figure 3 Scatter of knot values and quality of strength prediction for DIN and tKAR separated for thickness – for spruce tested in bending.
Table 5 Grading results for different cross sections – for spruce tested in bending.
Thickness (mm) Strength class Grading rule n fm,k (MPa) E0,mean (MPa) ρk (kg m-3)
≤ 37 C30 DIN 28 26.3 15 200 387C24 BS 111 28.4 14 300 387C24 DIN 94 17.1 13 200 364C18 DIN 65 17.0 10 700 347C16 BS 49 14.7 11 100 350
38–45 C30 DIN 42 31.4 14 300 403C24 BS 454 24.7 12 600 371C24 DIN 384 21.9 12 100 366C18 DIN 386 19.2 10 700 368C16 BS 232 19.5 11 000 372
46–60 C30 DIN 53 35.9 14 900 398C24 BS 341 24.6 12 900 357C24 DIN 310 23.1 12 200 357C18 DIN 178 19.4 10 500 354C16 BS 120 18.9 10 500 352
61+ C30 DIN 164 26.9 12 100 382C24 BS 597 26.1 12 000 377C24 DIN 437 24.5 11 800 366C18 DIN 68 21.3 10 700 356C16 BS 56 18.2 9700 338
- 10.1515/hf-2013-0042Downloaded from De Gruyter Online at 09/28/2016 08:57:02PM
via Technische Universität München
P. Stapel and J.W.G. van de Kuilen: Visual strength grading of timber 209
but unfortunately, in this case, the yields are very low. For strength classes above C24, the size of the specimens should be a limitation for all used standards. Disregarding the cross section for the allocation of national grades to C classes is not justified.
Grading standard
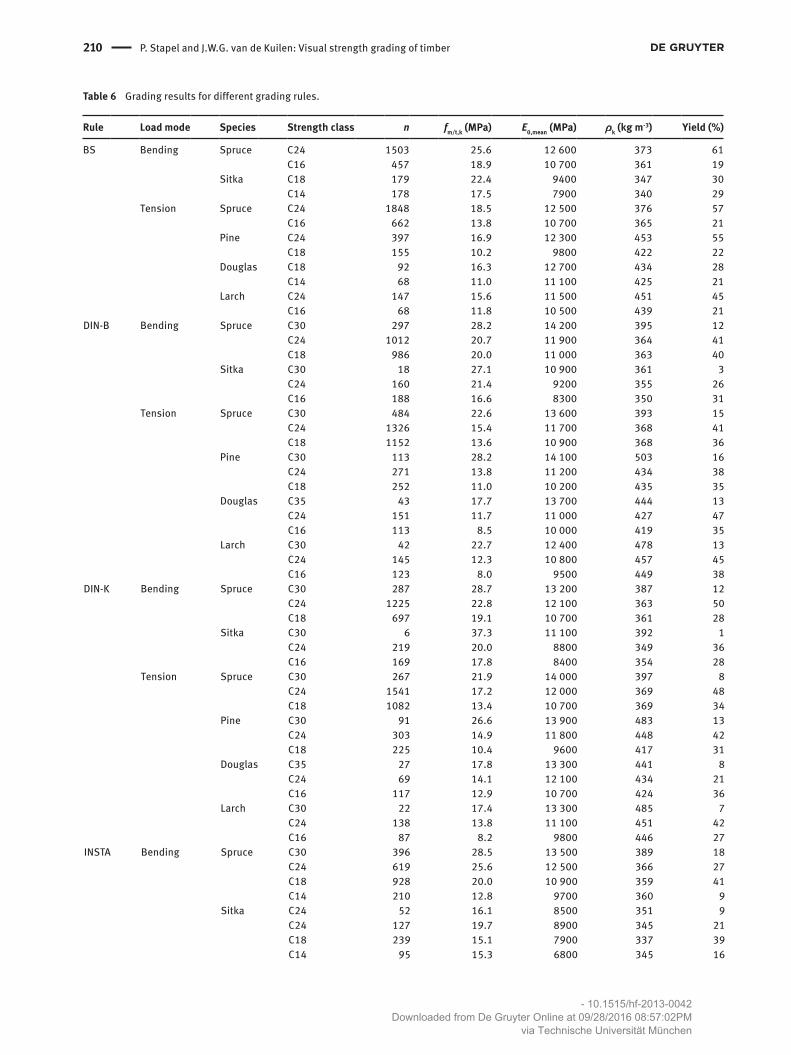
The influence of different grading standards was analyzed using SKA. There are bending data available for spruce and Sitka spruce and tension test data for spruce, pine, Douglas fir, and larch. In Table 6, the grading results are sorted by grading rules. In the following, the single grading rules are pointed out.
BS
Grading according to BS results in characteristic values above the requirements for all species, loading modes, and grades. Therefore, the assignments can be considered safe. The main reason for this is that C24 is the highest possible grade. If the rules are applied correctly, reject rates are high. They vary between 20% for spruce up and 51% for Douglas fir. Due to the sophisticated and rather complicated measuring method, it is questionable if these high reject rates are actually reached in practice.
DIN-B
As no assignment is given in EN 1912 for grading according to the DIN rules for boards, visual classes listed are based on the rules for joists. The results are higher than the requirements for spruce and pine tested in tension. For other possible combinations of species and load mode, the strength requirements are not fulfilled in several cases. The suggested strength classes for Sitka spruce are too high. Grading spruce joists according to board rules leads to the following results: the target value for C24 is clearly missed because only 20.7 MPa is reached. For spruce C30, a characteristic strength of 28.2 MPa is reached; for C18, 20.0 MPa. However, with 20.7 MPa, the strength for C24 is too low.
DIN-K
Strength values for Sitka spruce, larch, and Douglas fir do not meet the requirements for the listed strength classes. Also, for spruce tested in bending, the strength
requirements are shortly missed. The results of tension tests for spruce and pine are safe.
Looking more closely at the grading of Sitka spruce, strength classes used in BS would give satisfactory results. For DIN-K, this would mean assigning S10 and higher to strength class C18. For Sitka spruce, one should focus on MoE because this is usually the grade-restricting prop-erty. Having 225 pieces in one grade would result in a MoE value of 8900 MPa. The yields resulting from DIN are higher compared with yields from BS. This is not only true for Sitka spruce, where the reject is lower by 5%, but also for spruce tested in bending, where the reject is only half that of BS. The yields for C24 and higher are comparable.
INSTA
For spruce and pine, the reached strength values are above or close to the requirements. Generally speak-ing, INSTA seems to work well for pine and spruce from CE. Douglas and larch show strength values below the requirements in single classes. For Sitka spruce, most strength requirements are not fulfilled. Depending on the combination of loading mode and species, the reject rates vary between 5% and 16%. Application of the addi-tional strength class C14 leads to a lower total reject rate. No other standard gives a lower reject rate. However, this does not mean that the yields in higher classes are especially high. Unlike BS, INSTA assigns Sitka spruce to the strength classes C24, C18, and C14. As the source given in EN 1912 for INSTA is not the UK, but Norway and Denmark, the possible higher quality of Sitka spruce from these countries could be the reason for these dif-ferent results. Classes above C20 can definitely not be reached for Sitka spruce from the UK.
NF
The required characteristic values are achieved except for the strength values of C30 and C24 for spruce tested in bending and for C30 of pine (n = 16 only). The yield in C30 is low, whereas yields in C24 and C18 are comparable. The application of absolute knot values as grading criterion is unique among the analyzed standards. This is also an important reason why the yields in C30 are low compared with the other standards. The effectiveness of this method cannot be demonstrated by the resulting characteristic values. The bending strength for C24 is 20.5 MPa, whereas 21.1 MPa is obtained for C18. Hence, this standard does not seem applicable for grading CE spruce or pine.
- 10.1515/hf-2013-0042Downloaded from De Gruyter Online at 09/28/2016 08:57:02PM
via Technische Universität München
210 P. Stapel and J.W.G. van de Kuilen: Visual strength grading of timber
Table 6 Grading results for different grading rules.
Rule Load mode Species Strength class n fm/t,k (MPa) E0,mean (MPa) ρk (kg m-3) Yield (%)
BS Bending Spruce C24 1503 25.6 12 600 373 61C16 457 18.9 10 700 361 19
Sitka C18 179 22.4 9400 347 30C14 178 17.5 7900 340 29
Tension Spruce C24 1848 18.5 12 500 376 57C16 662 13.8 10 700 365 21
Pine C24 397 16.9 12 300 453 55C18 155 10.2 9800 422 22
Douglas C18 92 16.3 12 700 434 28C14 68 11.0 11 100 425 21
Larch C24 147 15.6 11 500 451 45C16 68 11.8 10 500 439 21
DIN-B Bending Spruce C30 297 28.2 14 200 395 12C24 1012 20.7 11 900 364 41C18 986 20.0 11 000 363 40
Sitka C30 18 27.1 10 900 361 3C24 160 21.4 9200 355 26C16 188 16.6 8300 350 31
Tension Spruce C30 484 22.6 13 600 393 15C24 1326 15.4 11 700 368 41C18 1152 13.6 10 900 368 36
Pine C30 113 28.2 14 100 503 16C24 271 13.8 11 200 434 38C18 252 11.0 10 200 435 35
Douglas C35 43 17.7 13 700 444 13C24 151 11.7 11 000 427 47C16 113 8.5 10 000 419 35
Larch C30 42 22.7 12 400 478 13C24 145 12.3 10 800 457 45C16 123 8.0 9500 449 38
DIN-K Bending Spruce C30 287 28.7 13 200 387 12C24 1225 22.8 12 100 363 50C18 697 19.1 10 700 361 28
Sitka C30 6 37.3 11 100 392 1C24 219 20.0 8800 349 36C16 169 17.8 8400 354 28
Tension Spruce C30 267 21.9 14 000 397 8C24 1541 17.2 12 000 369 48C18 1082 13.4 10 700 369 34
Pine C30 91 26.6 13 900 483 13C24 303 14.9 11 800 448 42C18 225 10.4 9600 417 31
Douglas C35 27 17.8 13 300 441 8C24 69 14.1 12 100 434 21C16 117 12.9 10 700 424 36
Larch C30 22 17.4 13 300 485 7C24 138 13.8 11 100 451 42C16 87 8.2 9800 446 27
INSTA Bending Spruce C30 396 28.5 13 500 389 18C24 619 25.6 12 500 366 27C18 928 20.0 10 900 359 41C14 210 12.8 9700 360 9
Sitka C24 52 16.1 8500 351 9C24 127 19.7 8900 345 21C18 239 15.1 7900 337 39C14 95 15.3 6800 345 16
- 10.1515/hf-2013-0042Downloaded from De Gruyter Online at 09/28/2016 08:57:02PM
via Technische Universität München
P. Stapel and J.W.G. van de Kuilen: Visual strength grading of timber 211
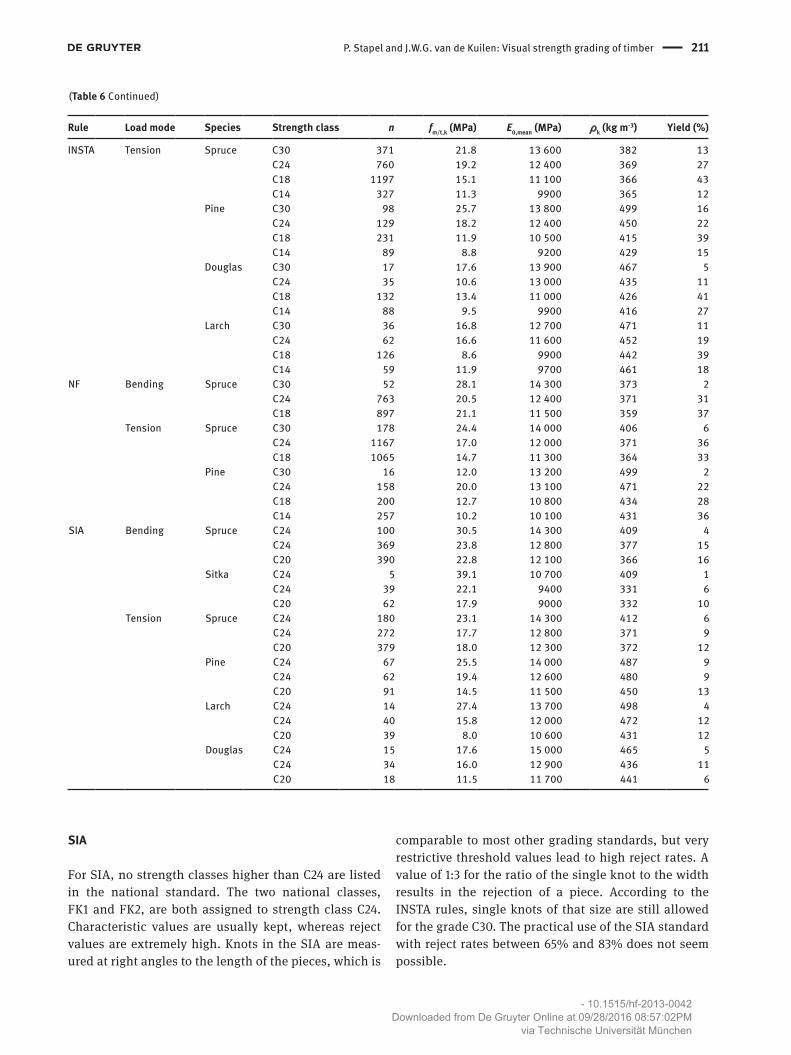
SIA
For SIA, no strength classes higher than C24 are listed in the national standard. The two national classes, FK1 and FK2, are both assigned to strength class C24. Characteristic values are usually kept, whereas reject values are extremely high. Knots in the SIA are meas-ured at right angles to the length of the pieces, which is
comparable to most other grading standards, but very restrictive threshold values lead to high reject rates. A value of 1:3 for the ratio of the single knot to the width results in the rejection of a piece. According to the INSTA rules, single knots of that size are still allowed for the grade C30. The practical use of the SIA standard with reject rates between 65% and 83% does not seem possible.
Rule Load mode Species Strength class n fm/t,k (MPa) E0,mean (MPa) ρk (kg m-3) Yield (%)
INSTA Tension Spruce C30 371 21.8 13 600 382 13C24 760 19.2 12 400 369 27C18 1197 15.1 11 100 366 43C14 327 11.3 9900 365 12
Pine C30 98 25.7 13 800 499 16C24 129 18.2 12 400 450 22C18 231 11.9 10 500 415 39C14 89 8.8 9200 429 15
Douglas C30 17 17.6 13 900 467 5C24 35 10.6 13 000 435 11C18 132 13.4 11 000 426 41C14 88 9.5 9900 416 27
Larch C30 36 16.8 12 700 471 11C24 62 16.6 11 600 452 19C18 126 8.6 9900 442 39C14 59 11.9 9700 461 18
NF Bending Spruce C30 52 28.1 14 300 373 2C24 763 20.5 12 400 371 31C18 897 21.1 11 500 359 37
Tension Spruce C30 178 24.4 14 000 406 6C24 1167 17.0 12 000 371 36C18 1065 14.7 11 300 364 33
Pine C30 16 12.0 13 200 499 2C24 158 20.0 13 100 471 22C18 200 12.7 10 800 434 28C14 257 10.2 10 100 431 36
SIA Bending Spruce C24 100 30.5 14 300 409 4C24 369 23.8 12 800 377 15C20 390 22.8 12 100 366 16
Sitka C24 5 39.1 10 700 409 1C24 39 22.1 9400 331 6C20 62 17.9 9000 332 10
Tension Spruce C24 180 23.1 14 300 412 6C24 272 17.7 12 800 371 9C20 379 18.0 12 300 372 12
Pine C24 67 25.5 14 000 487 9C24 62 19.4 12 600 480 9C20 91 14.5 11 500 450 13
Larch C24 14 27.4 13 700 498 4C24 40 15.8 12 000 472 12C20 39 8.0 10 600 431 12
Douglas C24 15 17.6 15 000 465 5C24 34 16.0 12 900 436 11C20 18 11.5 11 700 441 6
(Table 6 Continued)
- 10.1515/hf-2013-0042Downloaded from De Gruyter Online at 09/28/2016 08:57:02PM
via Technische Universität München
212 P. Stapel and J.W.G. van de Kuilen: Visual strength grading of timber
Comparing the cov values for species, the lowest cov of in-grade timber can be found for spruce tested in bending, independent of the used standard. DIN and BS show similar results across all strength classes (cov 0.27–0.30), but INSTA rules lead to lower cov values. NF shows the highest cov values except for the highest strength class C30 (cov 0.24). Independent of the standard, none of the grades shows a cov < 0.24. Highest cov values are found for Douglas fir.
Source
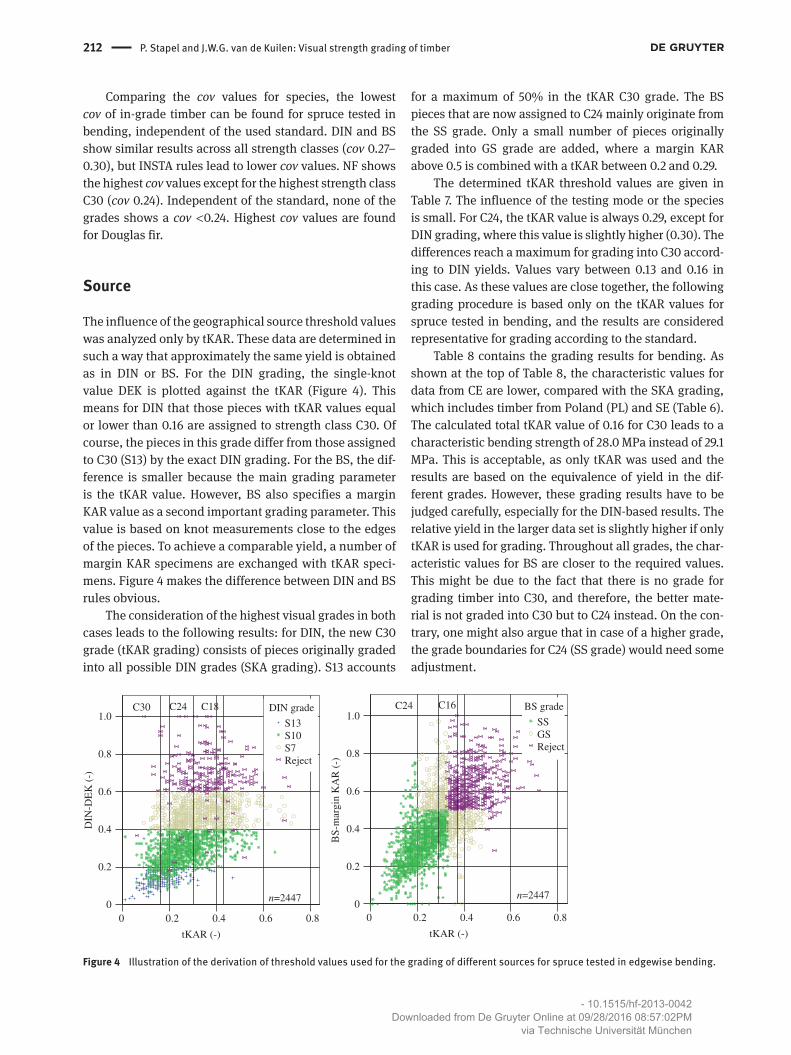
The influence of the geographical source threshold values was analyzed only by tKAR. These data are determined in such a way that approximately the same yield is obtained as in DIN or BS. For the DIN grading, the single-knot value DEK is plotted against the tKAR (Figure 4). This means for DIN that those pieces with tKAR values equal or lower than 0.16 are assigned to strength class C30. Of course, the pieces in this grade differ from those assigned to C30 (S13) by the exact DIN grading. For the BS, the dif-ference is smaller because the main grading parameter is the tKAR value. However, BS also specifies a margin KAR value as a second important grading parameter. This value is based on knot measurements close to the edges of the pieces. To achieve a comparable yield, a number of margin KAR specimens are exchanged with tKAR speci-mens. Figure 4 makes the difference between DIN and BS rules obvious.
The consideration of the highest visual grades in both cases leads to the following results: for DIN, the new C30 grade (tKAR grading) consists of pieces originally graded into all possible DIN grades (SKA grading). S13 accounts
for a maximum of 50% in the tKAR C30 grade. The BS pieces that are now assigned to C24 mainly originate from the SS grade. Only a small number of pieces originally graded into GS grade are added, where a margin KAR above 0.5 is combined with a tKAR between 0.2 and 0.29.
The determined tKAR threshold values are given in Table 7. The influence of the testing mode or the species is small. For C24, the tKAR value is always 0.29, except for DIN grading, where this value is slightly higher (0.30). The differences reach a maximum for grading into C30 accord-ing to DIN yields. Values vary between 0.13 and 0.16 in this case. As these values are close together, the following grading procedure is based only on the tKAR values for spruce tested in bending, and the results are considered representative for grading according to the standard.
Table 8 contains the grading results for bending. As shown at the top of Table 8, the characteristic values for data from CE are lower, compared with the SKA grading, which includes timber from Poland (PL) and SE (Table 6). The calculated total tKAR value of 0.16 for C30 leads to a characteristic bending strength of 28.0 MPa instead of 29.1 MPa. This is acceptable, as only tKAR was used and the results are based on the equivalence of yield in the dif-ferent grades. However, these grading results have to be judged carefully, especially for the DIN-based results. The relative yield in the larger data set is slightly higher if only tKAR is used for grading. Throughout all grades, the char-acteristic values for BS are closer to the required values. This might be due to the fact that there is no grade for grading timber into C30, and therefore, the better mate-rial is not graded into C30 but to C24 instead. On the con-trary, one might also argue that in case of a higher grade, the grade boundaries for C24 (SS grade) would need some adjustment.
tKAR (-)
0.80.60.40.20
DIN
-DE
K (
-)
1.0
0.8
0.6
0.4
0.2
0
RejectS7S10S13
DIN grade
n=2447
C30 C24 C18
tKAR (-)
0.80.60.40.20
BS-
mar
gin
KA
R (
-)
1.0
0.8
0.6
0.4
0.2
0
RejectGSSS
BS grade
n=2447
C24 C16
Figure 4 Illustration of the derivation of threshold values used for the grading of different sources for spruce tested in edgewise bending.
- 10.1515/hf-2013-0042Downloaded from De Gruyter Online at 09/28/2016 08:57:02PM
via Technische Universität München
P. Stapel and J.W.G. van de Kuilen: Visual strength grading of timber 213
For spruce, except for the bending strength for class C30, which is only based on the minimum value of 25 pieces, the characteristic values are met. This does not indicate a high quality raw material. The values required for C24 are met, both for DIN and BS.
Sweden
For SE pine, yields are at least as high as for pine from PL, although the characteristic values are met. For spruce, the characteristic values are close to the requirements, except for C30, where 63 pieces out of 345 in this grade have a characteristic strength value of only 24.5 MPa.
Slovenia
Timber from Slovenia shows extraordinary good strength values for the timber properties in the ungraded data set (Table 3), and consequently, good grading results with low reject rates could be obtained. Graded based on the threshold values of DIN, the reject rate is as low as 3%. If the ungraded spruce material shows values that are con-stantly moving in the upper range of possible strength, MoE, and density distributions, the choice of the grading standard should be done by focussing on the yield only, as the grading results will always be safe.
The grading output for tension is presented without precise listing of the results in a table, and only single aspects are highlighted in the following.
Tension data (all sources)
Pine tension data are available from Finland (FI), FR, Russia (RU), and SE. Table 3 shows that there are already considerable differences in strength properties for the ungraded timber sources. These differences are reflected in the grading results. For timber from FI and SE, the required values are reached. Although the yields are close together, FI timber shows tensile strength values far above the requirements (26.8 MPa for C30, n = 54/17.9 MPa for C24-DIN, n = 123).
Timber from FR and RU clearly shows lower values for the ungraded samples (see Table 3) compared with timber from FI and SE. The tKAR grading leads to similar yields for timber from RU and FR. However, there is a difference in terms of obtained characteristic strength values. Grading FR timber into C24-BS leads to a char-acteristic strength of 8.9 MPa (n = 105), where 14.4 MPa
Table 7 tKAR values that give a comparable yield to the grading standards DIN or BS respectively.
Spruce bending Spruce tension Pine tension
DIN BS DIN BS DIN BS
C30 0.16 – 0.14 – 0.13 –C24 0.30 0.29 0.29 0.29 0.29 0.29C18 0.43 – 0.42 – 0.41 –C16 – 0.36 – 0.36 – 0.37
Eastern Europe
Independent of the grading procedure, the obtained strength values are close to the required ones. A con-siderable reduction in yield compared with CE can be observed due to the low quality of the ungraded material (Table 3). Forty-five percent of the pieces do not reach strength class C24 or higher for DIN grading, but the assignment seems to be correct. In addition, the variation of strength values within the strength classes is small. Only timber from SI shows cov values within that range (0.22–0.29). Density values are well below the require-ments as for the tKAR grading, but no parameter is avail-able for predicting the density (growth ring width). The requirement for C30 is 380 kg m-3, and only 336 kg m-3 is achieved. Looking at the characteristic values independ-ent of the grade, it is questionable whether the growth ring width is sufficient to predict density, which is good enough and reaches the density requirements for C24 or higher.
France
The data set from FR is too small for reliable statements with regard to the applicability of either DIN or BS standard.
Poland
For all classes and grading standards, the strength values for pine are too low. This cannot be explained by low strength values for the ungraded material, as the mean value is in the range of ungraded spruce data. In addi-tion, the variation within the strength classes reaches a maximum compared with other countries (cov 0.31–0.38). The MoE and density values are met. Visual grading of pine from PL does not work when applying DIN or BS standards.
- 10.1515/hf-2013-0042Downloaded from De Gruyter Online at 09/28/2016 08:57:02PM
via Technische Universität München
214 P. Stapel and J.W.G. van de Kuilen: Visual strength grading of timber
is required. Timber from RU reaches 14.1 MPa. Because the mean knot values of the ungraded material from RU and FR are also close together for both sources, the cor-relation between tKAR and tension strength has been checked: for the whole data set of pine loaded in tension, an R2 = 0.47 is found; for RU pine, R2 = 0.46, whereas for FR pine, it is only R2 = 0.18. Hence, a reliable prediction of the strength of French pine based on tKAR seems to be impossible.
For spruce tested in tension, the differences for the ungraded material are small for different sources. The
values for timber from CH, EE, and SE are close together, whereas the timber from SI again shows higher strength values (Table 3). For the small data set from SI, all require-ments are fulfilled. In addition, the grading results for the other sources are closer to the required values compared with the results for pine. The required strength values for C18-DIN and C16 for timber from SE are not reached. Eastern European timber fulfils the strength requirements, except for C30 (16.6 MPa), but fails the density require-ments again. Timber from CH does not reach the strength requirements for C24-DIN (13.1 MPa) and C18 (9.3 MPa).
Table 8 Grading results for different sources (bending only).
Source Species Strength class Visual standard n fm,k (MPa) E0 mean (MPa) ρk (kg m-3) Yield (%)
CE Spruce C30 DIN 315 28.0 13 400 390 17C24 BS 1186 24.8 12 500 374 63C24 DIN 931 23.8 12 100 367 50C18 DIN 471 17.2 10 300 358 25C16 BS 337 18.9 10 700 359 18
EE Spruce C30 DIN 73 28.5 11 500 336 9C24 BS 424 23.6 11 000 340 51C24 DIN 384 23.2 10 800 342 46C18 DIN 289 18.0 9200 336 34C16 BS 200 20.0 9600 336 24
FR Spruce C30 DIN 31 25.1 12 200 379 27C24 BS 94 26.5 12 000 381 82C24 DIN 68 25.4 11 800 375 59C18 DIN 14 16.5 11 200 376 12C16 BS 15 23.3 11 300 375 13
PL Pine C30 DIN 69 19.9 14 400 452 32C24 BS 134 21.2 13 900 441 61C24 DIN 70 21.5 13 200 434 32C18 DIN 49 13.1 11 000 435 22C16 BS 39 13.4 11 200 434 18
Spruce C30 DIN 25 19.1 14 600 411 6C24 BS 194 24.7 12 800 373 45C24 DIN 188 24.4 12 500 372 43C18 DIN 169 19.9 10 500 356 39C16 BS 106 19.9 11 100 356 25
SE Pine C30 DIN 73 30.1 13 000 439 35C24 BS 165 26.5 11 700 420 79C24 DIN 99 24.9 10 700 412 47C18 DIN 34 15.3 9500 403 16C16 BS 31 15.1 9800 407 15
Spruce C30 DIN 63 24.5 12 700 370 18C24 BS 231 23.7 12 200 360 67C24 DIN 177 23.2 12 000 355 51C18 DIN 74 15.2 11 400 346 21C16 BS 58 13.8 11 800 345 17
SI Spruce C30 DIN 231 34.8 13 800 388 21C24 BS 798 27.4 12 600 383 71C24 DIN 602 25.2 12 000 379 54C18 DIN 246 20.4 10 600 363 22C16 BS 194 21.1 10 800 367 17
- 10.1515/hf-2013-0042Downloaded from De Gruyter Online at 09/28/2016 08:57:02PM
via Technische Universität München
P. Stapel and J.W.G. van de Kuilen: Visual strength grading of timber 215
Comparing bending and tension, it seems more likely that the required characteristic values for pieces tested in tension are met. Many deviations from the required strength values are small or can be explained. For instance, the timber from Switzerland was tested over a longer span than nine times the height, leading to lower strength values (length effect).
ConclusionsAmong the three parameters, cross sections, source of the timber, and grading standard, the last is the most influential. The different rules of measuring knots and the number of grades in a standard influence the results. Moreover, an effect of the cross section and the source of the graded timber have been shown to be relevant. For example, it is not possible to grade C30 with large cross sections because of the relevance of knot sizes and dimensions for visual grading. Grading results are similar for DIN, BS, and INSTA. For sources, for which SKA data were available, the requirements are met or nearly met. Having only two grades in a standard (such as in case of BS) makes it easier to reach the required values for all possible combinations of species and type of loading. All three standards could be used for CE timber. Reject rates are lowest for INSTA, as only this standard has a grade for C14. This trend is not transfer-able to high grades. Yields for C24 and higher vary from 62% for grading according to DIN to 45% for grading according to INSTA (spruce, bending). For European spruce, the characteristic values are close to the required values for all three standards, with a maximum deviation of around 10% below the required value. The absolute
reject rates for visual grading vary depending on several factors, such as cross section, grading standard, and/or knot definitions. In practice, these rates will be even higher because the full board length needs to be graded, whereas in this study, only the central section has been graded. The results for NF show low yields for C30. The distinction between C24 and C18 is not really sharp. This leads to equal yields and similar characteristic values for these two grades. Hence, in CE spruce, the characteristic values for C18 are met, whereas for C24, they are not. The SIA 265/1:2009 standard leads to extreme reject rates and a practical use is not possible.
Visual grading results are clearly influenced by the source of the timber. Grading into C30 seems to be espe-cially problematic in a number of cases. Depending on species, source, and grading rules, declared growth areas need clarification for a number of standards, and growth areas cannot be extended without additional testing or changes in the grade limits. Allocations in EN 1912 for softwoods are not correct in a number of cases, and a review seems necessary. New limits for source areas and cross sections are required. This can only be done based on a review of data, where the respective grading stand-ards have proven their applicability for the listed grade, source, and cross section.
Acknowledgments: We like to thank Olaf Strehl and Andreas Gossler of HFM for programming the grading rule routines into the database and our student assistants for measuring tens of thousands of knots.
Received March 15, 2013; accepted July 12, 2013; previously published online August 7, 2013
ReferencesAlmazán, A.F.J., Prieto, H.E., Martitegui, A.F., Richter, C. (2008)
Comparison of the Spanish visual strength grading standard for structural sawn timber (UNE 56544) with the German one (DIN4074) for Scots pine (Pinus sylvestris L.) from Germany. Holz. Roh. Werkst. 66:253–258.
Barrett, J.D., Lam, F., Lau, W. (1992) Size effects in visually graded softwood structural lumber. CIB W 18 Paper 25-6-5. Åhus, Sweden. Available at: cib-w18.com. Accessed on March 1, 2013.
BS 4978 2007+A1. (2011) Visual Strength Grading of Softwood. BSI, London.
DIN 4074-1:2012-06. (2012) Sortierung von Holz nach der Tragfähigkeit, Nadelschnittholz. DIN, Berlin.
DS/INSTA 142. (2009) (E) Nordic Visual Strength Grading Rules for Timber. Dansk Standard, Charlottenlund.
EN 1310. (1997) Round and Sawn Timber – Method of Measurement of Features. CEN European Committee for Standardization, Brussels.
EN 338. (2010) Structural Timber – Strength Classes. CEN European Committee for Standardization, Brussels.
EN 384. (2010) Structural Timber – Determination of Characteristic Values of Mechanical Properties and Density. CEN European Committee for Standardization, Brussels.
EN 408. (2010) Timber Structures – Structural Timber and Glued Laminated Timber – Determination of Some Physical and
- 10.1515/hf-2013-0042Downloaded from De Gruyter Online at 09/28/2016 08:57:02PM
via Technische Universität München
216 P. Stapel and J.W.G. van de Kuilen: Visual strength grading of timber
Mechanical Properties. CEN European Committee for Standard-ization, Brussels.
EN 1912. (2012) Structural Timber – Strength Classes – Assignment of Visual Grades and Species. CEN European Committee for Standardization, Brussels.
Fewell, A. (1984) The determination of softwood strength properties for grades, strength classes and laminated timber for BS 5268: Part 2. CIB W 18 Paper 17-6-2. Rapperswil, Switzerland. Available at: cib-w18.com. Accessed on March 1, 2013.
Johansson, C.J., Brundin, J., Gruber, R. (1992) Stress grading of Swedish and German timber. A comparison of machine stress grading and three visual grading systems. Building Technology. SP Report 23:94. Swedish National Testing and Research Institute, Borås, Sweden.
NF B 52-001:2011 Règles d’utilisation du bois dans les constructions; Classement visuel pour employ en structure pour les principales essences résineuses et feuillues. AFNOR, Saint-Denis.
Ranta-Maunus, A., Denzler, J.K., Stapel, P. (2011) Strength of European timber. Part 2. Properties of spruce and pine tested in Gradewood project. VTT Technical Research Centre of Finland, Espoo, Finland.
Riberholt, H. (2008) European spruce – Picea abies – graded by Chinese visual rules. Technical University of Denmark, Department of Civil Engineering, Lyngby, Denmark. BYG Rapport.
Stapel, P., v.d. Kuilen, J.W., Rais, A. (2010) Influence of origin and grading principles on the engineering properties of european timber. CIB W 18 Paper 43-5-2. Nelson, New Zealand. Available at: cib-w18.com. Accessed on March 1, 2013.
SIA 265/1:2009 Holzbau – Ergänzende Festlegungen. SIA, Zürich.
Uzielli, L. (1986) Stress-grading by ECE standards of Italian-grown Douglas-fir dimension lumber from young thinnings. CIB W 18 Paper 19-5-1. Florence, Italy. Available at: cib-w18.com. Accessed on March 1, 2013.
- 10.1515/hf-2013-0042Downloaded from De Gruyter Online at 09/28/2016 08:57:02PM
via Technische Universität München