Embed Size (px)
Citation preview

Steve Peter Matyas Trosok Dept. of Naturai Resource Sciences
Microbiology Unit Macdonald Campus
McGill University
March, 2000
A Thesis submitted to the Faculty of Graduate Studies and Research in partial fuifilment of the degree of Master of Science
Steve P. M. Trosok 2000

National Library Bibliothèque nationale du Canada
Acquisitions and Acquisitions el Bibliographie Services services bibliographiques 395 WeUingtan Street 395. M Wellington OiÉawa ON KIA ON4 bClawaON K l A O W canada Canada
The author has granted a non- exclusive licence dowing the National Library of Canada to reproduce, loan, distribute or seiî copies of this thesis in microform, paper or electronic formats.
The author retains ownership of the copyright in this thesis. Neither the thesis nor substantial extracts Eom it may be printed or otherwise reproduced without the author's permission.
L'auteur a accordé une licence non exc1usive permettant à la Bib1iothèque nationale du Canada de reproduire, p r k , distribuer ou vendre des copies de cette thèse sous la forme de microfiche/film, de reproduction sur papier ou sur format eIectronique.
L'auteur conserve la propriété du droit d'auteur qui protège cette thèse. Ni Ia thèse ni des exîraits substantiels de celle-ci ne doivent être imprimés ou autrement reproduits sans son autorisation.
MEDIATED YEAST BOD BIOSENSORS

Mediated microbial sensors utilizing two different yeast isolates (Sm1 and SPT2) were
developed for the estimation of biochemical oxygen demand (BOD). Measurements of
glucose/glutarnic acid (GGA) standard solution with potassium femcyanide mediation resulted in
linear ranges extending fiom the detection limits (i.e. 2 and 5 ppm BOD) to 100 and 200 ppm BOD
for the SPTl- and SP'ï2- based sensors, respectively. The standard error of the mean (SEM) for 10
ppm BOD measurements was 10.1 8 (SPT 1) and 3.9 % ( S m ) . Response reproducibiüty had
10.6 1 error between three identicalIy prepared Sm1 sensors. Response times for concentrations
of 20 ppm BOD were within 10 minutes. For pulp mil1 effluent, the detection limits were 2 (SPTl)
and 1 ( S m ) ppm BOD, with SEMs of 3.6 % and 14.3 % for the SPTl and SPT2 sensors,
respectively. Based on the results obtained in this study, it is concluded that SPT2 is the more
suitable biocatal yst for pulp miil wastewater analysis.
While 18s rRNA gene sequence analyses, including BLAST homology searches, have
suggested that isolate SPTl is a close relative of Candida sojae (99.8 % homology), no close
matches have been found for isolate S m . The closest match for SPT2 was to Cundida h e i
(76.0 95 homology). Evidence Erom biochemical tests, fatty acid analysis, and 18s rRNA gene
sequence analyses. indicates that isolate SPTZ is a novel yeast species.

Des isolats de levures, SPTl et SPT2, ont été utilisés en tant qu' éldments sensibles pour la
mise-au-point de biocapteurs arnpérom&riques. Une estimation de la demande biochimique en
oxygène (DBO) d'effluents de pulperies a eté possible en utilisant un compos6 électroactif
(femcyanure de potassium) wmme médiateur entre les isolats de levure et la surface de I'electrode.
Dans le cas de solutions standardistks de glucose/acide glutamique (GGA), la réponse du biocapteur
(courant) en fonction de la concentration (entre 2 et 100 pprn avec S m l . entre 5 et 200 pprn avec
S m ) est lindaire. De plus, les coefficients de variation (CV), à l'ajout de 10 pprn & DBO. pour
une même électrode, sont respectivement de 10.1 8 (SPT1) et 3.9 96 (SPT2). Des temps de
réponse infërieurs à 10 minutes ont &té obtenus après addition de 20 pprn de DBO. Une
reproductibilité de 10.6 % a 6t6 atteinte après montage de trois capteurs utilisant 1' isolat Sn1.
Dans le cas des effluents de pulperies, les limites de détection sont respectivement de 2 pprn de DBO
(SPT1) et 1 pprn de DBO ( S m ) pour des CV de 3.6 % (SPTl) et 14.3 % (SPTî). A la vue des
résultats, l'isolat SPT2 semble le biocatalyseur le plus approprié quant B l'analyse des eaux usées
provenant de pulperies.
Les analyses de séquence génique de 1'ARNr 18s' incluant des recherches d'homologie
"BLAST', ont suggérées que l'isolat SPTl est un proche parent de Cmidida sojae (homologue A
99.8 96). Quant à l'isolat S m , aucun rapprochement significatif n'a pu être fait. SPIT p o s W
seulement 76.0 96 d'homologie avec son plus proche parent, Candida krusei. Les dsultats des
analyses biochimiques, des analyses de la composition des acides gras ainsi que des analyses de
séquence génique de 1'ARNr 18s tendent B suggérer que l'isolat SPT2 est une nouvelle espèce de
l e m .

1 wish to express my sincere gratitude to Dr. John H.-T. Luong for enabling me to
undertake this research project in his laboratory at the Biotechnology Research Institute (BQ. His
advice and criticism was much appreciated. Furthemore, 1 extend my deepest gratitude to Dr.
Brian T. Dnscoll for believing in me and for his continued guidance throughout the past two years.
1 am indebted to the members of both the Macdonald Campus laboratory (Marc Dumont, Luigi
Marcangione, Sergey Dymov, and Fred D'Aoust) and the BR1 biosensor group (Tracey Rigby,
Abdelkader Hilmi, Keith Male, Hamid Nazari, An-Lac Nguyen, Coralie Saby, and Pime
Bouvrette) for their continued technical assistance and social persistence. I am particularly grateful
to Keith Male for proof reading my thesis and making many important suggestions. A special
mention rnust be made of - soon to be - Dr. David Juck for his suggestion of, and assistance in, 18s
rDNA sequence analysis. 1 must also thank Wayne Levadoux and Denis Bourque for technical
assistance and the supply of many chemicals; and Maria Oliver for supplying steriüzed filters and
free tea. 1 am indebted to Francis Gauthier for his kind supply of effluents and responses to
questions. Both Francine Landry and Marie Kubecki were completely wondef i with me and their
secretarid expertise is deeply appnciated. 1 also thank my many friends at BR1 for making the last
few years fun, even through the tough times. 1 wish to extend my appreciation to Dominic Frigon
for introducing me to Dr. Drixoll and for k i n g a fnend. 1 am also gratehil to Caroline Bonan for
many intellectual conversations and for urging me on. My good fiiends David Assayag, Les Hollic,
Peter Wong, Nick Kollias and R6zsa Attila are noted for their moral support throughout this
venture. An extraordinary thanks goes out to my parents (without whom 1 would not have even
attempted this endeavour) and siblings for "encouraging" me over the years. 1 also thank Misty for
k i n g Misty. Special recognition goes out to Pierre Bouvrette for al1 the laughs, the lunchtirne
hockey, for always i i s te~ng, pour le résum6, but most of ail for giving me a start. Finally, a
h e d e l i gratefulness is extended to Toula Xanthakos for being there for me always.

Standard BODs Technique
OxygenBad BOD Biosensors
Mediated Amptxomeüic Biosensors
Cyclodextrins as Solubilizing Agents for Redox Mediators
Characterization of Yeast Strains

2.1 Yeast Isolation
2.2 Yeast Characterization
2.2.1 Physiological and biochernical characterization
Vegetutive ntorphology in liquid and on solid media Formation of pseudomycelim and mycelium Fonnatrùn of bullistospores Charucterkiübn of usci and ascospores Carbon asSunilmion tests Fenttentaîion of carbon sources Growth a? high temperatures Acid production from glucose Diazonium blue B test Vitamin ji-ee growth Growth in high osmotic pressures Starch test Cyclohexrmi& resistance Assimilation of nitrogen compoundF
2.2.2 Fatty acid analysis
2.2.3 18s rDNA sequence analysis
Genomic DNA preparation PCR mplijication - Phylogeetic analysis
2.3 Biosensor Design
2.3.1 Oxygen electrode-based biosensor
2.3.2 Mediator-based biosensor
2.4 Yeast Cultivation and Electrode Preparation
2.5 Mediator Screening via Cyclic Vol-try
2.6 Biosensor Optimization

Mediator concentration optimization
Mediator tomCity evaluation
Optimal yeast loading
Preconditioning of electroàe
pH response range
Temperature response range
2.7 Standard Solution Cali bration Curve
2.8 Measurement of Pulp Mill Effluent
2.8.1 BOD5 measurernent
2.8.2 Linear response range to Thurso effluent
2.8.3 Measurement of various effluents
2.9 Determination of Biosensor Operating Li fe
~ S ~ T S AND DISCUSSION
3.1 Yeast Characterization
3.1.1 Physiological characterization
3.1.2 Fatty acid analysis
3.1.3 18s rDNA sequence analysis
3.2 Mediator Screening
3.2.1 Effect of cyclodextrin on GGA response
3.3 Biosensor Optirnization

Mediator concentration optimization
Optianal yeast loading
Preconditioning of electrode
Preconditioning via starvation Precuditioning via incubation with 50 % esluen?
pH response range
Temperature response range
3.4 Standard Solution Calibration C w e
3.4.1 GOA caiibration using potassium ferricyanide
3 A.2 GGA calibration using hydroxymethylfemcinium
3.5 Measurement of Pulp Miii Effîuent
3 .S. 1 Linear response range for Thurso effluent
llnear response range &g porassium fernrncyanule mediarion Lineor response range &g hydroxymethyIferncinim rnediaîion
3.5.2 Measurement of various effluents
Reproducibiliiy wirhUI efluen? samples Correlation of sensor BOD value with BODs value
3.6 Determination of Biosensor Operating Life

BOD bp CD CV DBB DMFe DMFe DNA GGA GPY Hanes plot HMF HMF+ hp-&CD !P ' pc Ks ME min MWCO PBS PCR PD PPm RNA rRNA S
SI TE TMB TrF v1 vmax Y M
biochemical oxygen demand base pair c yclodextrin cyclic voltammeüy diazonium blue B dimethylfenooene dimethy lferricinium demxyribonucleic acid glucose-glutamic acid glucose peptone yeast extract [substrate] 1 velocity versus [substrate] hydmxymethy Ife~focene hydrox ymethylfemciniwn hydroxyprop yl-8cyclodextrin anodic peak current cathodic peak cumnt reaction constant: 1 x-interoept 1 malt extract minute(s) molecular weight cut-off phosphate b a e r saline polymerase chah reaction porno dexmse parts per million (ms) ribonucleic acid ribosomal RNA
* second(s) similarity in&x Tris EDTA (ethylenediaminetetraacetic acid) tetramethylbenzidine tetrathiafulvaiene variable region 1 maximum velocity (current): & 1 y-intercept yeast malt extract

2.1 List of chernicals used in physiological characterization
3.1 Surnmary of physiological and biochernical characterization
3.2 Summary of carbon assimilation and fermentation tests for SPT 1
3.3 Surnrnary of carbon assimilation and-fermentation tests for SP'I2
3.4 Summary of results from the various characterization techniques
3.5 Results of mediator screening
3.6 Correlation of sensor BOD value with BODs value

Schematic of electron shuttiing
Schematic of cyclodextrin
Clustal X sequence alignment for SPï1
Clustal X sequence alignment for SET2
Dendrogram for two isolates and closest identity matches
Cyclic voltarnmograms for sensors using potassium femcyanide . Cyclic voltammograms for sensors using hydroxymethylfemcinium
Optimization of potassium femcyanide concentration
ûptimization of hydroxymethy Wemcinium concentration
Optimization of yeast Ioading
Sensor preconditioning via starvation
Sensor preconditioning via 50 8 Thurso effluent incubation
pH operational range for sensor
Temperatue operational range for sensor
Standard solution calibration curve using potassium femcyaniâe
Linear response range to standard solution with potassium ferricyanide
Standard solution calibration curve using hydroxymethylfemcinium
Linear response range to standard solution with hydroxymethylfemcinium
Linear response range to effluent using potassium femcyanide
Linear response range to effluent using hydroxymethylfemcinium
Response reproduci bility for SiTl sensor
Response reproducibility for SPT2 sensor
Service life of sensors

The objective of this research was to develop and optimize a mediated biosensor system
which cm rapidly and accurately measure the biochemical oxygen demand (BOD) of pulp mill
wastewater. The biosensor must have good reproducibility, high sensitivity, broad response range,
long service and storage life, and be simple to operate. Such a biosensor would allow for improved
process optimization and management of effluent treatment. Currently, the standard BODs analysis
is laborious, time-consurning, and poorly reproducible.
There have been numemus attempts to create a BOD biosensor which can meet these critena,
based on the use of a Clark-type oxygen electrode. These BOD biosensors retain microorganisms
on the surface of the electroâe, and measure changes in oxygen concentration at an applïed potential
of approximately +600 mV. An important limitation associated with oxygen-based BOD biosensors
is the lack of a suitable response range, owing to the finite concentration of oxygen present in a
given sample (0.4 mM). Also, fluctuating oxygen concentrations in the measuring sample can
mate artifacts.
Second generation biosensors (mediated biosensors) make use of small organic compounds
or mediators such as ferricyanide, ferrocene, and tetrathiafulvalene to shuttle electrons from the
redox centre of reduced microbial enzymes to the surface of an electrode. Electron flow, measured
as a current increase, is proportional to the substrate concentration in the sample. In addition to
reducing electrochernical interference, mediated biosensors have improved reliability becaue the
errors caused by variability in dissolved oxygen concentrations are eliminated. The biosensors
developed here measured substrate metabolism rather than the change in oxygen concentration.
Two yeast strains isolated from pulp mill effluent in Thurso, Quebec, were used as the
biological component of biosensors developed in this study. A secondary objective was the
identification of the isolates. Characterization was done via standard physiological and biochemical
tests. long-chain fatty acid analysis, as well as small subunit rRNA (18s rRNA) gene analysis.
1
1.1 Standard BODs technique
Pdp mil1 wastewater is comprised of a complex mixture of hundreds of compounds (Dence
and Reeve, 1996; Suntio et al., 1988). Over 400 individual compounds have been identified.
While the majonty of the compounds characterized have a molecular weight of less than 1000
glmol, most compounds in wastewater have a molecular weight >IO00 (Dence and Reeve, 1996).
Characterization of pulp miil effluent is difficult because Little is known about effluent composition
and because effluent composition changes over time depending on the type of wood king
processed, the pulping procedure, and the degree of wastewater treatment (Dence and Reeve. 19%;
Lloyd et al., 1997). The release of untreated effluent containing the degradation products of
hemicelluloses and lignin creates an increased oxygen stress on receiving waters caused by organic
compounds. Most dissolved organics are generated during the pulping and bleaching treatment
stages (Dence and Reeve, 1996; Lloyd et al., 1997). Carbohydrates, carboxylic acids and lignin
make up 67-87 % of the dissolved organic carbon found in the pmcessing of hardwood kraft pulp.
Ristolainen and Al& (1998) found chat the wood sugar xylose accounted for 93% of the
carbohydrate fraction.
The biochemical oxygen demand (BOD) test is a standardized laboratory procedure designed
to masure the oxygen requirements in waters receiving organic pollutants (Greenberg, 1992). It is
an estimation of the amount of oxygen consumed by bactena and protoma during the total
biodegradation of organic matter (carbonaceous) and the oxidation of inorganic reducing solutes
(sulphides and ferrous iron). A common modification of this procedure called the BOD, is a
universaMy accepted parameter for the determination of organic pollution concentration in
wastewater and has ken in use since 1936 (LcBlanc, 1974). The BODS value expresses the
oxygen consumption in a sample kept in the dark at 20 'C for 5 days. The decrease in oxygen
concentration is directly proportional to the concentration of biodegradable organic compounds in
2

the effluent (Chan et al., 1999). Thus the BODS test dlows for an index of the concentration of
biodegradable organic compounds in wastewater ('Tan et al., 1993). Ideally, potable waters should
have a BOD5 value of zero, however, wastewater from pulp mil1 sources can have a BOD5 value as
high as 20 000 - 30 000 mg/L (Li et al., 1994).
The major disadvantage of the BODS test is that the procedure requires 5 days to evaluate the
oxygen demand imposed by a given wastewater, thus allowing for no feedback infoxmation for
irnmediate wastewater process control. The 5-day BOD test was not designed for on-line
monitoring, but rather to assess the effect of pollutants on the oxygencanying capacity of receiving
waters (LeBlanc, 1974). nie BODS test is laborious, time-consuming, and dependent on the skiii
of the operator. The accunicy of BODS measurements can vary from 15-508 depending on the
microbial environment (i.e. temperature, oxygen concentration, toxicants, etc.) and the response of
the microbial seed to it, and has an inherent error of over 10% (Chee et al., 1999; Li and Chu, 1991;
Fitzmaurice and Gray 1989; Kanibe 1977; Riedel et al 1990). On-line estimation of organic
compound concentration requins a simple and reproducibk method to enable for pollution control.
The standard BOD5 test cannot meet these c~iteria.
1.2 Oxygen electrode-based BOD biosensors
To date, researchers have been attempting to improve upon the standard BODS
measurement. These attempts have included shortening the incubation time and raising the
temperature; correlation of BODJ results with various other tests such as the chemical oxygen
demand, or total organic carbon; increase of the inoculation size or using specialized inocula.
Unfortunately, these modifications have al1 suffered h m a lack of repmducibility (LeBlanc, 1974).
Thus far, the most promising improvements have corne from the field of biosensor technology
(Riedel et al. 1998).
Biosensors are composed of a biological component (biocataiyst) and a transducer (Le.
electrode) which cm convert the chernical signal of the biocatalyst into a quantifiable electmnic one
3

(Reiss et ai., 1998). In BOD biosensors, rnicrobiai ceUs (bacteria or yeasts) are prwlominately useâ
as the biocatalyst (Racek, 1995). Whole cells are preferred over enzymes since the complex mixture
of compounds found in effluent precludes the use of enzyme based biosensors. The fust sensor for
BOD measurement was developed in 1977 (Karube et ai., 1977). Since then the vast majonty of
BOD biosensors have been based on arnpemmetric oxygen electrodes. Over the past 23 years,
many different rnicrwrganisms have been used as biocatalysts. A short list of some of these BOD
biosensors c m be found in Riedel et al. (1998) and Racek (1995).
Oxygen based BOD biosensors are all sirnilar in design in that the biological component is
sandwiched between a semipermeable outer membrane and a gas permeable inner ~e f lon"
membrane covenng the seasor (Riedel, 1998). The membranes and microorganisms are often held
in place by a rubber O-ring. T&e are two types of measuring systems in which the oxygen based
biosensor can be used. Biosensors cm be used in "batch" systems where the measurement is made
in a stirred charnber to which the subsaate is added, or in a flow-through system which allows for
continuous substrate monitoring (Riedel, 1998).
Since BOD determinations are based on the change in oxygen concentration at the surface of
the electrode, precise measurement of BOD levels depends on stable and sufficient oxygen
concentrations. A fluctuating oxygen concentration can introduce poor repducibility while a low
oxygen concentration can prohibit the complete masurement of oxygen consumption (Racek, 1995;
Riedel 1998). Most oxygen electrodes consist of a solid platinum cathode and a silver anode. Once
the potentiai has been applied, oxygen is selectively reduced at the cathode (Kanibe and Nakanishi,
1994):
cathode: O2 + 2H20 + 4e- - 40H- anode: 4Ag + 4Cl- - 4AgCl+ 4e-

The electrode measures the oxygen concentration present at the interface between the
electrode and the microbial layer. The oxygen reduced at the cathode creates an oxygen
consumption cun-ent displayed as the base line or steady-state current. Upon addition of the effluent
to the rnixing chamber, the mdily biodegraàable compounds are oxidized by the rnicroorganisms,
causing an increase in their respiration rates. This causes a reduction in the oxygen concentration
difiùsing to the elatrode, which is reflected by a rapid decrease in the cumnt and the establishment
of a steady-state. The difference between the two steady-states is proportional to the concentration
of readily biodegradable compounds in the sample (Riedel, 1998). BOD biosensors are generally
calibrateci with a glucose and glutamic acid (GGA) standard solution. The linear portion of the
calibration curve is used to calculate the BOD value of the wastewater sample. Owing to the short
exposure tirne, the sensor BOD results represent the oxidation of only readily degradable
compounds. Consequently. BOD biosensor results are not considered true BOD5 values but rather
represent a BOD index which can be correlated to BOD5 results (Marty et al., 1997; Praet et al..
1995; Riedel, 1998; Tanaka et al., 1994).
The BODs values determined for various wastewaters, including municipal and industrial
sources, indicate that the best biosensor/BOD, correlations corne from untreated wastewater
emanating h m fermentation and food plants. It is believed that this is due to the abundance of
easily assimilateci compounds (Riedel, 1998; Tanaka et al., 1994). Li and Chu (1991) suggested
that in order to expand biosensor application to many different types of wastewaters, it is necessary
to use biocatalysts isolated fkom the substrate to be rneasured. However it was shown that substrate
specificity can be improved simply by preincubating (or preconditioning) the mimbial electrode in a
buffer containing some of the wastewater to be rneasured (Princz and Olah, 1990; Riedel, 1990, Tan
et al., 1993).
There is a great variation in performance between the many biosensors developed thus fa .
The average linear range (detemined using the standard solution) ' of these biosensors is
approximately 10-80 f 40 mgL BOD (Yang et al., 1996). A good list of these results can be found
5

in Riedel (1998b). Recently, the yeast Arxula adeninivorans has been used to develop a BOD
biosensor which yielded an excellent measuring range of 2-550 mgL BOD (Chan et al., 1999;
Riedel, 1998). Other authors have concentrated on developing a biosensor which is capable of
detecting BOD concentrations dom to 0.2 or 0.5 mgL (Chee et al., 1999; Yang et al., 1996). One
consequence of the later type of biosensor is the tendency for a short lifetime. The majonty of BOD
biosensors have good stability for about one month (Riedel 1998), however these low BOD
biosensors lasted for only 3- 10 days (depending on storage temperature). When batch measunment
techniques are used, the average response time is about 20 min. Measuring the slope of the
response (dynamic transient technique) allows for measuring times as low as 30 s (Yang et al..
1996). Other important factors detemiining the measuring time include the concentration of the
sample, quantity of organisms, and the organisms used. Generally, the higher the BOD
concentration, and the more microorganisrns immobilized, the longer the response time. This is
largely a consequence of the rate of substrate diffusion and assimilation (Chan et al., 1999; Li et al.,
1994; Tanaka et al., 1994).
The choie of microorganism can have an important effect on biosensor performance. Since
most wastewater is compriscd of numerous compounds, it is desirable to use a microbe with a
broad substrate spectnim to aüow for the assimilation of the many different compounds present in
wastewater. This results in an expanded working range and improved comlations with BOD5
values (Chan et al., 1999; Racek, 1995; Reiss et al., 1998; Riedel et al., 1998; Sangeetha et al.,
19%). In an attempt to achieve these qualities some researchers have used mixed populations of
microorganisrns as the biocatalyst (Karube et al., 1977; Strand and Carlson 19W, Tan et al, 1992).
However. this has nsulted in poor reproducib'ity due to population variation (Chan et al., 1999).
In order to reduce this variability and increase the fraction of compounds measund in wastewater
most researchers have focused on the use of a single species with a broad substrate range (Chan a
al., 1999; Sangeetha et ai.. 1996). Using A m l a adeninivoram , Riedel's group (1998) was able to
obtain a reproducibility of f 5% for penods of over one month. A survey of several BOD
6

biosensors indicates that the precision can Vary from 3% to 10% with a mean of 6% (Riedel 1998).
The current state of BOD biosensor technology allows plenty of room for improvement.
There have k e n improvements in some performance factors such as detection limit (Chee et al.,
1999; Yang et al., 1996). temperature range (Katube et al., 1989), pH range (Kim and Kwon,
1999). and Iinear response range (Riedel et al., 1998). However, current BOD biosensors still have
insufficient stability (as compared to standard chernical and physical techniques) to allow for
practical application (Praet et al, 1995). Ihn et al. (1992) pointed out that biosensors are not suitable
for BOD measurement when wastewater is pnmarily comprised of high molecular weight
compounds. These compounds can be assimilatexi over the course of 5 days via BOD5 testing, but
not by the microbes immobilized on the biosensor. In order to overcome legislative restriction
preventing replacement of the standard BODS technique, improvements are needed that would create
a biosensor with increased reproducibility, selectivity, sensitivity, linearity as well as stability
(Riedel 1998).
1.3 Mediated amperometric biosensors
Amperometric biosensors based on oxygen monitoring are classified as fvst generation
biosensors (Moody and Thomas 1991). Major limitations associated with fint generation
biosensors include a limited response range owing to the low solubility of oxygen in water, and
fluctuating oxygen concentrations leading to poor reproducibility. Second generation biosensors
make use of low molecular weight redox couples d e d mediators which shuttle electrons h m the
redox cenuie of reduced enzymes to the surface of an electrode (Figure 1.1). In whole ce11 sensors,
mediators act as electron acceptors which replace oxygen as a cofactor for many enzymes (Le.
glucose oxidase). The main reason for using mediators is to overcome the dependence on oxygen
concentration for sensor response and thus to increase the Linear response range beyond the point of
oxygen saturation. When whole cells are used, mediators are reduced by mimbial enzymes as they
substitute for the natural electron acceptor dwing substrate metabolism. The reduced mediator is
7
subsequently re-oxidized after diffusing to the surface of the electrode. The electron flow is
meas& as a curent increase, and is proportional to the organic compound concentration (Hobson
et al., 1996). In addition to eliminating many electrochemical interferants, mediated biosensors
operating at low potentials allow for improved reliability via the elimination of errors caused by
fluctuations in the dissolved oxygen concentration. Furthemore, mediated electrodes cm produce
higher response signals han conventional oxygen or hydrogen peroxide based electrode sensors
(Ge et al., 1998). Some important properties of g d mediators used in mimbid sensors include:
(1) the ability to be rapidly reduced by the microorganism and re-oxidized at the electrode; (2) stable
and rexersible kinetics under different assay conàitions (i.e. pH, temperature); (3) low oxidizing
potential thus eliminating interference from oxygen and other electrochemically active compounds
(Moody and Thomas, 1991; Roller et al., 1984).
The simplcst fom of amperomeûic sensor is compnsed of two electrodes, a working
e1ectmd.e and a combined reference/counter ekctrode. However a three electrode systemimparts
higher stability and is preferred for more sensitive measurements (Hobson et al.. 1996).
Ampemmetric sensors have an extemal circuit and measurements are based on the change in current
proàuceà at a working electrode poised at a defined potential (Atkinson and Haggen, 1993; Hobson
et al., 1996).
With the development of second generation biosensors many different mediators have been
evaluated. The majority of research has been done on enzyme-based electrodes rather than those
using whole cells. Benzoquinone was the k t mediator used to replace oxygen. Its lower redox
potential (+ 400 mV versus a saturated calomel electrode) reduced the effects of ekctmactive
interferants ( M d y and Thomas, 1991). Although initiaily attempted with rnimbial cells, the use
of quinone as a mediator has since waned. This is likely a consequence of the deleterious effects
lipophilic mediators. such as benzoquinone, have on the senrice Lifc of biosensors (Rawson et al.,
1 989). Other mediators used in rnicrobial sensors incl ude various benzoquinone derivatives
(Takayama et al., 1996); azo dyes (Keck et al., 1997); phenazine methosulfate,
8

Su bs trate (Red.)
Product m.)
glassy carbon electrode
Figure 1.1 Schematic representation of electron mediation between yeast cellular enzymes and an electrode using potassium femcyanide mediation where Red. and Ox. refer to reduced and oxidized States, respectively.

dichlorophenolindophenol, femcyanide, ferrocene, tetrathiafulvalene, tetracyanoquinodimethane
(Kaliib and Skliidal, 1994); benzyl viologen, thionine, gallocyanine, phenazine ethosulphate,
resorufin, etc. (Roller et al., 1984). While many different mediators have been evaluated, many
different microorganisms have been used as weil. A general conclusion that has been reached is that
mediator-microorganism interactions are very diverse and cannot be accurately predicted, therefore
making the selection of suitable combinations difficult (Roller et al., 1984).
Water soluble mediators such as organic dyes and potassium femcyanide were initiaily
preferred. However organic dyes do not fulfil al1 the required critena for good mediation in that
they can be unstable and c m autoxidize, have pH dependent redox potentials. and do not exhibit
good reversible electrocheniistry (Hill et al., 1990). Potassium femcyanide was one of the fmt
mediators used successfully and exhibits good electron transfer properties (Bennetto et al., 1983).
It is stilI in frequent used today despite the disadvantages of its high working potential and dative
ineficiency (Svitel et al., 1998). Recently, the emphasis has shifted to the use of water insoluble
mediators. Many of these have redox potentiais well below that of most e1ectrochemicaliy
interfering compounds m i i b and Skladal, 1994; Svitel et al., 1998). Water insoluble mediators
must be immobilized at the surface of the working electrode instead of k i n g added to the buffer
solution. This type of heterogenous application uses immobilization schemes such a s
physisorption, chemisorption. polymer-film deposition and paste blending (Luong et al., 1995).
These biosensors have met with limited success owing to problems of low sensitivity and limited
reusabiiity due to mediator leakage (Luong et al., 1995). Aaempts at alleviating these problems by
chemically derivatized mediators such as ferrocene have met with limited success. One such
derivative, carboxyfemocene. exhibiteci impmved solubility but also had a higher redox potential
thus creating the psibility of interferences (Hill and Sanghera, 1990). Another drawback of using
derivatized water-insoluble mediators stems from the use of potentialiy toxic organic solvents -CO
solubilize them (Luong et al., 1990).
1.4 C yclodext rins as solubilizing agents for redox media tors
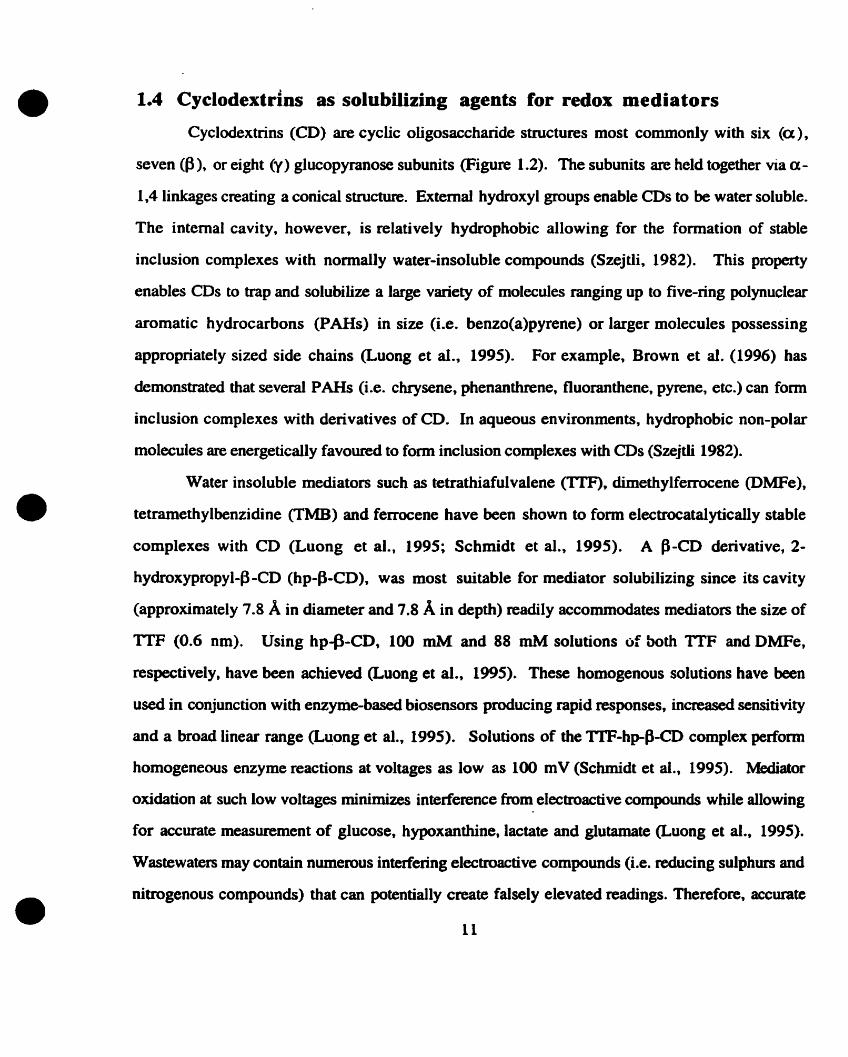
Cyclodextrins (CD) are c yclic oügosaccharide structures mos t commonl y wi th six (a ) ,
seven (0 ), or eight (y) glucopyranose subunits (Figure 1.2). The subunits are held together via a-
1,4 linkages creating a conical structure. Extemal hydroxyl groups enable CDS to be water soluble.
The intemal cavity, however, is relatively hydrophobic allowing for the formation of stable
inclusion complexes with nonnally water-insoluble compounds (Szejtli, 1982). This property
enables CDS to trap and solubiiize a large variety of molecules ranging up io five-ring polynuclear
aromatic hydrocarbons (PAHs) in size (i.e. benzo(a)pyrene) or larger molecules possessing
appropnately sized side chahs (Luong et ai., 1995). For example, Brown et al. (1996) has
demonstrateci that several PAHs (Le. chrysene, phenanthrene, fluoranthene, pyrene, etc.) can form
inclusion complexes with derivatives of CD. In aqueous environments, h ydrophobic non-polar
molecules are energetically favoured to form inclusion complexes with CDS (Szejtli 1982).
Water insoluble mediators such as tetrathiafulvalene FF), dimethylferrocene (DMFe),
tetramethylbenzidine (TM.) and ferrocene have been shown to form electrocatalytically stable
complexes with CD (Luong et al., 1995; Schmidt et al., 1995). A p-CD denvative, 2-
hydroxypropyl-0 -CD (hp-f3-CD), was most suitable for mediator solubilizing since its cavity
(approximately 7.8 A in diameter and 7.8 A in depth) readily accommodates mediators the s i x of
TTF (0.6 nm). Using hp$-CD, 100 mM and 88 mM solutions of both TTF and DMFe,
respectively. have been achieved (Luong et al., 1995). These homogenous solutions have been
used in conjunction with enzyme-based biosensors producing rapid responses, increased sensitivity
and a broad linear range (Luong et al., 1995). Solutions of the ITF-hpfbCD complex perform
homogeneous enzyme reactions at voltages as low as 100 mV (Schmidt et al.. 1995). Mediator
oxidation at such low voltages minimizes interference from electroactive compounds while allowing
for accurate measurement of glucose, hypoxanthine, lactate and glutamate (Luong et al., 1995).
Wastewaters may contain numemus interfering electroactive compounds (i.e. reducing sulphurs and
nitrogenous compounds) that can potentially create falsely elevated readings. Therefore, accurate
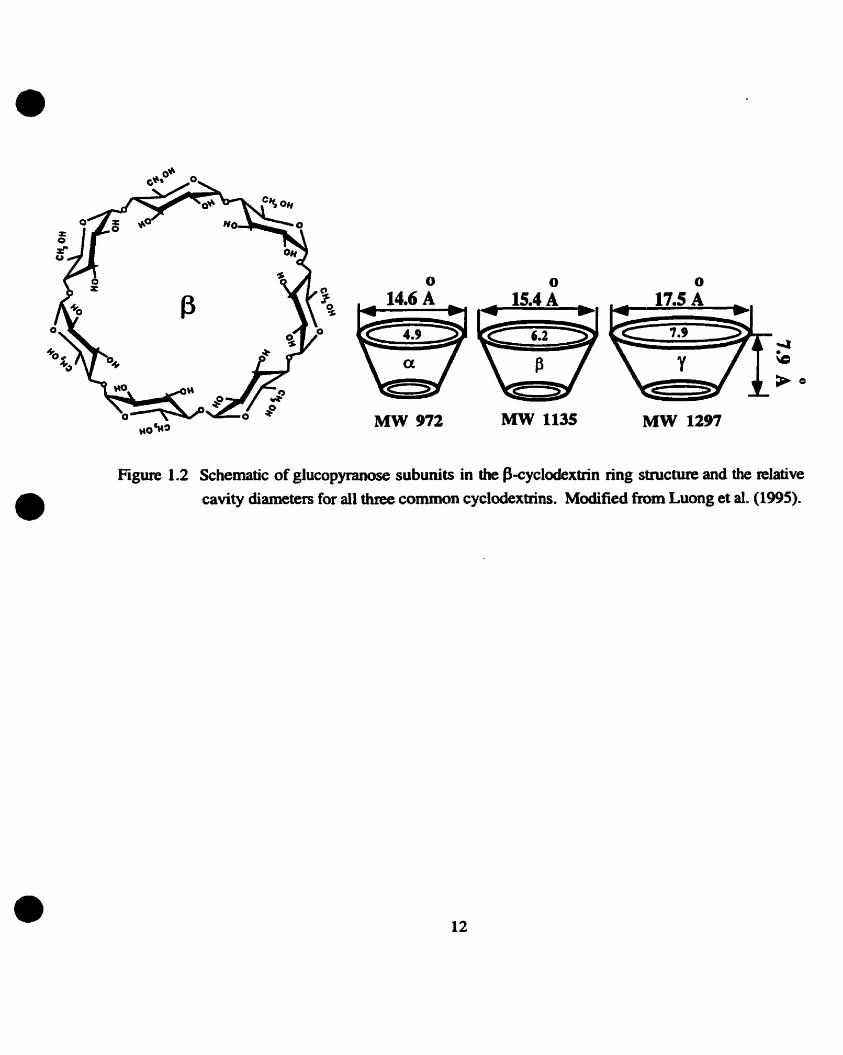
Figure 1.2 Schematic of glucopyranose subunits in the fkyclodextrin ring structure and the relative cavity diameters for dl three common cyclodextrins. Modified from Luong et al. (1995).

mediated biosensor measurements of wastewater should optimally be camied out at the lower
applied potentiais pennissible with water insoluble mediators. Water insoluble mediators may be
solubilized by CD in the presence of mimbial cells without any deleterious effects.
1.5 Characterization of yeast isolates
Functional constraints in the ribosomal RNA (rRNA) gene have resulted in some of the most
evolutionary conserved sequences in al1 living s ystems. These " universail y conserved" regions
have rernained unchanged for billions of years as they are cntical functionai domains established in
the earliest ancestors (Sogin and Gunderson, 1987). Highly conserved regions can be found in ali
phylogenetic domains thus leading to the identification of "universal" sequences and "signature9'
sequences for the Archaea, Bacteria, and Eukarya (Head et al., 1998). The ubiquity of rRNA
allows for examination of phylogenetic relationships between diverse organisms via comparative
sequence analysis (Head et ai., 1998).
The lack of sequence variation within the highly conserved regions means that liüle
information on evolutionary diversion can be gleaned from them. Accurate determination of both
close and distant phylogenetic relationships requires random sequence changes over time. Such a
molecule can be considered a chronometer. For a molecule to be a usefui chronometer it must
exhibit (1) random sequence changes. (2) a commnsuniie nite of mutations over t h e , (3) enough
size to provide adequate information (Woese, 1987). The small subunit rRNA (18s rRNA) has
become the favoured gene for phylogenetic comparison. It is approximately 13 times longer than
the 5.8s rRNA subunit, ranges in size from about 1700 to 2300 base pairs, and exhibits all the traits
of a good chronometer (Head et al., 1998; Sogin and Gunderson, 1987; Woese, 1987).
Rapid sequencing strategies based on the interspersion of moderate and high variability
regions throughout the "unive~sally conserved" regions have ~ecently been developed. ''Universal"
pnmers homologous to highly conserved sequences at the 5' and 3' end of 18s rRNA permit the
specific amplification of nearly complete 18s rRNA (Head et al., 1998). Amplification can be done
13

via the polymerase chain reaction (PCR), eliminating the need to use an Ml3 cloning and
sequencing system (Sogin, 1990). This technique allows for the amplification of just a few
nanograrns of bulk genomic DNA into several micrograms of 18s rRNAlPCR product (Sogin,
1990). Errors during PCR amplification range h m one to five positions per 100 base pairs when
compared to genomic clone amplification (Sogin, 1990). .One strategy employed to reduce these
potential emrs is the direct sequencing of the PCR products via double-stranded DNA procedures.
This technique makes early base pair mismatches seem ambiguous while late errors do not
contribute to sequence interpretation (Sogin, 1990). Once the sequence (complete or incomplete)
has been obtained, phylogenetic analysis can be easily done via sequence cornparisons to thousands
of sequences available at various databases.
Most authors now believe that, due to the inherent weaknesses in the procedures
traditionall y used for yeas t identification, the present yeast taxonomy poorly reflects the true
evolutionary relationships between organisms . Conventional yeast taxonomy based on
morphological and physiological traits can lead to incomplete or emneous conclusions (Valente et
al., 1999). Owing to strain variability, phenotypic and mtabolic characteristics are sometimes not
sufficient to allow for species delineation and therefore accurate strain identification (Barns et al.,
199 1; Mannarelli and Kurtzman, 1998; James et al.. 1998). Consequently, 18s rDNA anaiysis has
becorne increasingly relied upon for accurate strain identification because it offers a higher level of
nsolution (close and distant nlationships can be resolveà) (Valente et al., 1999). The case and
rapidity of strain identification via partial sequencing has made it very common. however, its
effectiveness depends heavily on the quality of the chosen region (Valente et al., 1999). One
important limitation is that complete 18s rDNA sequence information for many species is not
available. This can lead to false or inconclusive results for less co~ll~llonly studied speciies (van de
Peer and Wachter 1995). The objective of using 18s rDNA sequence analysis was to impmve
strain characterization and identification of the two newly isolateà yeast strains.
MATERIALS AND METHODS
2.1 Yeast Isolation
Two yeast strains. designated as SPT'l and S m , were isolated from the pnmary clarifier
effluent at a pulp mil1 plant in Thurso, Quebéc. Isolation was achieved by a combination of
techniques described by van der Wait and Y m w (1984). The conditions included the following:
acidic medium (pH 3 S), an elevated glucose concentration (40%). and a low growing temperature
(15 OC). A 250 mL flask containing 50 mL of bacto-yeast malt extract (YM) broth (Difco
Laboratones, Detroit, MI) was inoculated with 5 mL effluent and subjected to rotary shaking at 240
rpm for 3 days. The resulting microbiai culture was then streak purified on YM @ifco
Laboratones, Detroit, MI) and glucose-peptone-yeast extract (GPY, prepared according to the recipe
of van der Wdt and Yarrow, 1984) agar plates. Al1 media and glassware were sterilized in an
autoclave for 20 min at 12 1 OC, 15 psi before use. Strains were maintained on both YM and GPY
agar plates, and colonies were transferred monthly. Frozen cultures of both strains were kept at
-80 "C in 10 % gylcerol.
2.2 Yeast Characterization
2.2.1 Physiological and biochemical characterization
Vegetative rnorphology in liquid and on solid media
Tests to characterize the vegetative morphology of both strains were based on those given by
van der Walt and Yarrow (1984). Growth in both liquid and solid media was examined. For
growth in liquid mdia the strains were grown in both malt extract (ME) and 4% glucose-peptone-
yeast extract (GPY - prepared according to van der Walt and Y m w 19û4). Characteristics such as
ce11 shape. mode of reproduction, ce11 encapsulation. ce11 size. cultural growth pattern and shine,
surface growth, and odour were observed for liquid media. Growth on solid media enableci

description of colony charactenstics (i.e. texture, colour, surface. elevation, margin). Potato
dextrose (PD) and ME agar was used as colony morphology media.
Formation of pseudomycelium and mycelium
According to the methods given by van der Walt and Yarrow (1984). the Dalmau plate
technique was used to examine the formation of pseudomycelium and true mycelium. Potato-
glucose agar was used as the medium and prepared as described.
Formation of ballistospores
The Do Carorno-Sousa and Phaff technique as outlined in van der Walt and Yamiw (1984),
was used to check for ballistospore formation. A modification was made in the use of PD agar in
place of corn meal agar as the growth medium.
Characteriration of asci and ascospores
The Schaeffer-Fulton staining procedure
described by van der Walt and Yarrow (1984).
growth restrictive agar, potato-dextrose agar, 2%
was used to venfy asci and ascospores, as
Sporulation media included Gorodkowa agar.
malt extract agar, McClary's acetate agar, YM
agar, and VS agar. Al1 agars were prepared according to the recipegiven by van der Walt and
Yarrow.
Curbon assimilation tests
Carbon assimilation testing was initiaily done in both liquid and solid media as described by
van der Walt and Yarrow (1984). After initial ambiguous results with the solid media al1 further
tests were conducted in liquid media. Liquid media was contained in sterile 150 x 16 mm test tubes
(Corning Inc., Corning, NY) stoppered with polyurethane foam plugs (Identi-Plugs, Jaece
Industries, Inc. North Tonawanda, NY). Test results were foliowed over a course of three weeks

and scored according to the criterion provided on page 82 of van der Walt and Yarrow. Al1 tests
were initially carried out in sets of two, whenever weak or ambiguous results occurred the
experiments were redone in triplicate. Al1 carbohydrates were of analytical grade. Please refer to
Table 2.1 for details regarding carbon sources.
Fermentation of carbon sources
Carbohydrate fermentation tests were carried out in sterile 150 X 16 mm test tubes
containing inverted Durham tubes and stoppered with polyurethane foam plugs. The fermniation
tests were c d e d out and scored according to the method described by van der Walt and Yarrow
(1984). Bromothymol blue (Anachemia, Montréal, Quebec) was used as the indicator dye.
Experiments were camïed out in quadruplicate. Six carbohydrates of analytical grade (galactose,
glucose, lactose, maltose. raffinose, sucrose) were used in this test.
Growth at high temperatures
Growth on solid media was monitored at 37 "C and 42 'C as described by van der Walt and
Yarrow (1984). Petri dishes containing both Y ' and ME agar were used. Maximum temperatUrie
of growth was not detennined.
Acid production fiom glucose
A 5% glucose - 0.5% calcium carbonate (Anachemia, Montr6al. Québsc) agar was used for
qualitatively determining the amount of acid produceci h m glucose, as described by van der Walt
and Yarrow (1984). The yeasts were grown on slants of this media and calcium carbonate
dissolution was monitored for a period of 10 &YS. Experiments were done in sets of five.
Diazonium Mue B test
The diazoniurn blue B (DBB) (Sigma, St. Louis, MO) test was perfonned on liquid and

Table 2.1 List of chernicals used in physiological characterization and their origin.
Chernical
0 1 L(+)Arabinose 02 L-Arabitol 03 Mutin 04 Cadaverine 05 Cellobiose 06 Citric Acid 07 Creatine 08 Creatinine 09 Dulcitol (Galactitoi) 10 Ethanol 1 1 Ethylamine 12 Erythritol 1 3 B-D-Fmc tose 14 D(+)Galactose 15 D-Gluconic Acid 16 D-Glucitol (Sorbitol) 17 D-Glucose 18 D-Glucosamine 19 D-Glucmnic Acid 20 Glycerol 21 DL-Lactic Acid 22 D-a -Lactose 23 L-Lysine 24 Maltose 25 D-Maruiitol 26 Mdibiose 27 D(+)Melezitose 28 Methano1 29 Methyl-a D-glucopyranoside 30 myo-Inositol 3 1 D(+)Raffinose 32 LRhamnose 33 Ribitol (Adonitol) 34 D-Ribose 35 Salicin 36 L-Sorbose 37 Starch (soluble) 38 Succinic Acid 39 Sucrose 40 D(+)Trehalose 4 1 D(+)Xylose 42 Xylitol
Sigma, St. Louis MO USA Sigma, St. Louis MO USA Sigma, St. Louis MO USA Sigma, St. Louis MO USA BDH Inc., Toronto Ont. Canada Anachemia, Montreal Qu& Canada Sigma, St. Louis MO USA Sigma, St. Louis MO USA Aldrich, Milwaukee WI USA prepared in the laboratory of Dr. C. Greer Sigma, St. Louis MO USA Aldrich, Milwaukee WI USA Sigma, St. Lwis MO USA Sigma, St. Louis MO USA Aldrich, Milwaukee WI USA Fisher Scientific, Nepean Ont. Canada BDH Inc., Toronto Ont. Canada AIdrich, Milwaukee WI USA Sigma, St. Louis MO USA Anachemia, Montreal Qué. Canada Sigma, St. Louis MO USA Anacheda, Montmal Que. Canada Sigma, St. Louis MO USA Sigma, St. Louis MO USA Anachemia, Montreal Qué. Canada Sigma, St. Louis MO USA Sigma, St. Louis MO USA EM Science, Gibbstown NJ USA Sigma, St. Louis MO USA Sigma, St. huis MO USA Sigma, St. Louis MO USA Si.gma, St. Louis MO USA Sigma, St. Louis MO USA Sigma, St. Louis MO USA Sigma, St. Louis MO USA Sigma, St. Louis MO USA Anachemia, Montreal Qué. Canada Aldrich, Milwaukee WI USA BDH Inc., Toronto Ont. Canada Sigma, St. Louis MO USA Anachemia, MonÛeal Qué. Canada Aldrich, Milwaukee WI USA

solid media as outlined by van der Walt and Yarrow (1984). Trichosporon cutmeurn was used as a
positive control.
Vitamin-free gro wth
The procedure described by van der Walt and Yarrow (1984) was used to determine whether
the two isolates exhibited vitamin-free growth. In the vitamin free medium D-tryptophan (Sigma,
St. Louis, MO) was used rather t h h DL-tryptophan. Tests were carried out in triplicate. Three
culture transfers, into fresh vitamin-free media, were made to verify that growth was not a
consequence of excreted nitrogenous compounds. Tests were scored in the sarne manner as carbon
assimilation tests.
Growth in high osmotic pressures
Tests for growîh in high osmotic pressures were carrieci out in both Liquid and soüd media
according to the procedures described by van der Walt and Ymow (1984). The Liquid media
containeci 596 glucose and 10% sodium chloride, while the solid media was comprised of three
concentrations of glucose (40, 50, 60%). Al1 tests were conducted in sets of five and carried out at
ambient temperatures (22 OC).
Starch test
The procedure and media preparation used for the monitoring of the formation of
extracelluar arnyloid compounds in liquid media is described in van der Walt and Yarrow (1984).
The reaction of the medium was maintained at pH 3. Tests were carried out in sets of five.
Reactions were dowed to mn ovemight to ensure there was no glycogen interference.
Cycloheximide resistance
The procedure for testing cycloheximide (Aldrich, Milwaukee, WI) mistance is describeci in
van der Walt and Yarrow (1984). Sterile 150 x 16 mm test tubes stoppered with polyurethane foam
19

plugs containing 100 ppm and 1000 ppm concentrations of cycloheximide were inoculated, and
incubated at 26 OC for ttuee weeks (240 rpm). Experiments were carried out in sets of five for each
concentration of cyclohexunide.
Assimilation of nitrogen compounds
The ability of the two yeast sîrains to utilize vanous nitrogen sources was venfied in liquid
media according to the procedure described by van der Walt and Yarrow (1984). The yeasts were
checked for growth in media with either nitrate or nitrite as the sole nitrogen source. Potassium
nitrate (Aldrich, Milwaukee, WI) served as the nitrate source and sodium nitrite (Aldrich,
Milwaukee, WI) was used as the nitrite source. The liquid media were contained in sterile 150 x 16
mm test tubes stoppered with polyurethane foam plugs. The basal carbon source (~acto@ yeast
carbon base Difco Laboratories, Detroit, MI) was filter sterilized with a 0.22 pm ~ i l l e x @ - ~ ~ filter
unit (Millipore, Mississauga Ontario) . Blank tubes contained only carbon base and no nitrogen
sources. A second set of tubes were loop inoculated from the First set to eliminate false positives
due to excreted soluble nitrogen sources. Nitrate reactions were confimeci by the chernical test for
nitrite. Tests were carrieci out in sets of three.
2-2-2 Fatty acid analysis
Fatty acid composition of two day old cultures (YM agar plates) for both strains were
analyzed by Microcheck, Inc. (Northfield Falls, VT). The microbial identification system included
gas chromatographie analysis (using five percent methyl phenyl silicone capillary columns) of fatty
acid composition via cornparison of the fatty acid profiles to the 7000 different profiles in the
database.

2.2.3 18s rDNA sequence analysis
Genomic DNA preparation
Genomic DNA was extracteci h m both strains using a two week old culture grown in YM
broth instead of the recommended YPD (yeast extract-peptone-dextrose) broth using a procedure
reported by Hoffman (1997). Sorne procedural modifications were made in this study: Cells were
broken via 4 cycles of freezeithaw lysis with temperatures ranging from 37 O C to
-70 OC, respectively, rather than by vortexing with glass beads; a second chloroform extraction
(400 pl) was added in the sixth step pnor to mixing with 100% ethanol; 70 % ethanol(500 pl) was
added at the tenth step pnor to dissolving in 10 mM Tris 1 mM EDTA (TE) buffer. The DNA was
extracted with phenol (500 pl) and then twice with chloroform (500 pl). Agarose gel
electrophoresis (on 0.8% agarose gel) based on the method described by Voytas (1997), was used
to visualize the extracted DNA.
To ensure that the genomic DNA fragments were ready for PCR amplification the two DNA
extracts were subjected to restriction analysis using HinàUI, utilising a procedure describeci by
Sambrook et al. (1989). The total volume of the reaction mixture was 10 pL, consisting of 5 pl of
DNA extract, 1 pL one-Phore-al1 buffer, 1 pL RNAase, and 3 pL of the HindIII restriction
. endonuclease (Phannacia Biotech, Baie à' Urfé, Québec). The reaction was done in a sterile 1.5
mL microcentrifuge tube for 3 h at 37 'C. After ihree hours, 2 pL of Tris acetate EDTA buffer was
added to the reaction mixture and the sample was electrophoresed on a 0.8 % agarose gel for 30-40
min at 100 mVlcm (Sambrook et al., 1989). The DNA was quantified according to the p d u r e of
Sambrook et al. (1989) using a Beckman DU 70 spectrophotometer (Beckrnan Coulter Inc.,
Fullerton, CA).
PCR amplification
T b universal fungal primers were used (NS3, NS4, NS6) to ampli@ a portion of the
nuclear small rDNA. The NS3 primer (GCAAGTCTGGTGCCAGCAGCC) was a 5' primer,

while NS4 (CITCCGTCAA'ITCCITTAAG) and NS6 (GCATCACAGACCïG1TA'ITûCCI'C)
were 3' primers. Detailed information for PCR amplification can be found elsewhere (Wlute et al.,
1990).
The PTC-100 PCR thermal cycler (MJ Research, Inc. Waltham, MA) was used for
arnpiification of the ribosomal RNA to eliminate the need for evaporation protection via minerai oil
addition (as suggested by White et al.. 1990). The cyciing panuneters were as follows: initial
denaturation for 2.5 min at 95 OC; annealing for 30 s at 55 OC; extension for 1.5 min at 72 OC;
denaturation for 30 s at 95 OC; and a final extension for 10 min at 72 OC. A total of 25 cycles were
carrieci oit. A 100 pL reaction volume~consisted of 50 pL diluted DNA sample (5 ng) and 50 pL of
working reac tion mixture. The working reaction mixture consisted of: 27.5 pL sterile-distilled
water, 10 pL IOX amplification bufkr, 10 pL dNIP stock mixture (Roche, Laval, Québec), 1 pL
excess primer, 1 pL limiting primer, 0.5 pL Tuq polymerase (Gibco BRL, Life technologies Inc.,
BurIington, Ontario). Automated DNA sequencing of the PCR products using the above primers
was carried out by MOBIX (McMaster University, Hamilton, Ontario).
Phylogenetic analysis
The sequences obtained h m MOBIX werc manually corrected against two opposite strand
seqwnces and deposited into GenBank. Sequences were compared to the compilation of 18s
dlNA sequences located in the GenBank and EMBL nucleotiàe libraries (www.ncbi.nlm.nih.gov/)
using the BLAST search method (Altschul et al., 1997). Sequences were aligned to the closest
matches determined via BLAST searching as well as the sequences of the closest identity matches as
determined by the physiological. biochemical and fatty acid tests. Sequence alignment was
performed by the CLUSTAL X (Thompson et al.. 1997) software program. Subsequent
phylogenetic analysis of the sequence data sets were done using the PHYLIP software package
version 3.6 (Felsenstein. 1999). Distance matrices were produced by using the DNADIST program
using the maximum likelihood algorithm option. U m t e d phylogenetic trees were created using
22

0 the neighbour-joining method of Saitou and Nei (1987) with the NEIGHBOR program. The
FITCH program was used to adjust the estimated (via DNADIST) branch lengths. Bootstrapping
(1000 replicates) was used to determine the statisticai significance of each branch by using the
SEQBOOT, DNADIST, NEIGHBOR and CONSENSE prograrns. The unrooted tree was built
using the DRAWGRAM program. 18s rRNA sequences from Rhodosporidium dacryoicium and
Tredla globospora were incorporateci in the tree in an attempt to repmsent the basidiosporogenous
yeasts. Saccharomyces cerevisiae was included as the representative of the ascosporogenous
yeasts, while Starmera caribaea was used to increase branch point stability for Starmera
amethionina. The 18s rRNA sequence of Homo sapiens was useà as the out-group.
The 18s rRNA gene sequences retrieved from the GenBank database were: Tremella
globospora Uûû976; Rhodosporidium akryoidum D13459; Starmeru caribaea AB017899; Starmera
omethionina var. amethionina AB0 17897; Candida sojae AB0 13549; Candda tropicalis M55527;
C ' d a albicatls AF114470; Candida zeyfanoides AB013509; Saccharomyces cerevisUre JO1353
8 M27607; Candida knrsei M55528; Homo sapiens U13369. The SPTl and SPT2 sequences have
the GenBank accession numbers AF247474 and AF247475. respectively.
2.3 Biosensor Design
2.3.1 Oxygen electrode-based biosensor
The effects of cyclodexûin (CD) on yeast responses to glucoselglutamic acid (GGA) was
monitored via an oxygen elecrrode based biosensor. The objective was to detemine if response
heights differ in the presence and absence of CD. The BOD sensor was cornpriseci of a Clark-type
oxygen electmde (YS1 mode1 54A Yellow Springs, OH) set at a potential of -650 mV. comected to
a LKB Bromrna 2210 chart recorder (Kipp & Zonen, Delft, Holland). Each yeast strain was
sandwiched between an imer Teflon membrane (suppiied by YSI) and an outer dialysis membrane
(6000 - 8000 Da MWCO spectra/por@, specrn~n@ Medical Industries Inc., Houston, TX). Each
dialysis membrane was secured to the dissolved oxygen probe by means of a rubber O-ring
(supplied by YSI). The yeasts wem prepared according to section four of the materials and methods
section with the exception that 50 pL of the yeast slurry was used rather than 20 pL+. The elecmxk
was preconditioned for one night in a stirred (400 rpm on a magnetic stir plate) solution of 100 rnM
phosphate buffer (PBS) containing 0.8 % NaCl at pH 7.2 in the presence of 100 ppm (BOD) of
glucoselglutarnic acid (GGA) standard solution. Note that since relative responses weip of interest,
additional preconditioning was not required.
Measurements of the response heights to multiple additions of 5 ppm (BOD) GGA were
cornpafed to responses to 5 ppm (BOD) injections of GGA in the presence of 10 mM hpf3-0
(Aldrich, Milwaukee WI). Response heights to al1 GGA additions were measured &ter five minutes
had elapsed. Al1 experiments were carried out at ambient temperature (22 OC) in a 20 mL beaker
containing 10 rnL of PBS buffer (10 mM, pH 7.2).
2.3.2 Mediator-based biosensor
Electrochemical experiments were carried out using a BAS CVlB voltammoraph
(Bioanalytical Sciences (BAS), West Lafayette, IL). A threeclectrode system was used with a 3
mm diameter glassy carbon working electrode, a platinum wire counter electrodé, and an Ag/AgCl
(saturateci K I ) reference electrode (al1 electrodes BAS). The measured current was digitized and
displayed on a computer equipped with a DAS-8 A/D card (Cornputer Boards, Inc.,Mansfield, MA)
and custom software.
The glassy carbon electmde was polished using ~uehler@ (Lake Bluff, IL) nylon polishing
cloth (40-7068) first with 1 Fm Buehler ~ e t a d i @ II diamond polishing compound, and
subsequentiy wi th 0.05 pm alumina ( ~ u e hier@ Gamma Micropolish@ II). Afterwards, the
electrodes were subjected to 10 min of sonication in distilled water prior to use. The counter
electrode was cleaned with concentratecl sulphuric acid and rinsed in distilled water.
AU experiments were camcd out in a 20 mL reaction vesse1 in a finai volume of 10 mL. A
magnetic stimr (400 rpm) was used in measurements taken at a set potential only. Substrates wem
24

kept on ice during the cowse of measurements and stored in at -20 "C between measurements to
eliminate microbial degradation.
Measurements at a set potential (amperometric measurements) were carrieci out atgoptimized
parameters (i.e. 30 OC, 100 mM PBS, pH 6.0, and 20 m M potassium femcyanide). After the
baseline current had been attained, successive injections of substrate were introduced to the mixing
vesse1 after each new baseline current was obtained. Responses were measured from the lower
c m n t after injection (i.e. the baseline or the current dip after injection) to the higher (Le. the new
baseline). Calibration of the sensor was done using a standard (GGA) solution. For substrate
additions above 100 pL, the sample included 10 percent of ten-fold concentrated mediator and
buffer. Measurements were perfonned in triplicate within al1 elecaode measurements. Data are
presented as mean f standard deviation.
2.4 Yeast Cdtivation and Electrode Preparation
A single colony fkom a YM agar plate was used to inoculate 50 mL YM broth in a 250 mL
Erlenrneyer flask (26 O C , 240 rpm). Upon reaching late exponentiai phase, 1 mL of this culture was
subcultured to 50 mL YM broth in a 250 ml Erlenmeyer flask. Yeasts in late exponential phase
(28 h) of the subculture were hamested for biosensor use after veriwng the absorbance (f 10 9) of
a 100-fold culture dilution at 600 nm (i.e. SPT1= 15.5, SPT2 18.3). For one electrode, 1 mL of
the subculture was placed in a micnwmüifbge tube and centrifugeci at 15 000 rpm for two minutes
using a Bnnlanann Instruments. Inc. Eppendorf centrifuge 54 14 (Rexdale, Ontario). The
supematant was discarded and 1 mL of 100 mM PBS bufEer, pH 7.2 was added. The cells were
washed by resuspending them via vortexing at a high speed. The resulting cells were peiieted and
washed once again, and the supematant was discarded. The cells were nsuspended in 10 pL of
PBS buffer (pH 7.2). In a larninar flow hoal, 15 pL of yeast slurry was pipetteci and left to dry for
20 min on the surface of a clean glassy carbon electrode. Reproducibility of this technique was

verified by measuring the absorbance at 600 nm of the yeast slurry after washing. and by measuring
the wet weight of the yeast slurry (15.0 mg * 10 96 for each strain). The yeasts were then retained
on the working electrode by securing a 12 000 -14 000 Da MWCO dialysis membrane
(~~ectra/Por@2, spectrum@ Medical Industries, Inc., Houston. TX) over the yeasts using two
rubber O-rings.
2.5 Mediator Screening via Cyclic Voltammetry
Cyclic voltammetry (CV) was used to screen mediators for use in amperometric sample
measurement. Al1 CV measurements were performed at arnbient temperature (22 O C ) in 100 mM
PBS buffer, pH 7.2 (except for CV scans of hydroxymethylfemcinium. which were camed out in
100 mM phthalate, pH 6.0), with a final mixing volume of 10 mL. The scan rate was set at 10
mV/sec. Only properly preconditioned electrodes. as indicated by GGA calibration (see section 6.3
of the materials and methods) were used for mediator screening. Cyclic voltammetry was
performed in an unstirred solution using 5 m . of mediator (except for measurements taken with
hydroxymethylfemcinium and water soluble 1,l '-dimethylfemene. which were only available in
lower concentrations - see below). Biocatalyst - madiator interactions were studied via CV analysis
by sweeping the applied potential over a broad range and masuring the oxidation current generated
by the mediator before and after addition of 500 ppm (BOD) GGA standard solution (upon
establishment of a stable background current). The selection of mediators was based on an increase
in the oxidation c m n t upon GGA addition and on reversible electrochemistry. The working
potential of selected mediators was determineci by the redox potential of the mediator.
A total of eight water soluble mediators were screened for mediation. Solutions of 100 mM
were made up in double distilleù water for the following mediators: potassium femcyanide (Fisher
Scientific. Nepean, Ontario), phenazine ethosulphate (Sigma, St. Louis, MO), and 2.6-
dichlorophenol-indophenol (Sigma, St. Louis. MO). A 50 mM solution of EDTA (Sigma, St.
Louis, MO) was used to solubilize 100 m M of FeC13 (Aldrich, Milwaukee, WI). The solution was
subsequently referred to as F~"I EDTA. The ~ e " EDTA was prepared by stimng the mixture for 30
min under low heat. Solutions of ferrocenium tetraflouroborate and ferrocenium
hexafluorophosphate were prepared in concentrations of 25 mM in 100 mM PBS buffer. Both of
the latter mentioned mediators were supplied by Aldrich (Milwaukee WI). A 0.5 m M solution of
water soluble 1,l' -dimethylferrocinium @MFe+) was prepared according to the procedure of
Luong et al. (1 995b). Similarl y, hydrox ymethy lferricinium @MF+) w as prepared in concentrations
ranging h m 4-6 mM.
Two water insoluble mediators were used in the mediator screening process. Both the
3,3' ,5,5'-tetramethylbenzidine (TMB) and the 1,l' - dimethylferrocene @MFe+) were purchased
from Aldrich (Milwaukee, WT). Solutions of TMB and DMFe+ were prepared according to the
methods given by Cattaneo and Luong (1994) and Male et al. (i997), respectively. Mediator
concentrations were verified spectrophotomehically (Beckman DU 640, Fullerton, CA) using the
respective absorption coefficients for each mediator.
2.6 Biosensor Optimization
2.6.1 Mediator concentration optimization
The optimal mediator concentration was determined by comparing responses to 150 ppm
(BOD) GGA additions under increasing mediator concentrations. Concentration optimization was
done only for mediators that were chosen from the CV screening procedure (i.e.
hydroxymethylfemcinium and potassium femcyanide). Only isolate SPTl was used to detemine
the optimal mediator concenîrations. Kinetic parameters such as Ks and V- were determined h m
Hanes plots using experimentally measwed values (Le. substrate concentration and current)
detexmined at saturating GGA concentrations (150 ppm BOD GGA was considcred saturating since
the electdes were not preconditioned). The conditions for the potassium femcyanide opthkation

were as follows: 20 pL, yeast slurry. + 400 mV applied potential. 100 mM PBS buffer, pH 7.2.
Potassium femcyanide concentrations ranged from 0.1 - 80 mM. Measurements for
hydroxyrnethylfemciniurn @Ml?) optirnization were taken under the same conditions (except for
the following changes: + 285 mV and 15 pL of yeast slurry). The concentrations of HIi@ ranged
from 0.1 rnM to 4 mM (note that the lack of solubility did not permit the use of a HMF+
concentration above 4 mM). The HMF was already solubilized in 50 mM phthalate buffer (pH 5.0)
prior to addition while potassium femcyanide was dissolved in double distilled waster. The 20 ppm
(BOD) GOA additions were made once a steady-state background current was established
Mediator toxicà2y e valuatio n
The standard plate count was used to determine whether potassium ferricyanide was
inhibitory to either of the two yeast strains. Filter sterilized (0.22 pm ~illex@-GP filter unit.
Millipore, Bedford, MA) potassium femcyanide was added to the YM agar pnor to pouring to
create plates containing various mediator concentrations (1 mM - 20 mM). Culture dilutions of
1: 10 '~ and 1: for the opaque and white strains, respectively, were used to inoculate both
mediator plates and control plates (no mediator). Inhibition was indicated by no growth over a
period of 10 days.
2.6.2 Optimal yeast loading
To detexmine the optimal quantity of yeast to use for the sensor, a range (2-35 pL) of yeast
slurry was pipetted on to the surface of the working electrode and the response to GGA was
monitored (150 and 20 ppm BOD GGA was used for SPTl and SPT2, respectively). There was no
preconditioning of the sensor, and measurements were taken in triplicate. The conditions for al1
measurements were as follows: + 450 mV applied potential, 20 mM potassium femcyanide, 100
m M PBS buffer. pH 7.2 and ambient temperature (22 O C ) .

2.6.3 Preconditioning of electrode
Inconsistent or complete lack of responses after electrode preparation indicated that
preconditioning was necessary in order for the sensor to function optimally. Al1 preconditioning
tests were carried out using 20 rnM potassium femcyanide as the mediator. Preconditioning times
were determineci for the SPTl and SPT2 strains under two conditions: starvation in 100 mM PBS
buffer pH 7.2; and incubation in a 50% PBS buffer (100 mM, pH 7.2) and 50 % effluent ( h m the
pnmary clarifier in Thurso, Québec) mixture. The response to 20 ppm (BOD) additions of the
pnmary clarifier effluent obtained from the Thurso mill were measured every day until a clear
response maximum was established (or up to a maximum of 12 days). The time required to
establish the response plateau was judged to be the time needed for eleccrode preconditioning under
those conditions. All measurements were taken at ambient temperature (22 OC), + 450 mV and with
20 pL of yeast slurry retained at the surface of the electrode.
2.6.4 pH response range
The optimal pH was determined by measuring the response of M y conditioned electrodes
to 20 ppm (BOD) additions of GGA at various pHs. The measuring conditions for al1 these
experiments were kept constant at + 450 mV, 20 mM potassium femcyanide, and 30 "C. Prior to
pH optimization, the response of 5 m M potassium femcyanide additions in the various buffer
conditions using an electrode without cells was measured. This allowed for the determination of
any effects of the various buffers on potassium femcyanide d a t i o n . The following buffers were
used in the pH range of 5-9: 100 mM phthalate (pH 5-6); 100 mM phosphate (pH 5-8); 1 0 m M
borate (pH 7-9).
2.6.5 Temperature response range
The optimum temperature was determined by recording responses of fully conditioned
working electrodes to 20 ppm (BOD) additions of GGA. Al1 measurements were made at + 450
29
mV using 20 m M potassium ferricyanide in 100 mM PBS buffer, pH 6.0. The detection chamber
consists of a jacketed vesse1 attached to a Lauda RM20 constant temperature water circulator
(Rexdale, Ontario). The temperature conditions ranged from 4 - 50 OC.
2.7 Standard Solution (GGA) Calibration Curve
A standard solution calibration plot was detennined for both sensors using the following
optimized conditions: 30 OC, 100 m M PBS pH 6.0, and 20 rnM K3Fe(CN)6. A stock (GGA)
solution containing 100 g/L glucose (BDH, Inc., Toronto, Ontario) and 100 g/L gluiamic acid
(Sigma, St. Louis, MO), with a BOD value of 146 700 ppm, was used as mode1 wastewater
according to Riedel et al. (1 990). Standard solution measurements of various BOD concentrations
were prepared by dilution of the stock solution. In all measurements involving potassium
ferricyanide. GGA was added after the attainment of a steady-state background current at + 450
mV. Mien hydroxymethylfemcinium (HMF+) was used as the rnediator, the aformentioned
optimized conditions were used except that an applied potential of + 285 mV and 100 m . phthalate
buffer at pH 6.0 were used. Phthaiate was used in place of PBS buffer for H M P measurements in
an attempt to eliminate the possibiiity of incmased HMF+ precipitation in the presence of phosphate
ions. Successive injections of substrate were made after each new baseline current was achieved
The response was measured as the current change between the steady-state curent in the pxesence
of GGA and that which was established in the blank buffer. Measurements were taken in txiplicate
wi thin one elec trode. Reproducibili ty wi thin one electrode was -detennined b y calculating the
standard e m r of the mean for a series of five or more measurements of 10 ppm BOD of GGA.
The sensor BOD values for effluent samples were calculateci h m the calibration curve of
each isolate. Since the line of the calibration curve was €O& through zero on the X and Y axis,
the sensor BOD value was determined by dividing the correcteci mean response height by îhe dope
of the calibration curve. Note that the corrected mean response height was taken as the mean

response plus 10 percent of the response (due to the d sample being 90 96 effluent and 10 5% of
ten fold PBS buffer and mediator) minus the negative control. The negative control for each
effluent was determined by the response of a sensor without yeast cells to the addition of an
equivalent amount of effluent. to the mixing vessel.
2.8 Measurernent of Pulp Mill Effluent
2.8.1 BODS rneasurement
The standard five &y BOD measurement was done according to the procedure outlined in
the "Standard methods for the examination of water and wastewater" (Greenberg et al. 1992).
Oxygen concentration was measured using a YS1 mode1 54A oxygen meter (Yeliow Springs, Ohio).
Only the effluent from the Thurso pirnary clarifier was measured. The BOD, values for other
effluents were supplied by the Pulp and Paper Research Institute of Canada, Point-Claire Quebec
(Beaupré. Donnacona, Fraser, Grand Mère, Kenogami) and Noranda Technology Centre, Point-
Claire Quebec (Edmunston. Madawaska). Note that aii eflluents originated from pulp mills except
for Madawaska (paper mill).
2.8.2 Linear response range to Thurso effluent
Primiuy clarifier effluent from the pulp mil1 located in Thurso was used to determine the
Linear response range to a real sample. Reconditioning of the working el~caodes for both strains
was done via incubation in 50 % Thurso primary clarifier effluent and 50 % 100 mM PBS buffer at
pH 7.2. Dilutions of the effluent were measured (Le. nom the detection b i t of the sensor, up to
60 ppm). Both potassium femcyanide and HMF were used in determining the linear response
range for the Thurso effluent. When potassium femcyanide was the mediator, the effluent was
prepared by creating a mixture that was 90% effluent and 10% PBS buffer/potassium ferricyanide
(10x concentrate). The absolute response height was measured as the current increase to effluent

addition plus 10 % of the response height minus the response obtained from a bare (dialysis
membrane only) electrode. A 10-fold concentration mixture was not possible with HMF+
measurements due to the mediator insolubility problems mentioned earlier. Al1 sensors using
potassium femcyanide had the following conditions + 450 mV, 20 mM potassium ferricyanide, 100
mM PBS buffer pH 6.0. Measurements with 3 mM HMF used were performed at + 285 and 100
rnM phthalate buffer, pH 6.0. Mean response values were used to establish the linear response
range. Reproducibility wiihin one electrode was determineci by calculating the standard error of the
mean for a senes of five or more measurements of 10 ppm BOD of Thurso effluent.
2.8.3 Measurement of various effluents
The universaiity of the sensors was tested by measuring their responses to the eight different
effluents listed in Section 2.8.1. Working electroâes for bath strains were fully preconditioned (i.e.
9 days for SiTl and 5 days for SPT2) prior to the addition of the effluent sample, via the starvation
technique. Each sample addition consisted of 200 p.L of effluent that had been prepared as in
Section 2.8.2. The detection chamber conditions were aiso the same as in Section 2.8.2 (pH 6.0
was used). A minimum of five measurements were taken for each effluent sample. The InStat
statistical analysis program (GraphPad Software, San Diego, CA) was used to determine the 95%
confidence intends for rneasurements of response reproducibility within diffe~nt effluent samples.
Sensor responses to the various effluents were comlated to the measured BODS value by
dividing the mean response to each effluent by the slope for their respective GOA calibration cwe .
The resulting value, "x". was divided by the dilution factor of the BOD5 value and multiplied by 100
to determine the comlation value (given in percentage).
Response reproducibility between electrodes was examined by a senes of three identicai
sensors. These measurements were conducted during the preconditioning triais of the sensors to
avoid increased standard deviations due to leakage of the biocatalyst. The following conditions
were used: 22 OC, 100 rnM PBS pH 7.2,20 m M K3Fe(CN)6, 20 p L yeast load.
32

2.9 Determination of Biosensor Operating Life
The operating life of the sensor (for both strains) was cletennineci under optimal conditions
(+ 450 mV, 20 rnM potassium femcyanide, 100 mM PBS buffer pH 6.0, 15 pL yeast slurry).
Daily measurements of 10 ppm (BOD) GGA were taken until no significant response was obtained.
The measurements were taken in triplicate within one electmde for each strain.

RESULTS AND DISCUSSION
3.1 Yeast Characterization
Two yeast strains, designated Sm1 and SPT2, were isolated from the primary clarifier
effluent of a pulp mill (Thurso, Quebec) for use in pulp mill wastewater analysis. Initial
classification tests on the yeasts were bas& mostly on physiological characterization techniques. In
addition, 18s rRNA sequencing was performed. Classification based on fatty acid composition
was initiated as a means to venfy the results obtained by the latter two of classification schemes.
3.1.1 Physiological and biochemical c haracterization
Smak purification on GPY agar reveaied two distinct colony types, initially designated as
white (off-white colouration) and opaque (semi-transparent appearance). Mimscopic examination
confirmed that these colonies were comprised of yeasts. The strains were later designated SFT1
and S m , respectively.
Strain identification was attempted after both isolates exhibited electron transfer on an
electrode. Preliminary identification was attempted using classical techniques involving
physiological and biochemical tests. Later, chatactenzation tests were based on fats, acid analysis
and 18s rRNA sequence analysis. Results of the physiological characterization tests irre
summariz.4 in Table 3.1. After three days of growth in GPY broth at 22 O C , SPTl ceils were
moûtly ovoidal(5.3 x 6.7 pm), while the smaller SPT;? ceils were round in shape (2.6 x 3.3 pm).
Both strains exhibited multilateral budding in GYP broth. Only SPT2 exhibited multilateral budding
in ME broth. Pellicte formation was obsewed for both strains.
The colony morphologies of the isolates on solid media wem markedly different. Although
both colony types exhibited viscous texture with off-white colouration and a matt appearance, the
shape of the colonies were considerably distinct. After four weeks on ME agar, SPTl colonies
were off-white, butyrous, dull, waxy, and had convex to umbonate elevations and filamentous
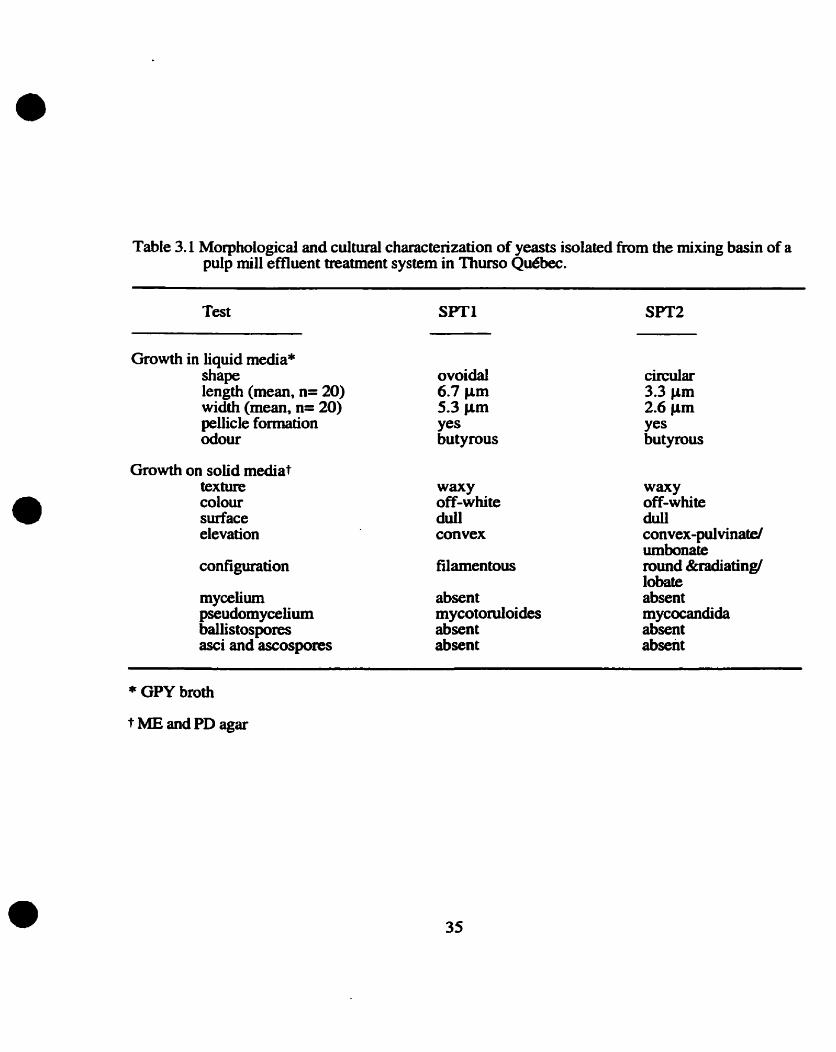
Table 3.1 Morphologicd and cultural characterization of yeasts isoiated h m the mixing basin of a pulp mil1 effluent treatment system in Thurso Québec.
Test
Growth in liquid media* shape length (mean, n= 20) width (mean, n= 20) pellicle foxmation odour
Growth on soiid mediat texture colour surface elevation
configuration
mycelium pseudomyceiium ballis tospores asci and ascospores
ovoidal 6.7 pm 5.3 pm Y= butyrous
WaXY off-white d d convex
filamentous
absent mycotoruioides absent absent
circular 3.3 pm 2.6 pm Y= butyrous
Wa"Y off-white dull convex-puivinate/ umbonate round &radiating/ lobate absent mycocandida absent absent
* GPY broth t ME and PD agar

configurations. Four week old SPT2 cultures were off-white, butyrous, dull, and waxy. SPT2
colonies were convex to pulvinate on ME agar and umbonate on PD agar, depending on the medium
used. Most strikingly. the SPT2 colonies exhibited round configurations with either radiating
rnargins (ME agar) or lobate rnargins (PD agar). Visualization of the mycelial structure via the
Dalmau plate technique (Wickerharn, 1951) indicated that SR1 and SFT2 produced mycotoniloides
and mycocandida pseudomycelia, respectively.
The test for the formation of ballistospores was negative for both strains. Ballistospore
formation is a specialized mode of reproduction largely confined to the basidiomycetous yeasts (van
der Walt and Yarrow 1984). Similady, the DBB tests were negative for both strains, suggesting
that neither belonged to the basidiosporogenous family. The intense dark ~d colour associateci with
a positive DBB reaction is restricted to the basidiomycetous taxon (van der Walt and Yamow,
1984).
Despite using eight different media to search for spore formation in the two isolates, no
definite asci or ascospores were observed. The discovery of differentidy staining circular bodies
found within vegetative-like cells suggested they were ascospores. These circular bodies were
observed in SET1 after one month of growth on YM and PD agars. The SPT2 strain developed
similar circular bodies after only three weeks. Both strains exhibited differentiaily staining bodies
on Gorodkowa, McClary 's, V8, and growth restrictive agar. Analogous circular bodies were noted
in cells growing in GYP broth. It is assumed that these bodies were vacuoles, however, the reason
for their differential staining is not known. The presence of circular bodies were frequently p a t e r
than four per cell, thus eliminating the possibility of them k ing ascospores (van der Walt and
Yarrow 1984). Furthermore, a clearly distinctive ENiting body was never found for either isolate.
Inte~stingly, what appeared to be germuiating spores (small circular differentially staining bodies)
were present in al1 media. These cells were very similar to blastospores in shape and tended to
produce a long mycelial-lüte thnad upon germination. The possibility that these wexe vegetative
cells with unusual growth patterns resulting h m physiological stresses was not eliminated. Fungi

imperfecti lack the sexual stage which allows for the formation of asci and ascospores (van der Wdt
and Yarrow, 1984). These findings strongly suggest that the yeasts belong to the irnperfect genus
Cuna'ida.
The results of the carbon assimilation and the fermentation tests are summarized in Table
3.2 and 3.3 for isolates SPTl and SPT2, respectively. SPT1 most closely matched to Cmidida
tropicdis using the key (in Kreger-van Rij 1984) to species and generû aot =quiring charactenstics
of sexual reproduction. SPTl had an identical physiological and biochemical prof'ile to C. tropicdis
except that SPTl was unable to metabolize soluble starch. ethyiamine, L-lysine, and cadaverine.
Similarly, Sm1 was able to grow at temperahues up to 42 OC; in hi& osmotic pressure conditions
(50 % glucose); exhibiteci a negative starch test; was resistant to 1ûûû ppm cycloheximi&; and was
not able to grow in vitamin-free media. Morphological and cultural tests performed on SET1 also
yielded results anaiogous to those reporteci for C. tropicals (Table 3.1).
The general key not requiring charactenstics of sexual reproduction led to the possibility
that SPT2 was Stannera amethionha (fonnerly Pichia amethionina ) Wger-van Rij, 1984). On1 y
ttiree differences occurred in the carbon assimilation profile, SPT2 was abte to utilize glucitol but
not lactic acid, while conversely S. umethioniha was able to utilize lactic acid but not glucitol.
Also, SPT2 could ferment glucose, while S. amethionina was not able to ferment any
carbohydrates. One crucial ciifference was the absence of ascospores in SPT2 This latter finding
suggests that strain SPI2 is not likely an ascosporogenous yeast despite its apparent sirnilarity to S.
amethionina .
3.1.2 Fatty acid analysis
Al1 fatty acid analysis was conducted by Microcheck, Inc. (hiorthfield Falls, VT). The
isolates were grown ovemight on Sabouraud dextrose agar at 28 OC prior to fatty acid analysis. In a
dendrogram generated by a multivariate cluster analysis the two isolates were linked above the
species level at an Euclidian Distance of 14.2. Based on the cellular fatty acid data analysis, both
37

Table 3.2 Surnmary of biochemicai characterization of SPTl based on the key to species and genera not requiring characteristics of sexual reproductiont .
Fermentation 01 D-Glucose + 04 a-~-~aftose - M D(+)Trehalose + 02 D(+)Galactose + 05 D (+)RafFinose 03 Maltose + 06 Sucrose +
Carbon assimilation 09 L(+)Arabinose - 10 L-Arabitol - 11 Arbutin - 12 Cadaverine - 13 Cellobiose + 14 Citric Acid +,d 15 Creatine - 16 Creatinine - 17 DulcitoI (Galactitol) - 18 Ethanol + 19 Ethytamine - 20 Erythritol - 2 1 B-D-Fructose + 22 D(+)Galactose + 23 D-Gluconic Acid +
24 D-Glucitol (Sorbitol) 25 D-Glucose 26 D-Giucosamine 27 D-Glucuronic Acid 28 Glycerol 29 DL-Lactic Acid 30 D a -Lactose 31 L-Lysine 32 Maltose 33 D-Mannitol 34 Methaaol 35 Mtthyla-D
glucop yranoside 36 Melibiose 37 D(+)Melczitose
38 myo-Inositol - 39 D(+)Raffinose - 40 L-Rhamnose - 41 Ribitol (Adonitol) + 42 D-Ribose 43 Salicin -,d 44 L-Sorbose + 45 Starch -,d 46 Succinic Acid + 47 Sucrose + 48 D(+)Trehalose + 49 D(+)Xylose + 50 Xylitol -
Additional characteristics 51 growthat2SWC + 57 50% D-Glucose + 62 NO3 assimilation - 52 growth at 30'C + 58 60% D-Glucose - 63 Diazoniwn Blue B - 53 growth at 35'C + 59 0.01% Cyclo- 64 Vitamin frte 54 growth at 37'C + heximide + growth 55growthat4S'C + 60 O. 1% Cyclo- 65 Acid production 56 growth in 10% NaCl heximide + fiom glucose
& 5% D-glucose + 61 NO2 assiaiilation 66 Starch formation -
t Codes for responses to tests: + positive growth 5 1 week; - no growth S 3 weeks; d delayed growth response (> 1 week); v variable response (+,O); w weak response.

Table 3.3 Sumrnary of biochemical characterization of SET2 based on the key to species and genera not requiring characteristics of sexual reproductiont
Fermentation 01 D-Glucose + 06 cm-- - 05 D(+)Trchalose + O2 D(+)Galactose - 07 D(+)Rafftnose - 03 Maltose OQ Sucrose +
Carbon assimilation 09 L(+)Arabinose - 10 L-Arabitol -.d 11 Arbutin - 12 Cadaverine - 13 Cellobiose - 14 Citric Acid - 15 Creatine - 16 Creatinine - 17 Dulcitol (Gaiactitol) - 18 Ethanol + 19 Ethylamine - 20 Erythritol - 2 1 i3-D-Fructose + 22 D(+)Galactose - 23 D-Gluconic Acid +,d
24 D-Glucitol (Sorbitol) 25 D-Glucose 26 D-Glucosamine 27 D-Glucuronic Acid 28 Glycerol 29 DL-Lactic Acid 30 D a -Lactose 31 L-Lysine 32 Maltose 33 D-Mannitol 34 Methanol 35 MethylU-D
glucopyranoside 36 Melibiose 37 D(+)Melezitose
38 myo-Inositol 39 D(+)RaEnose 40 L-Rhamnose 41 Ribitol (Adonitol) 42 D-Ribose 43 Salicin 44 L-Sorbose 45 Starch 46 Succinic Acid 47 Sucrose 48 D(+)Tretiatose 49 D(+)XyIose 50 Xylitol
Additional characteristics 51 growth at 25'C + 57 50% D-Glucose - 62 NO3 assimilation - 52 growth at 30'C + 58 60% D-Glucose - 63 Diazonium Blue B - 53 growth at 3SWC + 59 0.01% Cyclo- 64 Vitamin frec 54 growth at 37'C +w heximide - & Y o d - 55 growth at 42'C - 60 O. 1% Cyclo- 65 Acid production 56 growth in 10% NaCl heximide - from glucose' +
& 5% D-glucose - 61 NO2 assimilation - 66 Starch formation -
t Codes for responses to tests: + positive growth 5 1 week; - no growth I 3 weeks; d delayed growth response (> 1 week); v variable response (+,-); w weak response.
acid production was not vigorous and may be relateci to citnc acid and not acetic acid

S R 1 and SPT2 were judged to be Candi& species. Similarity indices (SI) based on fatty acid
retention times and mean percentages, yielded excellent matches for both isolates. Strain SPTl was
identified as C. albicuns GC subgroup A, with an SI value of 0.688. SPT2 was most closely
matched to C. zeylanoides and had an SI value of 0.617. Candida h s e i was also listed as a
possible match for strain SPI2 but had an SI value of only 0.400.
3.1.3 18s rDNA sequence analysis
Partial double stranded DNA sequences for the 18s rRNA genes of both Sm1 and SPT2
were determineci. Accuracy was increased by sequencing in both directions and twice in the 3'-5'
direction. The resulting comted sequence did not contain any undetermined positions. These
sequences corresponded to approximately one third of the small subunit rRNA gene (White et al.,
1990).
Sequence cornparison via BLAST (Altschul et al.. 1997) searches revealed that Candida
sojae was the closest match to SPTl. Homology (5 10 bp) was nearly complete (99.8 %) with only
a one nucleotide difference (Figure 3.1, position 120). Candida viswunazhii also had 99.8 %
homology (with a guanine insertion at position 79 - not shown), while the 18s rDNA of C. topicalis
was 99.6 % sirnilar. Cornparison of the 18s rRNA sequence (71 1 bp) of SPT2 to the compilation
available in the GenBank and EMBL databases via BLAST searching did not yield any close
sequence matches. BLAST searches revealed that Candida krusei, Pichia membrmiijiaciens and
Candida mesenterica were the nearest matches. Sequence comparisons obtained from the
DNADIST program of the PHYLIP package did not yield homologies greater than 74 % for SPn.
Sequence homology for Candida knrsei was only 71 %. Such low homology indicates that SPTî is
a previously uncharacterized species and likely an uncharacterized genus.
The sequence alignment program CLUSTAL X mompson et al., 1997) was used to align
the sequences of the two isolates with their closest matches (as detemineci by the biochemical and
nuclear charactenzation methods). AU aiigned sequences were 510 nucleotides long, correspondhg
40
to the length of the 18s rDNA sequence of S m 1. Aligned sequences extended h m position 592-
1 133 according to the S. cerevtsiae nwnbenng system for the 18s rRNA gene (Mankin et al.,
1986). When compared to the sequence conservation histogram for eukaryotic 18s rRNA provided
by Sogin and Gunderson (1987). the length of these sequences encompasses variable regions V2-
v4.
The 18s rDNA sequences h m C. tropicalis, C. albicmts, and C. soja were compared to
the sequence of isolate Sm1 (Figure 3.1). The choice of these species was based on the results of
the physiological and biochemical tests, fatty acid analysis, and the BLAST search, respectively. A
very low frequency of sequence variation was exhibiteci between SPTl and these Cùndùùz species.
The fust 46 nucleotides in Figure 3.1 are characteristic of the conserved region between variable
regions V1-V2 (Sogin and Gunderson, 1987). The most variable region between the four
sequences is between nucleotides 46-124. This corresponds to the location of the second
hypervariable region (V2). The low sequence variability (1 mismatch at position 228) in the V2
region highiights the close relationship of these C d i d a strains.
The alignment of SPT2 to the three closest matches obtained from the physiological,
biochemical, fatty acid analysis, and the BLAST results is shown in Figure 3.2. Extensive
variability was observed in the V2 region (positions 65-164). The V3 regions were poorly defined
and not easily comparable. Both Sogin and Gunderson (1987) and Stackebrandt and Rainey (1995)
have indicated that the location of hypervariable regions differ h m taxon to taxon. so the variability
in Figure 3.2 was not unexpected. The lack of sequence homology strongly suggests that S m is a
previously uncharacterized species.

1.++++II*I***1*+**+I*+****I**I*III+*++ ++t++++ + * * S I + + ++++ +*+ O + I O + * * ++++++ 8 +18
SPTl A A A ( I Y T T A T A T T A A A ~ ~ C Ç # ~ A C C ~ ~ ~ C T C C T # ; T T T i ~ L X ' C T T C L ; T ? f f i ~ I T ( 1 3 A T ~ - cm 79 C. sojm AAM CT TATAlTAAAGIT<i3T( C K t Z T A A A A K d X a X # I ~ ~ A A ~ ~ ~ T C K ~ ( C ' I T C ~ ~ - ~ X ~ ~ I T C M ~ - Ctirr 79
C- tropicnlis ; T A T A iCALiTTM A#;CTCtiT & i A A a T K Xiî CïTCit ; T ~ K J C ~ X . X - 79 C. albicm M C Cr TATATTAAAC Tri ;TTGC#'111'AAAAAL;CrC( T #1TIi(;ic4CrlT XI C7TU Cl7 i( ;CCf X i ï ~ A 5 ~ C G X T 80
d e r 1 ....... 10 ,....... 20. ....... 30 ........ 40 ..... ... 50 ... ..... 60. ....... 70 ...... ..a0
I * * * * + C * + * ~ S Z + + + S + L + + + 5 + + + + + + 5 + O + * + * + + O + + + * * * ++++*+++ **+***** - +++*11** 181.
SPTl C ;TTC4AACiC4i d CITITGfla-MTATA'IT A<CtVCKAATAAT#'rtAAT-&-G#= GlTAT( T T CILTAI-IT X;TCTTd.;IT TCTA 238 C + o j ~ ( - ; T T W C ; C 4 C A ' ~ % r c M A T A ~ A C W C K A A r M K r M P C r ; # 3 < ~ ~ K ( X T ' I c y A I T T X ~ ~ i I i I ; I T ' I C T A 238
C. rroptcdu C T ï ~ ~ ~ ~ ~ % r ~ ~ ~ r A # T A T A ï T A C ~ ( X A ~ A A ~ K J M c Y j ( ; # 3 M T N C C ; î T C T A ï l T T G ~ ; I T T C r A 238 C.albicm ( ; I T ~ C j C 9 ( ' n ~ ; C T C C C C M A T A i Y A A T ~ K i ~ X X ; # = i ; T T A T ~ I i T ' I c y A ; A 239
d e r . . . . . . . 170. . . . . . . 180. . . . . . . 190. . . . . . -200 . . . . . . -210 . . . . . . .220. . . . . . - 2 3 0 . . . . . . -240
* * * * * * * * * * * * * * * * * * * * + * O * * * * * O * * * * * * * ******* *****+*+ * * t t * * * * * * * * * * * * * S * * * * * II**
SPTl A C A C r A A ~ A C r t A C r t C r A A A ( C A ' - C m C9TTAAT CAACAAO7 AAAC';TTAGC'cICATCAACmc'ATC9CA 397 C soj* ACir\CrAACt'mCGAAACCATITAakKiCr#3[31TTT CXTTAAT C M C i i AAAGITACiCl;(ATC;M(iArCAT a C A 397
C- tropxdu A T ~ W ~ W ' ^ U ~ ~ A O C A A L ; C ~ # X ~ ( ~ ~ T T A A T C A A C A A ( X ; C C ~ A C ~ I T A G ~ T ~ A A ~ ~ T C ~ ( ; ~ 397 C albicm A C A ~ ~ ' ~ A ~ ~ C I ~ A T I T ~ J C ~ # Y ~ ~ T T A # T ~ C ' ~ A A A ( . ; T T A C ~ C ' L ~ A T ~ M C ~ ~ C A T < ; ~ C A 399
d e r . . . . . . . 330. . . . . . -340 . . . . . . .350. . . . . . . 3 60. . . . . . - 3 7 0 . . . . . . .380. . . . . . - 3 90. . . . . . -400
Figure 3.1 ALignment of central region of the 18s rRNA gene sequence of isolate SPT1, C. sojae, C. rropicu1i.s and C. albicans. The singe basepair difference between SPTl and C. sojae is located at position 121. The bottom line indicates the degree of non homology.
42

S m S. amrhioniricr
C. krusei C- zeylanoides
d e r
S m S. a m e t h h h
C. -ci C. uylanoidcs
d e r
Figure 3.2 Alignment of central region of the 18s rRNA gene sequence of isolate S m , S. amethionina. C. krusei, C. zeylanoides. The bottom line indicates the degree of non homology.
43

A phylogenetic tree was created using the PHYLIP software package (Figure 3.3). The
nurnber of aiignments in the outfile was increased to 13 to decrease the Ilkelihood of false branching
within the dendrogram (Stackebrandt and Rainey 1995). Succharomyces cerevisiae was included in
the alignment as a representative of the ascosporogenous yeast. Members of the
basidiosporogenous yeasts used in the dendrogram included Rhodosporidium dacryoidum and
Tredlla globospora. Stcumeru c h a was included in an atîempt to help stabilize the branching
point of S. amethionina. Calculations of genetic distances were perfonned on blocks of sequenees
510 bp long.
Three distinct clusters were formed in the dendrogram. Cluster 1 is comprised of Stïumem
amethionina and Stannera curibaea. and is supported at a high level (100 %) by bootstrapping
anaiysis. niese species were observed to be highly related, displaying a seqwnce similarity value
of 98.8 8. Cluster II was comprised of the basidiosporogenous yeasts Rhodosporidium
dacryoidum and Tmella globospora, and had a branch confidence value of 96.4 %. Cluster III
was the most diverse group and consisted of the Candida species, and S. cerevisiae. SPTl, and its
closest matches based on the three different characterization methods, formed a highly significant
subcluster (95.6 %) within cluster III. Close sequence similarities b e e n SPTl and C. albicrms.
C. tropicalis. and C. sojae tHere observed: 98.6. 99.6, and 99.8 %, respectively. The
subclustenng of isolate SET1 with C. sojae suggested that S P T l is a strain of C. sojae.
C. albicmrs was the identity match obtained for SPFl via fatty acid analysis. The sequence
similarity index obtained h m the DNADIST program indicated that C. albicans was more distantly
related (1.2 56) to SPTl than C. tropicalhr. Despite a sequence homology of 99.8 % between Sm1
and C. sojae. it c m not be infemd that SPT 1 is a strain of C. sojae. Important ciifkences in

Stamtera amethionina - Stamzera caribaea
Rhodospo ridium 964 9 dacryoidurn l-.- Tremella globospora
r Candida zeylanoides
Candida albicans 9q Candida tropicalis
512
Candida sojae
- Saccharomyces cerevisiae
- Candida ktusei
Homo sapiens
Figure 3.4 Dendrogram showing the phylogenetic rclationships of isolates Sm1 and SPI2 to their closest matching strains (denved from physiological and biochemicai testing, fatty acid analysis, and BLAST searches) based on 18s rRNA gene sequences. The unrooted txee was constructeci by using the neighbour-joining method (Saitou & Nei 1987). Bootstrap values, based on 1000 replications, are given at branch points.
metabolic capabilities occur between the two strains. When compared to the description of C. sujae
given by Nakase et al. (1994), SPTl differs by its inability to assimilate four compounds
(cadavenne, ethylamine, glycerol, and soluble starch), and its ability to ferment maltose and grow at
42 OC (both of which Csojae can not do). It should be noted that SPT 1 was isolated from the
primary clarifier effluent of a pulp rnill in Québec, while C. sojae was isolated from the extraction
water of defatted soybean flakes in Japan. It is not improbable that such vast differences in habitat
and geographic location have lead to strain variation. Despite this possibility, it must be noted that
Nakase et al. (1994) base their distinction of C. sojae from C. tropieaiis and C. albicans on its
inability to ferment maltose and grow at 40 OC. Based on these criteria, SITl cannot be defined as
C. sojae. While the intricacies of these metabolic differences are important, a definitive relationship
of SFT1 to the other members of cluster III may be made only once the entire length of the 18s
rRNA is sequenced and compared. Stackebrandt and Rainey (1995) do not recommend making
inferences on evolutionary relationships from phylogenetic trees based on partial 18s rRNA
sequences since it only aiiows for intergenic delineation. Furthemore, the creation of dendrograms
using different regions of rRNA can result in different tree topologies (James et al., 1998).
Analysis of sequence distance matrix (not shown) revealed that isolate SET2 is not closely
related to any previously characterized species. Phylogenetic cornparison (Figure 3.3) to S.
amethionina, C. zeylanoides, and C. krusei (the nearest matches obtained from the biochemical
tests, fatty acid analysis and BLAST searching, respectively) did not resuit in the grouping of SPI2
with any of these organisms. James et al. (1998) have stated that an 18s rRNA sequence
divergence of as Little as -2 % can be enough to suggest separate genera. This indicates that the
genus of isolate SPT2 is not represented in Figure 3.3. However, conclusions regarding genera
classification are questionable if only one representative of the Lineage is known (van de Peer and
Wachter 1995). For example, the branching of SPT2 may be an artifact caused by a lack of 18s
rRNA sequence information in the various databases for the species to which it is most closely
related. Despite this, the prelimiaary indications are that SPT2 is a representative of an
46

Table 3.4 Summary of the results obtained from the various yeast charactenzation schemes.
Charac terization technique SPTl
PhysiologicaU Candida tropkalis biochernical
Fatty acid Candida albicmis(0.688) Candida zeylanoides (0.6 17) anal ysis* Cdida famata (0.419) C d & famata (0.487)
Cdida guiliermandii (0.372) Candida h e i (0.400)
18s rRNA Candida sojae (99.8 %) Candida krusei (76.0 %) BLASTn Candida viswanathii (99.8 %) Pichia membran~aciens(74.1%) searches t C d d a îropicalis (99.6%) Candida mesenterka (75.6 96)
* numbers in parentheses indicate the similarity indices t numbers in parentheses indicate the percent homology

uncharacterized genus. A summary of the various characterization r hemes aüernpted is presented
in Table 3.4.
3.2 Mediator Screening
Cyclic voltarnmetry was employed to screen for potential mediators and the seleciion of
mediators was based primarily on previous published results (Table 3.5). Ten mediators exhibiting
a wide range of redox potentials were screened (eight water-soluble and two water-insoluble
mediators in a hp-$-CD solution). However, only potassium ferricyanide and HMFI exhibited
significant mediatingcapabilities. The responses of the microbial sensors in the absence of mediator
were negligible. indicating that the mediators were responsible for electron shuttling f b m the yeasts
to the electrode.
Figure 3.4 depic ts typical cyclic voltammograms of isolates SPT 1 and SET2 in the absence
and pnsence of 500 ppm (BOD) GGA using 5 mM potassium femcyanide as mediator. Within the
range of potential scanned (-0.2 to +1 V). potassium ferricyanide exhibited voltammograms that
comsponded well with a one electron d o x compound (Hill and Sanghera. 1990). In the absence
of GGA, the yeast did not contribute a response. and only the electrochemical behaviour of
potassium femcyanide was noted. Upon addition of 500 ppm (BOD) GGA a large increase in the
oxidation current was observed. This is indicative of catalytic regeneration of the mediator by the
reduced cellular enzymes of the yeasts. The increase in the oxidation peak is a consequence of the
oxidation of ferrocyanide ( F ~ ( c N ) ~ ~ ) h m femcyanide (F~(cN)~-) by the yeast cellular enzymes
in a reduced form and subsequent reoxidation of the reduced mediator at the surface of the electrode.
An excess of GOA was used to ensure that the yeast cellular enzymes were fully reduced. The
regeneration of F~(cN),& to F~(cN),~- by the electrode was rapid since the use of the mediator at 5
rnM should not lead to significant diffusional iimitation. No change in either the cathodic or anodic
current was observed at the glassy carbon electrode with the addition of GGA in the absence of
yeast (data not shown). The latter observation strengthens the argument that yeast enzymes are
48

Table 3.5 Surnrnary of results obtained from the various mediators screened for electron mediation via cyclic voltammetry .
Water-Soluble Mediators Mediation Reference
2,6-dichlorophenol-indophenol
1 , 1 '-dirnethylfemcinium
Fm EDTA
femcinium hexafiuorophosphate
femciniwn tetrafiumborate
h ydrox ymethy Ifemciniwn
phenazine ethosuiphate
potassium femcyanide
Water-Insolubte Mediators
-- -
insignificant W 6 b and Siclidal (1994)
insignificant
insignificant
none, cytotoxic
none, cytotoxic
significant reversible
significant quasi-reversible
1,l '-dirnethy lfemcinium insignificant
3,3',5,5'-tetrame~ylbe~dine insignificant cytotoxic
Luong (personal cor~~munication)
Kalab and Sklildal (1 994)
Luong (personal communication)
Luong (personal corx~munication)
Luong (personal
Rouer et al. (1984)
Rawson et al. (1989) Bemetto et ai. (1983)
Luong et al., (1993)
Cattaneo & Luong (1994)

Potential (V vs AglAgCI)
Figure 3.4 Cyclic voltarnmogram with isolates (a) SPTl and (b) SPT2 using potassium ferricyanide in the presence ( ) and absence (---- ) of 500 ppm BOD GGA(2 mV/s, 5 mM K3Fe(cN)6, 100 m M PBS, pH 7.2.22 @).

mainly responsible for mediator reduction.
The increase in oxidation current for the SPTl sensor was not accompanied by an inmase
in the reductive cumnt, thus the reaction is only quasi-reversible (Figure 3.4a). According to Cass
et al., (1984) the lack of an increase in the reduction current is a consequence of an enzyme-
dependent catalytic reduction of ~e(cN);- at the oxidizing potential.
The potassium femcyanide voltarmnogram for SPT2 was slightly different from that of
Sm1 in that the reaction was more reversible (Figure 3.4b). After substrate addition, there was a
noticeable decrease in the reduction current as well as an increase in the oxidation current. The
height of the anodic peak current (ipJ was much greater than the cathodic peak current (iF)
indicating that the reaction was not reversible (iP/iF = 9.7). This seerns to indicate that the reduceâ
enzymes of S m 1 were able to interact with F~(cN),~' in a more efficient rnanner than the reduced
enzymes of SPTZ Cass et al. (1984) noted that the rate limiting step in mediateci electron shuttling
is the interaction of reduced enzymes and the oxidized mediator. Unlike S m , the reason behind
why Sm1 did not exhibit quasi-reversible redox reactions with ferricyanide is not clear. However,
it may have been related to different outer membrane compositions (as indicated by the fatty acid
analysis). A less permeable cell membrane may create a electron recyciing bottleneck by incming
the time it takes for F~(cN),~- to corne inio contact with reduced enzymes. KaMb and Sklsdal
(1994) indicated that mediators such as ferrocene exhibit increased diffusion times through bacterial
ce11 walls. With regards to diffusion rates, both the composition of the ceii w d as well as the
mediator type are important factors goveming the reversibility of reactions.
With H M F mediation, the cyclic voltammograms of SPTl exhibited a more mversible
reaction (iP.& = 0.91) with well pronounced oxidation and reduction peaks (Figure 3.5a). With
the SPTl sensor the addition of 500 ppm (BOD) GGA resulted in a distinct shift in the
electrochemical profile of HMF+. The increase in oxidation current was nearly matched by the
decrrase in the reduction cuirent resulting in a very simiiar profile located 0.25 pA higher. Under
the same conditions, the SPT2 sensor produced a higher oxidation current peak (1.4 pA) than SET1
51

Figure 3.5 Cyclic voltammogram of isolates (a) SPTl and (b) SP'Iï using hydroxymethylfemcinium the presence (r-) and absence (------ ) of 500 ppm BOD GGA (2 mV/s, 5 mM K3Fe(CN)6,100 mM PBS, pH 7.2,22 OC).

(Figure 3.5b). The reaction was almost completely reversible (iW/ip = 1.0). In the absence of
GOA, only the typical oxidation and reduction peaks for HMF+ were observed. No oxidation
current increase was noted with GGA addition when yeast cells were not retained on the electrode.
Consequently, the nse in oxidation current upon addition of substrate was interpreted as the
reduction of HMF+ by reduced yeast enzymes to hydroxymethylferrocene and the subsequent
reoxidation of hydroxymethylferrocene to HMFt at the surface of the electrode.
Despite the promising results obtained for the remaining mediators in Table 3.5 by other
researchers, none of these exhibited any clear increases in oxidation peaks. Luong et al. (1995)
suggested that water insoluble mediators (i.e. D e , TMB) possess excellent rnediator qualities for
various oxidoreductases when solubilized in CD. Mediators solubilized by CDS have been
dernonstrated to effectively mediate electmns between enzymes (Le. glucose oxidase) and electrodes
(Cattaneo and Luong, 1994; Luong et al., 1993; Zhao and Luong, 1993). Effective reversible
mediation at low potentials, eiiminating many electrochemical interferents, could potentially be
achieved using water soluble CD-mediator complexes and whole cells. Unfortunately, no mediation
was exhibited by any of the water-insoluble mediators. Takayama et al. (1996) remarked that two
important determining factors controlling the effectiveness of a compound as an electron acceptor
are solubility and permeability of the cellular membrane. It is believed mediators solubilized with
CDS do not necessady have any more access to the catalytic site within cells. One reason may. be
related to strength and type of CD-mediator complex, this possibility is subject to further
investigation.
3.2.1 Effect of cyclodextrin on GGA response
The inhibitory effect of CD, if any, on the yeast response to GGA was investigated using a
microbial oxygen electrode in the presence and absence of hp-p-CD. An oxygen electrode was
used in place of the mediated electrode in order to eliminate any possibility of water soluble meûiator
entrapment by cyclodextrin effecting responses. No significant diffennce was found between
53

electroâe responses in the absence of cyclodextrin and in the presence of 10 rnM hpp-CD (data not
shown). In the presence of hp-$-CD, SPT1 exhibited only a 12.2% decrease in mean response to 5
ppm (BOD) GOA (as cornparcd to responses in the absence of CD). Sirnilarly, mean responses of
SPT2 to 5 ppm (BOD) GGA additions were 9.6% lower in the presence of 10 m . hg$-CD. The
reasons for the lower response heights for both strains in the presence of cyclodextrin is not clear.
Cyclodextrin is considered to be relatively nontoxic (Szejtli, 1982), therefore hp-p-CD should not
exhibit any direct negative effects on the yeasts. Furthemore, cyclodextrins generally cannot be
assirnilated by yeasts (Szejtli, 1982). The approximately ten percent decrease in signal is considered
to be insignificant and within the aiiowable emr for this type of measurement. Consequently. it is
concluded that cyclodextrin does not inhibit the response of the isolates to the GGA additions.
3.3 Biosensor Optimization
3.3.1 Mediator concentration optimization
The responses to 20 ppm (BOD) injections of GGA increased linearly wiih increasing
concentrations of mediator until app,roximately 10 mM K3Fe(CN), (Figure 3.6). The K, (as
determineci h m a Hanes plot - not shown) of potassium ferricyanide was fairly high (10.5 mM).
and the v,, was 2.5 PA. Partially for reasons of toxicity, 20 mM K3Fe(CN), was chosen as the
o p h d concentration to use for measurements at a set potentiai. Incfeasing K,Fe(CN), to 40 mM
would only effect an -20 % increase in the signal nsponse. DiMisional constraints causing electron
shuttle lags due to limiting %Fe(CQ were not expected to occur at this concentration. As a result.
20 rnM K3Fe(CN), concentration was considerrd sufficient to account for eiectmn shuttling and
any increase in mediator concentration was avoided owing to possible negative effects on the y w t
cells. Atkinson and Haggett (1993) suggested that prolongeci exposure to potassium femcyanide
can induce a toxic response in cells. This is likely a consequence of excessive diversion of the
electron transport chah via mediaîor reduction (Ramsay and Turner. 1988). An investigation into
the toxic effects of potassium femcyanide on the isolates (via standard plate counting) revealed that
54

Figure 3.6 Optimization curve indicating standard deviations for potassium ferricyanide (+400 mV, 100 m M PBS buffer pH 7.2.22O~)
growth was not observed for SPTl in concentrations above 15 mM. Mediator concentrations
ranging from 1 to 5 mM were sufficient to inhibit growth for S m .
Owing to solubility, the preparation of HMFC does not allow for concentrations exceeding 8
rnM. The solution prepared in our laboratory according to a patented procedure (U.S. patent no. 5,
432, 274) had a concentration of 6.33 mM, and thus limited the range over which the H M P
optimization couid be measured. The response heights to 20 pprn (BOD) additions of GGA were
measured from 0.1 m . to 4 mM HMF+ Figure 3.7). Fortunately, the K,, of HMF+ was 7-fold
lower (1.5 mM) than for K3Fe(CN)6, indkating better mediator efficiency. However. the V,
using HMF+ as mediator was -25-fold lower (0.1 pA) than that of K3Fe(W6. A concentration of
3 mM HMF+ was detennined to yield the maximal response height. Increasing HMF+
concentrations beyond this resulted in a decreased mean signal. HMF+ concentrations were held at
3 m M for al1 future experirnents.

Hydroxymethlyferricinium ( m m
Figure 3.7 Optimization curve showing standard deviations for hydroxymethylfemcinium (+285 mV, 100 mM PBS buffer pH 7.2,22 O C )

303.2 Optimal yeast loading
Increasing the number of cells at the surface of an electrode often results in increased signals
as a consequence of a greater nurnber of redox reactions occuning (Chan et al., 1999; Li et al..
1994; Tanaka et al., 1994). However, such behaviour was not observed with the two isolates in
this study (Figure 3.8). Response heights increased with increasing yeast slurry volume up to 15
jL, for both SPTl and S m . This quantity represented a mean (n=lO) wet weight of 15.0 mg for
both strains. Increasing the slurry volume beyond this point resulted in decreasing signals, likely
due to mass transfer difision. Since only those yeasts in intimate contact with the electrode were
presumed to contribute to the signal response, this may have been a consequence of mediator and
substrate diffusional constraints. Similarly , Richardson et al. (1 99 1) observed Mat increasing the
microbial load past an optimal density (i.e. 2.25 x 10⁸) created diffusional barriers that Limited the
access of substrate to the ceiis and mediator to the cells and the electrode. Large quantities of yeasts
retained behind a dialysis membrane may have directly interfered with the signal response by
creating a diffusional barrier. This was evidenced by the increased response times observed for the
electmdes with higher volumes of retained yeast. Substrate utilization by the outemost yeasts (not
in intimate contact with the surface of the electrode) may have indirectly conûibuted to decreased
signals. The latter hypothesis may account for the decreased signal observed for higher
concentrations of yeast. To be effkctive the substrate must fmt be in close proximity to the surf'
of the elecaode and the biocatalyst. Therefore, difisional barriers or prcmature consumption by
the outermost yeast not in intimate contact with the surface of the electrode will naturally cause
delayed and decreased height responses.

- 0 5 10 U 20 25 30 Yeast load (PL)
Figure 3.8 Determination of optimal loadin for isolates te ) SPTl and te) SPTZ indicatin rnean values (n=3) on glassy c&n electrode (+450 mV. 20 mM K,Fc(CN)~, 100 mhf PBS pH7.2.22 O C , emr bars = standard deviation).

3.3.3 Preconditioning of Eleetrode
Preconditioning of freshly prepared electrodes was necessary because no mediation was
observed upon addition of pulp miH effluent. Newly prepared sensors did not exhibit sensitive
responses to pulp mil1 samples and only minimal responses to GGA additions. Current increases
were observed only after the injection of 1000 ppm GGA. This indicated that mediation was
indeed occumng, yet at an extrernely minimal level. Repeated use of the electrode over a number of
days resulted in increasing response heights. Investigation of the Literature reveaied that this was
not an unusual phenornenon. Li et al. (1994) observed that preconditioning of their BOD sensor
was necessary to obtain optimal responses. They concluded from their study that the time required
for preconditioning was determined by the quantity of microorganisms on the electrode (Le. a
minimum of 20 hours for 2.2 X 10⁸ cells) and the concentration of GOA exposed to the
microorganisms (70 ppm was optimal). Yang et al. (1996) also concluded that their BOD sensor
required 24 hours of preconditioning (i .e. five minute substrate measurements every thirty minutes).
Praet et al. (1995) noted that regeneration of their elecaode, after storage, twk 2 to 4 days. In this
study, both the preconditioning time and procedure needed to be experimentaily established for each
microorganism.
Preconditioning via star vation
Initial investigations to determine the length of pmconditioning time involved staning the
cells in a stimd solution of 100 mM PBS buffer pH 7.2 while taking daily measurements in
triplicate. Figure 3.9 shows the time needed to obtain the optimal response height via starvation for
the sensor using strain SPT1. Up to 10 days of starvation in 100 m M PBS buffer pH 7.2 were
needed for SPTl to attain the maximm response height via this method. For the first five days of
effluent measurement responses only increased from 0.03 pA to 0.065 pA. After this point the
responses increased linearly to 0.17 pA for a 20 ppm (BOD) of Thurso primary seitling basin
effluent. Preconditioning beyond this point resulted in a slight increase in the mean
60

4 6 8 Time (days)
Figure 3.9 Response of isolates (+) Sm1 and (+ ) SPT2 to additions of 20 ppm BOD effluent after several days of preconditioning via starvation in la0 mM PBS buffer, pH 7.2 (+450 mV, 20 rnM K,Fe(CN),. 22 O C . emr bars = standard àeviation)

response (to 0.185 pA) that was within the standard deviation of the result obtained after 10 days.
The time needed for the SFl"2 sensor to attain a maximal response to 20 ppm (BOD) effluent
from the Thurso pnmary clarifier was 60 percent less then the time needed by the SPTl sensor
(Figure 3.9). After four days of starvation in 100 rnM PBS buffer pH 7.2, responses from the
SPT2 sensor increased from no response after one &y of preconditioning, to the maximal value of
approximately 0.06 FA. This result is similar to that obtained by Tan et al. (1993) who observed
that three to four days of preconditioning was needed by their microbial (Bacillus spp.) BOD
sensor to obtain optimal responses. Chan et al. (1999) had similarly found that a p e n d of five
days was needed to obtain a maximal signai t'mm their yeast based BOD sensor. They claimed that
a gradua1 increase in the sensor signai for the first five days was a consequence of smail but
significant growth of the yeast (Amlu odeninivorans) and that a graduaiiy decreasing background
current "proves" this assumption. This is likely not the case with two yeast isolates used in this
study since preconditioning via starvation did not provide any opportunity for yeast growth. In this
case, increased signals were more Likely related to metabolic changes within the yeasts. Heim et al.
(1999) reported that preconditioning of their Rhodococcur eryrhropolis and Zssatchenkur orientalis
sensor via ovemight starvation effected higher signals than starvation from O - 6 hours. They
attributed this to the requirement of cells to exhaust intemally stored carbon sources pnor to the
acceptance of extemal supplies. A similar phenornenon was believed to have occurred here.
Preconditioning v i ù incubation witir 50 % effluent
Riedel et al. (1990) determined that preincubation of an oxygen-based BOD biosensor
(using the yeast TnChoporon c~aneum ) allows for better correlations to actual BODs values as a
result of increased sensor responses. Preincubation of 12 hours in various wastewaters was
suffkient to increase responses (ic. -200 % and -300 96 for food factory and chernical industry
wastes, respectively) such that they comlated well with BODS values (i.e. R~ =0.933). A similar
result was obtained by Tan et al. (1993) who deduced that supplemcnting the culture growth
62
medium with 10 45 of the desired organic solute resulted in significantly improved signals of their
oxygen-based BOD sensor. However, this modification of the growth medium did not alter the
period of preconditioning. The objective of this investigation into preconditioning was to alter the
sensor activity by increasing sensor sensitivity and selectivity for the substrate. In a process calied
direct induction. preincubation of the sensor in the desired substrate is expected to induce uptake
systems and metabolic degradation pathways of the microorganisms for that substrate (Riedel
1991). On the basis of such results, preincubation with effluent h m the primary settling basin of
the Thurso mil1 was investigated.
The S m 1 sensor attained a maximal response to 20 ppm (BOD) injections of effluent by the
fourth day (Figure 3.10). This represents a decrease in preconditioning time of six days as
compared to the starvation technique. This agreed well with the findings of Chan et al. (1999) and
Tan et al. (1993). however, the lower mean responses upon reaching the plateau stage contradicted
the aforementioned results obtained by Riedel et al. (1990). One possible explanation for this stems
h m effluent toxicity. The presence of heavy metal ions in an effluent sample can have deletenous
effects on the biocatalyst if exposed to them for extended periods of time (Kim and Kwon; 1999, Li
and Tan. 1994b; Riedel 1998b). In particuIar, Ag+, Cd2+, cu2+, ~ g * + , and kfn2+ exhibited
various levels of inhibition for different microorganisms. When Riedel et al. (1990) conducted their
preconditioning expriment, the microorganisms were exposed to the effluent for a pend of only
12 h. Extended exposure to effluent (such as in this study), while still inducing metabolic systems,
may also have negative impacts manifested by decreased overall signais - especially if the sole
biocatdyst is susceptible to effluent toxicity. The heavy metal concentrations in the effluent from
the Thurso primary clarifier were not measured in this study.
The results obtained h m the preconditioning test involving isolate SET2 are also displayed
in Figure 3.10. Interpretation of the result was diffcult since the preconditioning time had
increased by one day. Preconditioning of the SPT;! sensor in the presence of a 50 % effluent

O 1 2 3 4 5 6 7
Time (days)
Figure 3.10 Reponse of isolates (+) SPTl and (+) SPT2 to additions of 20 ppm BOD Thurso effluent a h several days of preconditioning via 50 % effluent and 50 % 100 mM PBS buffer. pH 7.2 (+450 mV, 20 mM K,Fe(CN),. 22 OC. emr bars = standard deviation)
solution required five &YS, as opposed to the four days needed under starvation conditions. After a
period of four days of incubation in 50 % effluent the mean response height was 0.056 PA. This
corresponded very well with the result obtained for SPT2 after four days of preconditioning via
starvation (i.e. 0.057 PA). The mean response obtained for day five increased to 0.088 PA,
slightly higher than the response obtained after five days of starvation preconditioning (0.074 PA).
A decrease in the mean signal was observed after the fifth day. These results indicated that the
SPT2 isolate did not respond significantly to metabolic response induction via incubation with the
target analyte.
The reasons behind why isolate SPT2 did not respond to direct induction were not clear.
The difference could be related to the use of a mediated sensor as opposed to the oxygen-based
electrodes used in previous investigations. For example, mediated sensors which use ferrocenes
have been shown to require a preconditioning period that other mediated sensors do not (Cass et al.,
1984; Gunasingham and Tan, 1990). However, considering isolate SPTl did respond well to
direct induction, the reasons behind the lack of response by SPTZ are probably relate. to it simpiy
being another strain with other metabolic requirements.
3.3.4 pH Response Range
The optimal pH range for sensor operation was deterrnined by measuring the responses of
both isolates to 20 ppm (BOD) GGA under varying pH conditions (Figure 3.1 1). Measurements
were taken over a pH range of 5 to 8 using 100 m M buffer concentrations. Considering these
strains were isolated via acidic media (pH 3.5) both strains were expected to prefer pH conditions
below the 7.2 used in previous rneasurements. Isolate S m 1 displayed a clear maximum c m n t
response at pH 6.0, and decreasing the pH from 6.0 to 5.0 resuited in decreased signds (i.e. 0.165
vs 0.044). The S m 2 sensor exhibited increased responses with decreasing pHs, suggesting that
SFT2 was an acidophile. The maximum response for isolate SPT2 was obtained in PBS buffer at
pH 5.0. Attempts to take rneasurements at lower pHs with buffers such as phthalate, acetak, and
65

Figure 3.1 1 Reponse of isolates Sm1 and SPT2 to additions of 20 ppm GGA under varying pH conditions in 100 m . buffers (+450 mV, 20 m M K,Fe(CN),, 30 OC. error bars = standard deviation).

citrate yielded no responses. For indeterminate reasons, SPT2 did not respond to substrate
additions when buffers other than PBS were used in acidic conditions with potassium fenicyanicie.
Since the standard deviation at pH 5.0 overlapped the mean response at pH 6.0 (for the SPTZ
sensor), the latter pH was chosen as the optimal pH for al1 measurements. This permitted us to
maintain an equilibrium between the two sensors.
3.3.5 Temperature Response Range
The optimal operating temperature for both isolates was detexmineci via responses to 20 ppm
(BOD) GGA under varying temperature conditions. The temperature range used to monitor the
responses for both strains ranged from 5 'C to 50 OC. A comparison of the temperature response
ranges of the two isolates is presented in Figure 3.12. The maximum response height for isolate
SFï2 was severai times higher than that of SFïl (about 7-fold higher). Since al1 conditions were
identical for both strains. the higher response heights for S m 2 were presumed to be relatcd to
mtabolic processes. Both isolates exhibited a maximum mean response at 40 %. In the case of
S m 1 there was a 6 96 increase in mean response from 30 OC to 40 'C. Isolate SPT2 displayed a
response increase of approximately 17 % fkom 30 OC to 40 OC. In both cases, there was an increase
in the standard deviation in the responses with increasing temperature. Owing to increased standard
deviations and the possibility that extended masurement periods at higher temperatures codd lead
to a shortened service Me of the sensor, 30 'C was chosen as the optimal operating temperature.
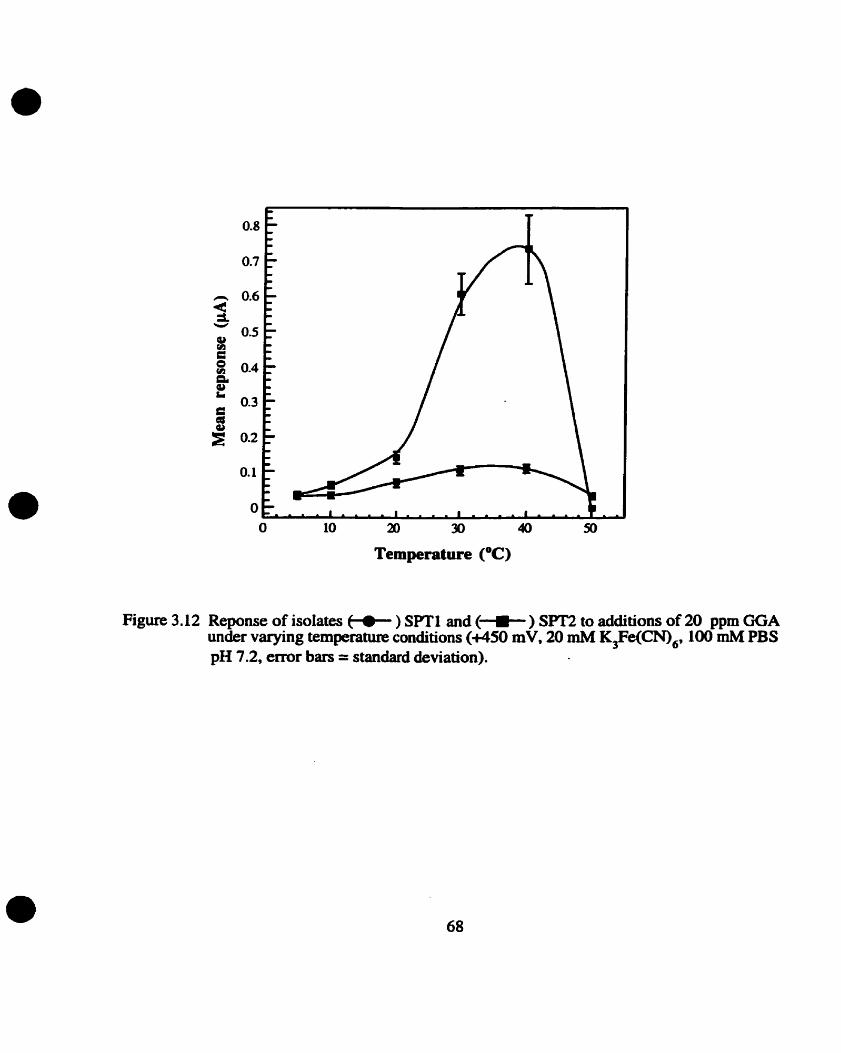
O 10 20 30 40
Temperature ( O C )
Figure 3.12 Reponse of isolates + ) Sm1 and (+) SPT2 to additions of 20 ppm GGA under varying temperature conditions (+450 mV, 20 mM K,Fe(CN),, 100 mM PBS pH 7.2, error bars = standard deviation).

3.4 Standard Solution Calibration Curve
The responses to various concentrations of standard solution at a set potential was measured
for both isolates using the only two mediators (potassium femcyanide and H e ) which exhibited
significant increases in oxidation currents during CV scanning.
3.4.1 GGA calibration using potassium ferricyanide
The mean response heights of the SPT1 and SPT2 sensors to various concentrations of
GGA under optimal conditions (450 mV, 30 OC, pH 6.0, 20 mM K,Fe(CN),, and 15 pL yeast
load) are presented in Figure 3.13. Measurements were taken in sets of three using one electrode.
The SFTl sensor had a detection limit of 2 pprn (BOD), while the SPT2 sensor was able to respond
to GGA concentrations as low as 0.5 ppm. The standard enor of the mean at 10 pprn BOD was
10.1 % and 3.9 5% for the SPTl and SPT2 sensors, respectively. A clear distinction could be found
in the mean responses to various concentrations of GGA between isolates SPTl and.SPT2 in that
the responses of SPT2 were more robust. Not only is isolate SPT2 more sensitive to low
concentrations of GGA, it also displayed a greater maximum response to GGA than SPTL (i.e.
-600 vs -200 pprn BOD, respectively). The mean response height of the S m 1 sensor to 600 pprn
(BOD) GGA was 1.8 pA while the SPT2 sensor gave an 8.0 pA response to the same quantity of
GOA. The reasons for this difference in response values has not been investigated but is iikely
related to differences in substrate assimilation capabilities.
Another impottant difference between the two isolates lies in their respective capacities to
linearly assimilate GGA (Figure 3.14). The SPT2 sensor exhibited linearity to higher
concentrations vs the SPTl sensor (i.e. 200 vs 100 pprn BOD, respectively). The iinear response
range of the SPT2 sensor extended from 0.5 pprn to 200 ppm, while that of the SPTl sensor
extended h m 2 to 100 ppm. This represents an 8-fold broader range for the SPT2 sensor. Linear
reg~ssion analysis indicated that the response ranges of both sensors were highly significant. The
coefficient of determination for the SPTl based sensor was 0.998, while the SPT2

Figure 3.13 GOA calibration c w e for isolates + ) SPTl and + ) SPT2 using potassium ferricyanide as a mediator (+450 mV, 20 mM K,Fe(CN),, 100 mM PBS pH 6.0, 30 OC, error bars = standard deviation).

Figure 3.14 Linear response range to GGA for isolates ) SPTl and (+ ) SVIZ using potassium femcyanide mediation (+&O mV. 20 m M K,Fe(CN),, 100 m . PBS pH 6.0.30 O C . error bars = standard deviation).
sensor had an R~ value of 0.995 over the linear response range. The mean standard àeviations
throughout the linear range were fairly low for both SPTl and SPT2 (0.038 and 0.055,
respectively). These results compared very well with the findings of other authors (see Riedel,
1998). As previously mentioned, the average linear range for a standard solution was only 80 ppm
(BOD) (Yang et al., 1996). Furthemore, using the mediated sensor system has enabled these new
isolates to detect very low concentrations of GGA. The sensor using isolate SPT2 is able to &tect
GGA concentrations as low as those obtained by Yang et al. (1996). and was as sensitive as the
BOD sensor developed by Chee et al. (1999).
3.4.2 GGA calibration using hydroxymethylferricinium
The potential of using HMF+ as an electron mediator was demonstrated in the cyclic
voltammetric investigations. Owing to a substantially lower anodic peak, measurements involving
HMF+ were taken at + 285 mV as opposed to + 450 mV for potassium femcyanide. The lower
operating potential of HMF+ offered the passibility of decreased interference h m electmdiemically
active compounds in effluent samples.
The calibration curves of both strains using HMF+ are shown in Figure 3.15. Both sensors
exhibited substantially decreased signals as compared to responses using potassium femcyanide
mediation. This was likely a consequence of the -25-fold lower V, exhibited with HMFC
mediation. As with the measurement using potassium ferricyanide, the SPT2 sensor exhibited a
much more robust response to the various GGA concentrations then the SPTl sensor. The
response plateau of SPTl was reached at a substrate concentration of 300 ppm (BOD). At this
concentration the mean response of Sm1 was only 0.26 pA. The SPT2 sensor attained the point of
suhstrate saturation at a concentration of 250 ppm (BOD) of GGA (note that a 300 p p m
measurement was not taken). At this concentration, the mean response height of the SET2 sensor
was 1.85 FA. This represents a seven-fold higher current then SPT 1, suggesting that SFT2 is
capable of more sensitive substrate utilization. Considering these mnds were persistent for both of

O 100 200 300 400
GGA concentration (ppm)
Figure 3.15 GGA calibration cuve for isolates + ) SPTI and ) SPT2 using hydroxymethyIferriciniwn as a mediator (+285 mV, 3 m HMF+, 100 mM phthdate pH 6.0, 30 OC, emr bars = standard deviation).
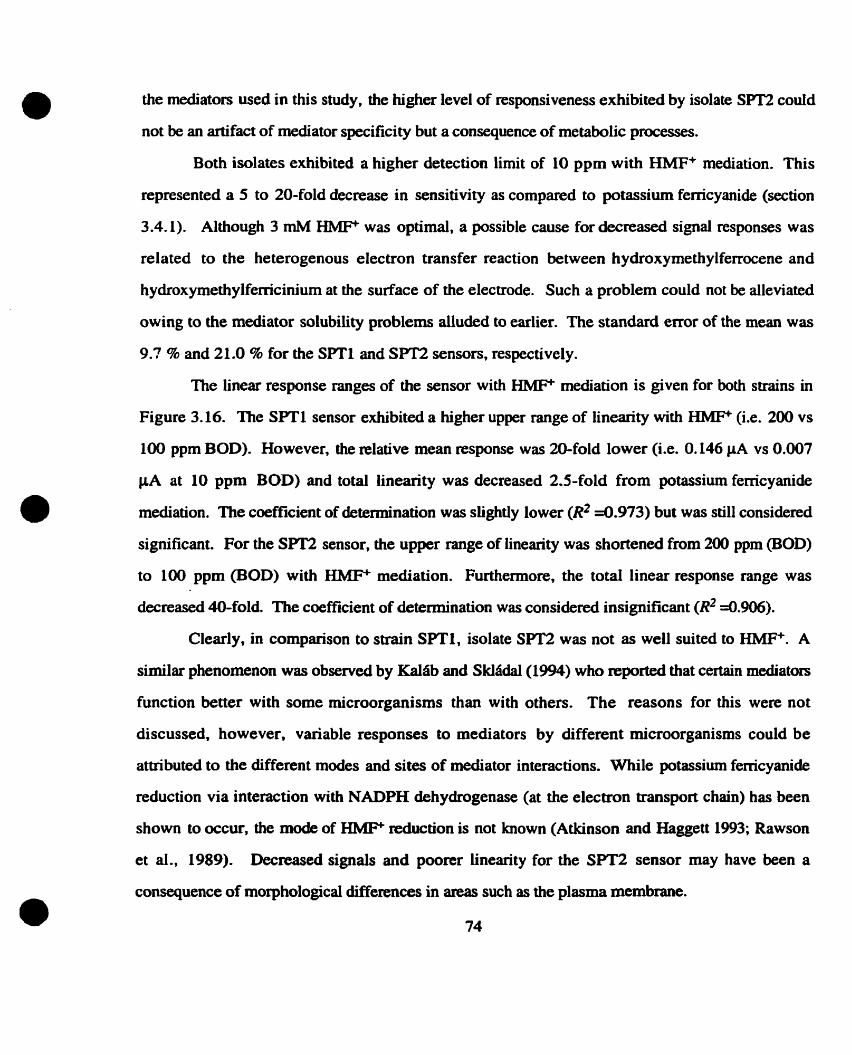
the mediators used in this study, the higher level of responsiveness exhibited by isolate SPT2 couid
not be an artifact of mediator specificity but a consequence of metabolic processes.
Both isolates exhibited a higher detection limit of 10 ppm with HMF+ mediation. This
represented a 5 to 20-fold decrease in sensitivity as compared to potassium femcyanide (section
3.4.1). Although 3 mM H W was optimal, a possible cause for decreased signal responses was
related to the heterogenous electron transfer reaction between hydroxymethylferrocene and
hydroxymethylfemcinium at the surface of the electrode. Such a problem could not be alleviated
owing to the mediator solubility problems ailuded to earlier. The standard error of the mean was
9.? % and 21.0 % for the S R 1 and SPT2 sensors, respectively.
The linear response ranges of the sensor with H W mediation is given for both strains in
Figure 3.16. The S m 1 sensor exhibited a higher upper range of linearity with HMF+ (i.e. 200 vs
100 ppm BOD). However, the relative mean response was 20-fold lower (i.e. 0.146 FA vs 0.007
pA at 10 ppm BOD) and total linearity was decreased 2.5-fold from potassium femcyanide
mediation. The coefficient of deterinination was süghtly lower ( R ~ =0.973) but was still considered
significant. For the SPlvZ sensor, the upper range of linearity was shortened from 200 pprn (BOD)
to 100 ppm (BOD) with HMF+ mediation. Furthemore, the totd linear response range was
decreased 40-fold. The coefficient of determination was considered insignificant (R* d.906).
Clearly, in comparison to strain SPTl, isolate SPT2 was not as well suited to HMF+. A
similar phenomenon was observeci by Kalsb and Skliidal(1994) who reported that certain mediators
function better with some microorganisms than with others. The reasons for this were not
discussed. however, variable responses to mediators by di fferent microorganisms could be
attributed to the different modes and sites of mediator interactions. While potassium femcyanide
reduction via interaction with NADPH dehyàrogenase (at the electron transport chah) has been
shown to occur, the mode of HMFC reduction is not known (Atkinson and Haggett 1993; Rawson
et al., 1989). Decreased signals and poarer linearity for the SPT2 sensor may have been a
consequence of morphological differences in areas such as the plasma membrane.
74

GGA ppm (BOD)
Figure 3.16 Linear response range of isolates Ce ) SPTl and CC ) SPï2 to GGA using hydroxymethyifenicinium as a mediator (+285 mV, 3 mM HMF*, 100 rnM
phthaiate pH 6.0,30 OC, emr bars = standard deviation).
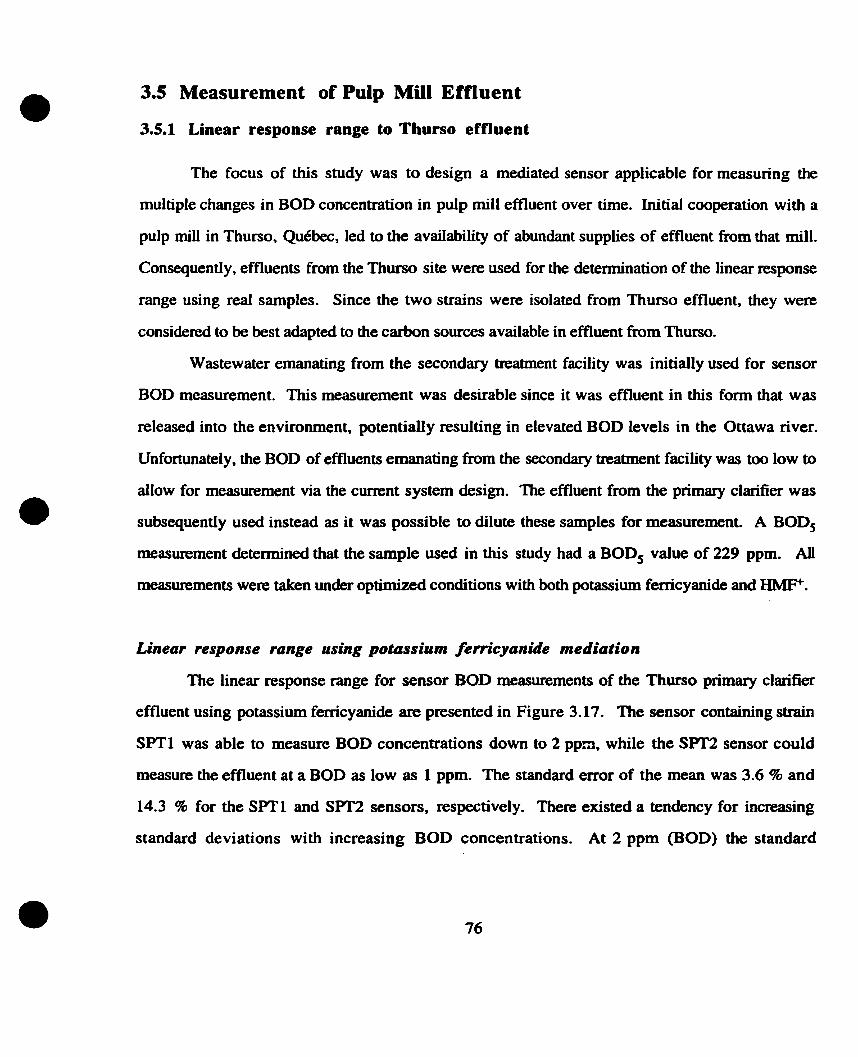
3.5 Measurement of Puip Mill Effluent
3.5.1 Linear response range to Thurso effluent
The focus of this study was to design a mediated sensor applicable for measunng the
multiple changes in BOD concentration in pulp mil1 effluent over time. Initial cooperation with a
pulp mil1 in Thurso, Québec, led to the avaitability of abundant supplies of effluent h m that mill.
Consequently, effluents from the Thurso site were used for the determination of the iinear response
range using reai samples. Since the two strains were isolated from Thurso effluent, they were
considered to be best adapted to the carbon sources availabie in effluent frorn Thurso.
Wastewater emanating from the secondary treatment facility was initially used for sensor
BOD measurement. This measurement was desirable since it was effluent in this form that was
released into the environment, potentially resulting in elevated BOD levels in the Ottawa river.
Unfortunateiy, the BOD of effluents emanating h m the secondary treatment facility was t m low to
allow for measurement via the current system design. The effluent from the primary clarifier was
subsequently used instead as it was possible to dilute these samples for measurement. A BOD5
measurement cietennineci that the sample used in this study had a BODS value of 229 ppm. AU
measurements were taken under optimizzed conditions with both potassium femcyanide and H M F .
Linear response range using potassium fem'cyanide mediation
The linear response range for sensor BOD measurements of the Thurso primary clarifier
effluent using potassium femcyanide are presented in Figure 3.17. The sensor containing strain
SPTl was able to measure BOD concentrations down to 2 ppa. while the SET2 sensor could
measure the effluent at a BOD as low as 1 ppm. The standard error of the mean was 3.6 % and
14.3 % for the SPTl and SET2 sensors, respectively. There existed a tendency for increasing
standard deviations with increasing BOD concentrations. At 2 ppm (BOD) the standard

Figure 3.17 Linear response ranges of (+) SPTI and (-) SPT2 sensors to pulp miil effluent from Thurso using potassium femcyanide mediation (+450, 20 mM K3 Fe(CN), 100 rnM PBS pH 6.0,30 O C , emr bars = standard deviation).

deviations were 0.007 and 0.004 for the SPTl and SPTZ sensors, respectively. These values
increased to 0.122 for Sm1 and 0.061 for SPT2 at the upper limits of the respective measurements.
Both sensors exhibited excellent coefficients of determination of 0.998 and 0.988 for S m 1 and
SPT2, respectively. Despite the more robust nahm cf isolate SPT;?, i t was not a surprise to find a
better correlation coefficient and higher rnean responses from the SPTl sensor. As determineci by
the carbon assimilation tests (Tables 3 and 4), strain SPTl has a much broader substrate
assimilation range than SPT2. Several authors (Racek, 1995; Riedel et al., 1998; Sangeetha et al.,
1995) have cornmented that a good BOD sensor should incorporate a rnicroorganism strain
possessing a broad substrate spectrum as this allows for the increased probability that the
rnicroorganism will be able to assimilation the numerous compounds present in wastewaters. A
similar observatiorr was obtained here.
Linear response range using hydroxymethylferriciniurn rnediation
The linear response ranges to Thurso pnmary clarifier effluent for sensors using H M P
rnediation are presented in Figure 3.18. The results from these experiments were similar in nature
to those obtained with sensors using potassium ferricyanide in that sensors incorporating isolate
SPTl had higher overall mean responses and a longer response range then when SFT2 was used as
the biocatalyst. This finding was once again in agreement with the obsewations of other researchers
regarding biocatalyst substrate spectra (Racek, 1995; Riedel et al., 1998; Sangeetha et al., 1995).
The SPTl sensor had a linear range extending from 10 - 60 ppm (BOD). When SPT2 was used as
the biocatalyst, the linear response range for the effluent extended h m 5 pprn (BOD)
to only 20 ppm (BOD). The standard e m r of the mean was 13.3 % and 22.2 % for the Sm1 and
SPTZ sensors, respectively. The standard deviations values for both sensor measurements was
low. however, this was a consequence of very low overall responses Uely due to weak mediation.
At 10 ppm, SPT1 and SPT2 sensors using HMFC mediation had responses approximately 10 and

Figure 3.18 Linear response range of isolates f-0- ) SPT 1 and ( ) S m to primary effluent from Thurso using hydroxymethylfemcinium as a mediator (+ 285 mV, 3 mM HMF+, 100 mM phthalate pH 6.0.30 OC, error bars = standard deviation).

4-fold lower than measurements taken wi th potassium ferricyanide mediation (for the SPT l and
SFT2 sensors. respectively). This could again be a consequence of slow mediator cycling owing to
diffusional problems caused by low mediator concentrations. as was perhaps the case with GGA
measurement (section 4.2). The coefficients of cietennination with HMF+ also were not as good as
with potassium femcyanide mediated sensors. The SPTl sensor had an R~ value of only 0.939
while sensors using SFT2 had a better R* value of 0.996 (although this could be an artifact caused
by a low sample number).
3.5.2 Measurement of various effluents
Due to the complexity and the ever changing nature of pulp mil1 effluents @ence and Reeve,
19%; Lloyd et al., 1997; Suntio et al., 1988), a BOD sensor must have a wide substrate specttrum.
Several authors have shown such sampling flexibility with their BOD sensors. The BOD
concentration of various municipal wastewaters (Marty et al., 1997; Princz and Olah, 1990; Tan a
a . al.. 1992) dong with factory effluents (Li and Chu, 1991; Pnncz and Olah, 1990; Riedel et al..
1990; Sangeetha et al., 1995) were successfully monitored with oxygen based biosensors. A
practical BOD sensor for pulp mil1 effluents should exhibit g d reproducibility with changing
effluent composition. Consequently, the universality of the mediated BOD sensor was exarnined.
Effluent samples from a total of eight different mills were analyzed. In al1 measurements,
potassium ferricyanide was used since it displayed better propeities than H e . Al1 panimeters
were optimized. Preconditioning of al1 sensors was done via the starvation technique to avoid any
possibility of reduced signals due to effluent toxicity . and to prevent skewed results due - to
habituation to any one specific substrate.
Reproducibitity witnin effluent samples
The sensor reproducibility results were based on a minimum of four 200 pL measurements
of each effluent sarnple. The mean response heights for each effluent were correlated to a sensor
80

BOD value by means of the slope forrnulae obtained from the GGA calibration plots for each
respective sensor. Response times for these measurements ranged from approximately 5 to 10 min
for both sensor types. Bar graphs of the response reproducibility for the various effluents are
presented in Figures 3.19 and 3.20 for the SPTl and SPT2 sensors, respectively. The mean
sensor BOD value for each effluent is given dong with the upper and lower confidence intervais.
Both the SPTl and the SPT2 sensors had excellent response reproducibility for each effluent
sample. The measurements within effluent samples for both sensors never deviated more than 1
ppm (BOD) except for the SPTl sensor measurement of the Beaupré sample (1.2 ppm). The
standard deviation in response signals from the sensor incorporating isolate SPTl had a maximum
standard deviation of 0.07 1 for the effluent sample h m Thurso and a minimum standard deviation
of 0.040 for the effluent originating from Madawaska. Response reproducibility between three
electrodes was aiso determined for the SPTl sensor only. The sensor responses had a standard
error of the mean of 10.6 8 when 20 ppm BOD Thurso effluent were measured.
The standard deviations in the responses were higher for the sensor using SPT2 as the
biocatalyst. The maximum standard deviation for the SPT2 sensor was observed for the Beaupre
sample (0.265), while the least amount of standard deviation came from the Madawaska sample
(0.022). Overall, the SPTl sensor exhibited higher responses then the SPT2 sensor to the various
effluents. The SPT1 smsor rrsponses comlated to roughly 5 pprn (BOD) (except for the Beaupré
sample), while the SPT2 sensor gave responses ranging h m under 1 ppni to nearly 6 ppm (BOD).
Once again, the differences in response heights could be xdated to the metabolic capacities of each
isolate. These differences were examined in the correlation of sensor BOD to the BOD5 value.
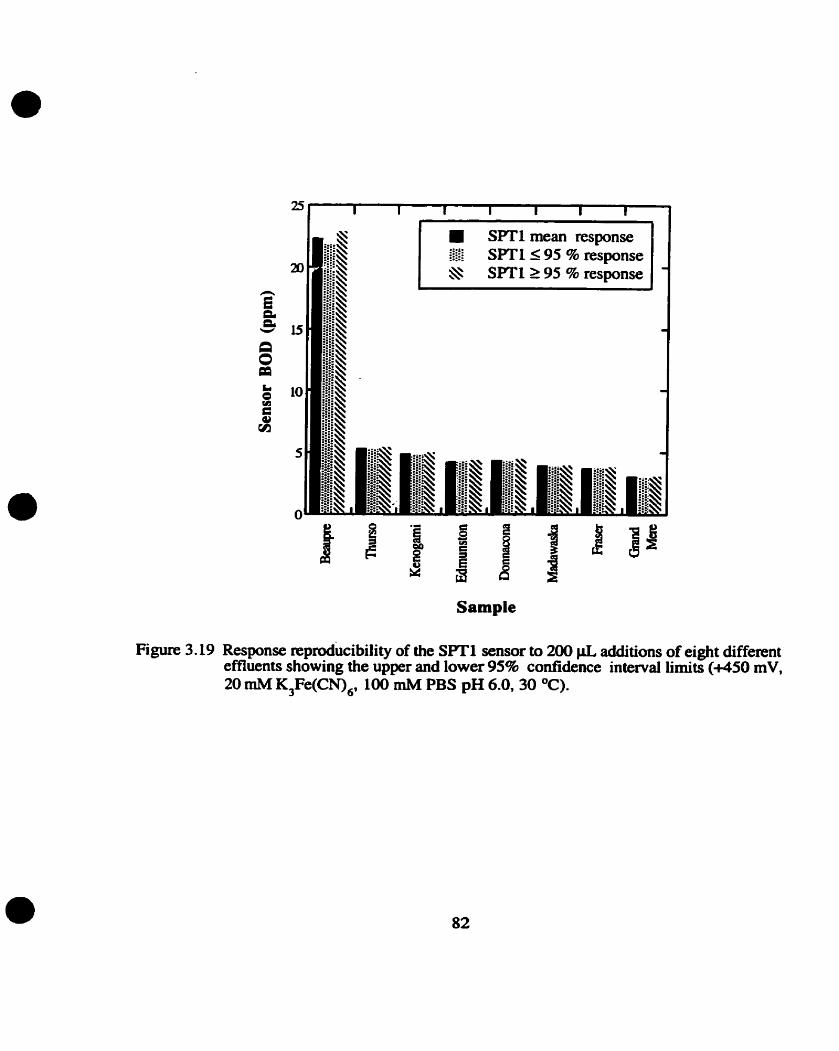
Sample
Figure 3.19 Response repr~ducibilit~ of the Sm1 sensor to 200 pL, additions of eight different effluents showing the upper and lower 95% confidence interval lirnits (+450 mV, 20 rnM K,Fe(CN),, 100 mM PBS pH 6.930 OC).
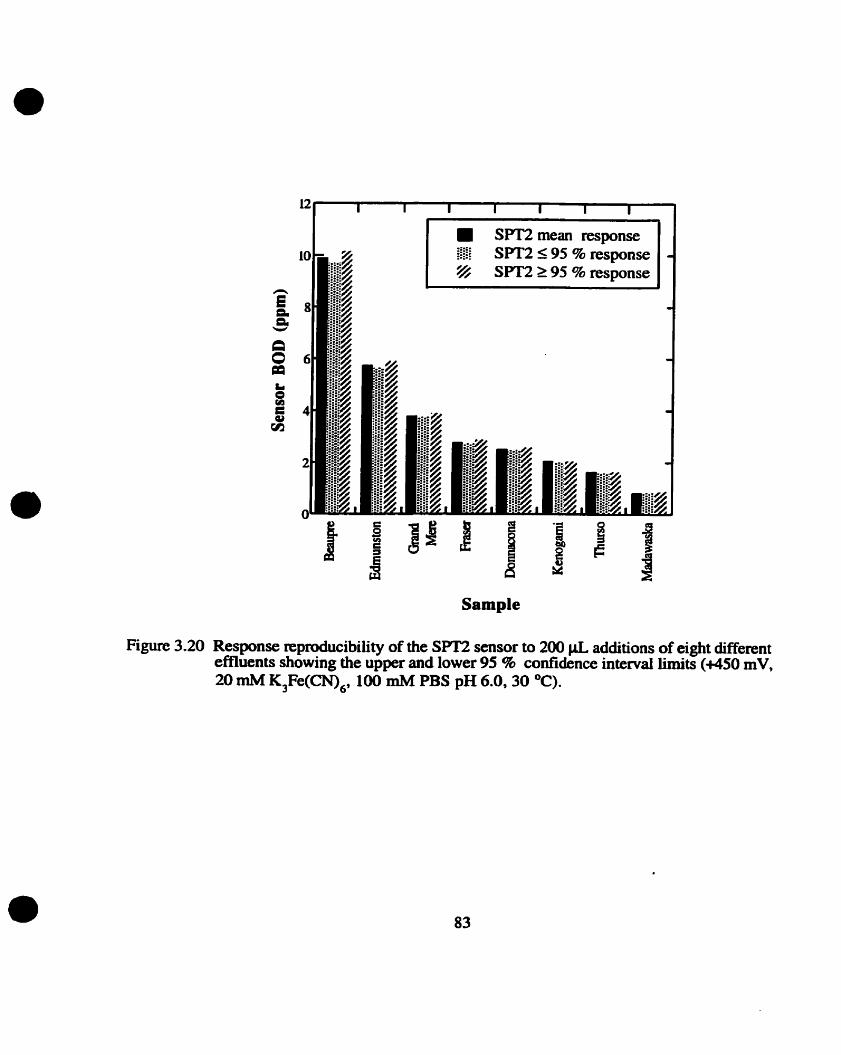
12 I I I I 1 I I
I S P T ~ mean response 1 I
:i:i: riri SPM 195 % response ,
SPT2 à 95 % response I
Sample
Figure 3.20 Response reproducibility of the S m sensor to 200 pL additions of eight different effluents showing the upper and lower 95 % confidence intetval limits (+450 mV, 20 mM K,Fe(CN),, 100 mM PBS pH 6.0,30 OC).

Correlation of senior BOD V U Z U ~ with BODS value
For the validation of the results obtained in Figures 3.19 and 3.20 with respect to tnie BOD
values, as measured by the standard BODS test, a percent correlation was calculated (Table 3.6).
Between the two sensors, only the sensor was able to yield a measurement with less than
10 % error. The best correlation (103 46) was found with the SPTl measurement of the sample
from the Fraser mill. The only effluent measurement which resulted in sensor BOD value
comlations close to the standard BODS values came from the Thurso effluent which had a 116 %
correlation. The correlations for ail other effluents were either too high (Beaupré, Kenogarni,
Madawaska) or too low (Domacona, Edmunston, Grand Mère) to be significant.
Possible reasons for why the Sm1 sensor yielded results up to almost 200 96 (Beaupré)
those of the BOD, values were net clear. The responses were initially attributed to electrochemical
interferences, however, examination of the data (not shown) obtained from the negative controls
rpfuted this notion. When these effluents were masured using a bare electrode (i.e. no cells only a
dialysis membrane) the responses to 200 effluent injections were negligible in comparison to
those obtained in the presence of viable ceus. aven that the rnicroorganisms on an elecnode have
only minutes to assimilate a complex combination of substrates present in the effluent, while the
standard BOD, test involved many microbiaf species over a period of five days. the reasons behind
why some sensor responses were higher than the BOD5 responses has not been determineci. A
similar phenornenon was encountered by Lehmann et al. (1 999) with their A. adeninNoruns -baseci
biosensor. They suggested that the exceptiondy large substrate range of A odeninivorans caused it
to bs hypersensitive to substrates (as compared to the mUed populations used in the BOD5)
resulting in higher sensor values. This hypothesis was consistent with the findings in this study,
where the SPTl (wit h its greater substrate s ~ t n i m ) sensor exhibited hi&er sensor - BODI, ratios
than the SET2 sensor. Another important factor demonstrateci by Liu et al. (2ûûû) was that sensor - BODS ratios can be dependant upon the composition of the standard solution used for calibration.
They argued that when GGA is used as the standard solution over-estimations of BOD values will
84

Table 3.6 Correlation of sensor BOD and BODs values for various effluents
Sarn~le
Beaupre
Donnacona
Edmunston Fraser
Grand Mere
Kenogami
Madawas ka
Thurso
Samde Beaupre
Donnacona Edmunston Fraser
Grand Mere Kenogami
Madawaska Thwso
SPT1 sensor (95% confidence interval, slope' = 0.0137)
Sensor BOD
22.3
4.38
4.33
3.78
3 .O6
4.88
3.93
5.32
SPT2 sensor (95% confidence interval, slope* = 0.0267)
Sensor BOD
9.9 1
2.52
5.76
2.79
3.8 1
2.03
0.83
1.62
Ratio (%)
87.8
32.9
82.3
75.7
28.7
58.0
27.7
35.3
* The siopes were obtained h m the ünear response ranges to standard solution (Fig. 3.14) and used to calculate the sensor BOD values (n=5).

occur. This is due to the sudden stimulation of several distinct metabolic pathways required for the
assimilation of the complex mixture of substrates in wastewaters. I t was suggested that using
synthetic wastewater was more appropriate for sensor calibration as it contained numerous
compounds and did not lead to sensor BOD over-estimations.
Readings obtained with the SET2 sensor were consistently lower then the values yielâed
by the conventional BODs method as also seen with the sensor developed by Tan et al. (1992).
This was not unexpected given the results obtained for the linear response range of the Thurso
effluent. If the criterion given by Riedel et al. (1998) is applied here (in which a 30 % deviation is
permitted), then three mill samples (Beaupré, Edmunston, and Fraser) were in good agreement with
their BOD5 values. The SPT2 sensor also demonstrated low coirelations with the Donnacona and
Grand Mère samples. This was probably related to the lack of easily assimilable compowids in
these samples. The relatively poor correlation between the SPT2 sensor and BOD, value for the
Thurso effluent was a surprise considering strain SPT2 was isolated h m - t h a t effluent.
As Pnncz and Olah (1990) concluded, BOD values obtained by these two different
methods could not be compared unless the sensor can be calibrated in a standard solution identical in
nature to the given sample. Considenng the complex and variable nature of pulp mill effluent
composition, this is not normally possible. As stated eariier, the inherent ciifferences between
sensor and BOD5 measurement dictates that results h m either method were not truly comparable
(Marty et al., 1997; Praet et al., 1995; Riedel, 1998; Tanaka et al., 1994). In view of this, one must
question the importance of good sensor to BOD5 correlations. What is likely to be far more
important is the consistency of the comlation ratios. It is of interest to investigate the response of
the sensor described here to different saniples from one specific miil.
3.6 Determination of Biosensor Operating Life
Tanaka et al. (1994) pointed out that it is important that biocatalysts selected for sensor
BOD measurements exhibit high stability. Variations in microbial responses to measurement stimuli
86

can cause rnisleading measurements of BOD values. For this reason, it is essential that sensor
response stability is measured over t h e in order to detennine its reproducibility. The stability of the
mediated microbial sensors and the reproducibility of the results were examineci over the lifetime of
the sensors (Figure 3.21). Sensors were stored in 100 mM PBS buffer, pH 6.0 and kept at arnbient
temperatures (22 OC). Storage conditions also included 20 ppm BOD of GGA between
measurements to reduce the possibility of ce11 death due to extended periods of starvation. A
minimum of three measurements were taken per day . The low readings obtained for both sensors
for the first few days can be attributed to the required preconditioning p e n d Maximum responses
were obtained by day 7 and 6 for the SPT1 and SPT;! sensors, respectively. Both sensors failed to
establish extended periods of stability. The S m 1 sensor displayed a steadily increasing mean
response until day 12, whereupon it began to gradually decrease until &y 22. The fluctuation in
response over this 10 day period was greater than 25 %. The Sm2 sensor failed to produce a
clearly definable response plateau throughout the 14 &y measurement penod. It is believed that the
poor reproducibility exhibiteci by the two sensors is a reflection of ce11 loss rather than a decreased
metabolism or ce11 death. A gradua1 reduction in the thickness of the yeast paste on the electrcxies
was observed over time. This ce11 leakage was attnbuted to micro tears in the dialysis membrane
retaining the yeasts. The lack of data points after day 22 and 14 for the SPTl and SPI2 sensors,
respectively, was due to complete ce11 loss due to large tears in the dialysis membrane. The tears
were attributed to detenofation over time. A similar problem was noted by Liu et al. (2000) when
using the same dialysis membrane. It was observed that sensor stability d e d over tirne due to
erosion of the cellulose dialysis membrane. This was attributed to enzymes secreted by the
biocatalyst, and microorganisms contaminating the surface of the diaiysis membrane.
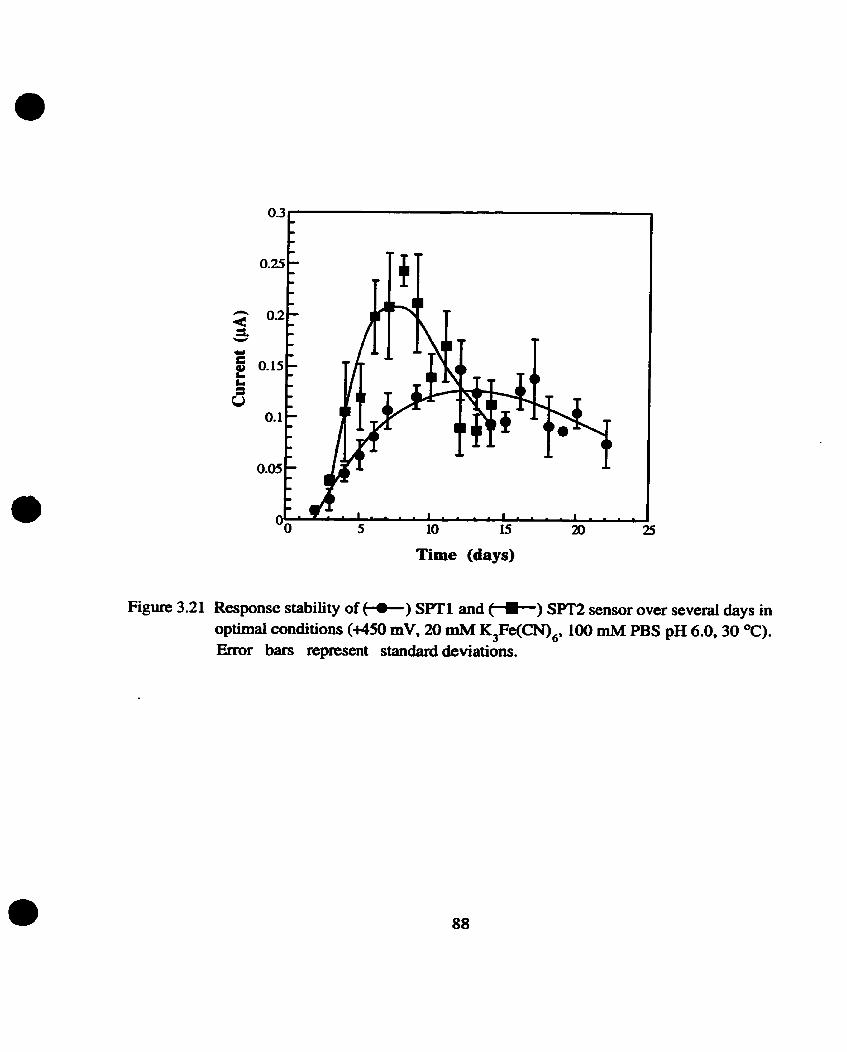
Time (days)
Figure 3.21 Response stability of +O-) SPT1 and t)-) SFT2 sensor over several days in optimal conditions (+GO mV, 20 mM K,Fe(CN),, 100 mM PBS pH 6.430 OC). Error bars represent standard deviations.
The results gathered in this study to determine the feasibility of using a mediator based
biosensor to effectively measure the BOD concentration of wastewater showed that it is possible to
obtain both sensitive measurements and practical linear response ranges using a mediated biosensor
rather than an oxygen based biosensor. BOD measurements of real samples could be determined in
5 to 10 min, compared with the conventional 5 days required for the standard BOD test. Using
potassium femcyanide as a mediator, two yeast strains (SPTI and S m , respectively) isolated
from pulp miIl effluent and retained on a glassy carbon electrode, exhibited low detection b i s of 2
pprn to 0.5 ppm BOD for the GGA standard solution, and 2 to 1 ppm for a pulp mil1 effluent
onginating from Thurso, Québec. The SPT1- and SPT2-based sensors also exhibited linear
response ranges of up to 200 ppm BOD for glucose-glutamic acid (GGA) using either
hydroxymethylfemcinium or potassium femcyanide as mediators. Highly reproducible (<IO %
error) rneasurements of pulp mili and paper mill samples were obtained, however, the sensor BOD
value and the BOD, value generaîly resulted in poor comlations, indicating that the two measuring
systems are not entirely comparable. Since the biosensors developed here measured substrate
metaboiism rather than the change in oxygen concentration, they are not mie BOD sensors - which
may have contributed to the poor comparison. Resently, stability over time continues to be the
main problem of these mediated BOD sensors. Basea on the results obtained in this study, it is
concluded that SPT2 is the most suitable biocatalyst for pulp mil1 wastewater analysis. This
conclusion is based on the broader linear response range and lower detection limit exhibited by the
SPT2 sensor, dong with the uncertainty attached to the excessively high sensor BOD 1 BOD5
correlation values for the SPTl sensor.
Characterizaiion via traditional (physiological and biochemical) and fatty acid methods,
as well as 18s rDNA sequence analysis, namowed the identity of Sm1 to a member of the C d &
genus. Sequence comparison, via BLAST searches, to the newly classified yeast C. sojae
89
indicaied that SPTl was most closely related to it (99.8 %). This observation was supported, via
bootstrap (1000 x ) analysis, by the formation of a highly significant (95.6 46) subcluster compriseci
of SPTl and C. sojae. However, a single basepair (bp) mismatch dong with important biochernical
differences (the ability of SPTl to ferment maltose and gmw at 40 OC) suggested that S m 1 is a
previously uncharacterized species of the Candida genus. Sequencing of the intemal transcribed
spacer region would better delineate SPT1 at the species level.
The three characterization techniques did not yield comparable results for SPTZ. BLAST
searching revealed that SPT2 was most closely matched to Candida kmsei, but with only 76 %
sequence homology. Furthermore, when the sequences of the closest matches from these
characterization schemes were used to create a dendrogram, SPï2 did not cluster with any of them.
These observations led to the conclusion that SPI2 is a previously uncharacterized species, perhaps
belonging to a novel genus. To conf- that SPT2 is a novel species, and to create a more accurate
phylogenetic tree, the complete 18s rDNA gene must be sequenced. Furthemore, to achieve
accurate taxonomie conclusions based on m e topologies, a reasonable number of differentialiy
related species must be compared.
Further investigations into the applicabiiity of mediated BOD sensors in place of oxygen
based sensors should fmt concentrate on improving the biocatalyst retention mechanism. For
example. a shudier dialysis membrane should be employed as this may allow for improved sensor
stability. The reproducibility of sensor response to effluent samples, from the same mill, with
varying BOD concentrations should be determined to establish the overall reproducibility of the
sensor to one effluent type. The universality of the sensor can then be determined by measuring
response reproducibility to different mil1 effluents.
Another obstacle that needs to be studied is the extended preconditioning tirne required
for mediated BOD sensors. It is possible that a different mediator-microorganism combination, or
preconditioning technique, could decrease preconditioning times. Improved sensitivity may be
achieved via better mediator-biocatalyst combinations. It must be stressed that finding a suitable
90

combination is quite dificuit given the large number of potential mediators an the even bigger pool
of rnicrwrganisrns. An improved understanding of the cellular enzymes responsible for mediator
reduction may facilitate mediator-microorganism selection. This would likely entai1 detailed
knowledge of the outer membrane structures of potential biocatalysts.
For circumstances that cd1 for low lirnits of detection, a platinum electrode may be
substituted for the glassy carbon electrode used here. The relatively high concentrations of
potassium femcyanide that were required suggest that increased sensitivity could be attained if a
more efficient mediator was used. Cornparisons should be made of the mediated biosensors
developed in this study with those containing proven biocatalysts (Le. T. cutorneum, A.
adeninivorm) to obtain more detailed information on their relative performances. In all cases, the
toxicity of the mediator to the biocatalyst should be monitored. Future sensor cornparisons should
involve wastewaters simiiar to those tested in other studies (i.e. from the food industry). There is
also a need to devise a mediated BOD sensing method that would allow for direct analysis of
wastewater emanating h m treatment facilities. The low de?ection limit of the biosensors àeveloped
here should in theory allow for the monitoring of the usually low BOD loads found in secondary
treatment effluents. These future studies should not ignore the potential benefits of using
cyclodextrin in combination with whole cells. A more detailed analysis to better understand its
feasibility is required.
Wastewater monitoring should ideally be done continuously to control accidents causing
high BOD wastewater discharges. Due to potential mediator and effluent toxicity, a flow injection
system, with measurements at regular intervals, would best suit the biosensors developed here.
Important adaptations for flow injection analysis would include the yeast retention mechanism as
weli as the mediator delivery mechanism.

Altschul, S.F., T.L. Madden, A.A. Scaffer, J. Zhang, 2. Zhang, W. Miller and D.J. Lipman. (1997). Gapped BLAST and PSI-BLAST: a new generation of protein database search programs. NUC. Acids. Res. 25% 89-3402.
Atkinson, A.L. and B.G.D. Haggen (1993). Whole ceil biosensors for environmental monitoring. Sensor Review 13: 19-22.
Barns, S.M., Lane, D.J.. ML. Sogin, C. Bibeau and W.G. Weisburg (1991). Evolutionary relationships among pathogenic C d & species and relatives. J. Bacteriol. 173:2250- 2255.
Bennetto, H.P., J.L. Stirling, K. Tanaka, C. (1983). Anodic reactions in microbial fuel cells. Biotech. Bioeng. 25559-568.
Brown, S.R.. J.H.-T.. Luong, O.H.J. Szolar. A. Halasz, J. Hawari (1996). Cyclodextrin- modifieci capiilary electmphoresis: determination of polycyclic aromatic hydracarbons in contaminated soils. Anal. Chem. 68:287-292.
Cass. A.E.G., G. Davis, GD. Francis, H.A.O. Hill (1984). Ferrocene-mediated enzyme electrode for amperometric determination of glucose. And. Chem. 56:667-671.
Cattaneo, M.V. and J.H.T. Luong (1994). A stable water-soluble tetra1nethylbenWdine-2- hydroxypropyl-Bcyclodextrin inclusion complex and its applications in enzyme assays. Anal. Biochem. 223:3 13-320.
Chan, C., M. Lehmann, K. Tag, M. Lung, G. Kunze, K. Riedel, B. Gmendig, R. Renneberg. (1999). Measurement of biodegradable substances using the salt-tolerant yeast A m l a adeninivorans for a micmbial sensor immobilized with poly(carbamoy1) sulfonate (PCS) part 1: construction and charactenzation of the microbial sensor. Biosensors & Bioelectronics 14: 13 1- 138.
Chee, G-J, Y. Nomura, 1. Kambe (1999). Biosensor for the ritirnation of low biochemical oxygen demand. Analytica Chimica Acta 379: 185-191.
Dence, C.W. and D. W. Reeve (Eds.). 1996. Pulp bleaching - pnnciples and practice. TAPPI PRESS. Atlanta. Ga. USA
d el sens te in, J. (1 999). PHYLIP (Phylogeny Inference Package) version 3.6. Disaibuted by the author. Department of Genetics, University of Washington, Seattle.
Fitzmaurice, G. D. and N.F. Gray. (1989). Evaluation of manufactured inocula for use in the BOD test. Wat. Res. 23: 655-657.
Ge, F., X.-E. Zhang. 2.-P. Zhang. X.-M. Zhang (1998). Potassium femcyanide mediated disposable biosensor for determination of maltose and glucose. Anal. Lett. 3 1 :383-394.

Greenberg, A.E., L.S. Clescen, A.E. Eaton. (Eds.) (1992). Part 5000: aggregate organic constituents. pp:S- 1 to 5-7. In: Standard methods for the examination of water and wastewater. 18th edition 1992. Arnerican Public Health Association. Washington D.C.
Gunasingham, H. and C.-H. Tan (1990). Carbon paste - tetrathiafulvalene amperomeic enzyme electrode for the determination of glucose in flowing systems. Analyst 115:35-39.
Head, LM., J.R. Saunders. R. W. Pickup (1998). Microbial evolution, diversity, and ecology : a decade of ribosomal RNA analysis of uncultivated microorganisms. Microb. Ecol. 35: 1-21.
Heim, S., 1. Schnieder, D. Binz, A. Vogel, U. Bilitewski (1999). Development of an automated rnicrobiai sensor system. Biosensors & Bioelectronics 14: 187-193.
Hiii, H. A.O. and G.S. Sanghera (1990). Mediated amperometric enzyme electrodes. In: Biosensors: a practical approach (Cass, A.E.G., Ed.) pp. 19-46. Oxford University Press.
Hobson, N. S., 1. Tothill, A.P.F. Turner (1996). Review article: microbial detection. Biosensors & Bioelectronics 1 1 :455-477.
Hoffman, C.S. (1997). Preparation of yeast DNA, RNA, and proteins. Zn Current protocols in molecular biology 1 3.1 1.1 - 13.1 1.4. V.B . Chanda (senes Ed.), John Wiley & Sons, Inc. U.S.A.
Uin, G.-S., K.-H. Park, U.-H. Pek, M.J. Sohn (1992). Microbial BOD sensor using Hmisenuiu anomala. Bull. Korean Chem. Soc., 13:145-148.
James, S.A., 1.N.Roberts and M.D. Collins (1998). Phylogenetic heterogeneity of the genus Williopsis as revealed by 18s rRNA gene sequences. Intern. J. S ys. Baceteriol. 48: 59 1-596.
KalAb, T. and P. SkMdal (1994). Evaluation of mediators for development of ampemmetric microbial bioelectrodes. Electroanal ysis 6: 1004- lOO8.
Karube, I., T. Matsunaga, S. Mitsuda, and S. Suzuki. (1977). Microbial electrode BOD sensor. Biotechnol. Bioeng., 19: 1535-1547.
Kanibe, I., K. Yokoyama, K. Sode, E. Tamiya (1989). Microbial BOD sensor utilizing thermophilic bacteria. Anal. Lett. 22:791-801.
Karube, 1. and K. Nakanishi (1994). Miçrobial biosensors for process and environmental control. IEEE Eng. Med. Biol. June/July:364-374.
Keck, A., J. Klein, M. Kudlich, A. Stolz, H.-J. Knackmuss, R. Mattes. (1997). Reduction of azo dyes by redox mediators ongination in the naphthalenesulfonic acid degradation pathway of Sphingomonas sp. strain BN6. Appl. Environ. Microbiol. 63:3684-3690.
Kim, M.-N. and H.-S. Kwon (1999). Biochemical oxygen demand sensor using S e m marcescens LSY 4. Biosensors & Bioelectronics 14: 1-7.

Kreger-van Rij, N.J.W. (1984). The Yeasts a taxonomie study third revised and enlarged edition. Elsevier Science hblishers
LeBlanc, P.J. (1974). Review of rapid BOD test methods. J. Water Pollut. Control Fed., 46:2202- 2208.
Lehmann, M., C. Chan, A. Lo, M. Lung, K. Tag, G. Kunze, K. Riedel, B. Gruendig, R. Renneberg (1999). Measurement of bidegradable substances using the salt-tolerant yeast A m l a adeninivorans for a microbial sensor immobilized with poy(carbamoy~)sulfonate (PCS). Part 11: application of the novel biosensor to real samples fiom coastal and island regions. Biosensors & Bioelectronics l4:295-302.
Li, Y-R and J. Chu (1991). Study of BOD microbial sensors for waste water treatment control. Vol. 28/29:855-863.
Li, F., T.C. Tan, and Y. K. Lee (1994). Effects of pre-conditionhg and microbial composition on the sensing efficacy of a BOD biosensor. Biosensors & Bioelectronics. 9: 197-205.
Li, F. and T.C. Tan (1994b). Effect of heavy metal ions on the efficacy of a mixed Bacilli BOD sensor. Biosensors & Bioelectronics 9:3 15-324.
Liu, J., L. Bjomsson, and B. Mattiasson (2000). Immobilised activated sludge based biosensor for biochemical oxygen demand measurement. Biosensors & Bioelectronics 14:883-893.
Llyod, J.A., C.H. Home, M.L. Reid (1997). Solids, resin and element rnass balances in a thennomechanical pulp miIl. APPITA-JOURNAL SO(3):2 1 7-222.
Luong, J.H.T., K.B. Male, S. Zhao (1993). Electrochemical preparation of 1-1'- dimethylfemcinium fiom a water-soluble 1 , 1 'dimethylferrocene-2-hydroxypropyl-i-cyclodextrin complex and its applications in enzyme assay. Anal. Biochem. 212:269-276.
Luong, J.H.-T., R.S. Brown, K.B. Maie, M.V. Cattaneo, S. Zhao (1995). Enzyme reactions in the presence of cyclodextrins: biosensors and enzyme assays. TIBTECH 13:457-464.
Luong, J.H.-T., K.B. Male, S. Zhao, R.S. Brown. (1995b). Redox dye and method of preparation thereof using 2-hydroxypropyl-B-cyclodextrin and l,l '-dimethylferrocene. United States Patent no. 5,432,274.
Male, K.B., P. O. Gartu, A. A. Kamen, J.H.T. Luong (1997). On-line monitoring of glucose in marnmalian ceIl culture using a flow injection analysis (FIA) mediated biosensor. Biotech. Bioeng., 55:497-504.
Mankin, AS., KG. Skryabin, and P.M. Rubstov (1986). Identification of ten additional nucleotides in the primary structure of yeast 1 8 s rRNA. Gene 44: 143-145.
Mannarelli, B.M. and C.P. Kurtzman (1998). Rapid identification of Candida albicam and other human pathogenic yeasts by using short oligonucleotides in a PCR. J. Clinical Microb. 36: 1634- 1641.

Marty, J. L., D. Olive, Y. Asano (1997). Measurement of BOD: correlation between 5-day BOD and commercial BOD biosensor values. Environ. Tech. 1 8:3 33-3 37.
Moody, G.J., and J.D.R. Thomas (1991). Ampefometric biosensors: a brief appraisal of principles and applications. Selective Electroàe Rev. 13: 1 13-124.
Nakase, T., M. Suzuki, M. Takashima, Y. Miyakawa, K. Kagaya, Y. Fukazawa and K. Komagata (1994). Candida sojae, a new species of yeast isolated fkom an extraction process of water- soluble substances of defatted soybean flakes. J. Gen. Appl. Microbiol. 40: 16 1-1 69.
h e t , E., V. Reuter, T. Gaillard, J.-L. Vasel (1995). Bioreactors and biomembranes for biochemical oxygen demand estimation. Trends Anal. Chem. 14:37 1 -378.
Princz, P. and J. Olah (1990). BOD measmement of non-toxic wastewasters with an improved microbial probe, In: Roceedings of the IAWPRC Workshop held in Yokohama and Kyoto, Japan, 26 July-3 August 1990, Pergamon Press.
Racek, J. (1995). Cell-based biosensors. Technomic Publ. Co. Inc. Lancaster, Pennsylvania.
Ramsay, G. and A.P.F. Turner (1 989). Development of an electrochemical method for the rapid determination of microbial concentration and evidence for the reaction mechanism. Analytica Chim. Acta. 215:61-69.
Rawson, D.M., A. J. Willmer, A.P .F. Turner. (1 989). Whole-ceIl biosensors for environmental monitoring. Biosensors 4:299-3 1 1.
Reiss M., A. Heibges, J. Metzger, W. Hartmeier (1 998). Detennination of BOD-values of starch- containing waste water by a BOD-biosensor. Biosensors & Bioeclectronics. 13: 1083-1090.
Riedel, K., K.-P. Lange, H.-J. Stein, M. Kiihn, P. Ott and F. Scheller. (1990). A microbial sensor for BOD. Wat. Res. 24: 883-887.
Riedel, K. (1991). Biochemical fiindamentals and irnprovement of the seiectivity of microbial sensors - a minireview. Bioelectrochem. Bioenerg. 25: 19-30.
Riedel, K., M. Lehmann, K. Tag, R. Renneberg, G. Kunze. (1998). A d a adeninivorans based sensor for the estimation of BOD. Anal. Lett. 3 1 : 1 - 12.
Riedel, K. (1998b). Application of biosensors to environmental samples. In: Commercial biosensors: applications to dinical bioprocess, and environmental sarnples. Graham Ramsay (Ed.). John Whiley & Sons, Inc.
Richardson, N. J., S. Gardner, D.M. Rawson (1 99 1). A chemically mediated amperometric biosensor for monitoring eubacterial respiration. J. App. Bacteriol. 70:422-426.
Ristolainen, M. and R. Alén (1 998). Characterization of effluents fiom TCF bleaching of hardwood kraft pulp. J. Pulp Paper Sci. 24: 129-1 33.

Roller, S.D., H.P. Bennetto, G.M. Delaney, J.R. Mason, J.L. Stirling, C.F. Thurston. (1984). Electron-transfer coupling in rnicrobial fuel cells: 1. cornparison of redox-mediator reduction rates and respiratory rates of bacteria. J. Chem. Tech. Biotechnol. 34B:3-12.
Saitou, N. and M. Nei (1987). The neighbor-joining method: a new method for reconstructing phylogenetic trees. Mol. B iol. Evol. 4: 406-425.
Sarnbrook, J., E.F. Fritsch, T. Maniatis (1989). Moîecular cloning: a laboratory manual. Cold Spnng Harbor Laboratory Press. USA.
Sangeetha, S., G. Sungandhi, M. Murugesan, V. Murali Madhav, S. Berchrnans, R. Rajasekar, S. Rajasekar. D. Jeyakumar, G. Prabhakara Rao. (1996). Tondopsis candida based sensor for the estimation of biochemical oxygen demand and its evaluation. Electroandysis. 8:698-70 1.
Schmidt, P.M., R.S. Brown, J.H.-T. Luong (1995). Inclusion complexation of tetrathiafulvalene in cyclodextrins and bioelectroanalysis of the glucose-glucose oxidase reaction. Chem. Eng. Sci. 50: 186% 1876.
Sogin, M.L., and J.H. Gunderson (1987). Structural divewity of eukaryotic small subunit ribosomal RNAs: evolutionary implications. Endocytobiology III. Ann. N.Y. Acad. Sci. 503: 125-139.
Sogin, M.L. (1990). Amplification of ribosomal RNA genes for molecular evolution studies. Z x PCR protocols: a guide to methods and applications. I.M.A. Innis, D.H. Glfand, J.J. Sninsb, T.J. White Eds. Academic Press, Inc. Toronto.
Stackebrandt, E. and R.A. Rainey (1995). Partial and complete 16s rDNA sequenees, their use in generation of 16s rDNA phylogenetic trees and their implications in molecular ecological studies. Zn: Molecular microbial ecology manual. Kluwer Academic Publishers, the Netherlands. 3.1.1: 1-17.
Strand, S. E. and D.A. Carlson (1984). Rapid BOD measurement for municipal wastewater samples using a biofilm electrode. J. Water Pollut. Cont. Fed 56:464-467.
Suntio, L.R., W.Y. Shiu, S. Mackay (1988). Areview of the nature andproperties of chemieals present in pulp mil1 effluents. Chemosphere 17:1249-1290.
Svitel, J., M. Stredansky, A. Pizzariello, S. Miertus (1998). Composite biosensor for sulfite assay: use of waster-insoluble hexacyanoferrate 0 salts as electron-transfer mediators. Electmanalysis lO:S9 1-596.
Szejtli, J. (1982). Cyclodextrins and their inclusion complexes. Alcedémiai Kiad6, Budapest.
Takayama, K., T.Ike&, T. Nagasawa (1996). Mediated amperometric biosensor for nicotinic acid based on whole cells of Pseu&monasfluorescens. Electroanalysis 8:7 65-768.
Tan, TC., F. Li, K.G. Neoh, Y .K. Lee (1 992). Microbial membrane-modifieci dissolved oxygen probe for rapid biochemical oxygen demand measurement. Sensors and Actuators 8: 167-172.

Tan, T. C., F. Li, K. G. Neoh (1993) Measurement of BOD by initial rate of response of a microbiai sensor. Sensors and Actuators B. 10:137-142.
Tanaka, H., E. Nakamura, Y. Minamiyama, and T. Toyoda (1994). BOD biosensor for secondary effluent from wastewater treatment plants. Wat. Sci. Tech. 3O:2 15-227.
Thompson, J.D.,T.J. Gibson, F. Plewniak, F. Jeanmougin, D.G. Higgins (1997). The Clustal X windows interface: flexible strategies for multiple sequence alignment aided by quality analysis tools. Nucleic Acids Research 24:4876-4882.
Valente P., J.P. Ramos, O. Leoncini (1999). Sequencing as a tool i n yeast molecular taxonomy. Can. J. Microbiol. 45949-958.
van der Peer, Y. and R. de Wachter (1995). Investigation of fungal phylogeny on the basis of small ribosomal subunit RNA sequences. In: MolecuIar rnicrobial ecology manual. Kluwer Academic Publishers, the Netherlands. 3.3.4: 1- 12.
van der Walt, J.P., and D.Yarrow (1984). Methods for the isolation, maintenance, classification and identification of yeasts. In The Yeasts a taxonomie study third revised and enlarged edition. Kreger-van Rij, N. J.W. (Ed.). Elsevier Science Publishers
Voytas, D. (1997). Resolution and recovery of large DNA fragments. In: Current protocols in molecular biology 2.5.1-2.5.9. John Wiley & Sons, Inc.
White, T. J., T. Burns, S. Lee, J. Taylor. (1990). Amplification and direct sequencing of fungal ribosomal RNA genes for phylogenetics. In: FCR protocols: a guide to methods and applications. hnis, M.A., D.H.Gelfand, J. S. Sninsky. T.J. White. Acedernic Press, Inc.
Wickerham, L.J. (1951). Taxonomy of yeasts. Techn. Bull. 1029, U.S. Dept. Agr., Washington, D.C.
Woese, C.R. (1987). Bacterial evolution. Microbiol. Rev. 51:221-271.
Yang, Z., H. Suzuki, S. Sasaki, 1. Karube. (1996). Disposable sensor for biochemical oxygen &mand. Appl. Microbiol. Biotechnol. 46: 10-14.
Zhao. S. and J.H.T. Luong (1993). Bioelectrocatalysis of a water-soluble tetrathiafulvalene-2- hydrox ypropy 1-B-c yclodextrin cornplex. Anal. Chem. Acta. 282: 3 19-327.