Embed Size (px)
Citation preview

Peter HofmannChief Engineer-Distribution EngineeringConsolidated Edison, New York
PQView User Group MeetingNew York, NYAugust 31 – September 02, 2010
Update on PQView’s Roleat Con Edison in New York City
2© 2010 Electrotek Concepts, Inc. All rights reserved.
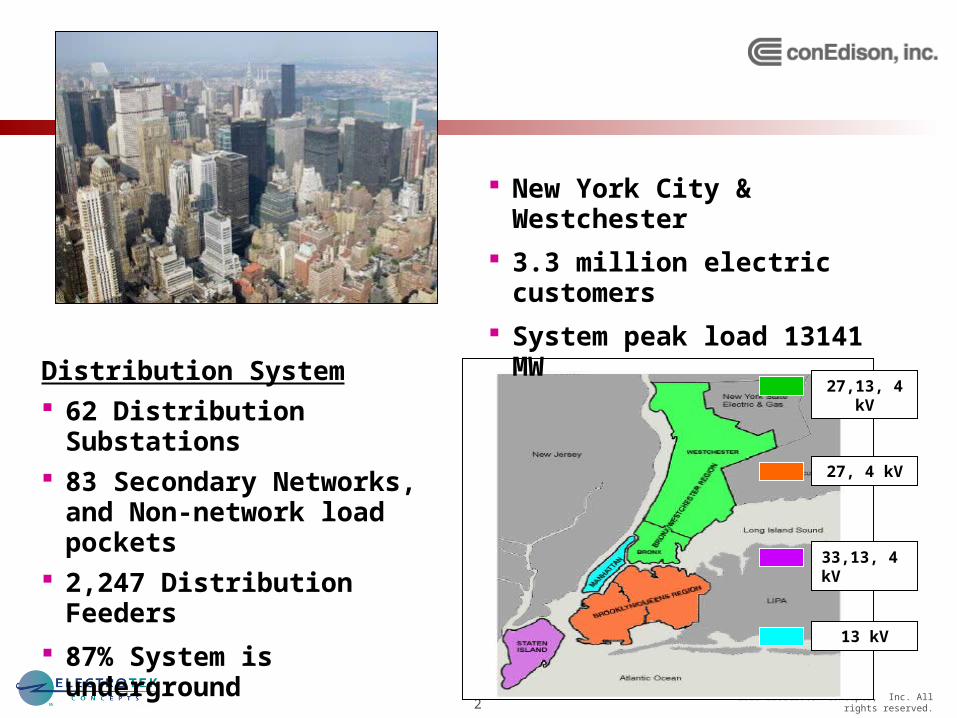
27,13, 4 kV
13 kV
27, 4 kV
33,13, 4 kV
Distribution System 62 Distribution Substations 83 Secondary Networks, and
Non-network load pockets 2,247 Distribution Feeders
87% System is underground
New York City & Westchester
3.3 million electric customers
System peak load 13141 MW

3© 2010 Electrotek Concepts, Inc. All rights reserved.
Overview of Con EdisonPower Delivery System

4© 2010 Electrotek Concepts, Inc. All rights reserved.
PQ Monitoring for Smart Distributionat Con Edison
•Area Substations Transformers– Power quality monitors
•Secondary Networks– Power quality monitors– Network Transformer RMS
Network Distribution Feeders– Microprocessor relays
•Area Substations Capacitors– Microprocessor relays
•Unit Substation Transformers– Power Quality Monitoring and
Phasor Measurement Sensors
•High Tension Remote Monitoring– Power and power quality
monitoring•Customer Smart Meters
– Energy and power quality•Distribution and Transmission
SCADA– Automatic momentary
interruption analysis and correction with IEDs

5© 2010 Electrotek Concepts, Inc. All rights reserved.
Con Edison Monitoring System
Area Substation Transformers•Supply the Con Edison distribution network feeders. •Each substation has at least one power quality monitor at the
output of one transformer.•Many area substations have more than one transformer
monitored to allow for redundancy in the automatic fault location system and other analysis tools.

6© 2010 Electrotek Concepts, Inc. All rights reserved.
Con Edison Monitoring System
Network Distribution Feeders•The network feeders supply underground network customers in
which each feeder supplies transformers that in turn supply a low voltage distributed secondary network.
•The network feeders are protected using overcurrent relays. Today, about 800 microprocessor relays on feeder and bus breakers are monitored.– feeder energizing– breaker trip events due
to faults – short-duration overcurrent
events due to incipientfaults.

7© 2010 Electrotek Concepts, Inc. All rights reserved.
Con Edison Monitoring System
Area Substation Capacitors• Con Edison has developed an automatic capacitor health analysis system
– Automatic correlation with SCADA operations– Abnormal switching transients (e.g., restrike or magnification)– Unbalanced reactive power changes
• Con Edison intends to increasethe number of distributioncapacitors monitoredwith power quality monitorsand with microprocessor relaysover the next three years.

8© 2010 Electrotek Concepts, Inc. All rights reserved.
Con Edison Monitoring System
Unit Substation Transformers•The unit substation transformers supply Con Edison’s overhead
distribution feeders system. •There are few power quality monitoring at unit substations
today, but monitoring is expanding over the next year.

9© 2010 Electrotek Concepts, Inc. All rights reserved.
Con Edison Monitoring System
High Tension Remote Monitoring•Con Edison has several hundred customers that are supplied via
primary feeders via a “high tension service.”•Over the next three years, many of these sites will be equipped
with remote monitoring capabilities and electronic meters to capture power and power quality measurements.

10© 2010 Electrotek Concepts, Inc. All rights reserved.
Con Edison Monitoring System
Customer Smart Meters•As part of a US$200 million project funded by federal stimulus
grants, Con Edison is establishing an infrastructure to collect measurements from a smart grid pilot project in Queens.
•Installation of 1500 smart meters that aim to permit customers to monitor and potentially improve their energy use.
•These meters will recordpower quality measurementsthat need to be integratedwith other sensor data beingcollected from area, network,and unit substations.

11© 2010 Electrotek Concepts, Inc. All rights reserved.
Con Edison Monitoring System
SCADA RTU Sensors•PQView Event Correlation•Automatic Momentary Interruption Analysis (MAIFI)•Voltage Schedule•Tap Setting Analysis

12© 2010 Electrotek Concepts, Inc. All rights reserved.
Con Edison Monitoring System
Distribution Capacitors•Also as part of the federal stimulus grant project, Con Edison will
be initiating the installation of SCADA ready switchable capacitors on the 4kV distribution system that will be integrated with PQ monitors and microprocessor relays at unit substations
13© 2010 Electrotek Concepts, Inc. All rights reserved.
Con Edison Monitoring System
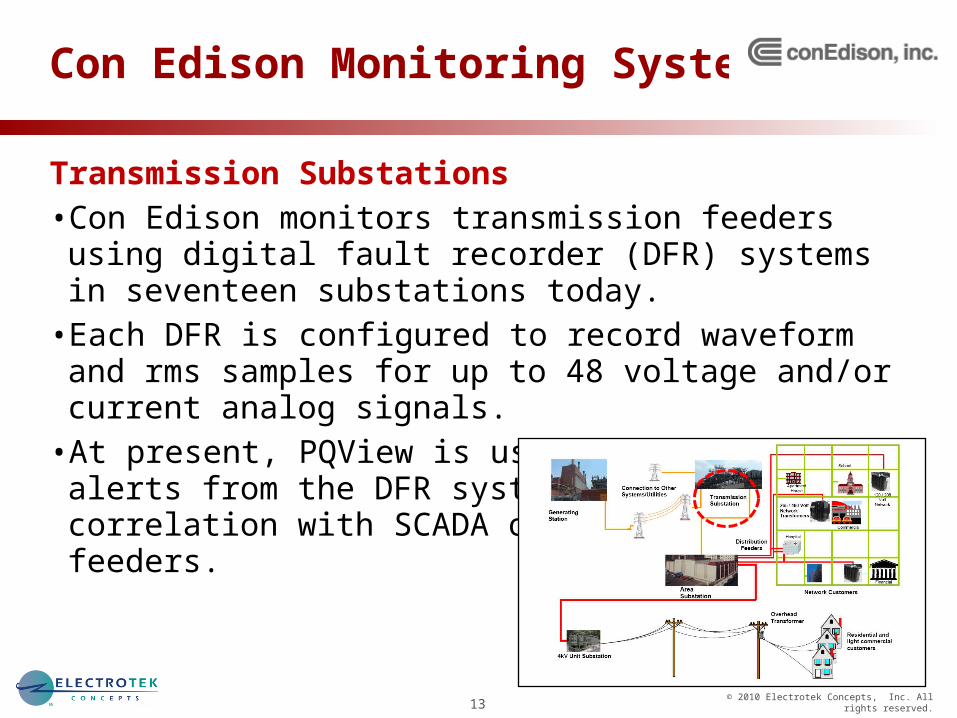
Transmission Substations•Con Edison monitors transmission feeders using digital fault
recorder (DFR) systems in seventeen substations today.•Each DFR is configured to record waveform and rms samples for
up to 48 voltage and/or current analog signals.•At present, PQView is used to send e-mail alerts from the DFR
systems and provides correlation with SCADA on transmission feeders.

14© 2010 Electrotek Concepts, Inc. All rights reserved.
Overview of Data Integrationwith PQView at Con Edison Today
PQView
PQViewDatabase
Download Server for PQ Monitors and Phase Angle
Sensors
Download Server for Relays
SCADAServers
Web Service, IEEE PQDIF, and Proprietary Files
IEEE COMTRADE Files
Download Server for DFRs IEEE COMTRADE Files
SCADA Historian API
Proprietary Files from Portable PQ Monitors

15© 2010 Electrotek Concepts, Inc. All rights reserved.
PQView Projects at Con Edison
Automatic Bus Fault Analysis• Reactance estimates and fault duration calculated from waveforms captured
by power quality monitors and microprocessor relays at area substations. • PQView also integrates relay digital status values that indicate which
disturbance detection algorithms were triggered by an event in addition to which channel(s) triggered the operation of a circuit breaker.
• The e-mail notification and web reports produced by PQView assist operators in determining the source and location of the fault that caused the area substation bus to trip out; thus ensuring more rapid restoration of the area substation bus section when the root cause is a feeder fault and overcurrent trip of the bus.

16© 2010 Electrotek Concepts, Inc. All rights reserved.
PQView Projects at Con Edison
Historical Fault Analysis•Integration with Poly Voltage Load Flow
– Distribution circuit model– Estimate of voltage at fault location based on substation
measurements •Integration with CAJAC
– database of laboratory describing the failure of each cable and joint
– automate root cause association•Follow-On Fault Analysis Module
– Cascading feeder failures

17© 2010 Electrotek Concepts, Inc. All rights reserved.
PQView Projects at Con Edison
Steady State Regulation•Voltage Schedule•Transformer Tap Settings Balance in Phases and Transformers
13.3
13.4
13.5
13.6
13.7
13.8
80
100
120
140
160
3AM1 Tue Sep 2009
6AM 9AM 12PM 3PM 6PM 9PM 2 Wed
421LODV,421LODW
Electrotek Concepts® PiSlicer
KV
MW
Time
421LODV 421LODW

18© 2010 Electrotek Concepts, Inc. All rights reserved.
PQView Projects at Con Edison
Arcing and Partial Discharge Detection•Con Edison plans to employ PQView with smart meter sensors
to mitigate the dangers associated with arcing events in underground vaults of the secondary network.
•Con Edison also plans to integrate devices in PQView that provide partial discharge measurements.– Partial discharge is localized dielectric breakdown of cable
that is detectable before a cable failure that results in a fault.
– Detection of which cable sections are demonstrating measurable partial discharge is a goal to proactively replace cables before they fail and increase the risk to a network’s reliability

19© 2010 Electrotek Concepts, Inc. All rights reserved.
Example Single-Phase Fault
IA
Voltage Drop
VA
I0 = 8kA
Total CurrentI0 = 4x2 kA = 8kA
I0 = 2kA
I0 = 2kA
I0 = 2kA
I0 = 2kA

20© 2010 Electrotek Concepts, Inc. All rights reserved.
Feeder Tripsdue to Fault
VisualFault
Locator
PQ Meter Captures
Waveforms
PQViewCalculates Reactance
-20
0
20
-5
0
5
0.00 0.05 0.10 0.15
Single-Phase Fault Evolves into Two-Phase
EPRI/Electrotek PQView®
Vo
ltag
e (
kV)
Cu
rre
nt
(kA
)
Time (s)
Va Vb Vc Ia Ib Ic
Match ReactanceTo Feeder Model
Dispatch Crews
1B 2AB2.195 2.216
10.0
12.5
15.0
17.5
1
2
3
2.5
5.0
7.5
10.0
0.05 0.10 0.15
Single-Phase Fault Evolves into Two-Phase
Vo
ltag
e (
kV)
Cu
rre
nt (
kA)
Re
act
an
ce (
oh
ms)
Time (s)
Va Vb Vc Ia Ib Ic XTF
Fault Locating Process

21© 2010 Electrotek Concepts, Inc. All rights reserved.
Relay RTF Website

22© 2010 Electrotek Concepts, Inc. All rights reserved.
Email Fault Notification

23© 2010 Electrotek Concepts, Inc. All rights reserved.
Feeder Fault with GE Relay Targets
PHASE IOC1 OP C On PHASE IOC1 OP C Off
-15000
-10000
-5000
0
5000
10000
15000
-20000
-10000
0
10000
20000
0.50 0.55 0.60 0.65 0.70
Murray Hill 12M77 - 9/10/2008 08:07:15.6374
EPRI/Electrotek PQView®
Digital ChannelOsc Trig OnPHASE IOC1 OP CPHASE TOC1 PKP CGROUND TOC1 PKPTrip On
Vo
lta
ge
(V
)C
urr
en
t (A
)
Time (s)
Va Vb Vc Ia Ib Ic Ires
24© 2010 Electrotek Concepts, Inc. All rights reserved.
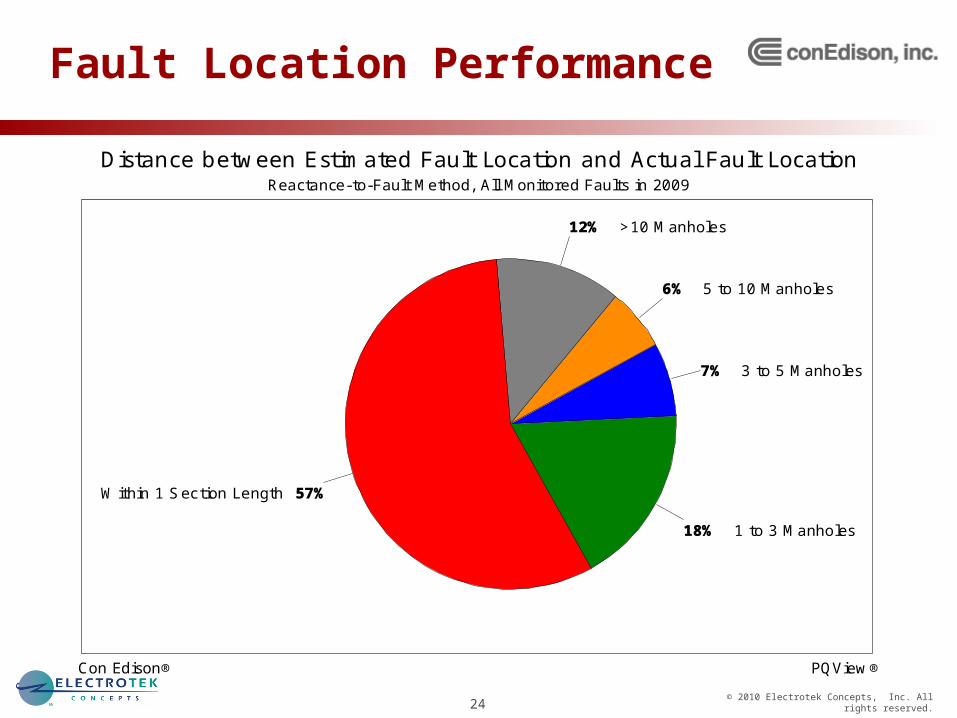
Fault Location Performance
57% Within 1 Section Length
18% 1 to 3 Manholes
7% 3 to 5 Manholes
6% 5 to 10 Manholes
12% >10 Manholes
Distance between Estimated Fault Location and Actual Fault LocationReactance-to-Fault Method, All Monitored Faults in 2009
Con Edison® PQView®

25© 2010 Electrotek Concepts, Inc. All rights reserved.
Transformer Magnetizing Inrush
•Con Edison uses the term “Cut-In Open-Auto” or CIOA to describe a feeder that trips immediately upon reenergization.
•A CIOA could be caused by the same or a new fault or by inrush current.
•If there is no fault, the feeder can be reenergized quickly, reducing stress and risk to a network.
•In 2007, Con Edison asked EPRI to enhance the functionality in PQView to detect inrush current and differentiate it from fault current.

26© 2010 Electrotek Concepts, Inc. All rights reserved.
Rea
l F
ault
Inru
sh E
ven
t
-10000
-5000
0
5000
10000
-2000
0
2000
4000
0.00 0.02 0.04 0.06 0.08 0.10 0.12 0.14 0.16 0.18
E36THST - 12/16/2006 22:42:25.0650
EPRI/Electrotek PQView®
Vo
lta
ge
(V
)C
urre
nt
(A
)
Time (s)
Va Vb Vc Ia Ib Ic In Ires
Fault Current versus Inrush Current
27© 2010 Electrotek Concepts, Inc. All rights reserved.
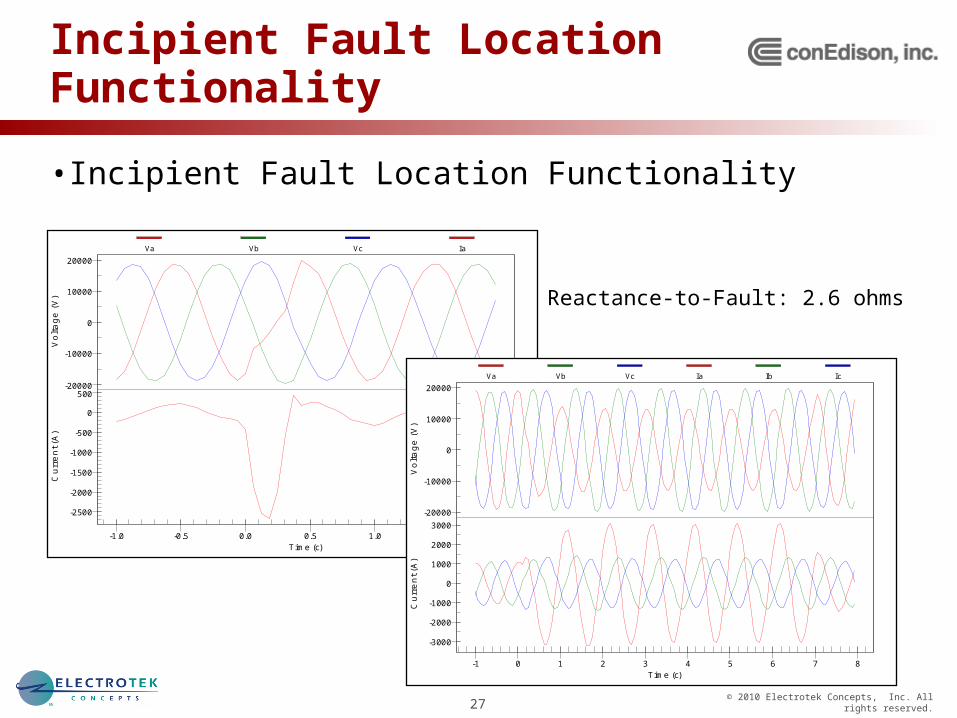
Incipient Fault Location Functionality
•Incipient Fault Location Functionality
-20000
-10000
0
10000
20000
-2500
-2000
-1500
-1000
-500
0
500
-1.0 -0.5 0.0 0.5 1.0 1.5 2.0
Vo
ltag
e (
V)
Cu
rre
nt (
A)
Time (c)
Va Vb Vc Ia
-20000
-10000
0
10000
20000
-3000
-2000
-1000
0
1000
2000
3000
-1 0 1 2 3 4 5 6 7 8
Vo
ltag
e (
V)
Cu
rre
nt (
A)
Time (c)
Va Vb Vc Ia Ib Ic
Reactance-to-Fault: 2.6 ohms

28© 2010 Electrotek Concepts, Inc. All rights reserved.
Digital Fault Recorders
•Minimum and maximum rms values of voltage and current, along with overcurrent duration in cycles, are available for all channels in an email notification
•The email notification is set to trigger if current on any channel exceeds 1500 A
•Correlation with breaker tags in OSIsoft® PI System® Historian is completed not via digital status changes but rather via changes in analog values

29© 2010 Electrotek Concepts, Inc. All rights reserved.
W72 Line Trip - Email Notification
Station / Timestamp
All ChannelsMin/Max RMS Values

30© 2010 Electrotek Concepts, Inc. All rights reserved.
W72 Line Trip - Email Notification
W72 Trip Out

31© 2010 Electrotek Concepts, Inc. All rights reserved.
W72 Line Trip – Max RMS Values

32© 2010 Electrotek Concepts, Inc. All rights reserved.
PI History at Con Edison
•SOCCS/SOCCS-X SCADA System – Designed by Boeing Company had a very limited data
archiving capabilities. The disk space on its system can only store data for eight days.
•PI was integrated with the SCADA system at Con Edison in 1997. •PI offered a solution for providing real-time RTU values and long-
term storage of both analog and digital status values

33© 2010 Electrotek Concepts, Inc. All rights reserved.33 Empowering Business in Real Time. © Copyright 2009, OSIsoft Inc. All rights Reserved.
60s 1h
5s 5s
Energy Management System

PI Data Integration
PI Tag
Bkr Trip


37© 2010 Electrotek Concepts, Inc. All rights reserved.
Linking PQView and PI Together
PI Server PQView PQ Data Manager
PiSlicerLibraryPI SDK
Con EdisonElectric OperationsPI System
PQViewDatabase
PiSlicer

38© 2010 Electrotek Concepts, Inc. All rights reserved.
Example Correlation
Single-Phase Distribution Fault Event
-20000
-10000
0
10000
20000
-2000
0
2000
0 2 4 6 8 10
BENSH1 - 3/12/2009 08:25:55.5630
Electrotek/EPRI Event ID = 510113 PQView®
OperationPoint Name BNBX21W.DXTime Stamp3/12/2009 08:25:56.0126Value B_HURST1 BKR 21W (10B66)Description CLOSE-TRIP
Vo
ltag
e (
V)
Cu
rre
nt
(A)
Time (c)
Va Vb Vc Ia Ib Ic

39© 2010 Electrotek Concepts, Inc. All rights reserved.
Example Correlation
Distribution Substation Capacitor Switching Event
-20000
-10000
0
10000
20000
-1000
0
1000
2000
0 2 4 6 8 10
GREENWD - 2/13/2009 06:09:39.0000
Electrotek/EPRI Event ID = 431196 PQView®
OperationPoint Name GRBXC2.DXTime Stamp2/13/2009 06:09:41.0040Value G_WOOD27 BKR C2 (CAP_2)Description TRIP-CLOSE
Vo
ltag
e (
V)
Cu
rre
nt
(A)
Time (c)
Va Vb Vc Ia Ib Ic

40© 2010 Electrotek Concepts, Inc. All rights reserved.
Example Correlation
Distribution Feeder Inrush
-20000
-10000
0
10000
20000
-2000
-1000
0
1000
2000
0 2 4 6 8 10
PLYMST - 12/12/2008 02:03:39.2500
Electrotek/EPRI Event ID = 376712 PQView®
OperationPoint Name PYBX31N.DXTime Stamp12/12/2008 02:03:39.0000Value PLYMOUTH BKR 31N (1B61)Description TRIP-CLOSE
Vo
ltag
e (
V)
Cu
rre
nt
(A)
Time (c)
Va Vb Vc Ia Ib Ic

41© 2010 Electrotek Concepts, Inc. All rights reserved.
Example Correlation
Multiple Breaker Trips due to Substation Fault
-15000
-10000
-5000
0
5000
10000
15000
-10000
-5000
0
5000
10000
0 2 4 6 8 10
PKCHEST1 - 3/2/2009 02:18:28.1250
Electrotek/EPRI Event ID = 460896 PQView®
OperationsPoint Name PKBX32E.DXTime Stamp3/2/2009 02:18:31.0241Value PARK_CH1 BKR 32E 7X78Description CLOSE-TRIP
Point Name PKBX33E.DXTime Stamp3/2/2009 02:18:31.0241Value PARK_CH1 BKR 33E 7X81Description CLOSE-TRIP
Point Name PKBX3BT.DXTime Stamp3/2/2009 02:18:31.0241Value PARK_CH1 BKR 3BTDescription CLOSE-TRIP
Point Name PKBX3TR.DXTime Stamp3/2/2009 02:18:31.0242Value PARK_CH1 BKR 3TR 38X03Description CLOSE-TRIP
Point Name PKBX7TR.DXTime Stamp3/2/2009 02:18:31.0242Value PARK_CH1 BKR 7TR 7X24Description CLOSE-TRIP
Vo
ltag
e (
V)
Cu
rre
nt
(A)
Time (c)
Va Vb Vc Ia Ib Ic

42© 2010 Electrotek Concepts, Inc. All rights reserved.
Follow-On Fault Analysis Module

43© 2010 Electrotek Concepts, Inc. All rights reserved.
I²T Calculation and Notification
-4
-3
-2
-1
0
1
2
3
4
0.00 0.02 0.04 0.06 0.08 0.10 0.12 0.14 0.16 0.18
Cu
rre
nt
(kA
)
Time (s)
Ia Ib Ic
0.0
0.1
0.2
0.3
0.4
0.5
0.6
0.7
0.8
0.9
1.0
1.1
0.00 0.02 0.04 0.06 0.08 0.10 0.12 0.14 0.16 0.18
Cu
rre
nt
(kA
²·t)
Time (s)
Ia Ib Ic

44© 2010 Electrotek Concepts, Inc. All rights reserved.
Automatic DistributionCapacitor Analysis
•Capacitor Switching Transient Identification•Capacitor Bank Direction Indication•Capacitor Bank Health Analysis•Abnormal Capacitor Bank Switching Operation

45© 2010 Electrotek Concepts, Inc. All rights reserved.
Electrotek/Dranetz Capacitor SwitchingAnswer Module®
•Development begun in 1998 as an optional component of the Electrotek/Dranetz-BMI Signature System.
•Provides answers to these questions:– Do the voltage and current waveforms captured by the
power systems monitor appear to be a capacitor switching transient? • Does the capacitor event appear to be normal? • Does the capacitor event appear to be magnified? • Was the reactive power change on all three phases
balanced? • What was the reactive power change on each phase?

46© 2010 Electrotek Concepts, Inc. All rights reserved.
Capacitor Switching Answer ModulePorted to PQView Module

47© 2010 Electrotek Concepts, Inc. All rights reserved.
Example of Answer Module Output
-20000
-10000
0
10000
20000
-2000
-1000
0
1000
2000
0.00 0.05 0.10 0.15
GREENWD - 2/26/2009 10:39:51.5630
Electrotek/EPRI PQView®
Event ID 33GPS Synch NoEvent Base Voltage 15242Event Fund Frequency 60Reference Cycle Number 31650System Event ID Valid YesM.E. RMS Variation NoM.E. Interruption NoMonitor Availability NoLoad Interruption NoB1 NoB2 NoB3 NoCapacitor Directivity Direction DownlineCapacitor Directivity Confidence HighCapacitor General GeneralCapacitor Magnification No MagnificationCapacitor Normal NormalCapacitor Q Balance BalancedCapacitor Q Delta A -2224263Capacitor Q Delta B -2205492Capacitor Q Delta C -2239395Capacitor Q Delta Total -6669149
Vo
ltag
e (
V)
Cu
rre
nt (
A)
Time (s)
Va Vb Vc Ia Ib Ic Ires

48© 2010 Electrotek Concepts, Inc. All rights reserved.
Example of Answer Module Output
-2.216-2.160
-2.235
2.5
3.0
3.5
4.0
4.5
5.0
5.5
0.00 0.02 0.04 0.06 0.08 0.10 0.12 0.14 0.16 0.18
GREENWD - 2/26/2009 10:39:51.5630Reactive Power
?Qa=-2.216 Mvar ?Qb=-2.160 Mvar ?Qc=-2.235 Mvar
Electrotek/EPRI PQView®
Re
act
ive
Po
we
r (M
var)
Time (s)
Qa Qb Qc

49© 2010 Electrotek Concepts, Inc. All rights reserved.
Capacitor Identification: Next Steps
•Link SCADA Correlation Module and Automatic Capacitor Analysis Together
•Abnormal Capacitor Bank Switching Operation– Restrike, and Magnification
•Synchronous Closing Performance•Harmonic Resonance Identification and Trending