Embed Size (px)
Citation preview
1
New Zealand solid fuels market analysis
Peter Hall & Samantha Alcaraz, 2017
2
Report information sheet Report title
NEW ZEALAND SOLID FUELS MARKET ANALYSIS
Authors
Peter Hall, Scion & Samantha Alcaraz, GNS Science
Client
MBIE
MBIE contract number
Wood Energy Industrial Symbiosis
SIDNEY output number
58815
ISBN Number Signed off by
Paul Bennett
Date
March 2017
Confidentiality requirement
Confidential (for client use only)
Intellectual property
© New Zealand Forest Research Institute Limited. All rights reserved. Unless permitted by contract or law, no part of this work may be reproduced, stored or copied in any form or by any means without the express permission of the New Zealand Forest Research Institute Limited (trading as Scion).
Disclaimer The information and opinions provided in the Report have been prepared for the Client and its specified purposes. Accordingly, any person other than the Client uses the information and opinions in this report entirely at its own risk. The Report has been provided in good faith and on the basis that reasonable endeavours have been made to be accurate and not misleading and to exercise reasonable care, skill and judgment in providing such information and opinions. Neither Scion, nor any of its employees, officers, contractors, agents or other persons acting on its behalf or under its control accepts any responsibility or liability in respect of any information or opinions provided in this Report.
Published by: Scion, 49 Sala Street, Private Bag 3020, Rotorua 3046, New Zealand. www.scionresearch.com
3
TABLE OF CONTENTS
Executive Summary ...................................................................................................................................... 4
Introduction ................................................................................................................................................... 6
Methods ...................................................................................................................................................... 12
Results ........................................................................................................................................................ 13
Regional Coal demand ........................................................................................................................... 13
Regional natural gas demand ................................................................................................................. 13
Regional wood fuel supply ...................................................................................................................... 14
Wood supply versus Coal demand ......................................................................................................... 21
Wood supply versus Gas demand .......................................................................................................... 24
Market Value ........................................................................................................................................... 24
Discussion .................................................................................................................................................. 25
Conclusions ................................................................................................................................................ 27
References ................................................................................................................................................. 28
Acknowledgements .................................................................................................................................... 29
Appendix 1 - Coal use by region and Industry; GJ p.a. .............................................................................. 30
Appendix 2 - Gas consumption by industry and region; GJ p.a. ................................................................ 31

4
Executive Summary
This report is intended to provide information on the potential size of the market for solid biomass fuels. Coal, natural gas and LPG use for industrial heat by region and industry are identified. This heat market is the potential market for solid biomass fuels in New Zealand. New Zealand’s coal and gas resources are described by location and volume. Coal supply is plentiful and widespread with only the East Coast, Hawkes Bay and Wairarapa having limited access to coal. These regions are serviced by the gas pipeline network. A potential long term supply constraint for natural gas is identified. Wood residue resources that could be used as substitute heat for; especially for replacing coal and potentially for gas are described by type volume and location and the potential for wood fuel substitution by region is presented. The total amounts of industrial heat generated from coal and natural gas in 2012 were estimated at 24.69 PJ per annum and 48.5 PJ per annum respectively. LPG use for heat was around 6.1 to 6.2PJ. Natural gas use is restricted to the North Island with LPG use being widespread across the country. The largest source of wood residues is in-forest harvest residues. The total amount of recoverable wood waste (in-forest harvest residues, municipal wood waste and horticulture and viticulture residues) is between 15 and 24 PJ per annum, with significant variation over time. The variation is largely driven by changes in forest harvesting residue availability, which is a product of the age class distribution of the plantation forest estate. Whilst there appears to be significant potential for substitution of wood for coal (15PJ per annum) at a national level, at a regional level there are mismatches in wood residue supply and coal for heat fuel demand that mean the maximum level of substation is somewhat less; around 10 to 11PJ per annum. These figures account for the variation in wood supply over time from the variation on supply from forests harvest residues, which is the largest source of residues, and fluctuates due to the uneven age class distribution of the forests. The GHG abatement potential using wood as a fuel in place of coal, taking into account the regional supply and demand mismatch limits is in the order of 960,000 t CO2e per annum. This in the order of 1.5 to 2% of total national GHG emissions. There are some regions where there is both an excess of wood fuel potential when compared to coal demand, as well as gas supply via pipeline. Wood available
after coal demand is met Gas demand
Northland 0.76 PJ 2.4 PJ Bay of Plenty 1.62 PJ 3.9 PJ Gisborne 0.65 PJ 0.5 PJ Hawkes Bay 0.62 PJ 1.3 PJ
5
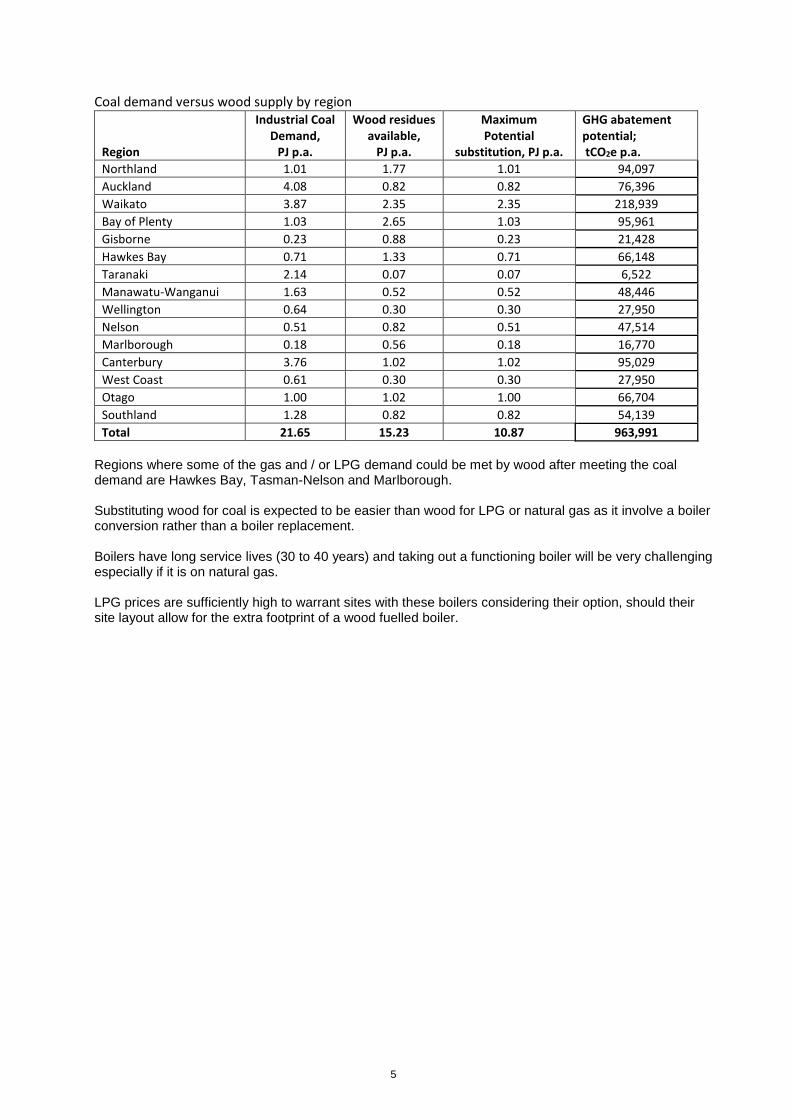
Coal demand versus wood supply by region Region
Industrial Coal Demand,
PJ p.a.
Wood residues available,
PJ p.a.
Maximum Potential
substitution, PJ p.a.
GHG abatement potential; tCO2e p.a.
Northland 1.01 1.77 1.01 94,097
Auckland 4.08 0.82 0.82 76,396
Waikato 3.87 2.35 2.35 218,939
Bay of Plenty 1.03 2.65 1.03 95,961
Gisborne 0.23 0.88 0.23 21,428
Hawkes Bay 0.71 1.33 0.71 66,148
Taranaki 2.14 0.07 0.07 6,522
Manawatu-Wanganui 1.63 0.52 0.52 48,446
Wellington 0.64 0.30 0.30 27,950
Nelson 0.51 0.82 0.51 47,514
Marlborough 0.18 0.56 0.18 16,770
Canterbury 3.76 1.02 1.02 95,029
West Coast 0.61 0.30 0.30 27,950
Otago 1.00 1.02 1.00 66,704
Southland 1.28 0.82 0.82 54,139
Total 21.65 15.23 10.87 963,991
Regions where some of the gas and / or LPG demand could be met by wood after meeting the coal demand are Hawkes Bay, Tasman-Nelson and Marlborough. Substituting wood for coal is expected to be easier than wood for LPG or natural gas as it involve a boiler conversion rather than a boiler replacement. Boilers have long service lives (30 to 40 years) and taking out a functioning boiler will be very challenging especially if it is on natural gas. LPG prices are sufficiently high to warrant sites with these boilers considering their option, should their site layout allow for the extra footprint of a wood fuelled boiler.
6
Introduction
New Zealand currently meets the bulk of its industrial heat demand (150 PJ p.a.) from fossil fuels (104 PJ p.a.); coal (26PJ p. a.) and gas (78PJ p. a.) (MBIE, 2016). These fuels are widely use across New Zealand and a range of primary processing industries. Wood residues, including black liquor, are widely used in the wood processing industry and provide around 46PJ p. a. Around 17 PJ of this comes from black liquor. An additional 8 PJ of wood fuel is estimated to be used as domestic heating There is potential to reduce the greenhouse gas emissions of New Zealand as a whole if currently unused wood residues are substituted for these fossil fuels. In order to determine the potential for this, we need to assess the use of a range of fossil heat fuels at a regional level, along with the potential supply of wood residues. Coal New Zealand has a substantial coal resource (Figure 1, Table 1), and this resource is used as a fuel to provide heat for a range of industries and commercial enterprises as well as by government agencies and local body facilities. This coal use for heat is also a potential market for other forms of heat (solar, geothermal, gas and electricity). However, there are issues with some of these forms of energy, as heat, that limit their extensive use in industry;
- Solar; intermittency and usually only suitable for low temperature hot water - Geothermal; geographically limited (Central North Island (Taupo, Rotorua, Kawerau) &
Northland, Ngawha)) o – geothermal springs occur at other sites (Hanmer, Maruia etc.), but these have no
potential for industrial exploitation. - Electricity; high costs and inefficiency of converting electricity to heat at industrial scale
(especially if the electricity was generated from gas or coal) - Gas; constrained future supply (Figure 2) and limits on delivery infrastructure (e.g. no South
Island pipeline) New Zealand’s coal resources are summarised by field, presenting the total available in-ground resource and estimated recoverable resource still in place (Figure 1, Table 1). Coal fields are quite widely spread throughout New Zealand, with concentrations in Waikato, West Coast, Otago and Southland regions. Regions with no coal fields are Bay of Plenty, East Coast, Hawkes Bay, Wairarapa, Wellington and Marlborough. Coal use in the Eastern and Southern North Island is low. Coal comes in a variety of forms, with 3 key types; bituminous, sub-bituminous and lignite. It is usually sold as nuts, peas and chips; 25 to 35mm, 7 to 25mm and 4 to 10mm respectively. If the coal user requires finer (pulverised) coal, the grinding is done on the users site, just prior to use as there are risks of spontaneous combustion and explosions with very fine coal dust. One of the options to replace coal is wood. It is geographically widely available, comes in solid form, can be produced in a variety of particle sizes and can be heat treated (torrefied) to become more akin to coal in its properties. Torrefaction of wood has a cost but it increases the energy density and improves grindability of the wood (Hall, Estcourt and Kimberly, 2011) making it viable in pulverised fuel systems. Wood residues that are already in fine particles (sawdust, sander dust) can be reconstituted into pellets and briquettes to fit the fuel particle size demanded by the existing heat plant infrastructure.
7
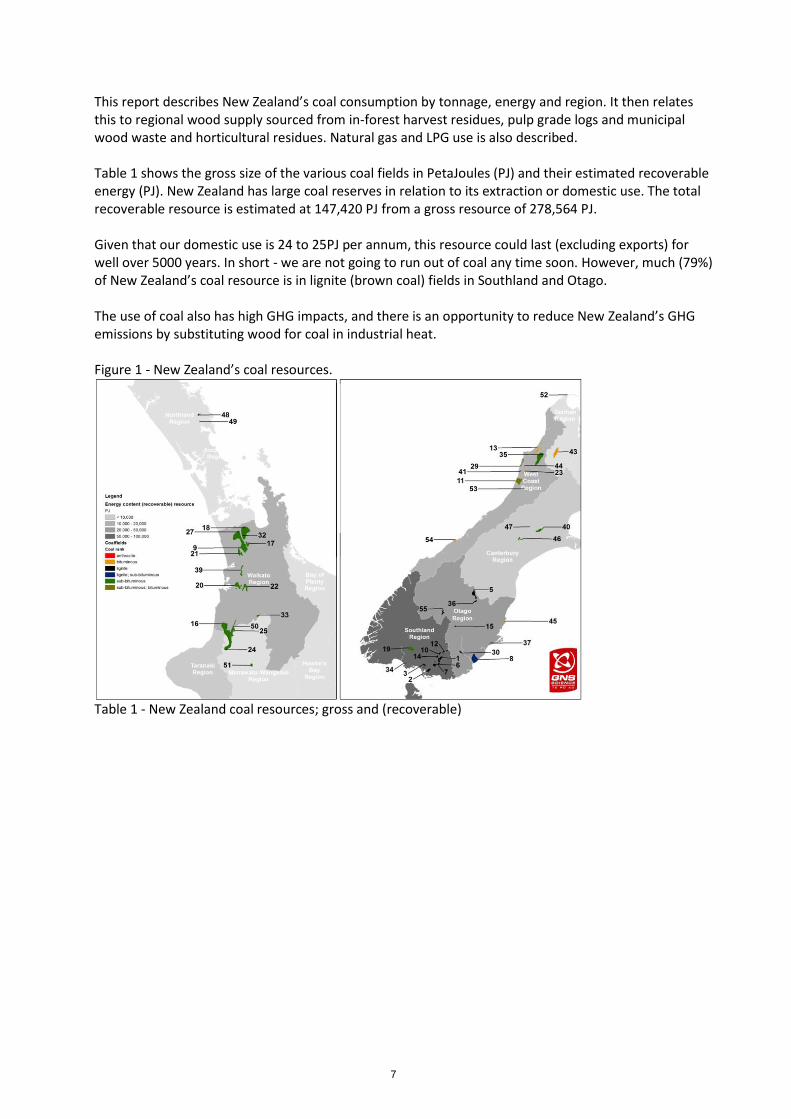
This report describes New Zealand’s coal consumption by tonnage, energy and region. It then relates this to regional wood supply sourced from in-forest harvest residues, pulp grade logs and municipal wood waste and horticultural residues. Natural gas and LPG use is also described. Table 1 shows the gross size of the various coal fields in PetaJoules (PJ) and their estimated recoverable energy (PJ). New Zealand has large coal reserves in relation to its extraction or domestic use. The total recoverable resource is estimated at 147,420 PJ from a gross resource of 278,564 PJ. Given that our domestic use is 24 to 25PJ per annum, this resource could last (excluding exports) for well over 5000 years. In short - we are not going to run out of coal any time soon. However, much (79%) of New Zealand’s coal resource is in lignite (brown coal) fields in Southland and Otago. The use of coal also has high GHG impacts, and there is an opportunity to reduce New Zealand’s GHG emissions by substituting wood for coal in industrial heat. Figure 1 - New Zealand’s coal resources.
Table 1 - New Zealand coal resources; gross and (recoverable)
8
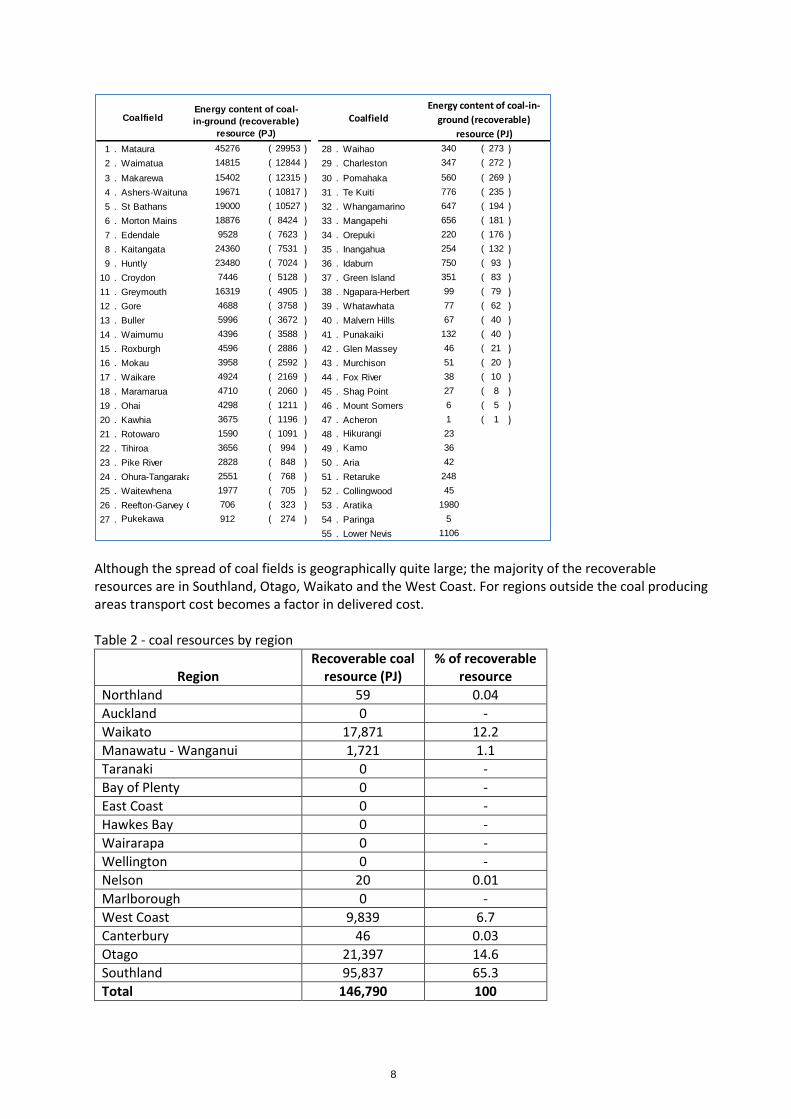
Although the spread of coal fields is geographically quite large; the majority of the recoverable resources are in Southland, Otago, Waikato and the West Coast. For regions outside the coal producing areas transport cost becomes a factor in delivered cost. Table 2 - coal resources by region
Region
Recoverable coal resource (PJ)
% of recoverable resource
Northland 59 0.04
Auckland 0 -
Waikato 17,871 12.2
Manawatu - Wanganui 1,721 1.1
Taranaki 0 -
Bay of Plenty 0 -
East Coast 0 -
Hawkes Bay 0 -
Wairarapa 0 -
Wellington 0 -
Nelson 20 0.01
Marlborough 0 -
West Coast 9,839 6.7
Canterbury 46 0.03
Otago 21,397 14.6
Southland 95,837 65.3
Total 146,790 100
1 . Mataura 45276 ( 29953 ) 28 . Waihao 340 ( 273 )
2 . Waimatua 14815 ( 12844 ) 29 . Charleston 347 ( 272 )
3 . Makarewa 15402 ( 12315 ) 30 . Pomahaka 560 ( 269 )
4 . Ashers-Waituna 19671 ( 10817 ) 31 . Te Kuiti 776 ( 235 )
5 . St Bathans 19000 ( 10527 ) 32 . Whangamarino 647 ( 194 )
6 . Morton Mains 18876 ( 8424 ) 33 . Mangapehi 656 ( 181 )
7 . Edendale 9528 ( 7623 ) 34 . Orepuki 220 ( 176 )
8 . Kaitangata 24360 ( 7531 ) 35 . Inangahua 254 ( 132 )
9 . Huntly 23480 ( 7024 ) 36 . Idaburn 750 ( 93 )
10 . Croydon 7446 ( 5128 ) 37 . Green Island 351 ( 83 )
11 . Greymouth 16319 ( 4905 ) 38 . Ngapara-Herbert 99 ( 79 )
12 . Gore 4688 ( 3758 ) 39 . Whatawhata 77 ( 62 )
13 . Buller 5996 ( 3672 ) 40 . Malvern Hills 67 ( 40 )
14 . Waimumu 4396 ( 3588 ) 41 . Punakaiki 132 ( 40 )
15 . Roxburgh 4596 ( 2886 ) 42 . Glen Massey 46 ( 21 )
16 . Mokau 3958 ( 2592 ) 43 . Murchison 51 ( 20 )
17 . Waikare 4924 ( 2169 ) 44 . Fox River 38 ( 10 )
18 . Maramarua 4710 ( 2060 ) 45 . Shag Point 27 ( 8 )
19 . Ohai 4298 ( 1211 ) 46 . Mount Somers 6 ( 5 )
20 . Kawhia 3675 ( 1196 ) 47 . Acheron 1 ( 1 )
21 . Rotowaro 1590 ( 1091 ) 48 . Hikurangi 23
22 . Tihiroa 3656 ( 994 ) 49 . Kamo 36
23 . Pike River 2828 ( 848 ) 50 . Aria 42
24 . Ohura-Tangarakau 2551 ( 768 ) 51 . Retaruke 248
25 . Waitewhena 1977 ( 705 ) 52 . Collingwood 45
26 . Reefton-Garvey Creek 706 ( 323 ) 53 . Aratika 1980
27 . Pukekawa 912 ( 274 ) 54 . Paringa 5
55 . Lower Nevis 1106
CoalfieldEnergy content of coal-in-
ground (recoverable)
resource (PJ)
CoalfieldEnergy content of coal-
in-ground (recoverable)
resource (PJ)

9
If we look at supply and demand by island (Table 3), there is a long term supply of coal that will last for the foreseeable future. Therefore, biomass has to have some advantage to drive its uptake; price or GHG mitigation or some combination of the two. Table 3 - years supply by island
Island
Industrial Coal Demand, PJ p.a.
Recoverable coal resource (PJ)
Years of supply
North 15.34 19,651 1,281
South 7.34 127,139 17,321
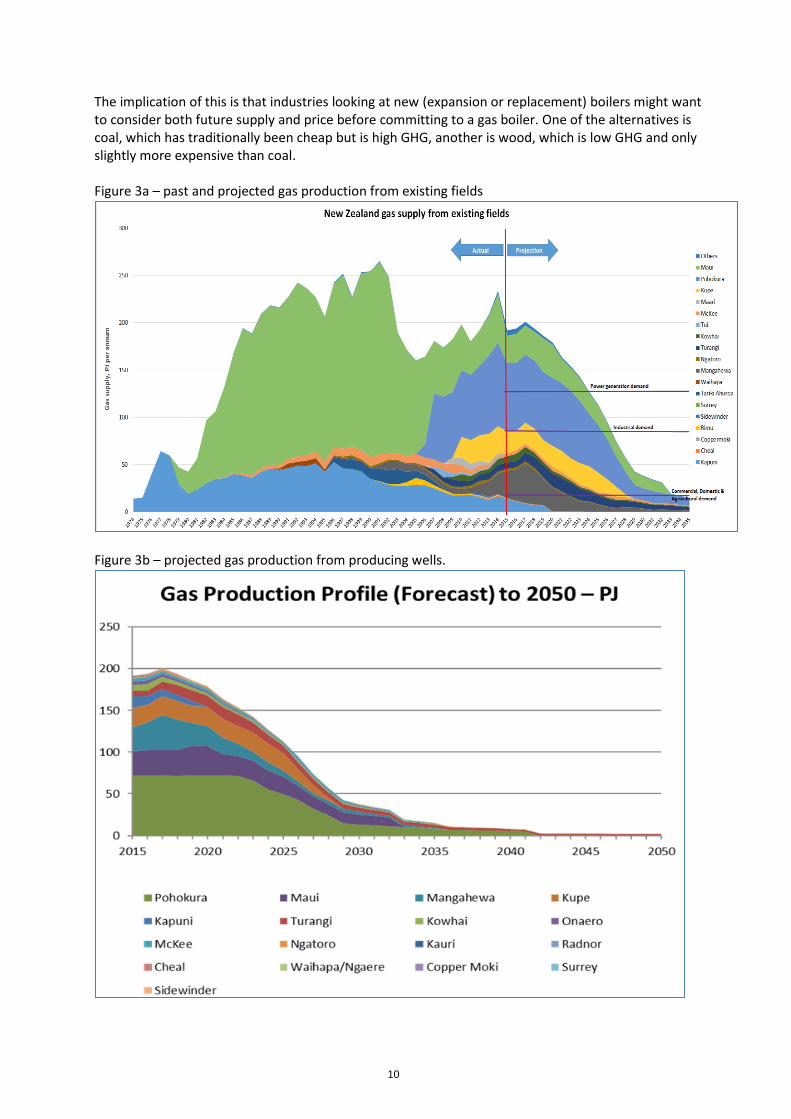
Gas New Zealand’s producing gas fields are all in the Taranaki region or off shore from Taranaki (Figure 2). Figure 2 - New Zealand’s producing gas fields
The supply of gas from current producing fields is in decline (Figures 3a and 3b). The demand for gas is predicted to exceed supply from existing fields by 2027, unless new fields are discovered and developed. Drilling has been at low levels since 2015 due to low oil prices. Gas prices are expected to rise from 2020 onwards as a consequence of tightening supply (Steve Bielby, National Radio 16th March 2017). Gas supply at current levels of consumption is sufficient for around 10 years (Gas Industry Company, 2016).
10
The implication of this is that industries looking at new (expansion or replacement) boilers might want to consider both future supply and price before committing to a gas boiler. One of the alternatives is coal, which has traditionally been cheap but is high GHG, another is wood, which is low GHG and only slightly more expensive than coal. Figure 3a – past and projected gas production from existing fields
Figure 3b – projected gas production from producing wells.

11
Gas is available by pipeline to a range of sites throughout the North Island (Figure 4). There is no gas pipeline in the South Island. The gas pipeline network goes to some areas that have no local coal supply (Gisborne, Napier, Pahiatua, and Wellington). It also provides gas to industry in Waikato region which does have a coal resource. There is no natural gas pipeline in Wairarapa, central Hawkes Bay or the Far North. Figure 4 - New Zealand gas pipeline network
Greenhouse gas emissions One of the issues with coal is that it is a high GHG emitter (Table 4) in an era when New Zealand is looking to reduce its GHG emissions. Table 4 - GHG emissions comparison (MBIE, 2016)
kg/CO2e/kg MJ/tonne kg/CO2e/GJ
Coal; bituminous 2.65 30.4 87.2
Coal; sub-bituminous 2.00 21.5 93.0
Lignite 1.43 13.0 110.0
Natural gas - - 57.7
LPG 2.97 - 59.4
Wood 0.0143 7.0 2.1
This report outlines regions with industrial process heat demand from coal and gas; and the wood supply that is available to potentially displace this. Estimates of GHG reductions from displacing of coal by wood are made at a regional and national level.

12
Whilst geothermal heat is part of the industrial heat demand it is not seen as a part of the potential solid fuels market and so is not included in this report.
Methods
The EECA heat plant database (EECA, 2011) was accessed as an Excel spreadsheet. This data was reviewed and updated with a focus on wood processing (Scion), dairy processing and direct use (University of Waikato) and geothermal heat (GNS Science). The data in this sheet was then summarised to produce coal consumption estimates. This information can be summarised at an industry level. However, the main focus here is on regional demand. Coal consumption by industry and region is shown in Appendix 1. Gas demand by region and industry was derived from the EECA energy end-use database (EEUDb, accessed online March 2017). This data is for gas use in 2012 (Appendix 2). LPG demand was also from the 2012 EEUDb. Wood supply information was derived from a variety of sources. Forest harvest residue and pulp log volumes were derived from Ministry of Primary Industries data, such as the National exotic forest description (MPI 2016) and the regional wood availability forecasts (MPI 2014 & 2015). In forest harvest residues occur at three locations;
- At the stump on steep terrain harvested by cable logging systems, these residues are not included in the total of recoverable material as they are regarded as being environmentally risky and very expensive (>$50 per tonne) to recover to roadside.
- At the stump on flat to rolling terrain harvested by wheeled and tracked (ground-based) harvesting systems; comprised a mix of broken stem wood and branches; 70% of this material is deemed to be recoverable.
- At logging landings in all harvesting systems where stems are cut into logs and short sections of defective stem wood are cut out and discarded; 80% of this material is deemed to be recoverable
The residues associated with centralised stem to log processing yards such as the Kaingaroa Processing Plant and the Kawerau Log Yard are not included as they are already gathered, processed and utilised; mostly as either boiler fuel or for landscaping for the bark. Municipal wood waste data was derived from a survey of landfills in 2016 (Ireland-Blake, 2017). The forward projections of municipal wood waste data was based on population growth trends (Statistics NZ). Municipal wood waste comes in two categories; construction / demolition waste and green waste. The two sources have different moisture contents and therefore different energy values per tonne, these were incorporated in the estimated energy content calculations. Construction and demolition waste is estimated to be 25% moisture content (14.6 GJ/tonne) and green waste is estimated at 56% moisture content (6.9 GJ tonne). The mix of construction and demolition waste and green waste is approximately 50:50.
13
Results
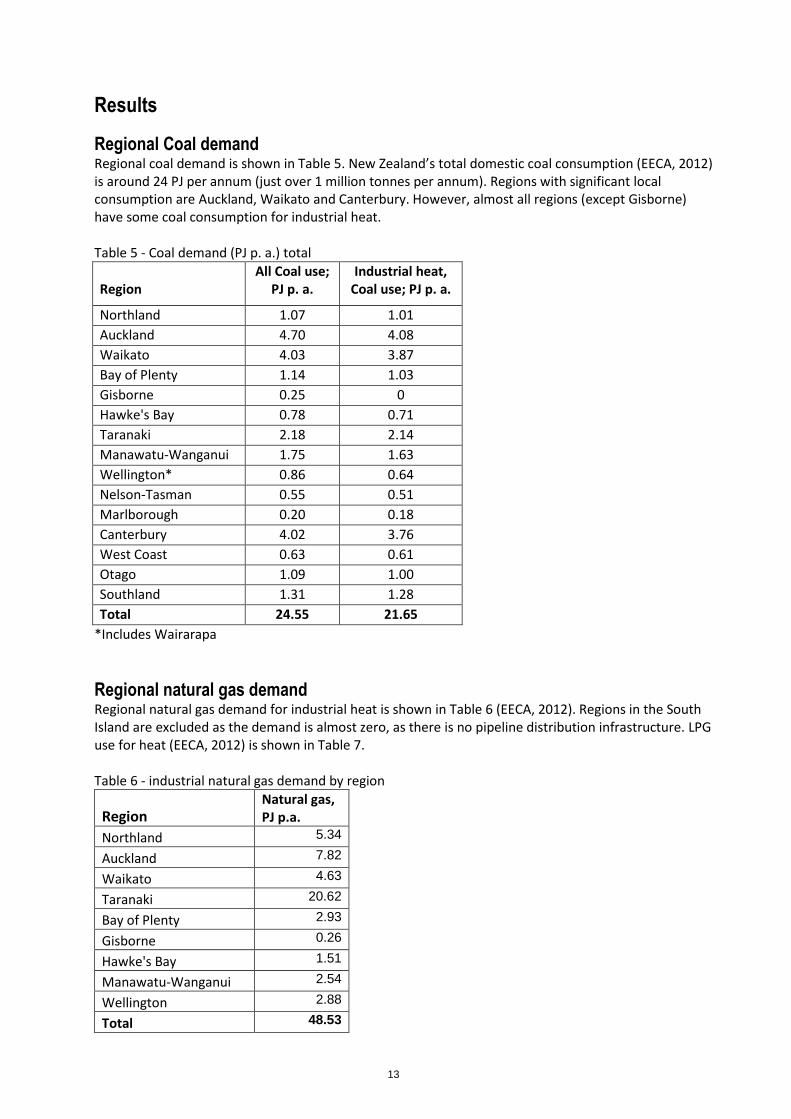
Regional Coal demand Regional coal demand is shown in Table 5. New Zealand’s total domestic coal consumption (EECA, 2012) is around 24 PJ per annum (just over 1 million tonnes per annum). Regions with significant local consumption are Auckland, Waikato and Canterbury. However, almost all regions (except Gisborne) have some coal consumption for industrial heat. Table 5 - Coal demand (PJ p. a.) total
Region
All Coal use; PJ p. a.
Industrial heat, Coal use; PJ p. a.
Northland 1.07 1.01
Auckland 4.70 4.08
Waikato 4.03 3.87
Bay of Plenty 1.14 1.03
Gisborne 0.25 0
Hawke's Bay 0.78 0.71
Taranaki 2.18 2.14
Manawatu-Wanganui 1.75 1.63
Wellington* 0.86 0.64
Nelson-Tasman 0.55 0.51
Marlborough 0.20 0.18
Canterbury 4.02 3.76
West Coast 0.63 0.61
Otago 1.09 1.00
Southland 1.31 1.28
Total 24.55 21.65
*Includes Wairarapa
Regional natural gas demand Regional natural gas demand for industrial heat is shown in Table 6 (EECA, 2012). Regions in the South Island are excluded as the demand is almost zero, as there is no pipeline distribution infrastructure. LPG use for heat (EECA, 2012) is shown in Table 7. Table 6 - industrial natural gas demand by region
Region Natural gas, PJ p.a.
Northland 5.34
Auckland 7.82
Waikato 4.63
Taranaki 20.62
Bay of Plenty 2.93
Gisborne 0.26
Hawke's Bay 1.51
Manawatu-Wanganui 2.54
Wellington 2.88
Total 48.53
14
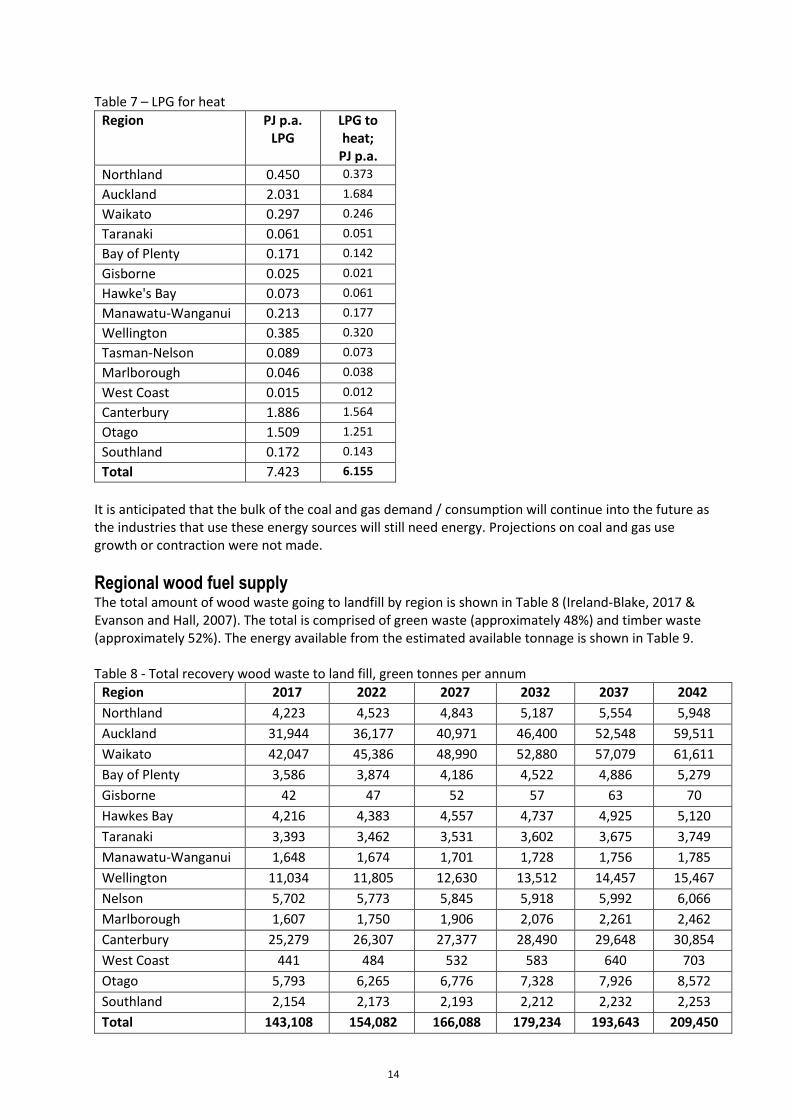
Table 7 – LPG for heat
Region PJ p.a. LPG
LPG to heat;
PJ p.a.
Northland 0.450 0.373
Auckland 2.031 1.684
Waikato 0.297 0.246
Taranaki 0.061 0.051
Bay of Plenty 0.171 0.142
Gisborne 0.025 0.021
Hawke's Bay 0.073 0.061
Manawatu-Wanganui 0.213 0.177
Wellington 0.385 0.320
Tasman-Nelson 0.089 0.073
Marlborough 0.046 0.038
West Coast 0.015 0.012
Canterbury 1.886 1.564
Otago 1.509 1.251
Southland 0.172 0.143
Total 7.423 6.155
It is anticipated that the bulk of the coal and gas demand / consumption will continue into the future as the industries that use these energy sources will still need energy. Projections on coal and gas use growth or contraction were not made.
Regional wood fuel supply The total amount of wood waste going to landfill by region is shown in Table 8 (Ireland-Blake, 2017 & Evanson and Hall, 2007). The total is comprised of green waste (approximately 48%) and timber waste (approximately 52%). The energy available from the estimated available tonnage is shown in Table 9. Table 8 - Total recovery wood waste to land fill, green tonnes per annum
Region 2017 2022 2027 2032 2037 2042
Northland 4,223 4,523 4,843 5,187 5,554 5,948
Auckland 31,944 36,177 40,971 46,400 52,548 59,511
Waikato 42,047 45,386 48,990 52,880 57,079 61,611
Bay of Plenty 3,586 3,874 4,186 4,522 4,886 5,279
Gisborne 42 47 52 57 63 70
Hawkes Bay 4,216 4,383 4,557 4,737 4,925 5,120
Taranaki 3,393 3,462 3,531 3,602 3,675 3,749
Manawatu-Wanganui 1,648 1,674 1,701 1,728 1,756 1,785
Wellington 11,034 11,805 12,630 13,512 14,457 15,467
Nelson 5,702 5,773 5,845 5,918 5,992 6,066
Marlborough 1,607 1,750 1,906 2,076 2,261 2,462
Canterbury 25,279 26,307 27,377 28,490 29,648 30,854
West Coast 441 484 532 583 640 703
Otago 5,793 6,265 6,776 7,328 7,926 8,572
Southland 2,154 2,173 2,193 2,212 2,232 2,253
Total 143,108 154,082 166,088 179,234 193,643 209,450

15
Table 9 - energy from municipal wood waste by region
Region 2017 2022 2027 2032 2037 2042
Northland 43,634 46,728 50,041 53,589 57,389 61,458
Auckland 330,045 373,780 423,309 479,402 542,928 614,871
Waikato 434,432 468,927 506,162 546,353 589,736 636,563
Bay of Plenty 37,046 40,027 43,247 46,726 50,486 54,547
Gisborne 434 481 532 589 652 723
Hawkes Bay 43,560 45,285 47,079 48,944 50,883 52,899
Taranaki 35,059 35,764 36,485 37,219 37,969 38,733
Manawatu-Wanganui 17,023 17,297 17,576 17,859 18,146 18,438
Wellington 114,003 121,969 130,492 139,610 149,365 159,802
Nelson 58,909 59,644 60,389 61,143 61,906 62,679
Marlborough 16,606 18,084 19,694 21,447 23,357 25,437
Canterbury 261,185 271,805 282,857 294,359 306,328 318,784
West Coast 4,558 5,003 5,492 6,028 6,616 7,262
Otago 59,851 64,731 70,008 75,716 81,889 88,566
Southland 22,251 22,452 22,654 22,859 23,065 23,273
Total 1,478,596 1,591,978 1,716,017 1,851,844 2,000,715 2,164,034
The tonnages and energy contents of wood fuel potential from in-forest residues are shown in Tables 10 and 11. Projections of future availability are based on forest area and age class data (MPI, 2016) which allows predictions of wood availability out to 2047 with some confidence. Table 10 - In-forest residues; green tonnes per annum
2015 - 2019
2020 - 2024
2025 - 2029
2030 - 2034
2035 - 2039
2040 - 2044
Northland 322,205 289,694 233,105 180,943 240,281 308,824
Auckland 63,834 96,584 93,185 66,083 37,133 29,253
Waikato 325,333 501,753 447,200 282,827 251,281 278,849
Bay of Plenty 326,848 433,760 417,033 354,072 361,411 378,933
Gisborne 224,931 255,301 179,083 97,666 117,975 166,791
Hawkes Bay 198,643 284,793 227,691 161,577 126,579 130,592
Taranaki 32,751 38,826 20,008 8,219 4,900 6,431
Manawatu-Wanganui 196,710 250,409 164,128 80,129 72,119 83,072
Wellington 56,912 62,517 43,373 25,765 21,643 25,648
Tasman / Nelson 106,135 127,788 108,888 105,158 88,081 73,538
Marlborough 66,183 72,531 46,617 34,880 47,205 62,008
Canterbury 232,429 285,144 231,942 133,987 99,851 102,113
West Coast 48,783 48,855 53,335 50,899 43,257 34,638
Otago 154,782 202,847 169,769 127,130 119,903 119,416
Southland 133,377 213,244 207,872 142,862 115,599 113,838
Total 2,489,856 3,164,046 2,643,230 1,852,197 1,747,218 1,913,944

16
Table 11 - In-forest residues, GJ per annum
2015 - 2019
2020 - 2024
2025 - 2029
2030 - 2034
2035 - 2039
2040 - 2044
Northland 2,236,102 2,010,480 1,617,748 1,255,742 1,667,548 2,143,237
Auckland 443,005 670,290 646,706 458,617 257,705 203,013
Waikato 2,257,812 3,482,164 3,103,566 1,962,821 1,743,890 1,935,212
Bay of Plenty 2,268,322 3,010,296 2,894,211 2,457,260 2,508,194 2,629,796
Gisborne 1,561,023 1,771,790 1,242,838 677,802 818,746 1,157,528
Hawkes Bay 1,378,584 1,976,465 1,580,176 1,121,347 878,459 906,310
Taranaki 227,295 269,455 138,853 57,043 34,007 44,632
Manawatu-Wanganui 1,365,166 1,737,836 1,139,047 556,097 500,506 576,523
Wellington 394,967 433,865 301,011 178,810 150,205 177,997
Tasman / Nelson 736,577 886,851 755,682 729,796 611,282 510,350
Marlborough 459,311 503,362 323,522 242,067 327,600 430,338
Canterbury 1,613,055 1,978,898 1,609,679 929,867 692,965 708,662
West Coast 338,555 339,054 370,142 353,240 300,202 240,387
Otago 1,074,188 1,407,758 1,178,200 882,280 832,127 828,746
Southland 925,636 1,479,914 1,442,635 991,459 802,257 790,037
Total 17,279,598 21,958,479 18,344,015 12,854,248 12,125,690 13,282,769
Tables 12 and 13 show the volume and energy content of pulp logs predicted to be available for some use at a regional level. Much of this resource is already used in wood processing; however some is exported and some regions do not have local pulp log demand (Gisborne and West Coast). Likely levels of pulp log availability over time are shown. The pulp log resource is substantial in its own right. Table 12 - pulp log; green tonnes per annum
2017 2022 2027 2032 2037 2042
Northland 459,896 428,342 345,564 268,894 364,185 458,227
Auckland 94,858 148,270 144,264 103,527 59,349 95,876
Waikato 514,786 799,032 704,115 448,177 398,655 574,229
Bay of Plenty 887,974 1,115,798 1,224,912 1,063,192 1,143,926 1,128,602
Taranaki 61,362 71,363 34,850 14,871 8,164 52,773
East Coast 501,412 571,155 399,374 218,344 261,620 497,606
Hawkes Bay 400,657 576,907 461,598 329,487 259,950 457,437
Manawatu-Wanganui 295,339 384,744 250,794 121,784 107,704 270,902
Wellington 101,622 113,909 80,325 48,451 42,045 90,197
Tasman-Nelson 217,994 275,562 263,971 287,613 246,090 258,504
Marlborough 205,975 229,920 142,818 103,887 133,679 227,965
West Coast 26,886 24,095 25,587 33,979 40,103 31,107
Canterbury 190,456 220,823 184,392 147,453 141,266 186,427
Otago 247,544 301,274 242,614 295,530 301,423 286,455
Southland 143,280 172,621 151,591 226,606 256,467 206,737
Total 4,352,058 5,435,837 4,658,796 3,713,826 3,766,662 4,825,084

17
Table 13 - pulp log; GJ per annum
2017 2022 2027 2032 2037 2042
Northland 3,173,282 2,955,561 2,384,392 1,855,367 2,512,877 3,161,769
Auckland 654,523 1,023,061 995,420 714,335 409,508 661,544
Waikato 3,552,021 5,513,319 4,858,397 3,092,423 2,750,717 3,962,177
Bay of Plenty 6,127,018 7,699,006 8,451,889 7,336,027 7,893,090 7,787,354
Taranaki 423,399 492,407 240,467 102,608 56,332 364,131
East Coast 3,459,740 3,940,969 2,755,678 1,506,571 1,805,177 3,433,482
Hawkes Bay 2,764,534 3,980,659 3,185,023 2,273,457 1,793,652 3,156,314
Manawatu-Wanganui 2,037,836 2,654,735 1,730,482 840,308 743,156 1,869,221
Wellington 701,193 785,975 554,243 334,309 290,108 622,357
Tasman-Nelson 1,504,156 1,901,377 1,821,399 1,984,529 1,698,020 1,783,679
Marlborough 1,421,231 1,586,446 985,441 716,821 922,388 1,572,960
West Coast 185,515 166,255 176,554 234,456 276,709 214,637
Canterbury 1,314,146 1,523,679 1,272,303 1,017,429 974,734 1,286,344
Otago 1,708,057 2,078,791 1,674,039 2,039,160 2,079,821 1,976,539
Southland 988,632 1,191,083 1,045,981 1,563,582 1,769,621 1,426,483
Total 30,017,301 37,495,347 32,133,734 25,613,413 25,977,949 33,281,033
Regions where significant amounts of the pulp log resource are potentially unused by existing industries and available for energy purposes are; Northland, Gisborne, West Coast, Otago and Southland. Northland, Gisborne and Otago have enough wood residues to meet the regional coal demand. The use of pulp logs for heat fuel could be possible on the West Coast and in Southland. Westland is the most likely candidate for use of pulp logs for energy, with no local pulp log processing. Southland has an MDF plant that uses pulp logs but it’s demand is less than the regional supply. Tables 14 and 15 show the volumes and energy content of horticultural and viticultural residues. These data were derived from a range of sources on vineyard areas, kiwi fruit area, orchard area, crop turnover and volume per ha at removal (Saggar et al 2007, NZ wine Growers 2009 & 2015). Future projections are based on annual growth in area used for horticulture of 0.5%.
18
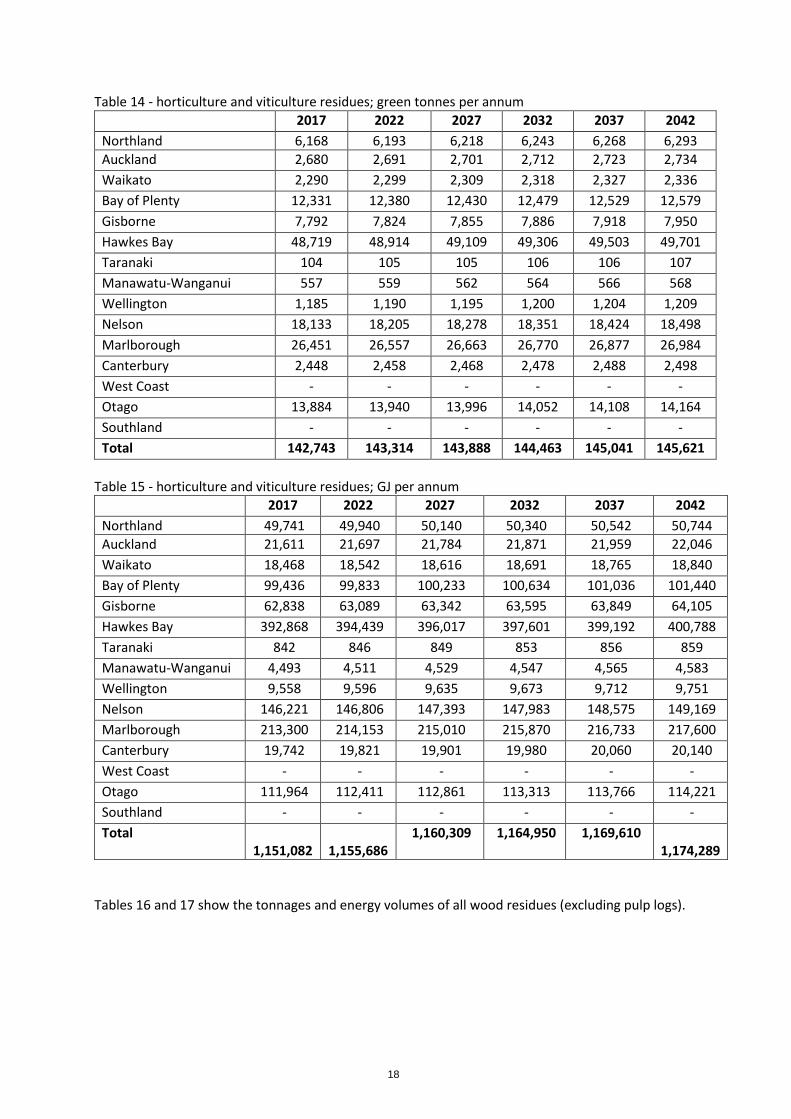
Table 14 - horticulture and viticulture residues; green tonnes per annum
2017 2022 2027 2032 2037 2042
Northland 6,168 6,193 6,218 6,243 6,268 6,293
Auckland 2,680 2,691 2,701 2,712 2,723 2,734
Waikato 2,290 2,299 2,309 2,318 2,327 2,336
Bay of Plenty 12,331 12,380 12,430 12,479 12,529 12,579
Gisborne 7,792 7,824 7,855 7,886 7,918 7,950
Hawkes Bay 48,719 48,914 49,109 49,306 49,503 49,701
Taranaki 104 105 105 106 106 107
Manawatu-Wanganui 557 559 562 564 566 568
Wellington 1,185 1,190 1,195 1,200 1,204 1,209
Nelson 18,133 18,205 18,278 18,351 18,424 18,498
Marlborough 26,451 26,557 26,663 26,770 26,877 26,984
Canterbury 2,448 2,458 2,468 2,478 2,488 2,498
West Coast - - - - - -
Otago 13,884 13,940 13,996 14,052 14,108 14,164
Southland - - - - - -
Total 142,743 143,314 143,888 144,463 145,041 145,621
Table 15 - horticulture and viticulture residues; GJ per annum
2017 2022 2027 2032 2037 2042
Northland 49,741 49,940 50,140 50,340 50,542 50,744
Auckland 21,611 21,697 21,784 21,871 21,959 22,046
Waikato 18,468 18,542 18,616 18,691 18,765 18,840
Bay of Plenty 99,436 99,833 100,233 100,634 101,036 101,440
Gisborne 62,838 63,089 63,342 63,595 63,849 64,105
Hawkes Bay 392,868 394,439 396,017 397,601 399,192 400,788
Taranaki 842 846 849 853 856 859
Manawatu-Wanganui 4,493 4,511 4,529 4,547 4,565 4,583
Wellington 9,558 9,596 9,635 9,673 9,712 9,751
Nelson 146,221 146,806 147,393 147,983 148,575 149,169
Marlborough 213,300 214,153 215,010 215,870 216,733 217,600
Canterbury 19,742 19,821 19,901 19,980 20,060 20,140
West Coast - - - - - -
Otago 111,964 112,411 112,861 113,313 113,766 114,221
Southland - - - - - -
Total 1,151,082
1,155,686
1,160,309 1,164,950 1,169,610 1,174,289
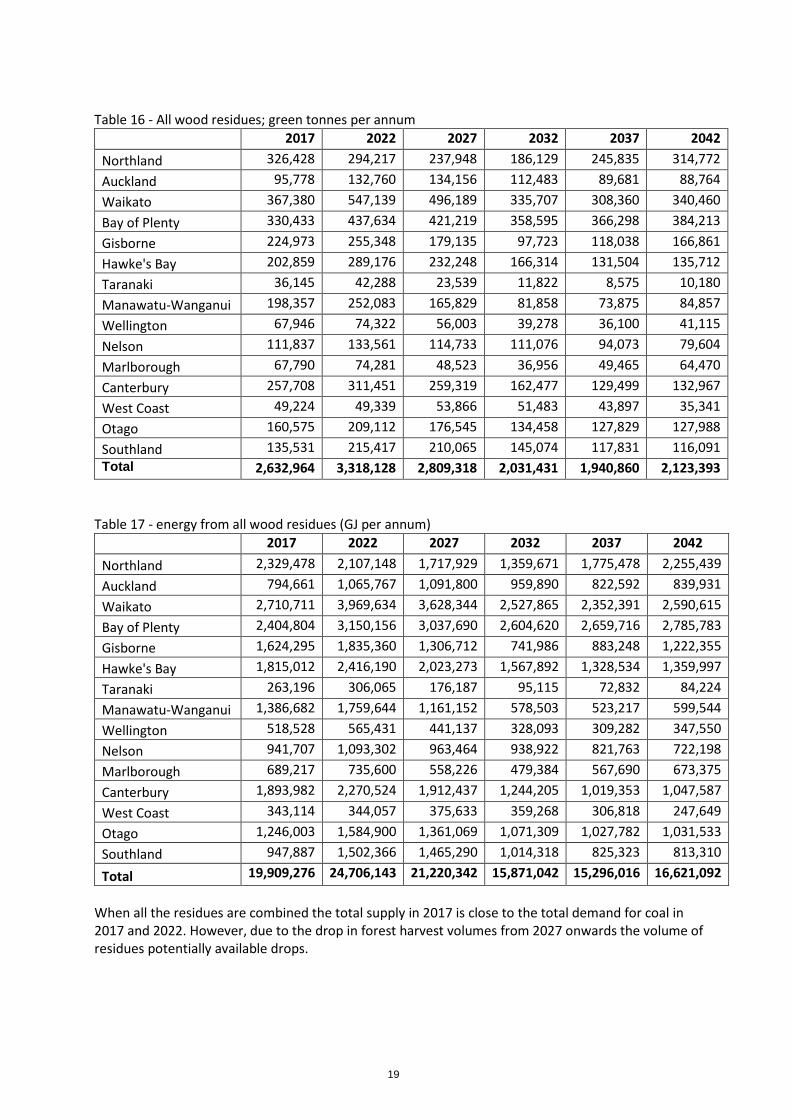
Tables 16 and 17 show the tonnages and energy volumes of all wood residues (excluding pulp logs).
19
Table 16 - All wood residues; green tonnes per annum
2017 2022 2027 2032 2037 2042
Northland 326,428 294,217 237,948 186,129 245,835 314,772
Auckland 95,778 132,760 134,156 112,483 89,681 88,764
Waikato 367,380 547,139 496,189 335,707 308,360 340,460
Bay of Plenty 330,433 437,634 421,219 358,595 366,298 384,213
Gisborne 224,973 255,348 179,135 97,723 118,038 166,861
Hawke's Bay 202,859 289,176 232,248 166,314 131,504 135,712
Taranaki 36,145 42,288 23,539 11,822 8,575 10,180
Manawatu-Wanganui 198,357 252,083 165,829 81,858 73,875 84,857
Wellington 67,946 74,322 56,003 39,278 36,100 41,115
Nelson 111,837 133,561 114,733 111,076 94,073 79,604
Marlborough 67,790 74,281 48,523 36,956 49,465 64,470
Canterbury 257,708 311,451 259,319 162,477 129,499 132,967
West Coast 49,224 49,339 53,866 51,483 43,897 35,341
Otago 160,575 209,112 176,545 134,458 127,829 127,988
Southland 135,531 215,417 210,065 145,074 117,831 116,091
Total 2,632,964 3,318,128 2,809,318 2,031,431 1,940,860 2,123,393
Table 17 - energy from all wood residues (GJ per annum)
2017 2022 2027 2032 2037 2042
Northland 2,329,478 2,107,148 1,717,929 1,359,671 1,775,478 2,255,439
Auckland 794,661 1,065,767 1,091,800 959,890 822,592 839,931
Waikato 2,710,711 3,969,634 3,628,344 2,527,865 2,352,391 2,590,615
Bay of Plenty 2,404,804 3,150,156 3,037,690 2,604,620 2,659,716 2,785,783
Gisborne 1,624,295 1,835,360 1,306,712 741,986 883,248 1,222,355
Hawke's Bay 1,815,012 2,416,190 2,023,273 1,567,892 1,328,534 1,359,997
Taranaki 263,196 306,065 176,187 95,115 72,832 84,224
Manawatu-Wanganui 1,386,682 1,759,644 1,161,152 578,503 523,217 599,544
Wellington 518,528 565,431 441,137 328,093 309,282 347,550
Nelson 941,707 1,093,302 963,464 938,922 821,763 722,198
Marlborough 689,217 735,600 558,226 479,384 567,690 673,375
Canterbury 1,893,982 2,270,524 1,912,437 1,244,205 1,019,353 1,047,587
West Coast 343,114 344,057 375,633 359,268 306,818 247,649
Otago 1,246,003 1,584,900 1,361,069 1,071,309 1,027,782 1,031,533
Southland 947,887 1,502,366 1,465,290 1,014,318 825,323 813,310
Total 19,909,276 24,706,143 21,220,342 15,871,042 15,296,016 16,621,092
When all the residues are combined the total supply in 2017 is close to the total demand for coal in 2017 and 2022. However, due to the drop in forest harvest volumes from 2027 onwards the volume of residues potentially available drops.

20
Figure 5 - proportions of potential wood fuel by source; 2017
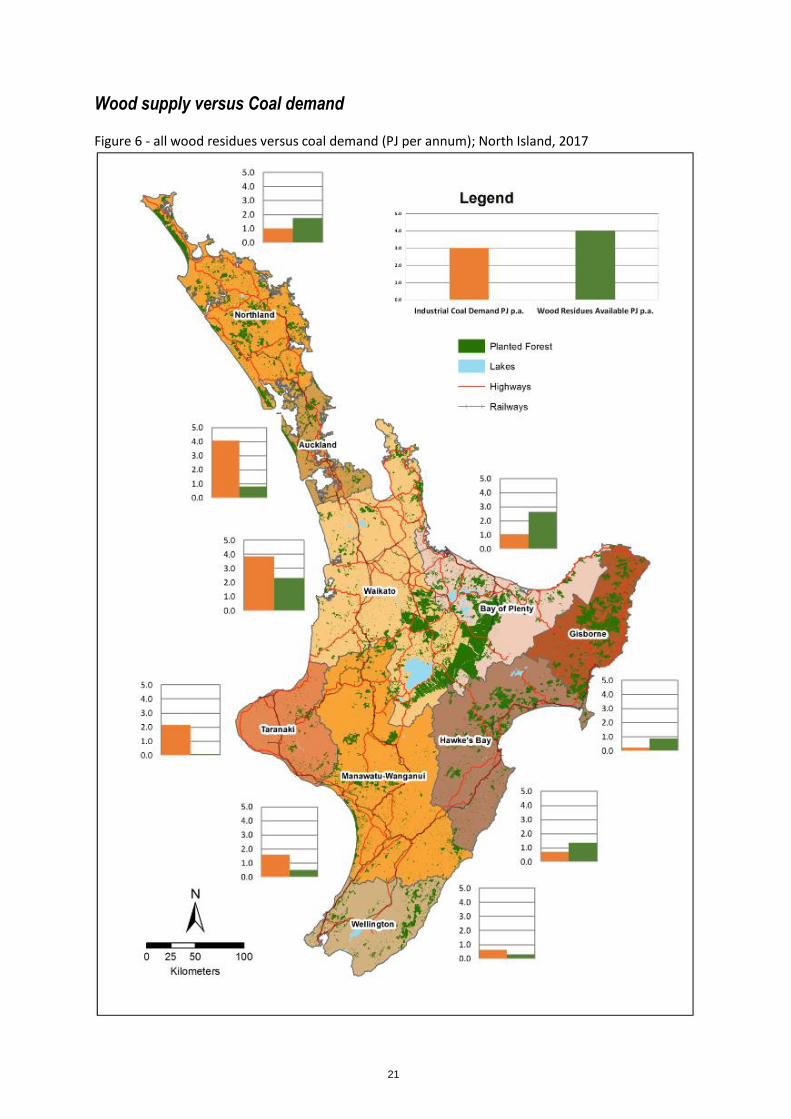
Figures 6 and 7 show the regional supply of wood versus the demand for coal for the North and South Islands respectively.
21
Wood supply versus Coal demand Figure 6 - all wood residues versus coal demand (PJ per annum); North Island, 2017
22
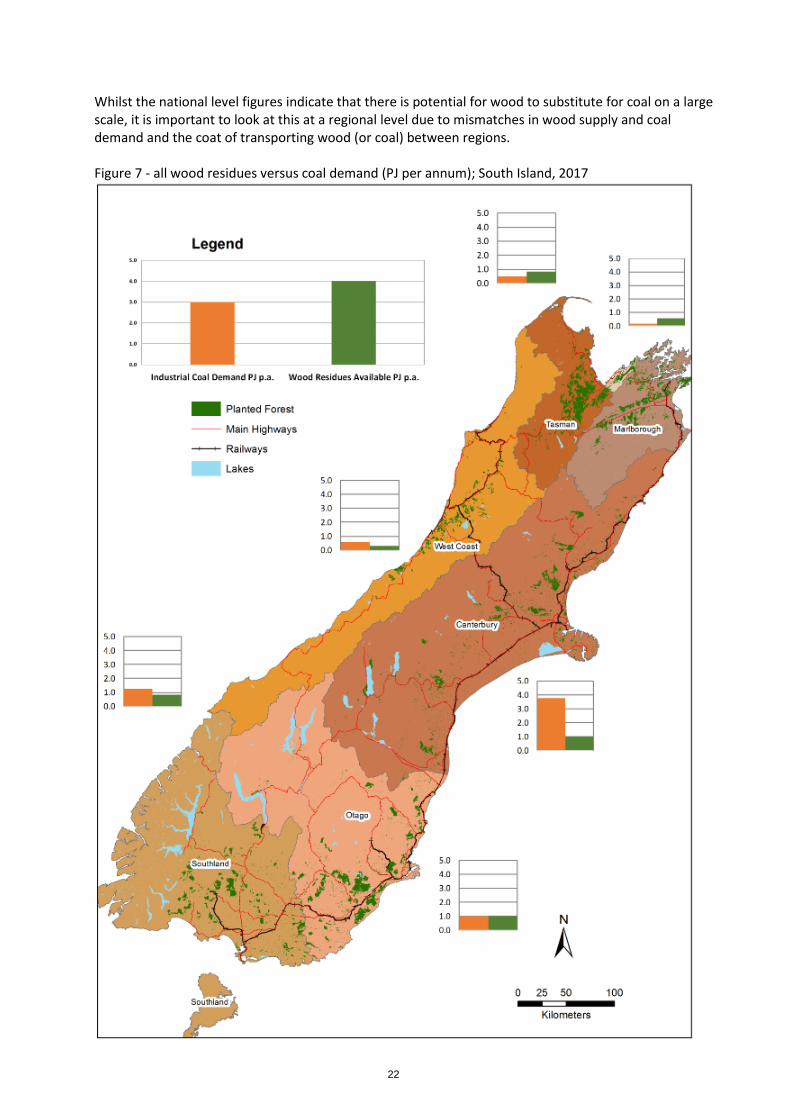
Whilst the national level figures indicate that there is potential for wood to substitute for coal on a large scale, it is important to look at this at a regional level due to mismatches in wood supply and coal demand and the coat of transporting wood (or coal) between regions. Figure 7 - all wood residues versus coal demand (PJ per annum); South Island, 2017
23
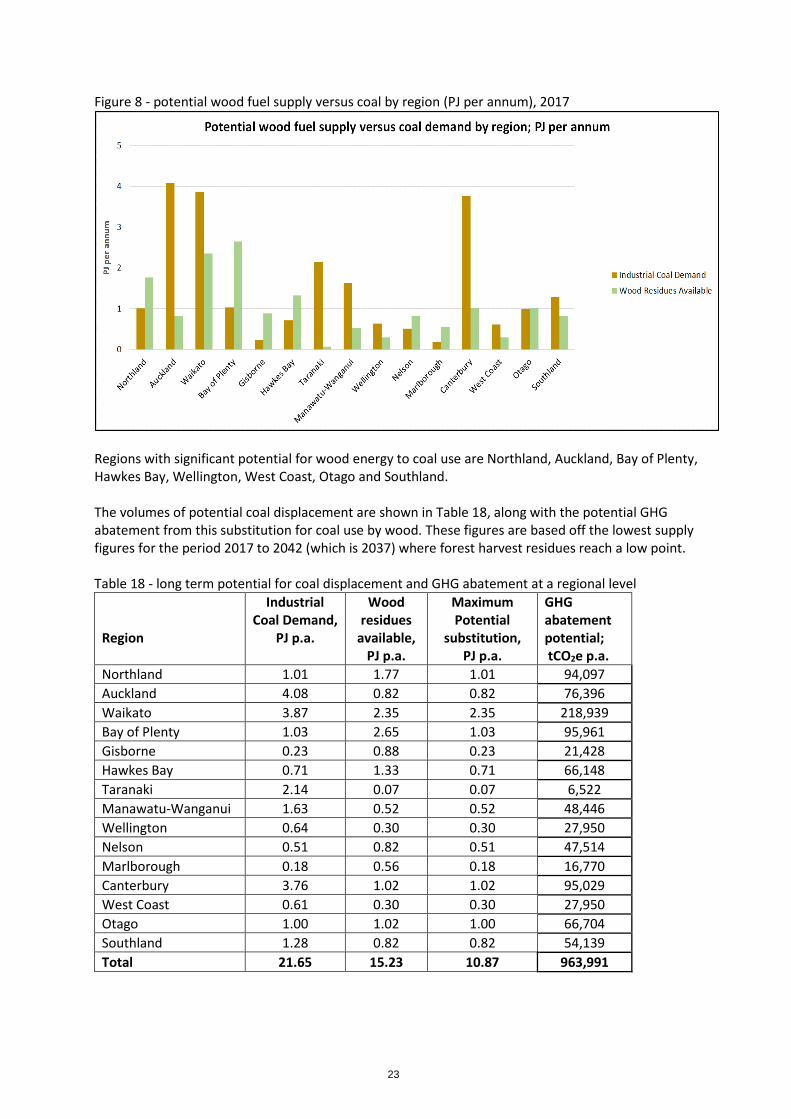
Figure 8 - potential wood fuel supply versus coal by region (PJ per annum), 2017
Regions with significant potential for wood energy to coal use are Northland, Auckland, Bay of Plenty, Hawkes Bay, Wellington, West Coast, Otago and Southland. The volumes of potential coal displacement are shown in Table 18, along with the potential GHG abatement from this substitution for coal use by wood. These figures are based off the lowest supply figures for the period 2017 to 2042 (which is 2037) where forest harvest residues reach a low point. Table 18 - long term potential for coal displacement and GHG abatement at a regional level
Region
Industrial Coal Demand,
PJ p.a.
Wood residues
available, PJ p.a.
Maximum Potential
substitution, PJ p.a.
GHG abatement potential; tCO2e p.a.
Northland 1.01 1.77 1.01 94,097
Auckland 4.08 0.82 0.82 76,396
Waikato 3.87 2.35 2.35 218,939
Bay of Plenty 1.03 2.65 1.03 95,961
Gisborne 0.23 0.88 0.23 21,428
Hawkes Bay 0.71 1.33 0.71 66,148
Taranaki 2.14 0.07 0.07 6,522
Manawatu-Wanganui 1.63 0.52 0.52 48,446
Wellington 0.64 0.30 0.30 27,950
Nelson 0.51 0.82 0.51 47,514
Marlborough 0.18 0.56 0.18 16,770
Canterbury 3.76 1.02 1.02 95,029
West Coast 0.61 0.30 0.30 27,950
Otago 1.00 1.02 1.00 66,704
Southland 1.28 0.82 0.82 54,139
Total 21.65 15.23 10.87 963,991
24
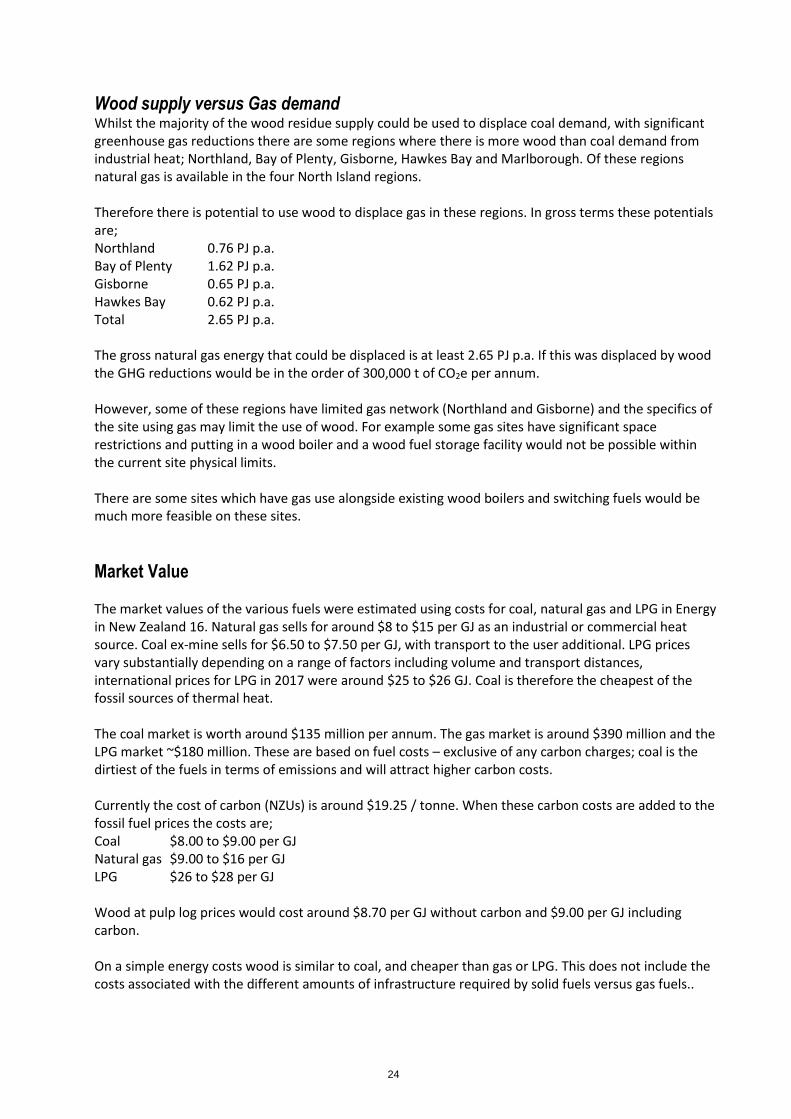
Wood supply versus Gas demand Whilst the majority of the wood residue supply could be used to displace coal demand, with significant greenhouse gas reductions there are some regions where there is more wood than coal demand from industrial heat; Northland, Bay of Plenty, Gisborne, Hawkes Bay and Marlborough. Of these regions natural gas is available in the four North Island regions. Therefore there is potential to use wood to displace gas in these regions. In gross terms these potentials are; Northland 0.76 PJ p.a. Bay of Plenty 1.62 PJ p.a. Gisborne 0.65 PJ p.a. Hawkes Bay 0.62 PJ p.a. Total 2.65 PJ p.a. The gross natural gas energy that could be displaced is at least 2.65 PJ p.a. If this was displaced by wood the GHG reductions would be in the order of 300,000 t of CO2e per annum. However, some of these regions have limited gas network (Northland and Gisborne) and the specifics of the site using gas may limit the use of wood. For example some gas sites have significant space restrictions and putting in a wood boiler and a wood fuel storage facility would not be possible within the current site physical limits. There are some sites which have gas use alongside existing wood boilers and switching fuels would be much more feasible on these sites.
Market Value The market values of the various fuels were estimated using costs for coal, natural gas and LPG in Energy in New Zealand 16. Natural gas sells for around $8 to $15 per GJ as an industrial or commercial heat source. Coal ex-mine sells for $6.50 to $7.50 per GJ, with transport to the user additional. LPG prices vary substantially depending on a range of factors including volume and transport distances, international prices for LPG in 2017 were around $25 to $26 GJ. Coal is therefore the cheapest of the fossil sources of thermal heat. The coal market is worth around $135 million per annum. The gas market is around $390 million and the LPG market ~$180 million. These are based on fuel costs – exclusive of any carbon charges; coal is the dirtiest of the fuels in terms of emissions and will attract higher carbon costs. Currently the cost of carbon (NZUs) is around $19.25 / tonne. When these carbon costs are added to the fossil fuel prices the costs are; Coal $8.00 to $9.00 per GJ Natural gas $9.00 to $16 per GJ LPG $26 to $28 per GJ Wood at pulp log prices would cost around $8.70 per GJ without carbon and $9.00 per GJ including carbon. On a simple energy costs wood is similar to coal, and cheaper than gas or LPG. This does not include the costs associated with the different amounts of infrastructure required by solid fuels versus gas fuels..

25
Discussion
Other sources of wood or ligno-cellulosic biomass fuel for industrial heat are wood processing operations and agricultural straws. However in the case of the wood processing residues the bulk of the wood residues such as bark, sawdust, shavings etc., are used as fuel within the wood processing operations for process steam production, drying and curing. The agricultural residues are less well described but occur in limited quantities in only a few regions. There are competing markets for sawmill residues in some regions (e.g. Southland). Straws also have different composition to wood (high ash, high alkali metals content, low ash fusion temperatures) which leads to different ash behaviour and generally specialist straw combustion facilities are required. These materials will be described in more detail in other work currently being prepared and will not be included in this analysis which primarily focusses on the demand from coal and gas users, and the larger supplies from in-forest and municipal wood residues. Wood residues come in a variety of forms, from large sections of stem wood (300mm diameter and 1m long) to sawdust (3mm particle size). In order to make the wood fit with the combustion systems in place, some sizing (reduction or agglomeration via densification) maybe required. Cost of wood supply versus coal One of the barriers to use of wood is that it tends to cost more per GJ than coal. For industrial users coal is $6 to $8 per GJ depending on the size of the demand and its distance from the mine supplying it. There are few large scale wood energy operations, with some have developed in the last 3 to 5 years in Southland, Canterbury, Northland and the Central North Island. Delivered fuel cost for wood residues is estimated at $7 to $10 per GJ; depending on the size of the demand and the distance to the source of wood supplying it. The mid-range price for coal is $7 per GJ and the midrange for wood is $8.50. The cost of GHG emissions will have an influence on the ability of wood fuels to compete with coal on price in the next few years. It is estimated that every $10 per tonne of CO2e adds around $1 per GJ to the cost of coal. Therefore the cost of CO2e needs to be in the order of $25 / tonne or more to encourage uptake of wood energy. The price of carbon on the NZ market in late 2017 (CommTrade Carbon, November 2017) has been in the order of $19 per tonne. To get all of the potential wood energy would likely require a greater than average price on GHG emissions in order to encourage the extraction and use of the more expensive wood fuels. Whilst it is possible to move wood from regions with excess supply (Bay of Plenty, East Coast) to those with excess demand (Waikato) this will add to the delivered of the wood fuel. This also applies to coal but has less impact as coal is more energy dense. Existing wood energy use is around 25 to 26 PJ per annum (EECA heat plant data base); excluding energy derive from black liquor (derived from wood processing), which is produced and consumed at Kraft pulp mills. Total fossil fuel demand for industrial process heat is shown in Table 19.
26
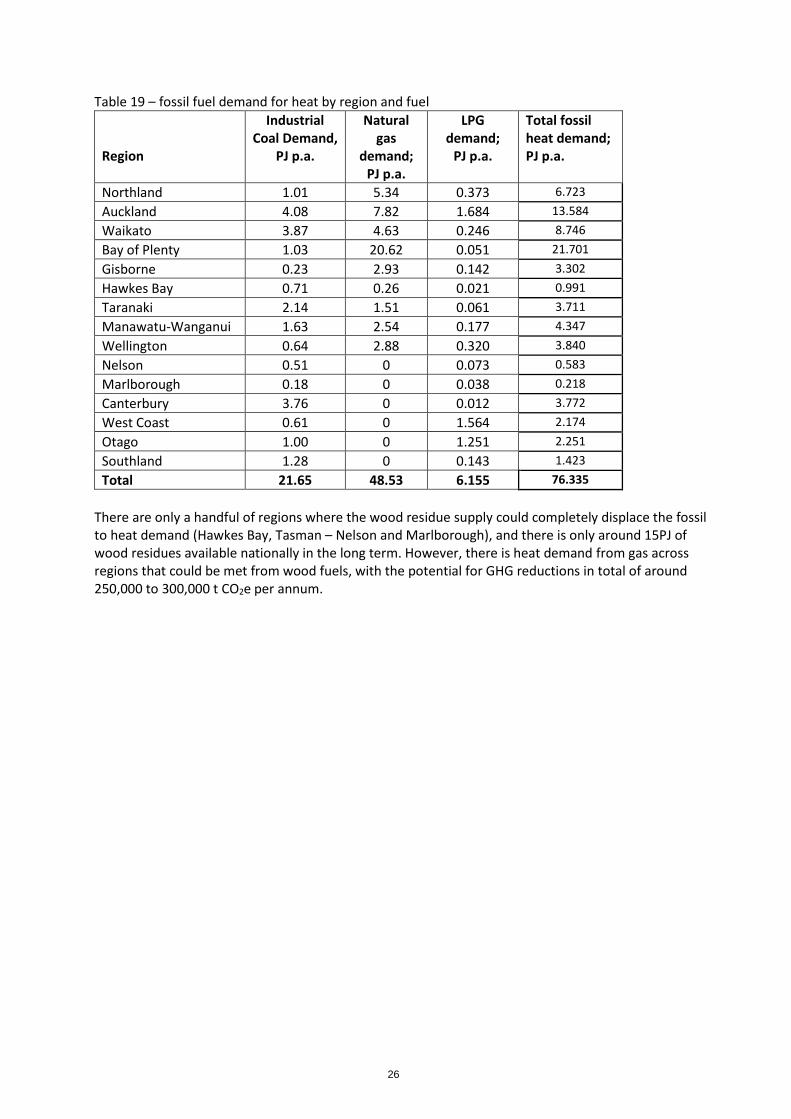
Table 19 – fossil fuel demand for heat by region and fuel
Region
Industrial Coal Demand,
PJ p.a.
Natural gas
demand; PJ p.a.
LPG demand;
PJ p.a.
Total fossil heat demand; PJ p.a.
Northland 1.01 5.34 0.373 6.723
Auckland 4.08 7.82 1.684 13.584
Waikato 3.87 4.63 0.246 8.746
Bay of Plenty 1.03 20.62 0.051 21.701
Gisborne 0.23 2.93 0.142 3.302
Hawkes Bay 0.71 0.26 0.021 0.991
Taranaki 2.14 1.51 0.061 3.711
Manawatu-Wanganui 1.63 2.54 0.177 4.347
Wellington 0.64 2.88 0.320 3.840
Nelson 0.51 0 0.073 0.583
Marlborough 0.18 0 0.038 0.218
Canterbury 3.76 0 0.012 3.772
West Coast 0.61 0 1.564 2.174
Otago 1.00 0 1.251 2.251
Southland 1.28 0 0.143 1.423
Total 21.65 48.53 6.155 76.335
There are only a handful of regions where the wood residue supply could completely displace the fossil to heat demand (Hawkes Bay, Tasman – Nelson and Marlborough), and there is only around 15PJ of wood residues available nationally in the long term. However, there is heat demand from gas across regions that could be met from wood fuels, with the potential for GHG reductions in total of around 250,000 to 300,000 t CO2e per annum.
27
Conclusions
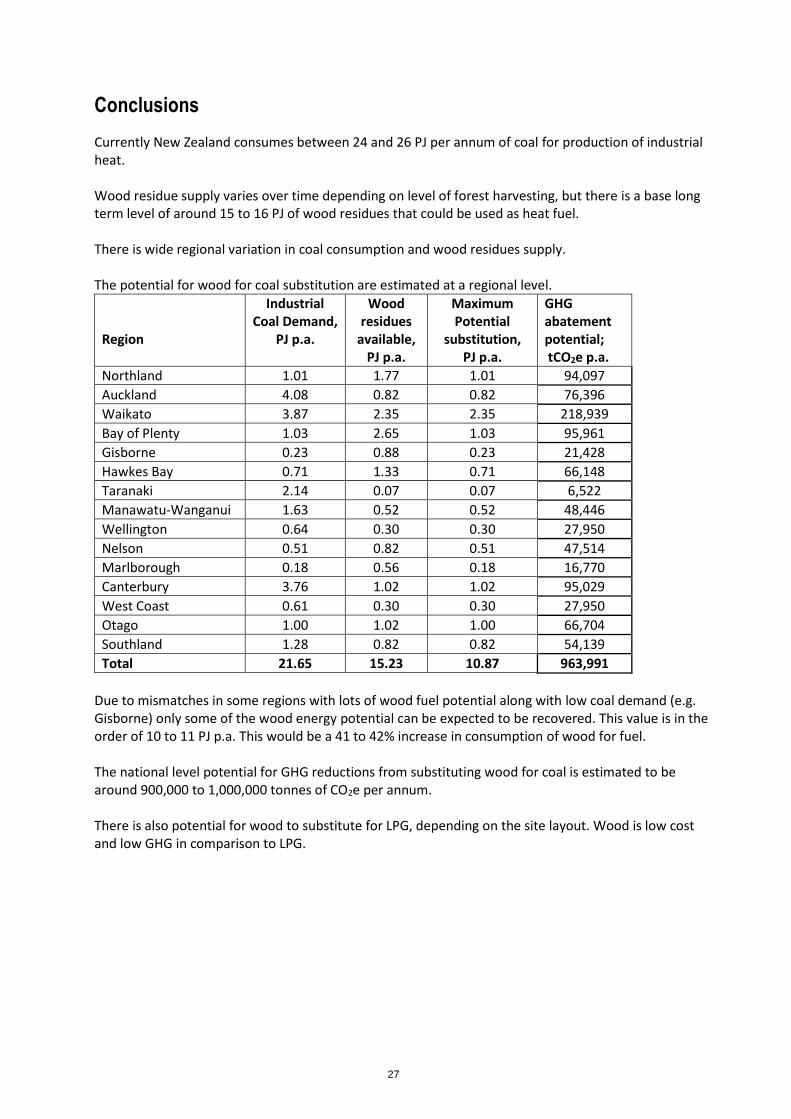
Currently New Zealand consumes between 24 and 26 PJ per annum of coal for production of industrial heat. Wood residue supply varies over time depending on level of forest harvesting, but there is a base long term level of around 15 to 16 PJ of wood residues that could be used as heat fuel. There is wide regional variation in coal consumption and wood residues supply. The potential for wood for coal substitution are estimated at a regional level.
Region
Industrial Coal Demand,
PJ p.a.
Wood residues
available, PJ p.a.
Maximum Potential
substitution, PJ p.a.
GHG abatement potential; tCO2e p.a.
Northland 1.01 1.77 1.01 94,097
Auckland 4.08 0.82 0.82 76,396
Waikato 3.87 2.35 2.35 218,939
Bay of Plenty 1.03 2.65 1.03 95,961
Gisborne 0.23 0.88 0.23 21,428
Hawkes Bay 0.71 1.33 0.71 66,148
Taranaki 2.14 0.07 0.07 6,522
Manawatu-Wanganui 1.63 0.52 0.52 48,446
Wellington 0.64 0.30 0.30 27,950
Nelson 0.51 0.82 0.51 47,514
Marlborough 0.18 0.56 0.18 16,770
Canterbury 3.76 1.02 1.02 95,029
West Coast 0.61 0.30 0.30 27,950
Otago 1.00 1.02 1.00 66,704
Southland 1.28 0.82 0.82 54,139
Total 21.65 15.23 10.87 963,991
Due to mismatches in some regions with lots of wood fuel potential along with low coal demand (e.g. Gisborne) only some of the wood energy potential can be expected to be recovered. This value is in the order of 10 to 11 PJ p.a. This would be a 41 to 42% increase in consumption of wood for fuel. The national level potential for GHG reductions from substituting wood for coal is estimated to be around 900,000 to 1,000,000 tonnes of CO2e per annum. There is also potential for wood to substitute for LPG, depending on the site layout. Wood is low cost and low GHG in comparison to LPG.

28
References
CommTrade Carbon; https://www.commtrade.co.nz/ EECA heat plant database 2011. http://www.bioenergy.org.nz/documents/resource/heat-plant-database-report-august-2011.pdf EECA energy end-use database; accessed march 2017, retrieving gas consumption data for 2012. https://www.eeca.govt.nz/resources-and-tools/tools/energy-end-use-database/ Evanson T. and Hall P. (2007) Resource assessment of municipal wood waste. Scion Report; Bioenergy Options for New Zealand; Situation analysis. Hall P., Estcourt G. and Kimberly M. (2011) Torrefaction of woody biomass for improving solid fuels attributes. Paper presented at Residues to Revenues, Rotorua, 2011. Ireland -Blake M. (2017). Municipal solid waste and wood waste - annual disposal to landfill in New Zealand. Sidney No. 23067. Saggar S., Giltrap D., Forgie V. and Renquist R. (2007). Bioenergy Options report: Review of Agricultural resources. LandCare Research Contract Report; LC0708/016 Ministry of Business, Innovation and Employment. Energy in New Zealand 16. 2015 Calendar year edition. Ministry of Primary Industries; National exotic forest description, as at 1 April 2015. https://www.mpi.govt.nz/news-and-resources/open-data-and-forecasting/forestry/new-zealands-forests/ Ministry of Primary Industries; National exotic forest description, yield tables. https://www.mpi.govt.nz/news-and-resources/open-data-and-forecasting/forestry/new-zealands-forests/ Ministry of Primary Industries; Wood availability forecasts. https://www.mpi.govt.nz/news-and-resources/open-data-and-forecasting/forestry/new-zealands-forests/ Ministry of the Environment. (2016). New Zealand’s greenhouse gas inventory 1990-2014. Snapshot May 2016 INFO 758. http://www.mfe.govt.nz/sites/default/files/media/Climate%20Change/greenhouse-gas-inventory-snapshot-2016.pdf New Zealand Wine Growers; Statistical Annual - 2009. http://www.nzwine.com/assets/sm/upload/ys/np/yf/q7/NZW%20AR09%20web_no%20directories.pdf NEW ZEALAND WINEGROWERS VINEYARD REGISTER REPORT 2015-2018 http://www.nzwine.com/assets/sm/upload/zh/by/np/43/2015-2018%20Vineyard%20Register%20Report%20final.pdf The Gas Industry Company Ltd (2016). THE NEW ZEALAND GAS STORY. The State and Performance of the New Zealand Gas Industry. FIFTH EDITION | DECEMBER 2016. http://gasindustry.co.nz/about-the-industry/nz-gas-story/
29
Acknowledgements
Scion wishes to acknowledge the assistance of; EECA for the use of the heat plant database and the energy endues database, University of Waikato for updates to the heat plant database and GNS for the revised data on coal resources and the use of geothermal heat in the heat plant database.

30
Appendix 1 - Coal use by region and Industry; GJ p.a.
Coal
use
; GJ p
.a.
Chem
ical
Dairy
Proc
essin
gDi
rect
Use
Food
proc
essin
gHo
rticu
lture
Mea
t & Sk
ins
Proc
essin
g
Othe
r
Man
ufac
turin
g
Pulp
and
Pape
rTe
xtile
s
Woo
d
Proc
essin
gTo
tal
Tota
l exc
dire
ct
use
North
land
26,4
70,5
67
328,
523
26
,799
,090
328,
523
Auck
land
244,
963
75
,842
20
8,78
3
529,
589
529,
589
Wai
kato
3,77
1,15
4
8,
117,
641
113,
828
42
0,34
6
12,4
22,9
68
4,
305,
328
Bay o
f Ple
nty
112,
025
89
,534
697,
298
1,56
5,36
3
68,3
07
2,53
2,52
7
2,53
2,52
7
Gisb
orne
-
-
Haw
kes B
ay30
3,23
3
1,04
9,14
9
1,35
2,38
3
1,35
2,38
3
Tara
naki
46,6
56
46
,656
46,6
56
Man
awat
u-W
hang
anui
8,26
4
23
3,05
7
76,2
35
317,
556
317,
556
Wai
rara
pa-
-
Wel
lingt
on20
6,88
7
206,
887
206,
887
Nelso
n34
7,84
7
37,7
31
550,
301
13
1,35
7
1,06
7,23
6
1,06
7,23
6
Mar
lbor
ough
12,9
21
50,9
70
76,0
61
88
,052
228,
003
228,
003
North
Can
terb
ury
-
-
Cant
erbu
ry68
,218
6,
003,
867
208,
122
39
1,45
0
1,22
5,80
2
1,
003,
715
17
2,54
6
9,07
3,71
9
9,07
3,71
9
Wes
t Coa
st1,
120,
658
77,6
46
148,
506
11
0,70
5
1,45
7,51
5
1,45
7,51
5
Otag
o58
,472
5,
326
257,
807
1,
020,
946
314,
211
138,
384
22
,840
1,
817,
987
1,
817,
987
Sout
hlan
d54
6,77
4
4,87
9
13
7,50
3
131,
633
82
0,78
9
82
0,78
9
Gran
d To
tal
126,
690
11
,795
,626
34
,588
,208
84
4,07
0
1,33
7,35
8
3,
894,
630
3,15
2,42
6
1,64
1,59
9
138,
384
1,
153,
915
58,6
72,9
06
24
,084
,698
31
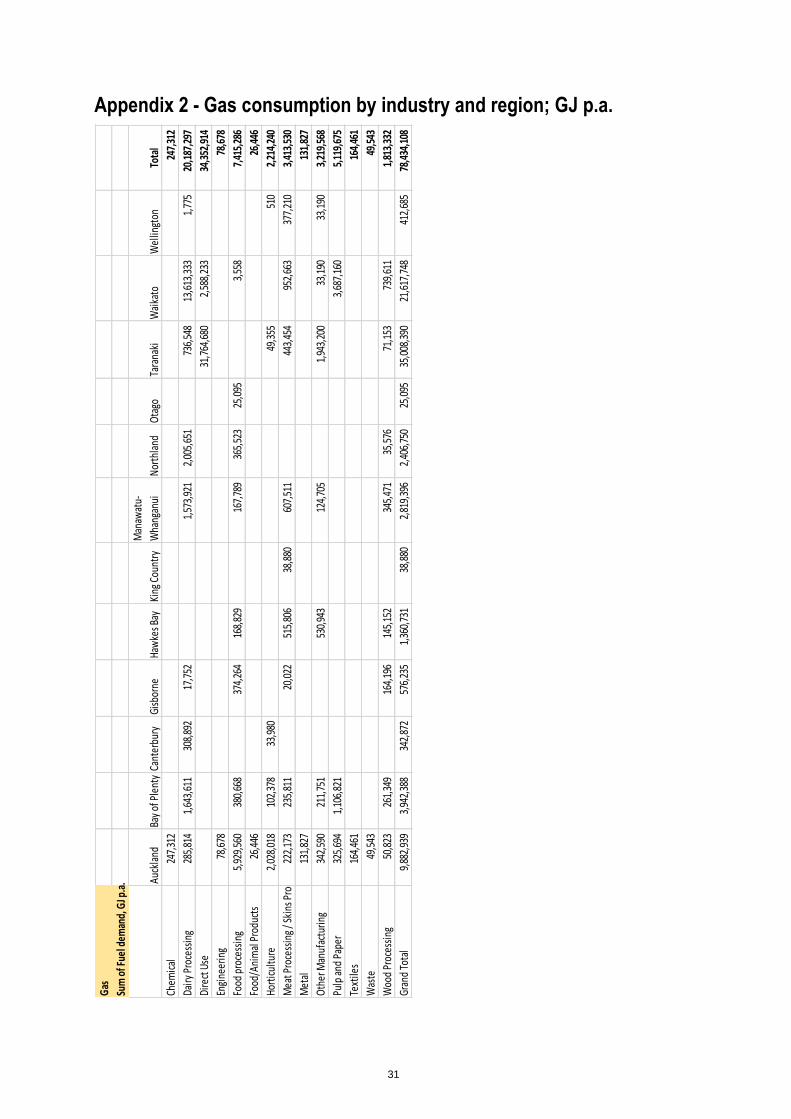
Appendix 2 - Gas consumption by industry and region; GJ p.a. G
as
Sum
of F
uel d
eman
d, G
J p.a
. Auck
land
Bay
of P
lent
yCa
nter
bury
Gisb
orne
Haw
kes B
ayKi
ng C
ount
ry
Man
awat
u-
Wha
ngan
uiN
orth
land
Ota
goTa
rana
kiW
aika
toW
ellin
gton
Tota
l
Chem
ical
247,
312
24
7,31
2
Dairy
Pro
cess
ing
285,
814
1,
643,
611
308,
892
17
,752
1,
573,
921
2,
005,
651
73
6,54
8
13,6
13,3
33
1,
775
20
,187
,297
Dire
ct U
se31
,764
,680
2,
588,
233
34
,352
,914
Engi
neer
ing
78,6
78
78,6
78
Food
pro
cess
ing
5,92
9,56
0
38
0,66
8
374,
264
16
8,82
9
167,
789
365,
523
25,0
95
3,
558
7,
415,
286
Food
/Ani
mal
Pro
duct
s26
,446
26
,446
Hort
icul
ture
2,02
8,01
8
10
2,37
8
33,9
80
49,3
55
510
2,21
4,24
0
Mea
t Pro
cess
ing
/ Ski
ns P
roce
ssin
g222,
173
23
5,81
1
20,0
22
515,
806
38
,880
607,
511
443,
454
95
2,66
3
37
7,21
0
3,
413,
530
Met
al13
1,82
7
131,
827
Oth
er M
anuf
actu
ring
342,
590
21
1,75
1
530,
943
12
4,70
5
1,
943,
200
33,1
90
33
,190
3,21
9,56
8
Pulp
and
Pap
er32
5,69
4
1,10
6,82
1
3,
687,
160
5,
119,
675
Text
iles
164,
461
16
4,46
1
Was
te49
,543
49
,543
Woo
d Pr
oces
sing
50,8
23
261,
349
16
4,19
6
145,
152
34
5,47
1
35
,576
71
,153
73
9,61
1
1,
813,
332
Gran
d To
tal
9,88
2,93
9
3,
942,
388
342,
872
57
6,23
5
1,36
0,73
1
38
,880
2,81
9,39
6
2,40
6,75
0
25,0
95
35
,008
,390
21
,617
,748
412,
685
78,4
34,1
08

32