Embed Size (px)
Citation preview

Peter A. Bandettini
Unit on Functional Imaging MethodsLaboratory of Brain and Cognition
&Functional MRI Facility
Neuronal Current Imaging(GRC: In vivo Magnetic Resonance 2004)

Natalia Petridou
Jerzy Bodurka
Peter A. Bandettini
Unit on Functional Imaging Methods /Functional MRI Facility, NIMH, NIH
Afonso C. SilvaLaboratory of Functional and
Molecular Imaging, NINDS, NIH
Dietmar PlenzUnit of Neural Network Physiology,
NIMH, NIH
Primary researchers and collaborators:
Related Papers
J. Bodurka, P. A. Bandettini. Toward direct mapping of neuronal activity: MRI detection of ultra weak transient magnetic field changes. Magn. Reson. Med. 47: 1052-1058, (2002).
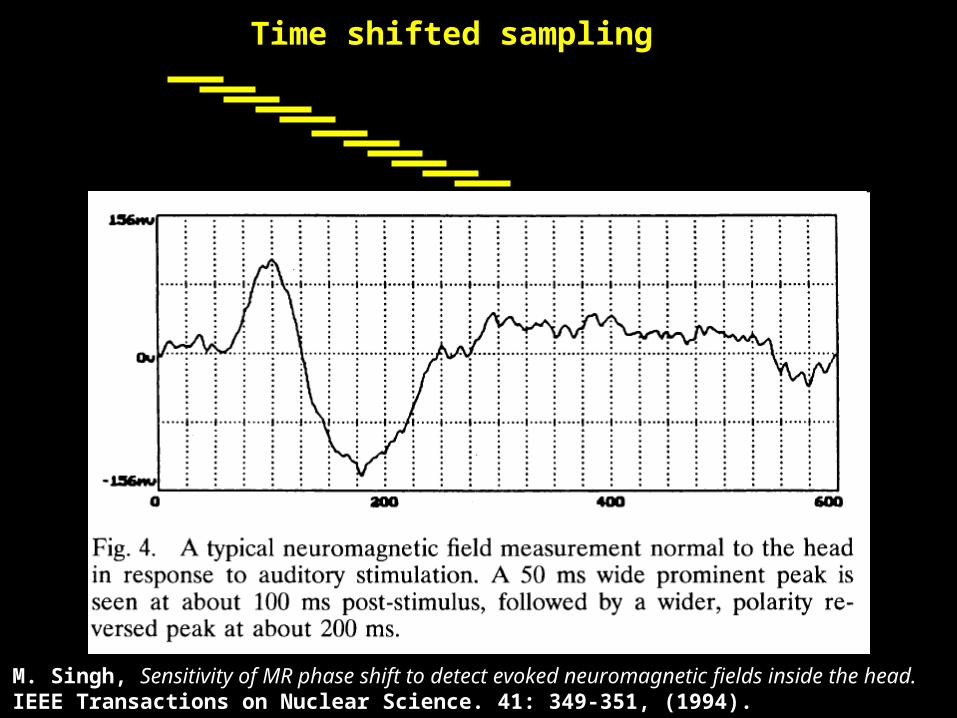
M. Singh, Sensitivity of MR phase shift to detect evoked neuromagnetic fields inside the head.IEEE Transactions on Nuclear Science. 41: 349-351, (1994).
D. Konn, P. Gowland, R. Bowtell, MRI detection of weak magnetic fields due to an extended current dipole in a conducting sphere: a model for direct detection of neuronal currents in the brain. Magn. Reson. Med. 50: 40-49, (2003).
J. Xiong, P. T. Fox, J.-H. Gao, Direct MRI Mapping of neuronal activity. Human Brain Mapping, 20: 41-49, (2003)
G. C. Scott, M. L. Joy, R. L. Armstrong, R. M. Henkelman, RF current density imaging homogeneous media. Magn. Reson. Med. 28: 186-201, (1992).
H. Kamei, J, Iramina, K. Yoshikawa, S. Ueno, Neuronal current distribution imaging using MR. IEEE Trans. On Magnetics, 35: 4109-4111, (1999)
M. L. Joy, G. C. Scott, R. M, Henkelman, In vivo detection of applied electric currents by magnetic resonance imaging. Magn Reson Imaging 7: 89-94, (1989).
J. Bodurka, P. A. Bandettini. Current induced magnetic resonance phase imaging. Journal of Magnetic Resonance, 137: 265-271, (1999).
R. Chu, J. A. de Zwart, P. van Gelderen, M. Fukunaga, P. Kellman, T. Hollroyd, J. Duyn. Hunting for neuonal currents: absence of rapid MRI signal changes during visual evoked response. NeuroImage (in press).

Neuronal Dynamics…
J.P. Wikswo Jr et al. J Clin Neuronphy 8(2): 170-188, 1991
100 fT at on surface of skull
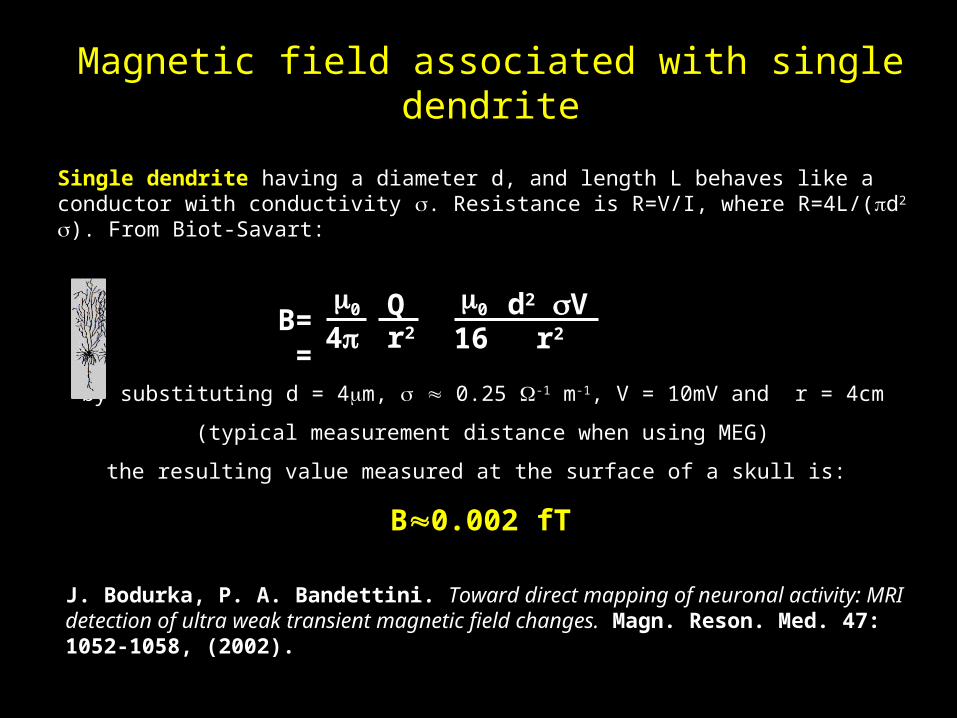
Magnetic field associated with single dendrite
Single dendrite having a diameter d, and length L behaves like a conductor with conductivity . Resistance is R=V/I, where R=4L/(d2 ). From Biot-Savart:
r2B= = 0
4Qr2
0
16d2 V
by substituting d = 4m, 0.25 -1 m-1, V = 10mV and r = 4cm
(typical measurement distance when using MEG)
the resulting value measured at the surface of a skull is:
B0.002 fT
J. Bodurka, P. A. Bandettini. Toward direct mapping of neuronal activity: MRI detection of ultra weak transient magnetic field changes. Magn. Reson. Med. 47: 1052-1058, (2002).

Because BMEG=100fT is measured by MEG on the scalp, at least 50,000 neurons (0.002
fT x 50,000 = 100 fT), must coherently act to generate such field. These bundles of neurons produce, within a typical voxel, 1 mm x 1 mm x 1 mm, a field of order:
MEGMEGMRI
MEGMEGMRI B
cm
cmB
r
rBB 1600
1.0
422
BMRI 0.2nT
Magnetic field associated with
bundle of dendrites
0.05 0.1 0.15 0.2 0.25 0.3
0.2
0.4
0.6
0.8
1
0.05 0.1 0.15 0.2 0.25 0.3
0.01
0.02
0.03
0.04
0.05 0.1 0.15 0.2 0.25 0.3
0.1
0.2
0.3
0.4
0.5
0.6
0.7
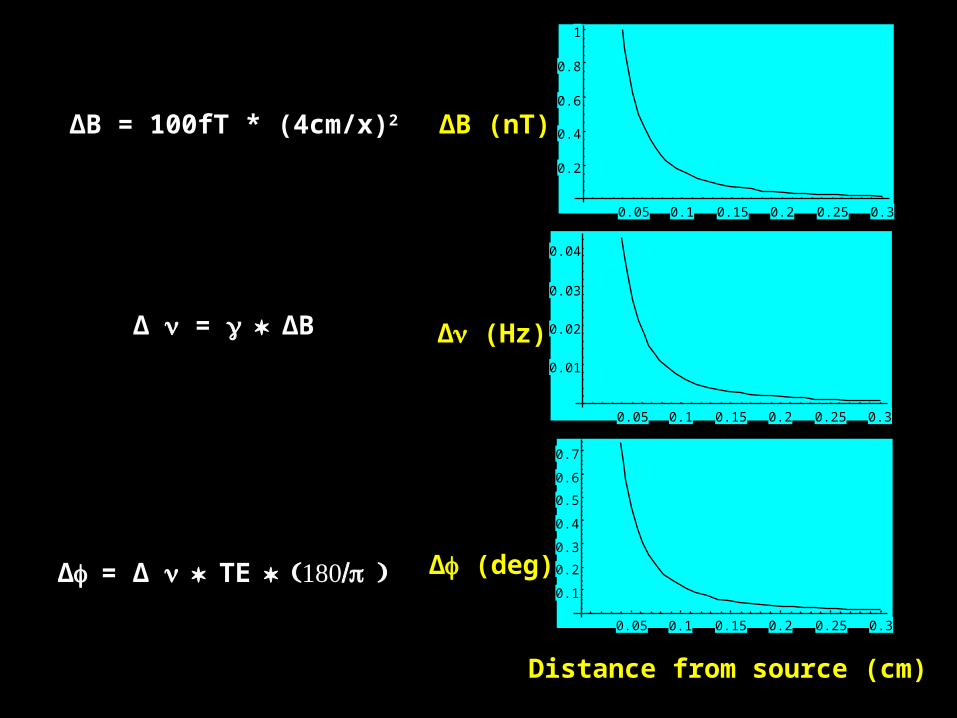
Distance from source (cm)
∆B (nT)
∆ (Hz)
∆ (deg)
∆B = 100fT * (4cm/x)2
∆ = ∆B
∆= ∆ TE
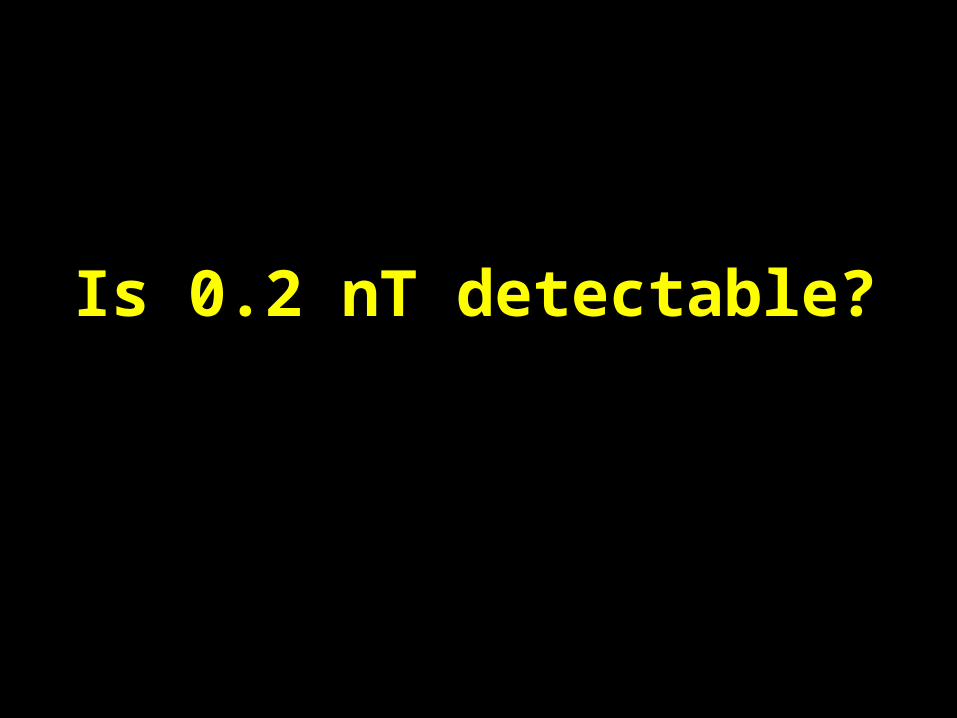
Is 0.2 nT detectable?

wire
wire
X
Z
Current Phantom Experiment

calculated Bc || B0
B0
Measurement
Correlation image
Single shot GE EPI
70 A current
200
J. Bodurka, P. A. Bandettini. Toward direct mapping of neuronal activity: MRI detection of ultra weak transient magnetic field changes, Magn. Reson. Med. 47: 1052-1058, (2002).

Figure 1
B0<2nT
X=0
I=10 A, =40ms
FF
T((
t))
0.0 0.1 0.2 0.3 0.4 0.5
B0<0.2nT X=12.5 mm
Z
X
BR<0.2nT
BR<2nT
J. Bodurka, P. A. Bandettini. Toward direct mapping of neuronal activity: MRI detection of ultra weak transient magnetic field changes, Magn. Reson. Med. 47: 1052-1058, (2002).
0.002 0.004 0.006 0.008 0.01
0.5
1
1.5
2
Distance (m)
∆B (nT)
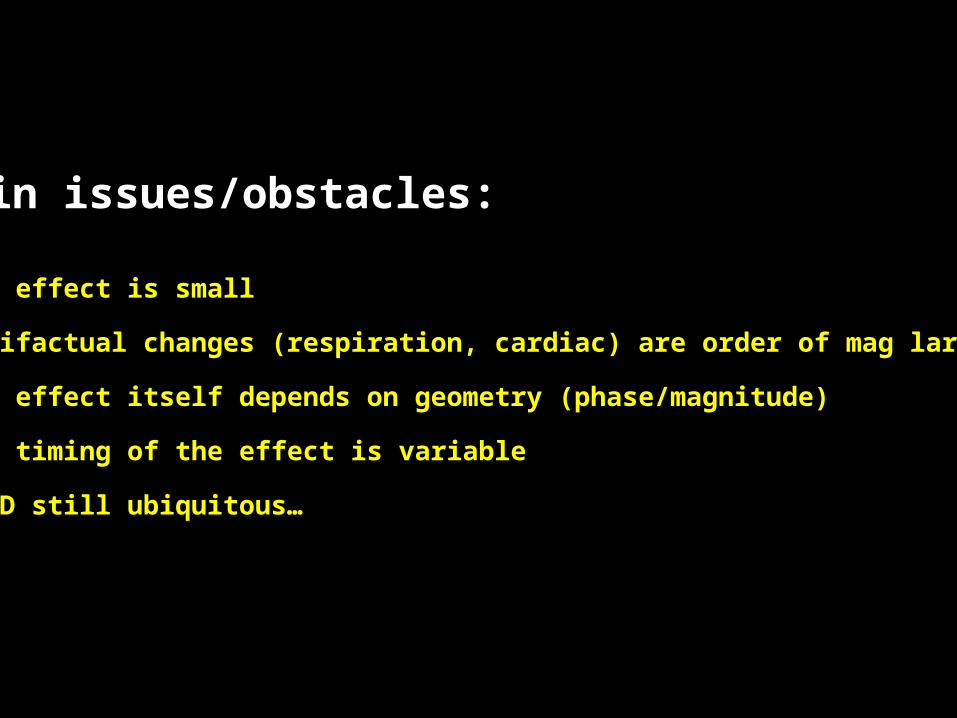
Main issues/obstacles:
•The effect is small
•Artifactual changes (respiration, cardiac) are order of mag larger
•The effect itself depends on geometry (phase/magnitude)
•The timing of the effect is variable
•BOLD still ubiquitous…

Human Respiration
00
400
200
BB0
TIME=110 s
=90o
BR10 nT
0.0 0.1 0.2 0.3 0.4 0.5
2x10³
frequency ( Hz )

Slice selection Spatial encoding
Slice selection Spatial encoding
GE
SE
900
900 1800
One strategy for removing low frequency changes…

Experiment (human respiration)
GEspoiled
Spectral images
T
R =
1.0
sec
GE SE
GETE=55ms
SETE=55ms
M
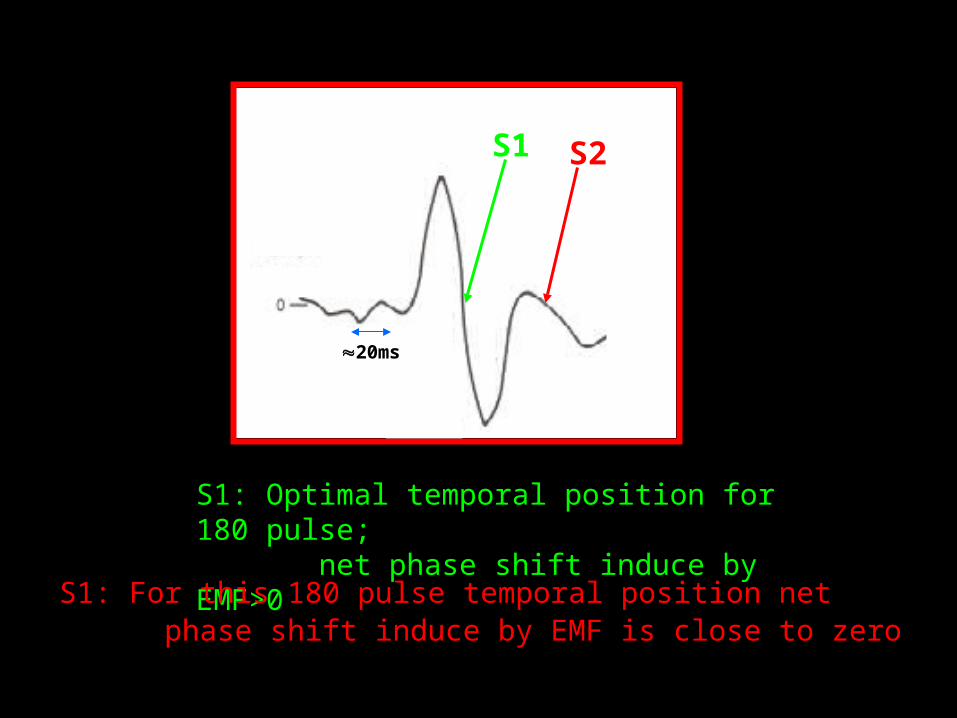
20ms
S1: Optimal temporal position for 180 pulse; net phase shift induce by EMF>0
S1 S2
S1: For this 180 pulse temporal position net phase shift induce by EMF is close to zero

M. Singh, Sensitivity of MR phase shift to detect evoked neuromagnetic fields inside the head.
IEEE Transactions on Nuclear Science. 41: 349-351, (1994).
The use of spin-echo to “tune” to transients..

What should we be detecting?
Phase or Magnitude?

Phase vs. Magnitude
∆ phase
∆ magnitude, ?∆ phase
? ∆ magnitude, ? ∆ phase

In Vitro Studies

in vitro model
Organotypic (no blood supply or hemoglobin traces) sections of newborn-rat somato-sensory Cortex, or somato-sensory Cortex & Basal Ganglia
• Size: in-plane:~1-2mm2, thickness: 60-100m• Neuronal Population: 10,000-100,000
• Spontaneous synchronized activity < 2Hz• Epileptiform activity• Spontaneous beta freq. activity (20-30Hz)• Network Activity Range: ~ 0.5-15V
Cortex
100 m
Plenz, D. et al. Neurosci 70(4): 861-924, 1996
Basal Ganglia


Multi-Electrode Array (MEA)EEG Recording
1 kHz sampling rate, 20 minutes 8x8 electrode configuration
Multi-Electrode Array EEG recording
~100ms Transient
Event

in vitro MR protocol
Imaging (3T) NMR (7T)
• Spin-Echo EchoPlanar Imaging • free induction decay (FID) acquisition
SE EPI image
FID
• voxel size: ~3x3x3 mm
• Sampling Rate :1 Hz (TR: 1sec)
• TE: 60 ms
• Readout :44 ms
• slab size: ~2x10x1mm
• Sampling Rate :10 Hz (TR: 100ms)
• TE : 30 ms
• Readout : 41 ms

Six Experiments
two conditions per experiment
in vitro MR experiment design
Active : 10 min (600 images) neuronal activity present
Inactive : 10 min (600 images) neuronal activity terminated via
TTX administration
Imaging (3T) NMR (7T)
Six Experiments
two conditions per experiment
Active : ~17 min (10,000 images) neuronal activity present
Inactive : ~17 min (10,000 images) neuronal activity terminated via
TTX administration
Pre- and Post- MR scan electrical recordings

7 Tesla data
Power decrease between PRE & TTX EEG : ~ 81%
Decrease between PRE & TTX MR phase: ~ 70%
Decrease between PRE & TTX MR magnitude: ~ 8%
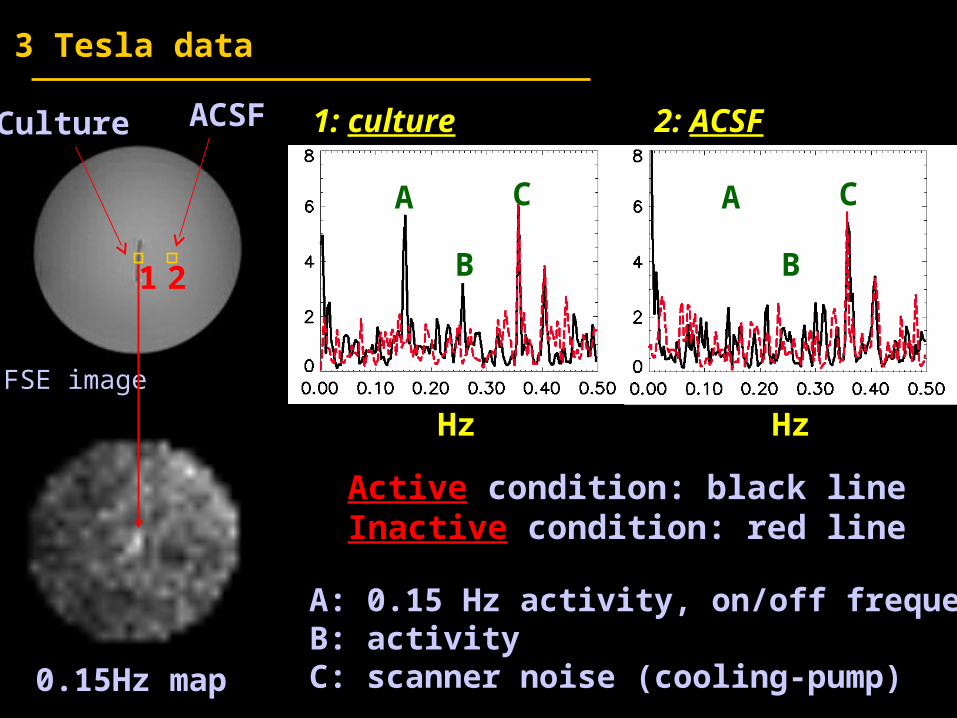
3 Tesla data
A: 0.15 Hz activity, on/off frequencyB: activityC: scanner noise (cooling-pump)
Active condition: black lineInactive condition: red line
A
B
C
1: culture
Hz
A
B
C
2: ACSF
Hz
1 2
ACSFCulture
0.15Hz map
FSE image
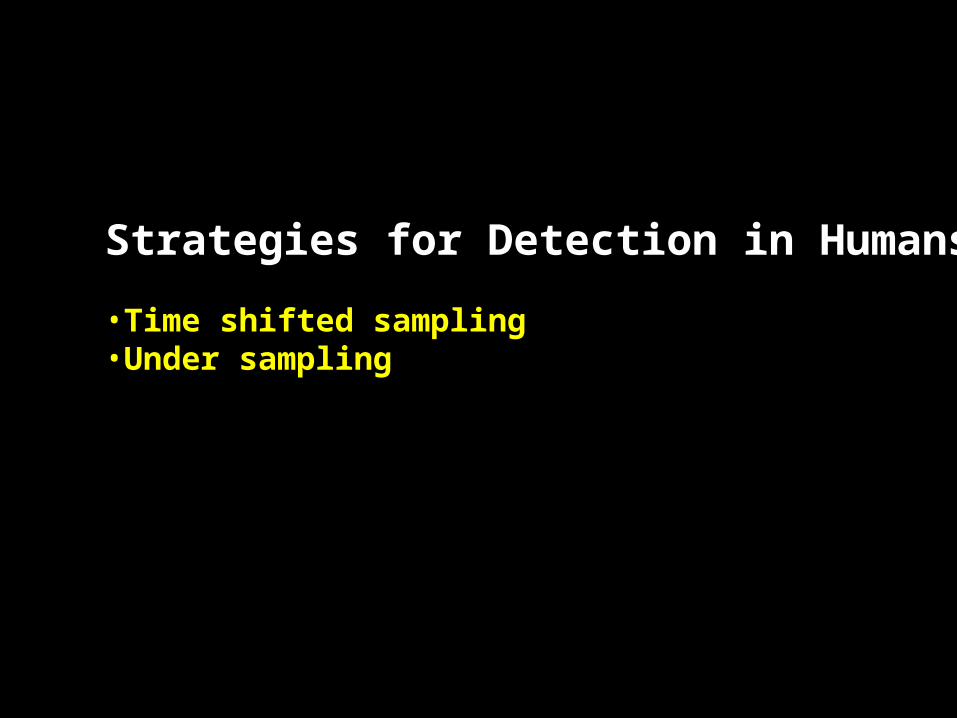
Strategies for Detection in Humans
•Time shifted sampling•Under sampling
Time shifted sampling
M. Singh, Sensitivity of MR phase shift to detect evoked neuromagnetic fields inside the head.IEEE Transactions on Nuclear Science. 41: 349-351, (1994).

J. Xiong, P. T. Fox, J.-H. Gao, Direct MRI Mapping of neuronal activity. Human Brain Mapping, 20: 41-49, (2003)

J. Xiong, P. T. Fox, J.-H. Gao, Direct MRI Mapping of neuronal activity. Human Brain Mapping, 20: 41-49, (2003)

R. Chu, J. A. de Zwart, P. van Gelderen, M. Fukunaga, P. Kellman, T. Hollroyd, J. Duyn. Hunting for neuonal currents: absence of rapid MRI signal changes during visual evoked response. NeuroImage, (in press).

Photodiode
MEG
8 Hz alternating checkerboard
Undersampling

TR
Alternating Checkerboard Frequency
Undersampling

Comparison of phase and magnitude of the MR signal in measuring neuronal activity [for Petes’ sake1,2]
James M. Kilner, Klaas E. Stephan, Oliver Josephs, Karl J. Friston
Wellcome Department of Imaging Neuroscience, 12 Queen Square, London
BOLD
Phase
Mag
0.5 Hz 0.5 Hz
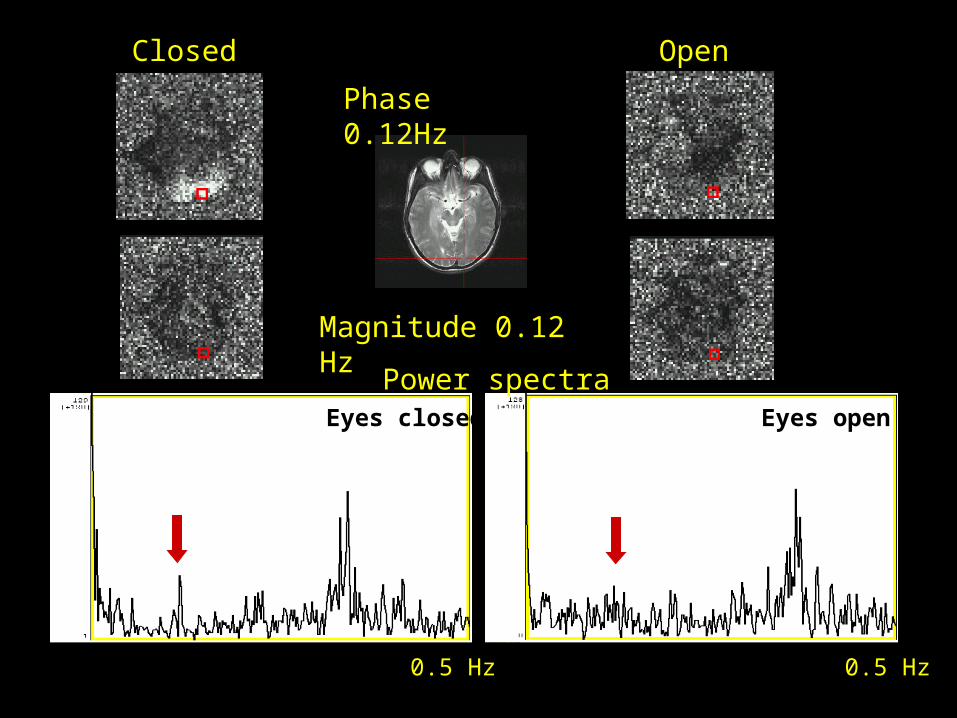
Power spectraEyes closed Eyes open
Phase 0.12Hz
Closed Open
Magnitude 0.12 Hz

The principle and application of the Lorentz Effect Imaging
Song et al ISMRM 2000, p. 54
Other Methods??

iF
F
B
Lorentz Force

iF
F
B
Lorentz Force
-G G

Bo
1 k0.1 – 0.5 V
MRI Scanner Trigger Pulse
Experimental Setup: Phantom Study
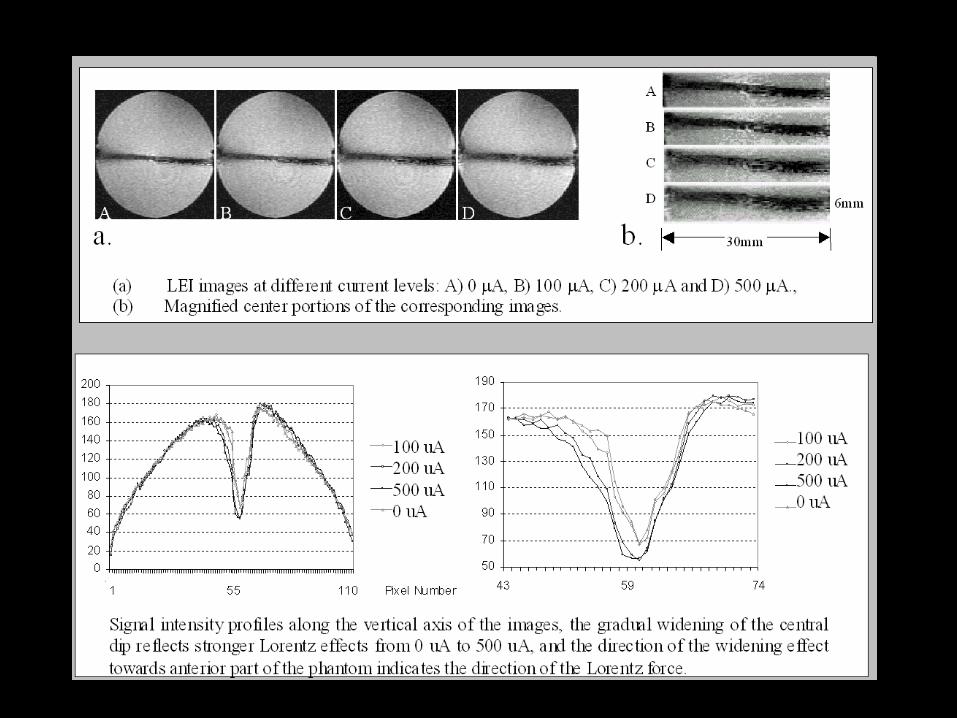
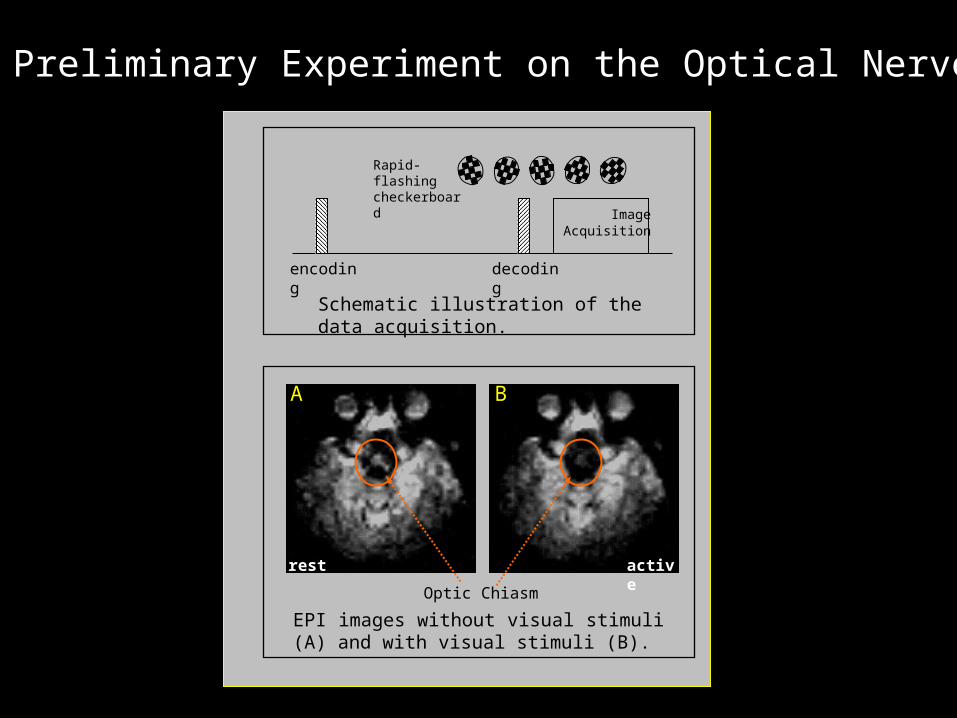
Image Acquisition
Schematic illustration of the data acquisition.
encoding decoding
Rapid-flashing checkerboard
Optic Chiasm
EPI images without visual stimuli (A) and with visual stimuli (B).
rest active
A B
Preliminary Experiment on the Optical Nerve
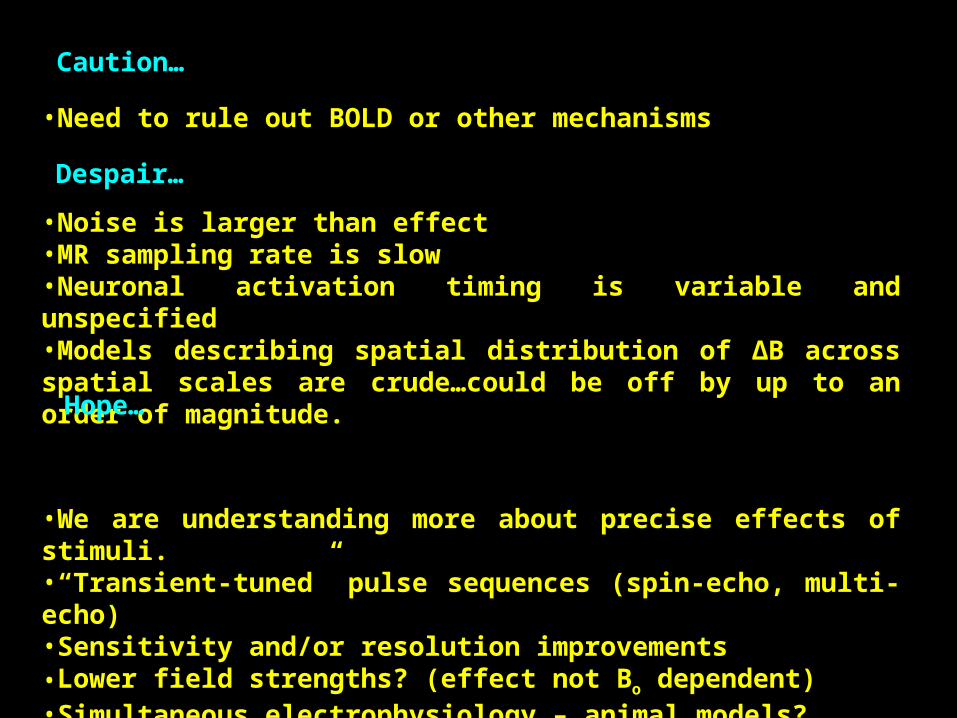
•Need to rule out BOLD or other mechanisms
•Noise is larger than effect•MR sampling rate is slow•Neuronal activation timing is variable and unspecified•Models describing spatial distribution of ∆B across spatial scales are crude…could be off by up to an order of magnitude.
•We are understanding more about precise effects of stimuli.•“Transient-tuned” pulse sequences (spin-echo, multi-echo)•Sensitivity and/or resolution improvements•Lower field strengths? (effect not Bo dependent)•Simultaneous electrophysiology – animal models?•Synchronization improvements.•Again..models describing spatial distribution of ∆B across spatial scales are crude…could be off by up to an order of magnitude.
Caution…
Despair…
Hope…

EEG re-sampled using:TR: 1sec
TE: 60ms (spin-echo) Readout :44ms
Field calculations withvoxel volume: 27mm3
Bo : 3T
EEG re-sampled using:TR: 100msTE:30ms
Readout : 41ms(entire FID)
Field calculations with voxel volume: 20mm3
Bo : 7T
MR Simulations based on EEG
dB= Bneuronal(from EEG) dVdt; t:82ms, V=27mm3
ΔB
(n
Tes
la)
ΔB
(n
Tes
la)
dB= Bneuronal(from EEG) dVdt; t:71ms, V=20mm3
Assuming 100,000 neurons * 1.5nA per neuron

Simulated MR spectrumcalculated using sliding window FFT. Simulation based on previously shown electrical recording data

dB= µo It (neuronal from EEG) V / 2 π D dV dt ; t: (TE+Readout) ms, V=(voxel volume)mm3
Where:
V=sqrt(x2+y2+z2), where x,y,z are the voxel dimensionsD= the diameter of the culture (0.5 mm)µo= magnetic permeability of free spaceIt = the current produced from the neuronal network at a given point in time, t this is calculated from the EEG as follows: maximum current possible for the given culture (here 100,000 neurons * 1.5nA per neuron - reference: Nicholls JG, Martin AR, Wallace BG. From Neuron to Brain.
3rd ed. Sinauer, 1992.) multiplied by the following weighting function ( normalized EEG): resulting fields are consistent with those expected
(checked with Dietmar and literature – will give you ref. papers)