Embed Size (px)
Citation preview
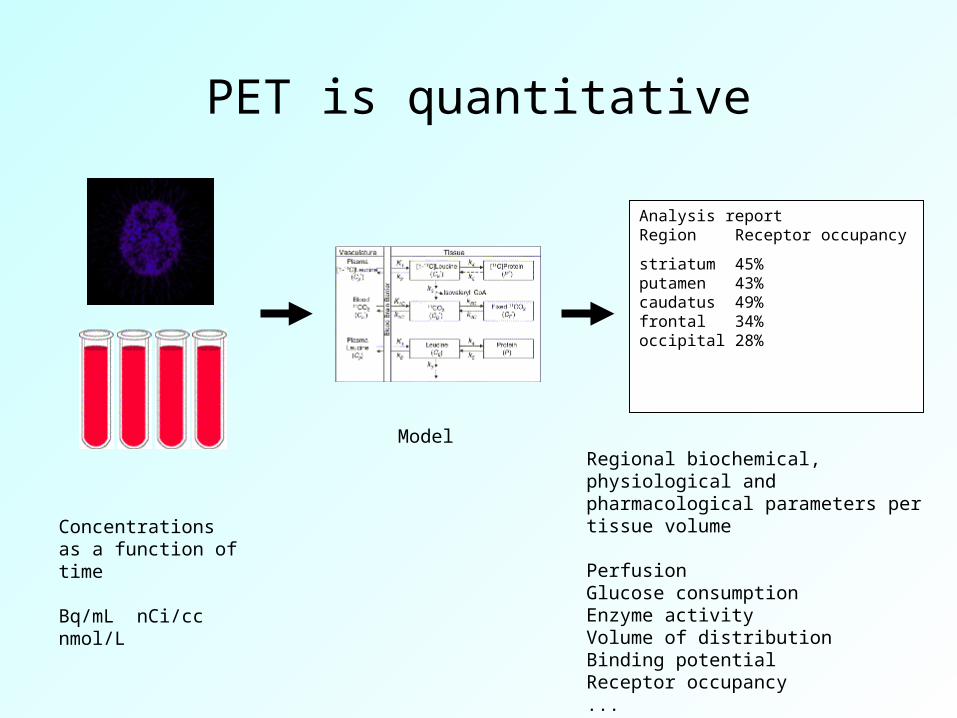
PET is quantitative
Concentrationsas a function of time
Bq/mL nCi/ccnmol/L
Model
Analysis reportRegion Receptor occupancy
striatum 45%putamen 43%caudatus 49%frontal 34%occipital 28%
Regional biochemical, physiological and pharmacological parameters per tissue volume
PerfusionGlucose consumptionEnzyme activityVolume of distributionBinding potentialReceptor occupancy...

Modeling for PET
Tracer selection
Comprehensive model
Workable model
Model validation
Model application
Huang & Phelps 1986
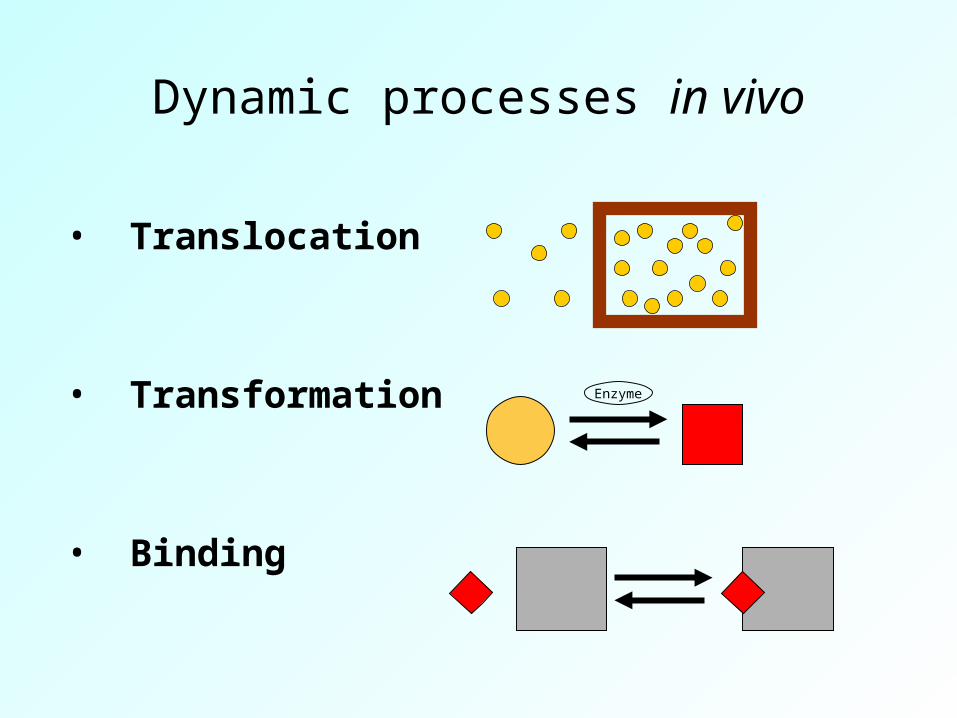
Dynamic processes in vivo
• Translocation
• Transformation
• Binding
Enzyme
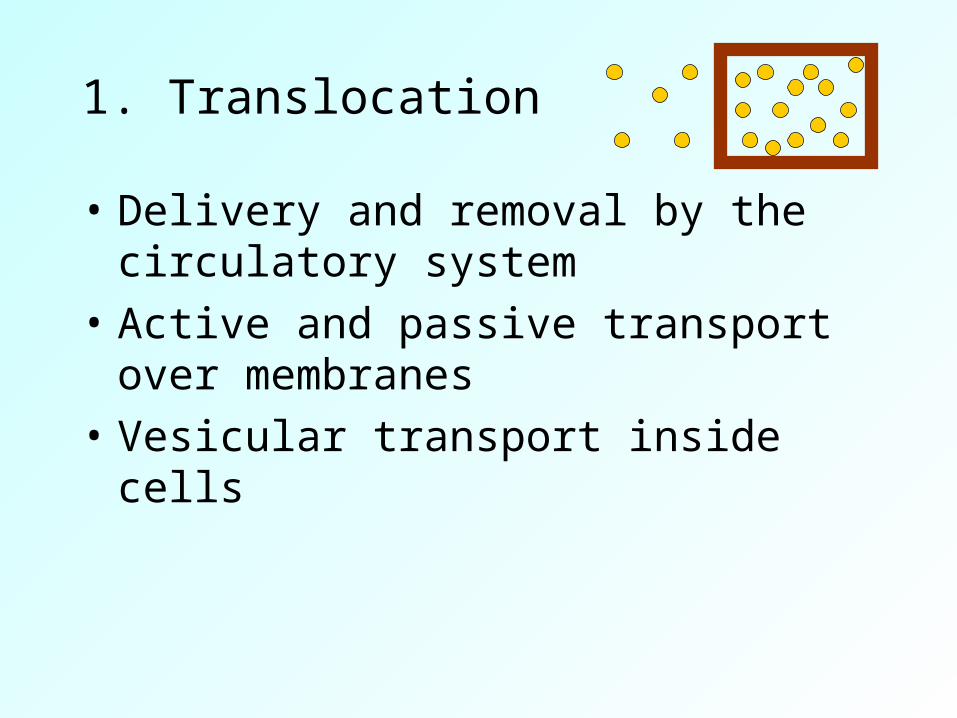
1. Translocation
• Delivery and removal by the circulatory system
• Active and passive transport over membranes
• Vesicular transport inside cells
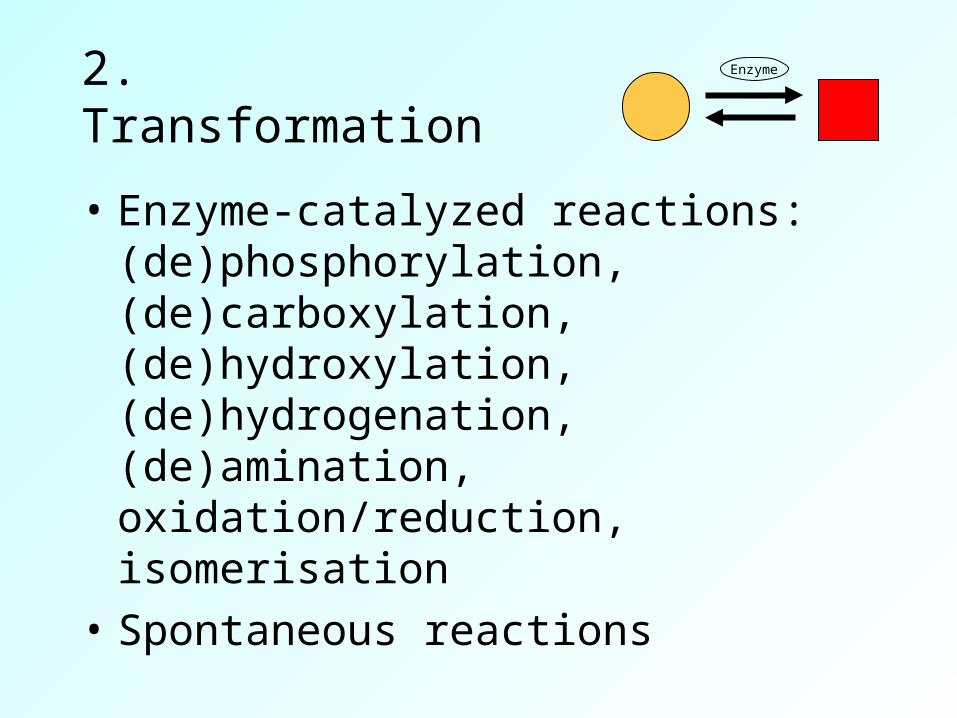
2. Transformation
• Enzyme-catalyzed reactions: (de)phosphorylation, (de)carboxylation, (de)hydroxylation, (de)hydrogenation, (de)amination, oxidation/reduction, isomerisation
• Spontaneous reactions
Enzyme
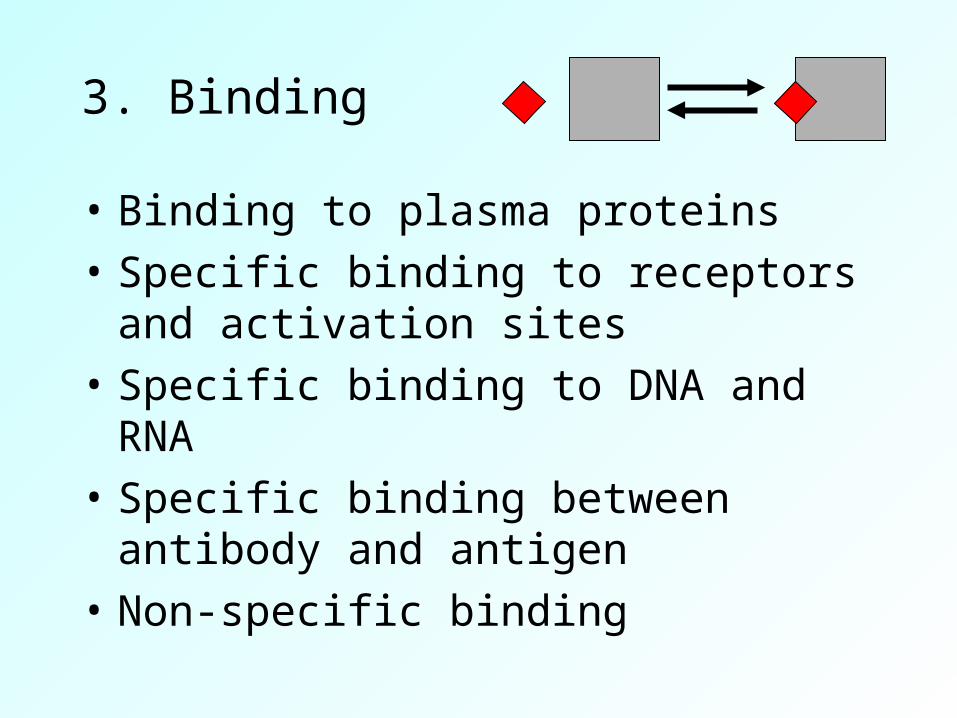
3. Binding
• Binding to plasma proteins• Specific binding to receptors and
activation sites• Specific binding to DNA and RNA• Specific binding between antibody
and antigen• Non-specific binding
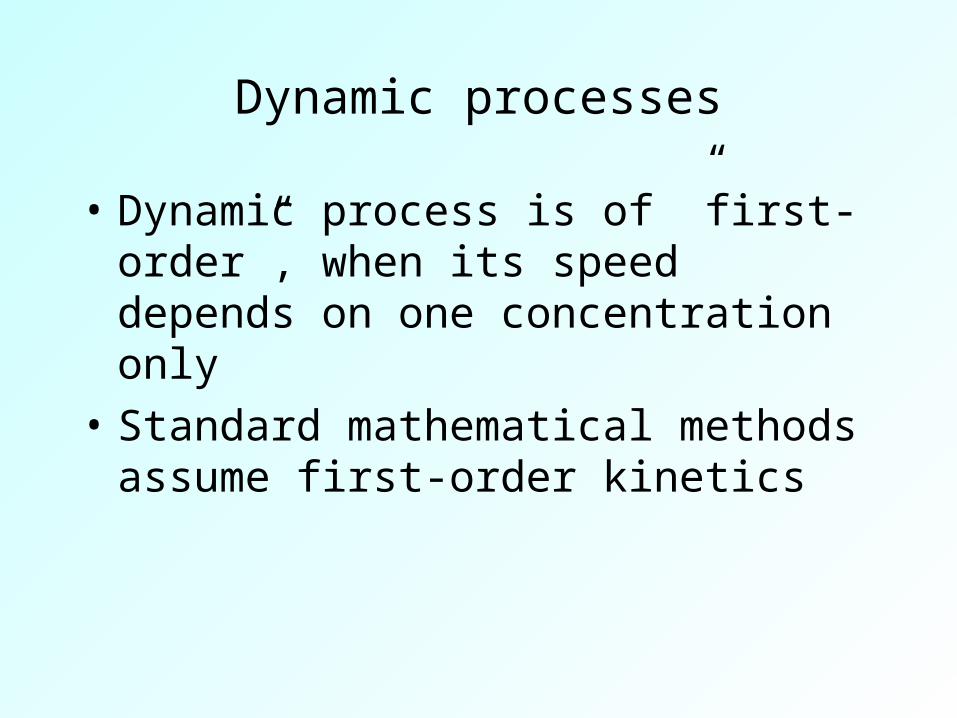
Dynamic processes
• Dynamic process is of ”first-order”, when its speed depends on one concentration only
• Standard mathematical methods assume first-order kinetics
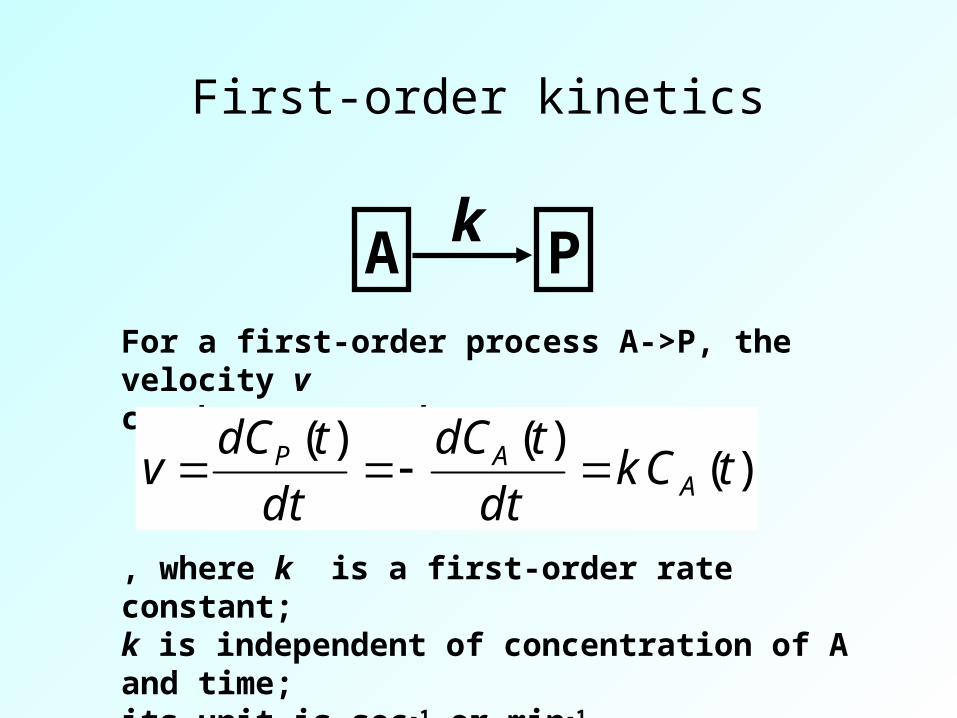
First-order kinetics
A Pk
For a first-order process A->P, the velocity vcan be expressed as
)()()(
tCkdt
tdC
dt
tdCv A
AP
, where k is a first-order rate constant;k is independent of concentration of A and time;its unit is sec-1 or min-1.
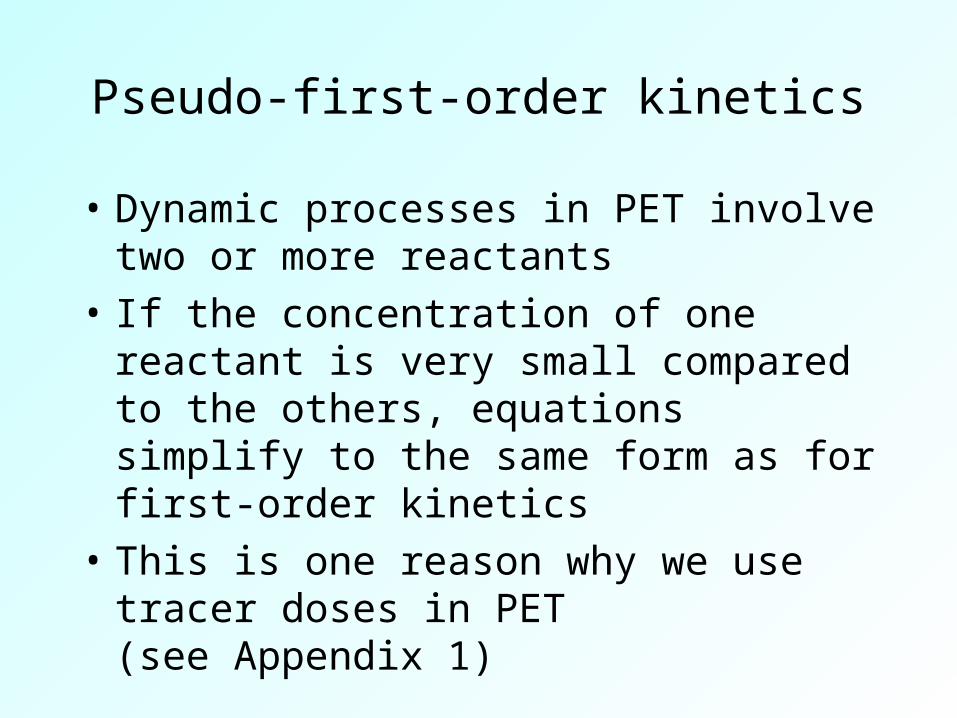
Pseudo-first-order kinetics
• Dynamic processes in PET involve two or more reactants
• If the concentration of one reactant is very small compared to the others, equations simplify to the same form as for first-order kinetics
• This is one reason why we use tracer doses in PET(see Appendix 1)
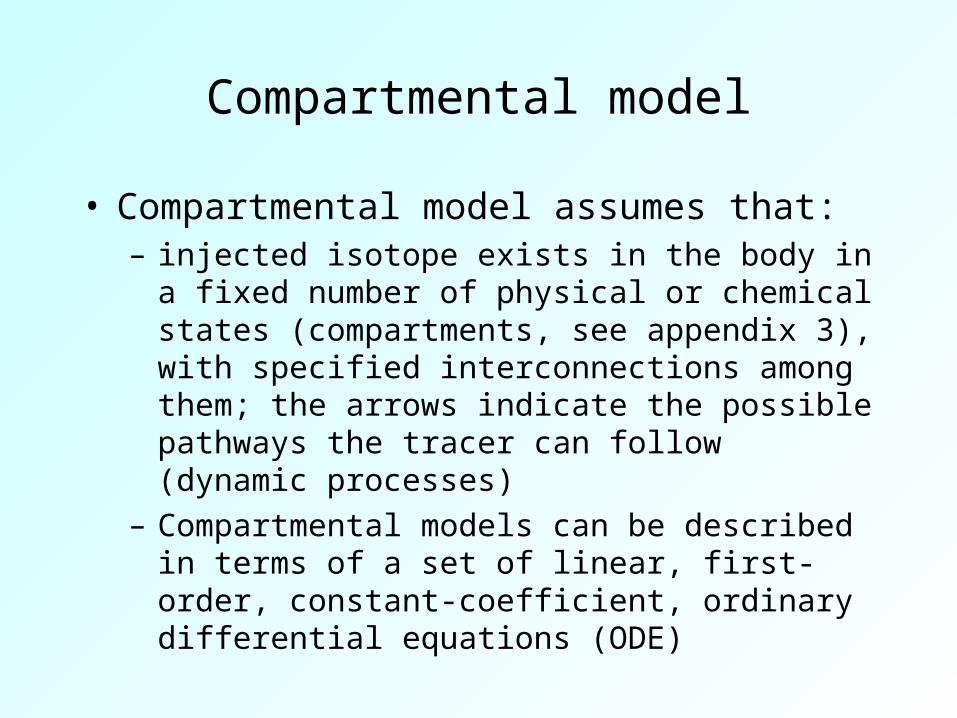
Compartmental model
• Compartmental model assumes that:– injected isotope exists in the body in a fixed
number of physical or chemical states (compartments, see appendix 3),with specified interconnections among them; the arrows indicate the possible pathways the tracer can follow (dynamic processes)
– Compartmental models can be described in terms of a set of linear, first-order, constant-coefficient, ordinary differential equations (ODE)
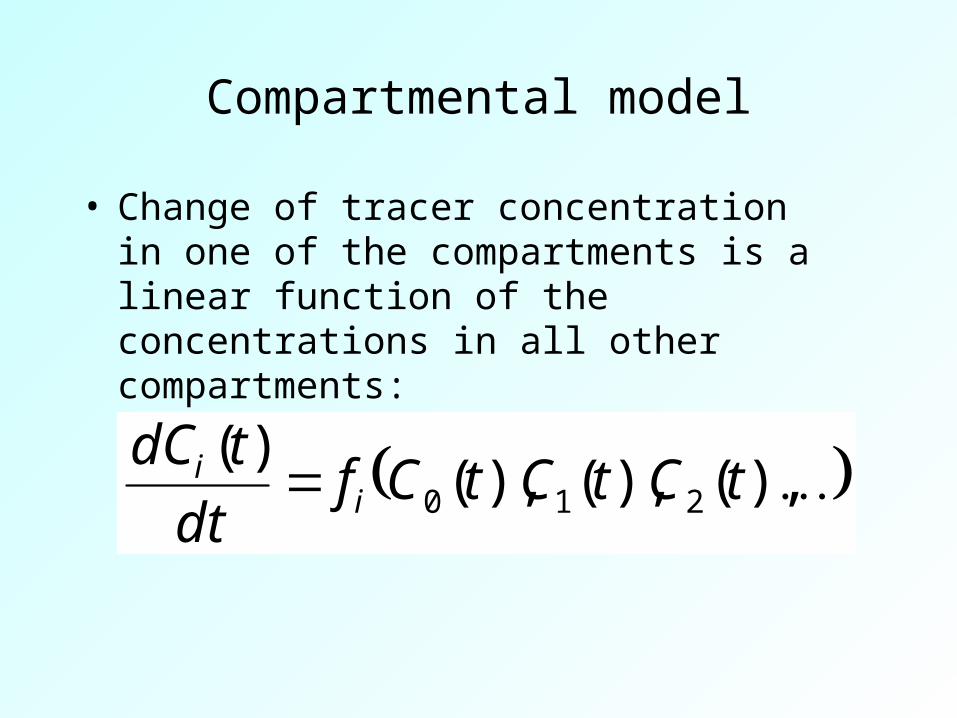
Compartmental model
• Change of tracer concentration in one of the compartments is a linear function of the concentrations in all other compartments:
),(),(),()(
210 tCtCtCfdt
tdCi
i
Compartmental model
• By convention, in the nuclear medicine literature, the first compartment is the blood or plasma pool
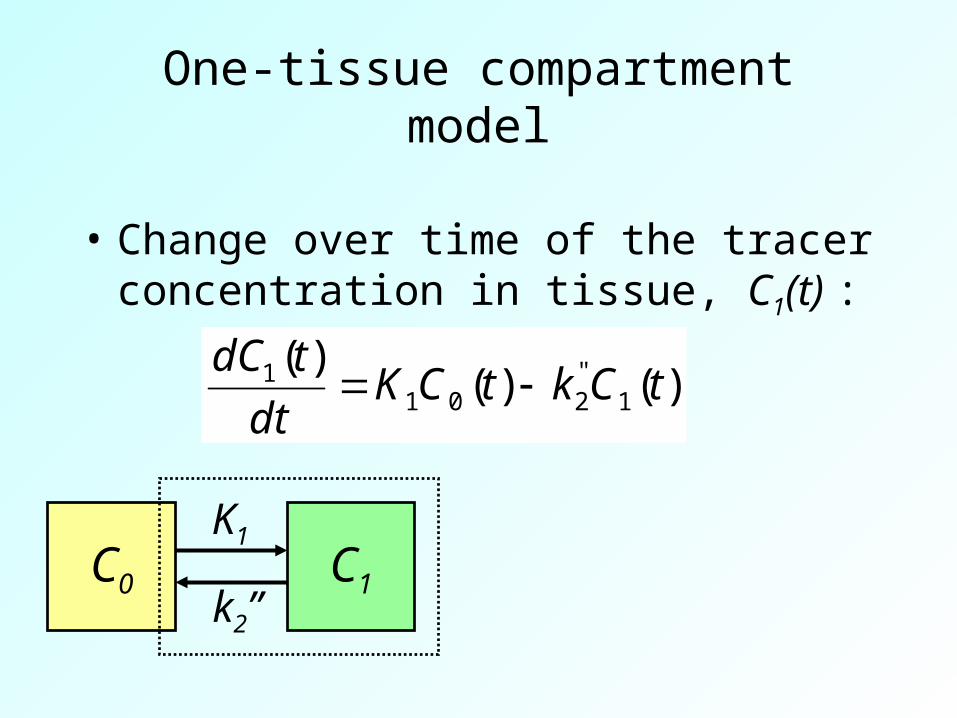
One-tissue compartment model
• Change over time of the tracer concentration in tissue, C1(t) :
)()()(
1"201
1 tCktCKdt
tdC
C0 C1
K1
k2”
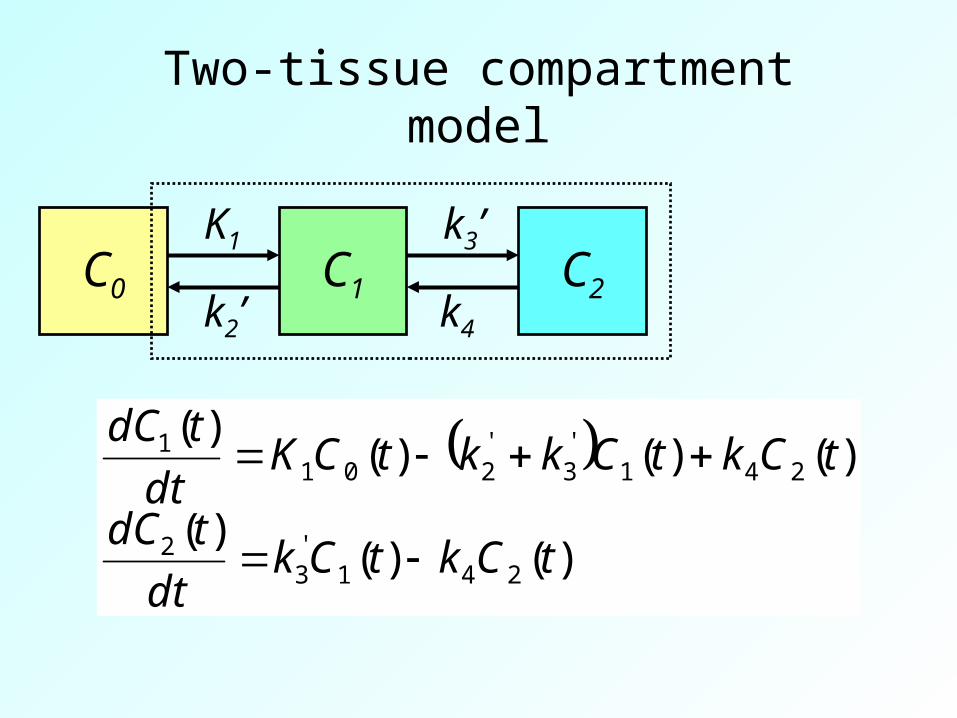
Two-tissue compartment model
C0 C1 C2
K1
k2’
k3’
k4
)()(
)(
)()()()(
241'3
2
241'3
'201
1
tCktCkdt
tdC
tCktCkktCKdt
tdC
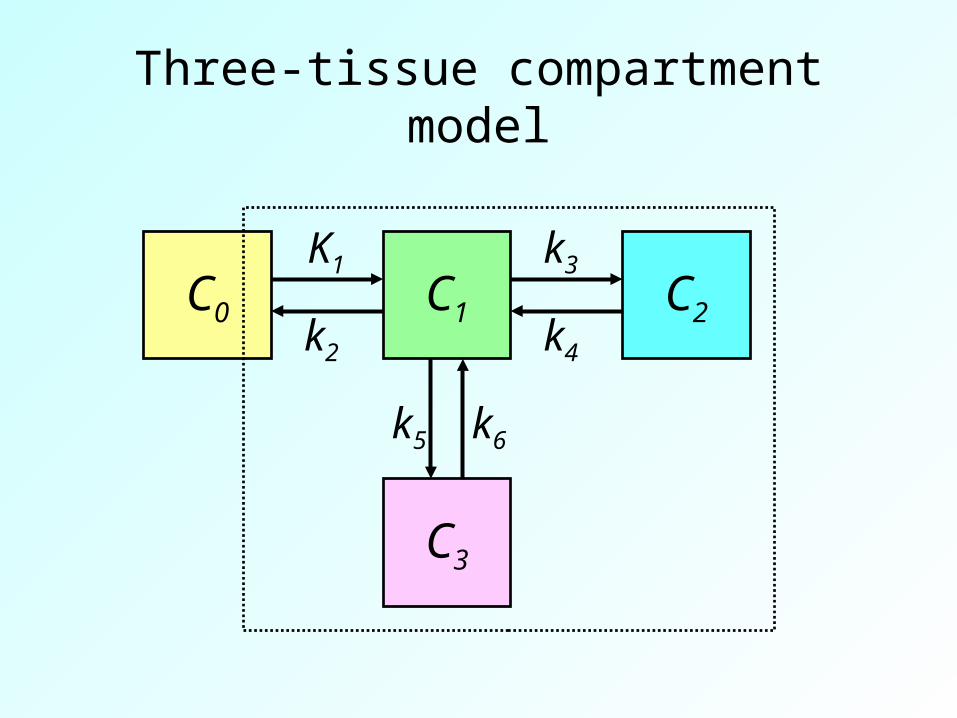
Three-tissue compartment model
C0 C1 C2
C3
K1
k2
k3
k4
k5 k6
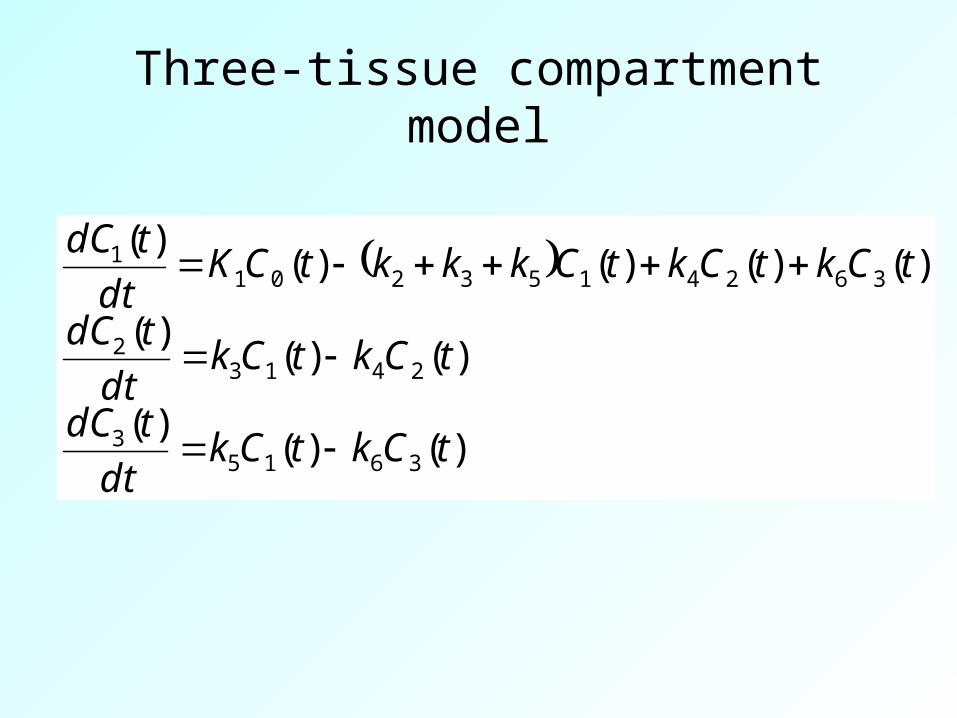
Three-tissue compartment model
)()()(
)()()(
)()()()()(
36153
24132
36241532011
tCktCkdt
tdC
tCktCkdt
tdC
tCktCktCkkktCKdt
tdC
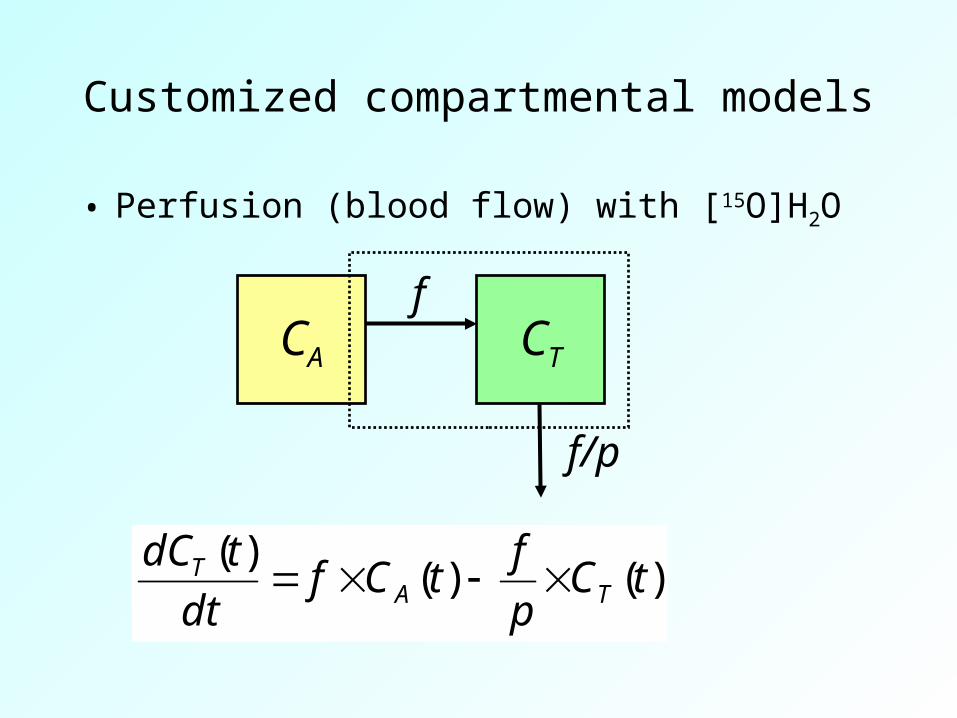
Customized compartmental models
• Perfusion (blood flow) with [15O]H2O
CA CT
f
f/p
)()()(
tCp
ftCf
dt
tdCTA
T
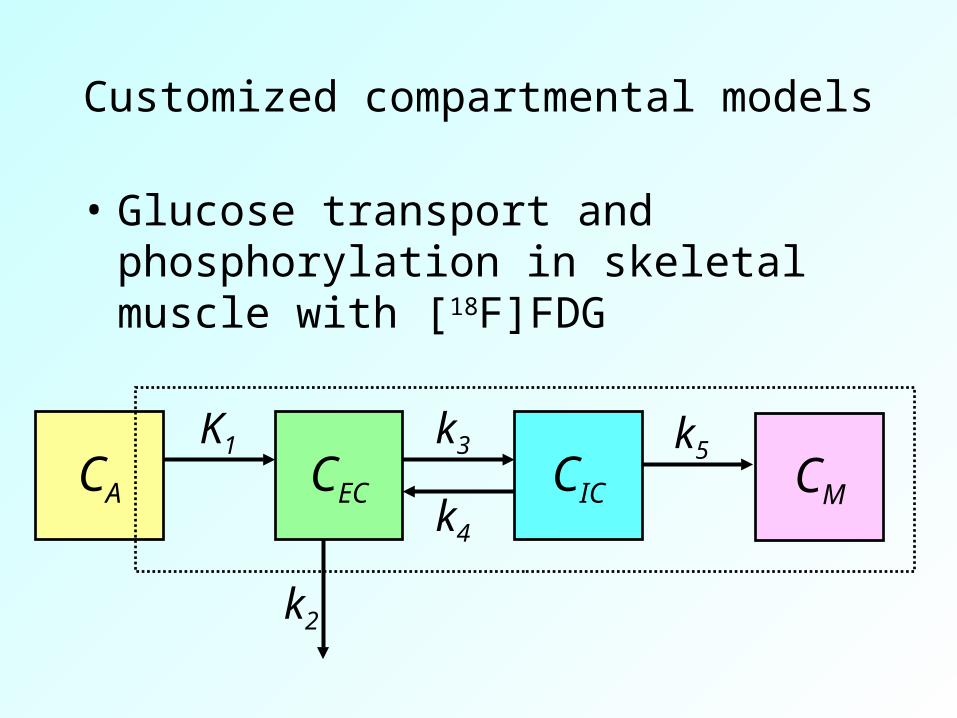
Customized compartmental models
• Glucose transport and phosphorylation in skeletal muscle with [18F]FDG
CA CEC CIC CM
K1 k3
k4
k2
k5
CAH2O
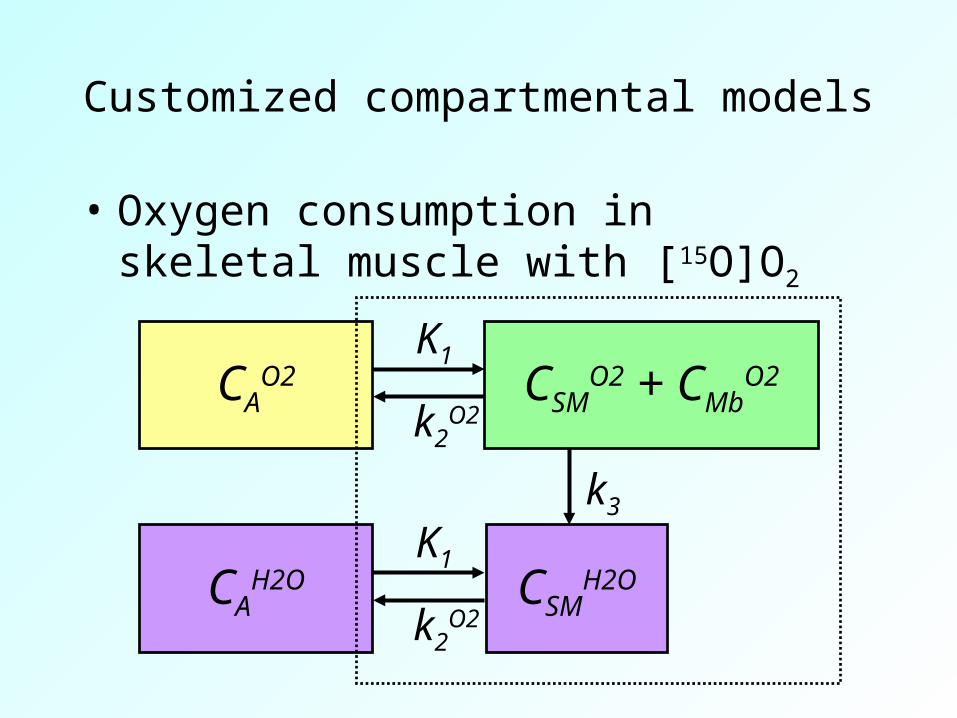
Customized compartmental models
• Oxygen consumption in skeletal muscle with [15O]O2
CAO2 CSM
O2 + CMbO2
K1
k3
k2O2
CSMH2O
K1
k2O2
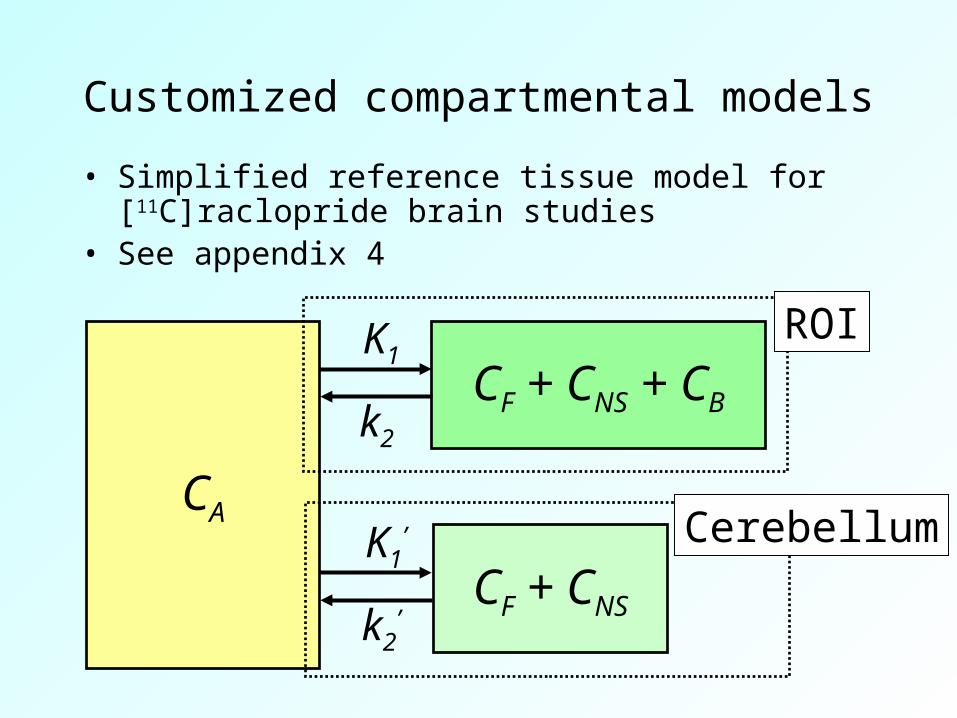
Customized compartmental models
• Simplified reference tissue model for [11C]raclopride brain studies
• See appendix 4
CA
CF + CNS + CB
K1
k2
CF + CNS
K1’
k2’
Cerebellum
ROI
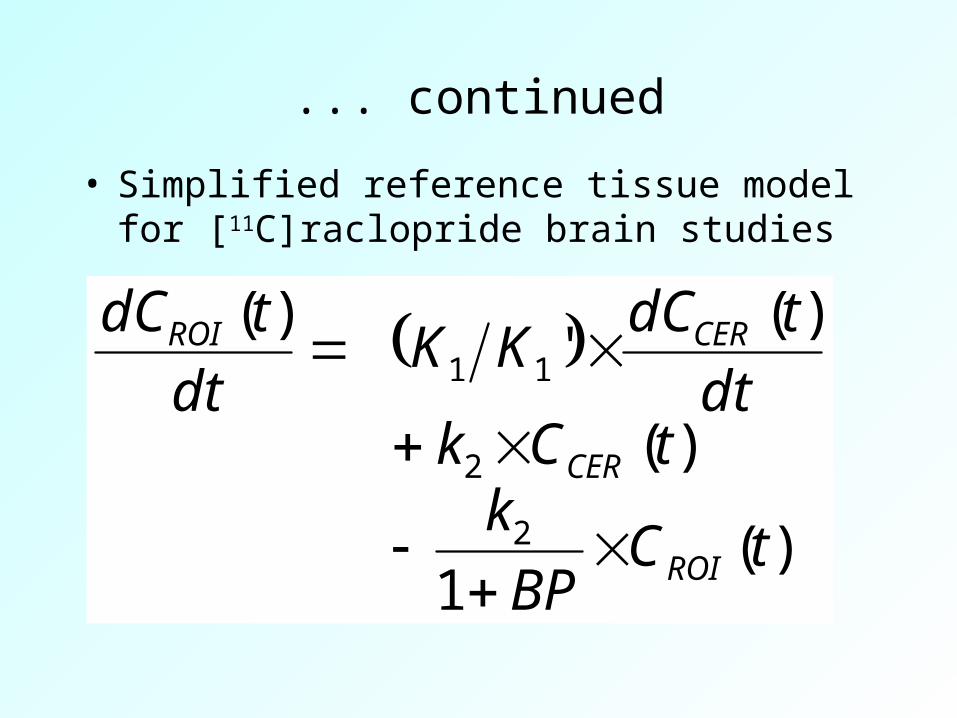
... continued
)(1
)(
)('
)(
2
2
11
tCBP
ktCk
dt
tdCKK
dt
tdC
ROI
CER
CERROI
• Simplified reference tissue model for [11C]raclopride brain studies
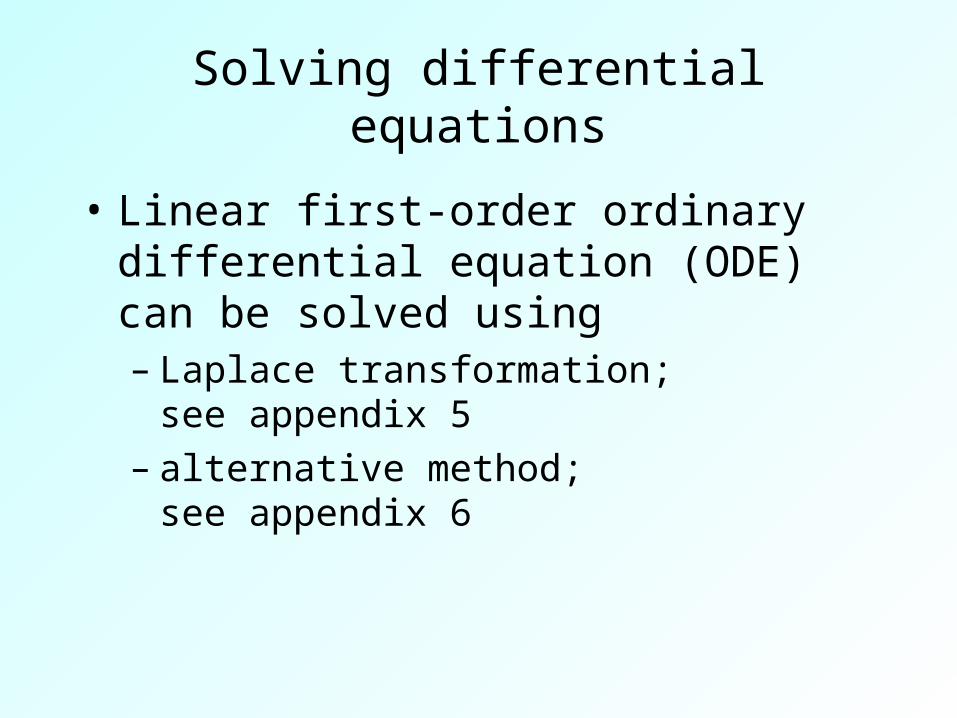
Solving differential equations
• Linear first-order ordinary differential equation (ODE) can be solved using– Laplace transformation;
see appendix 5– alternative method;
see appendix 6
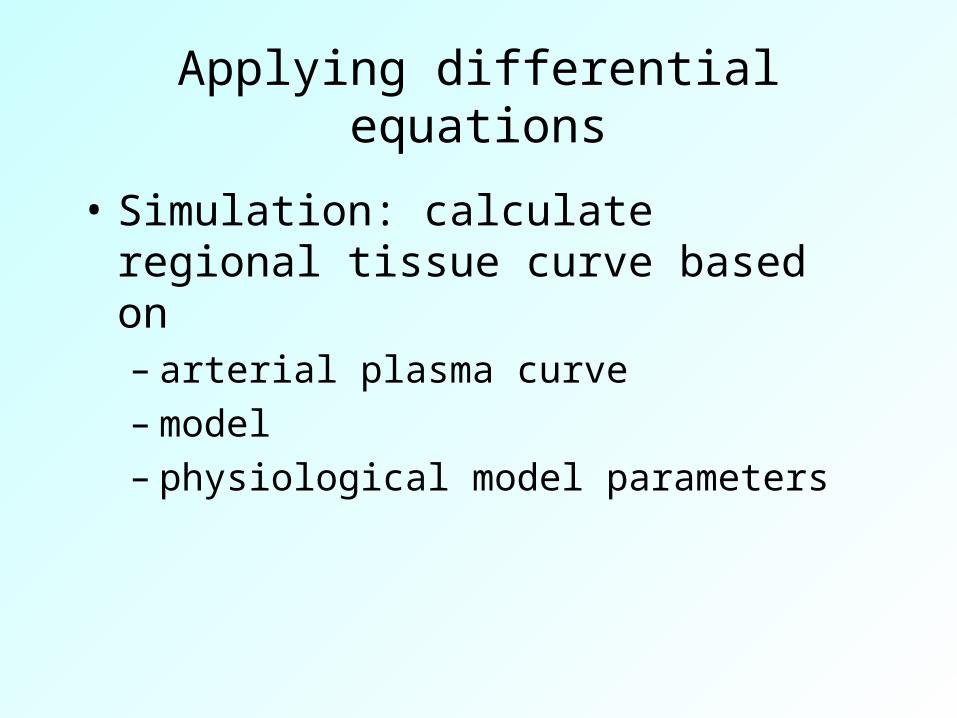
Applying differential equations
• Simulation: calculate regional tissue curve based on– arterial plasma curve– model– physiological model parameters
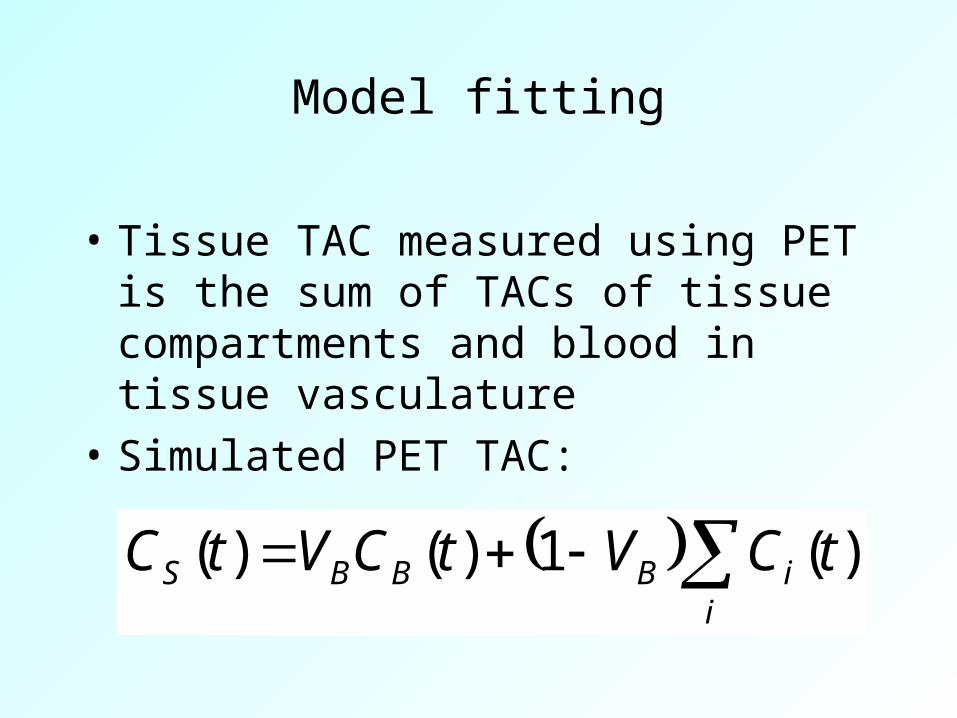
Model fitting
• Tissue TAC measured using PET is the sum of TACs of tissue compartments and blood in tissue vasculature
• Simulated PET TAC:
i
iBBBS tCVtCVtC )(1)()(
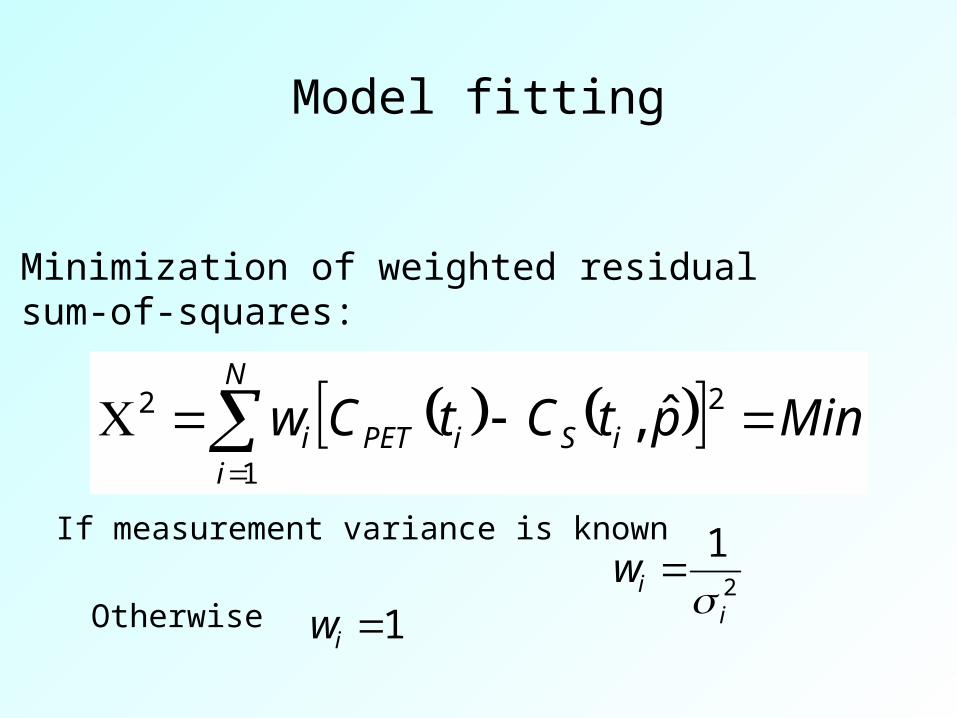
Model fitting
MinptCtCwN
iiSiPETi
1
22 ˆ,
Minimization of weighted residualsum-of-squares:
Otherwise
If measurement variance is known
2
1
iiw
1iw
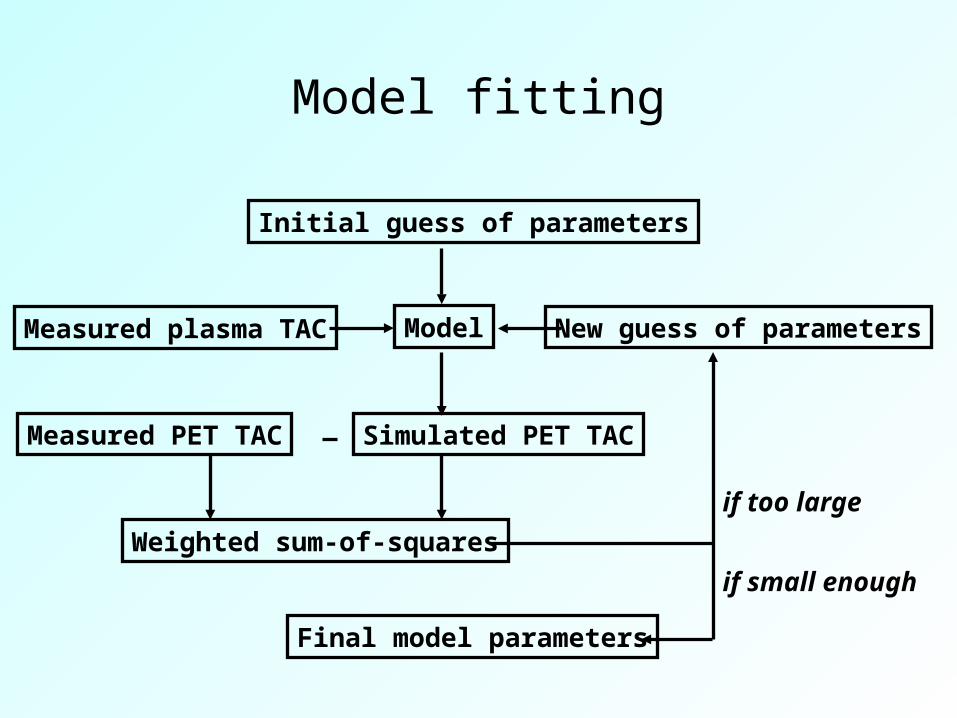
Model fitting
Initial guess of parameters
Simulated PET TACMeasured PET TAC
Measured plasma TAC
Weighted sum-of-squares
Final model parameters
New guess of parametersModel
if too large
if small enough
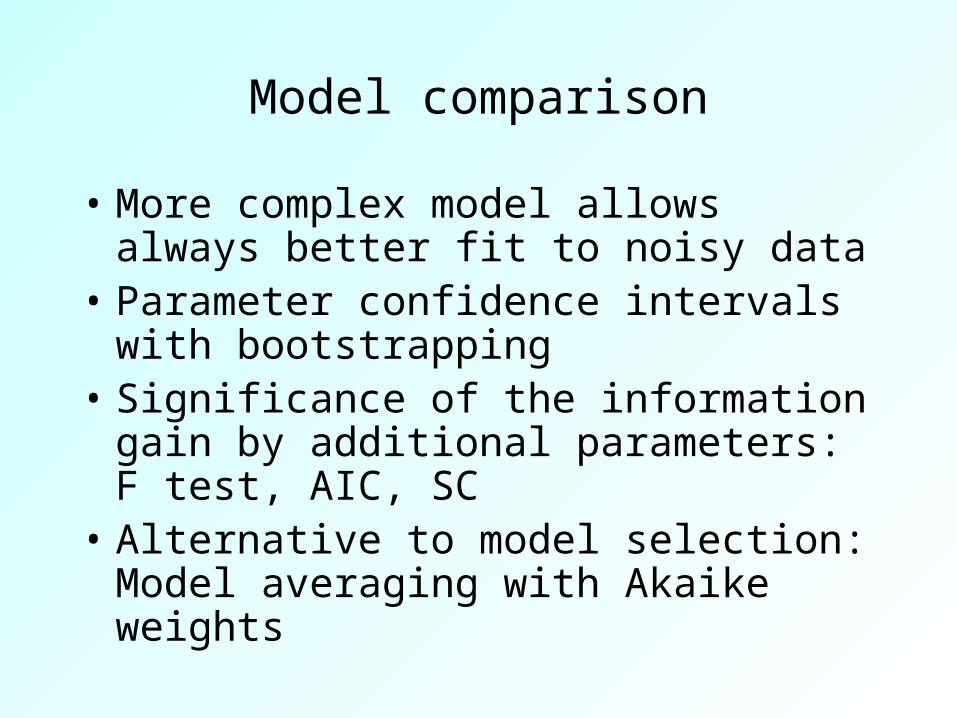
Model comparison
• More complex model allows always better fit to noisy data
• Parameter confidence intervals with bootstrapping
• Significance of the information gain by additional parameters: F test, AIC, SC
• Alternative to model selection: Model averaging with Akaike weights
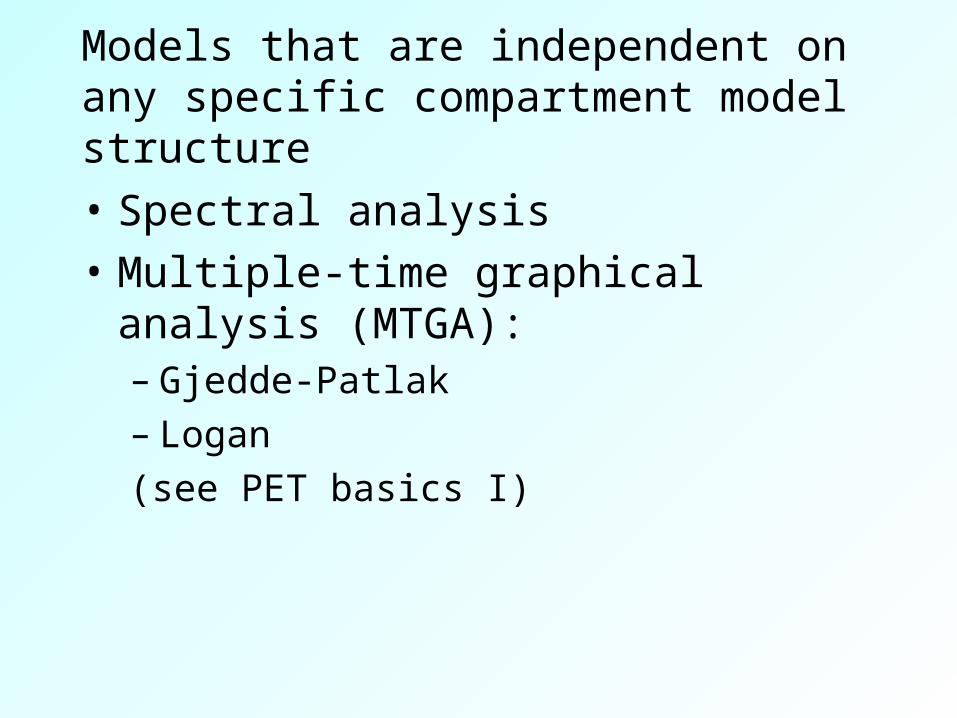
Models that are independent on any specific compartment model structure• Spectral analysis• Multiple-time graphical analysis
(MTGA):– Gjedde-Patlak– Logan(see PET basics I)
Distributed models
• Distributed models are generally accepted to correspond more closely to physiological reality than simpler compartment models
• In PET imaging, compartment models have been shown to provide estimates of receptor concentration that are as good as those of a distributed model, and are assumed to be adequate for analysis of PET imaging data in general (Muzic & Saidel, 2003).
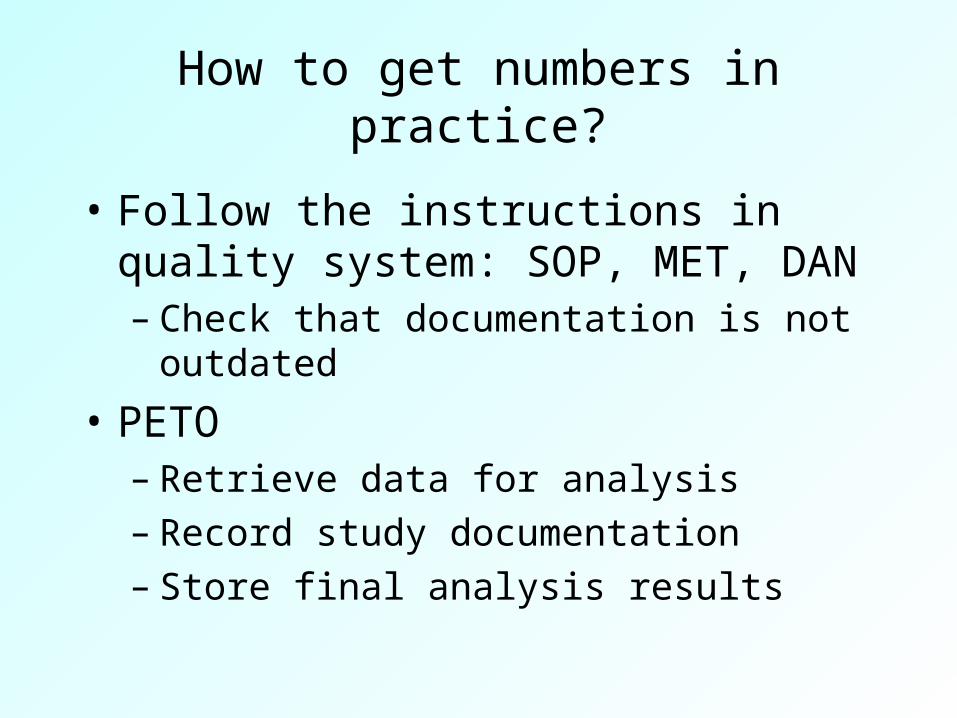
How to get numbers in practice?
• Follow the instructions in quality system: SOP, MET, DAN– Check that documentation is not
outdated
• PETO– Retrieve data for analysis– Record study documentation– Store final analysis results
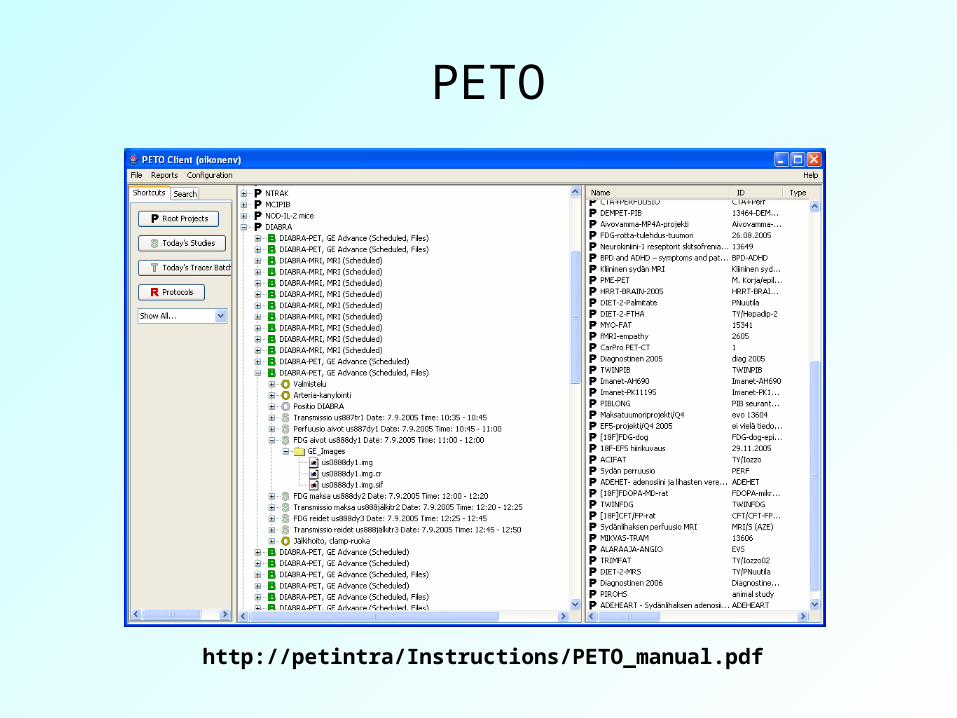
PETO
http://petintra/Instructions/PETO_manual.pdf
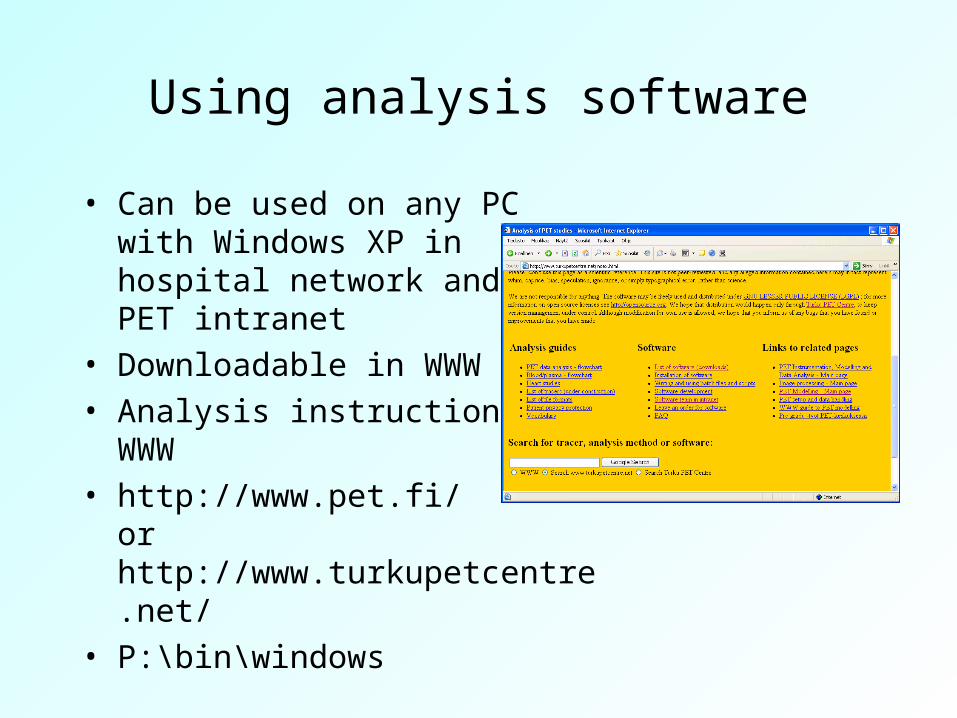
Using analysis software
• Can be used on any PCwith Windows XP inhospital network and/orPET intranet
• Downloadable in WWW• Analysis instructions in
WWW• http://www.pet.fi/
or http://www.turkupetcentre.net/
• P:\bin\windows
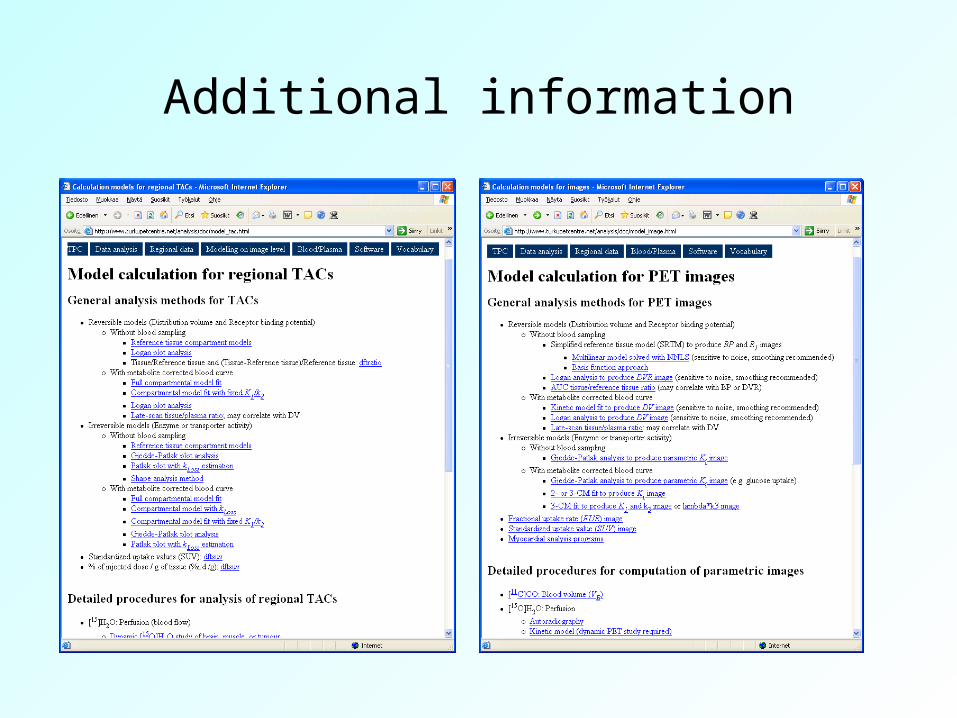
Additional information
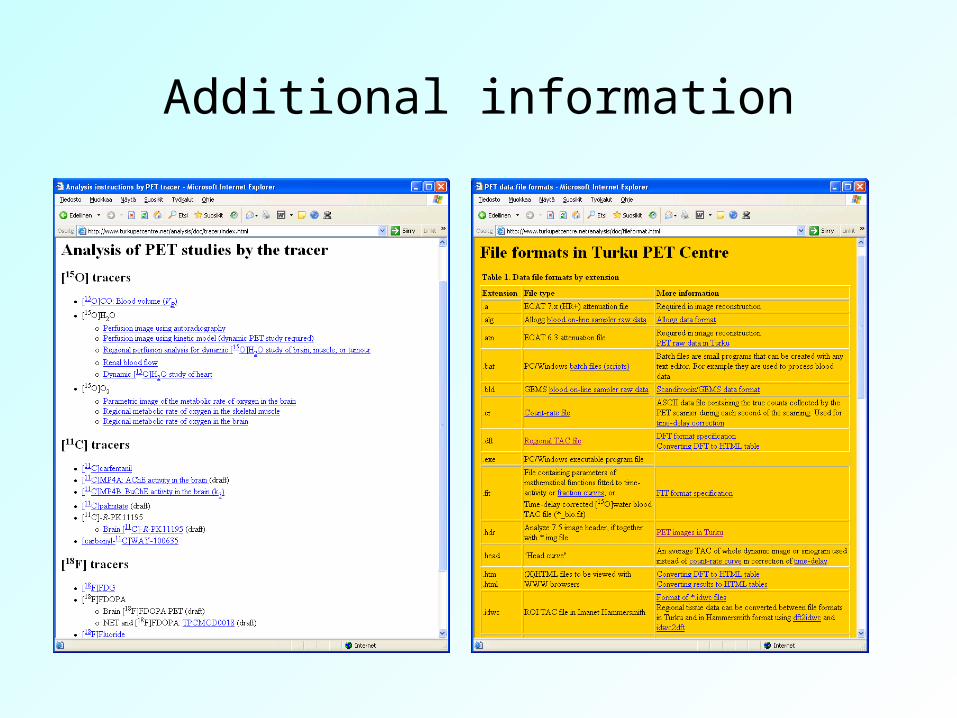
Additional information
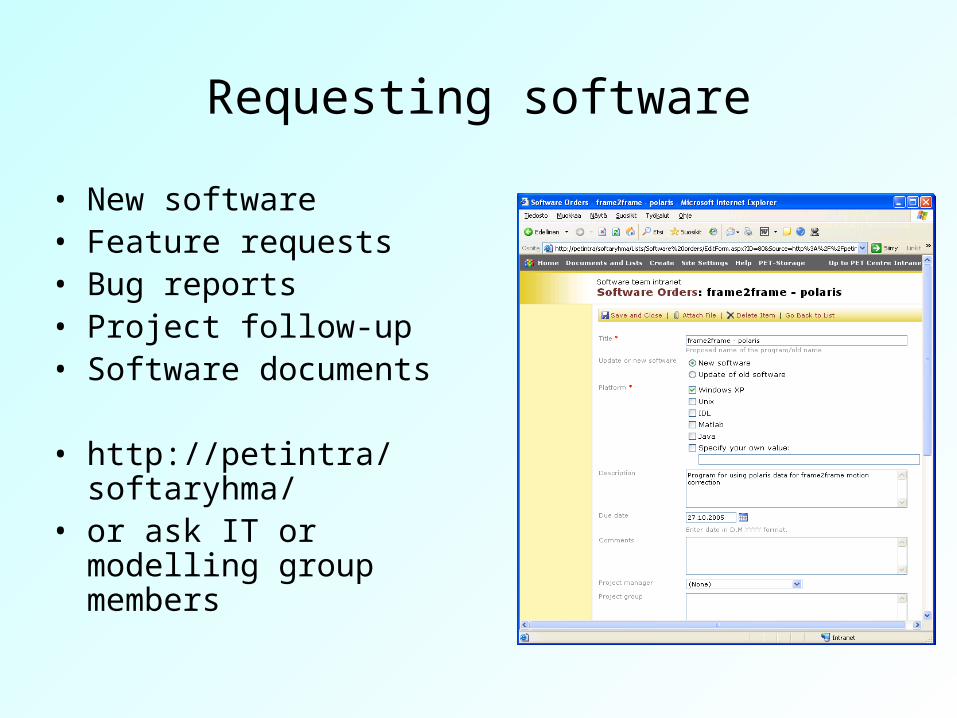
Requesting software
• New software• Feature requests• Bug reports• Project follow-up• Software documents
• http://petintra/softaryhma/
• or ask IT or modelling group members
More reading
• Budinger TF, Huesman RH, Knittel B, Friedland RP, Derenzo SE (1985): Physiological modeling of dynamic measurements of metabolism using positron emission tomography. In: The Metabolism of the Human Brain Studied with Positron Emission Tomography. (Eds: Greitz T et al.) Raven Press, New York, 165-183.
• Cunningham VJ, Rabiner EA, Matthews JC, Gunn RN, Zamuner S, Gee AD. Kinetic analysis of neuroreceptor binding using PET. Int Congress Series 2004; 1265: 12-24.
• van den Hoff J. Principles of quantitative positron emission tomography. Amino Acids 2005; 29(4): 341-353.
• Huang SC, Phelps ME (1986): Principles of tracer kinetic modeling in positron emission tomography and autoradiography. In: Positron Emission Tomography and Autoradiography: Principles and Applications for the Brain and Heart. (Eds: Phelps,M; Mazziotta,J; Schelbert,H) Raven Press, New York, 287-346.
• Ichise M, Meyer JH, Yonekura Y. An introduction to PET and SPECT neuroreceptor quantification models. J. Nucl. Med. 2001; 42:755-763.
• Lammertsma AA, Hume SP. Simplified reference tissue model for PET receptor studies. Neuroimage 1996; 4: 153-158.
• Lammertsma AA. Radioligand studies: imaging and quantitative analysis. Eur. Neuropsychopharmacol. 2002; 12: 513-516.
• Laruelle M. Modelling: when and why? Eur. J. Nucl. Med. 1999; 26, 571-572. • Laruelle M. Imaging synaptic neurotransmission with in vivo binding competition
techniques: a critical review. J. Cereb. Blood Flow Metab. 2000; 20: 423-451.
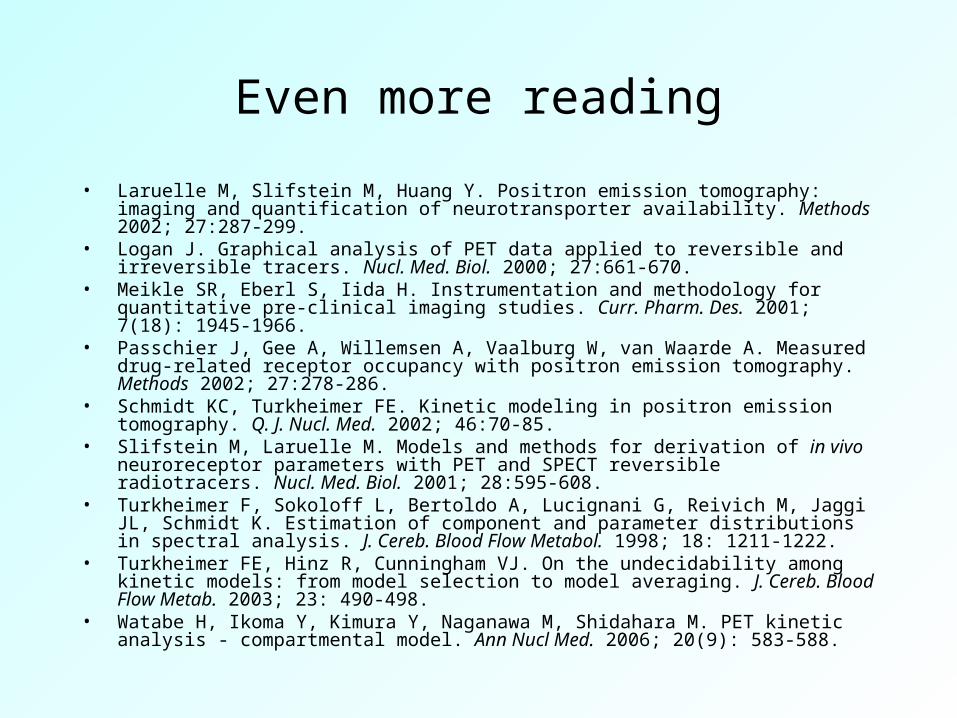
Even more reading
• Laruelle M, Slifstein M, Huang Y. Positron emission tomography: imaging and quantification of neurotransporter availability. Methods 2002; 27:287-299.
• Logan J. Graphical analysis of PET data applied to reversible and irreversible tracers. Nucl. Med. Biol. 2000; 27:661-670.
• Meikle SR, Eberl S, Iida H. Instrumentation and methodology for quantitative pre-clinical imaging studies. Curr. Pharm. Des. 2001; 7(18): 1945-1966.
• Passchier J, Gee A, Willemsen A, Vaalburg W, van Waarde A. Measured drug-related receptor occupancy with positron emission tomography. Methods 2002; 27:278-286.
• Schmidt KC, Turkheimer FE. Kinetic modeling in positron emission tomography. Q. J. Nucl. Med. 2002; 46:70-85.
• Slifstein M, Laruelle M. Models and methods for derivation of in vivo neuroreceptor parameters with PET and SPECT reversible radiotracers. Nucl. Med. Biol. 2001; 28:595-608.
• Turkheimer F, Sokoloff L, Bertoldo A, Lucignani G, Reivich M, Jaggi JL, Schmidt K. Estimation of component and parameter distributions in spectral analysis. J. Cereb. Blood Flow Metabol. 1998; 18: 1211-1222.
• Turkheimer FE, Hinz R, Cunningham VJ. On the undecidability among kinetic models: from model selection to model averaging. J. Cereb. Blood Flow Metab. 2003; 23: 490-498.
• Watabe H, Ikoma Y, Kimura Y, Naganawa M, Shidahara M. PET kinetic analysis - compartmental model. Ann Nucl Med. 2006; 20(9): 583-588.
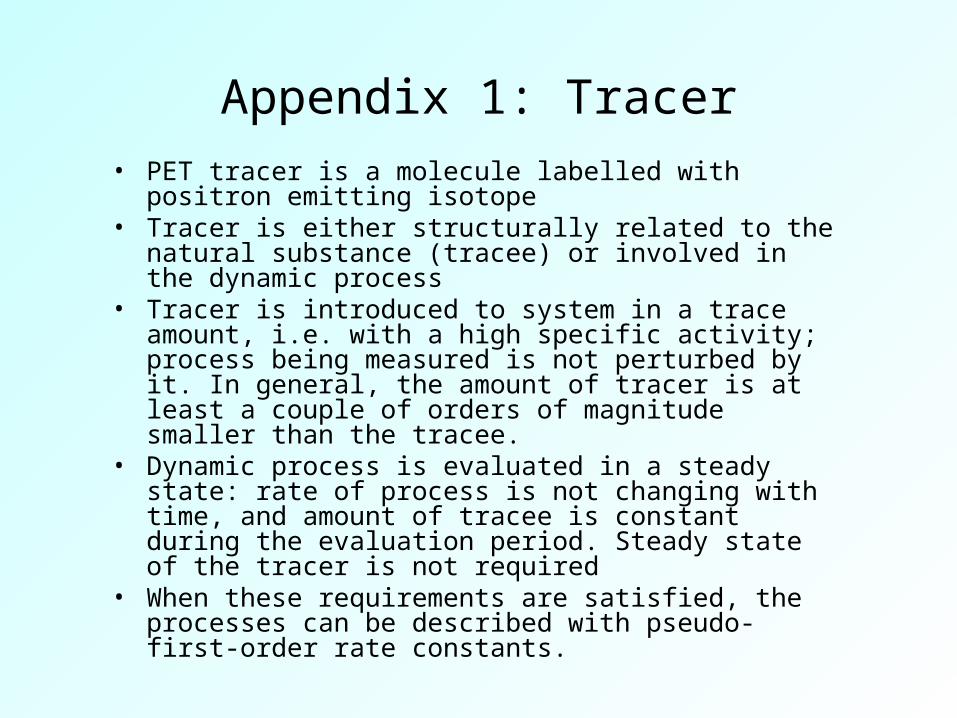
Appendix 1: Tracer• PET tracer is a molecule labelled with positron
emitting isotope• Tracer is either structurally related to the natural
substance (tracee) or involved in the dynamic process
• Tracer is introduced to system in a trace amount, i.e. with a high specific activity; process being measured is not perturbed by it. In general, the amount of tracer is at least a couple of orders of magnitude smaller than the tracee.
• Dynamic process is evaluated in a steady state: rate of process is not changing with time, and amount of tracee is constant during the evaluation period. Steady state of the tracer is not required
• When these requirements are satisfied, the processes can be described with pseudo-first-order rate constants.
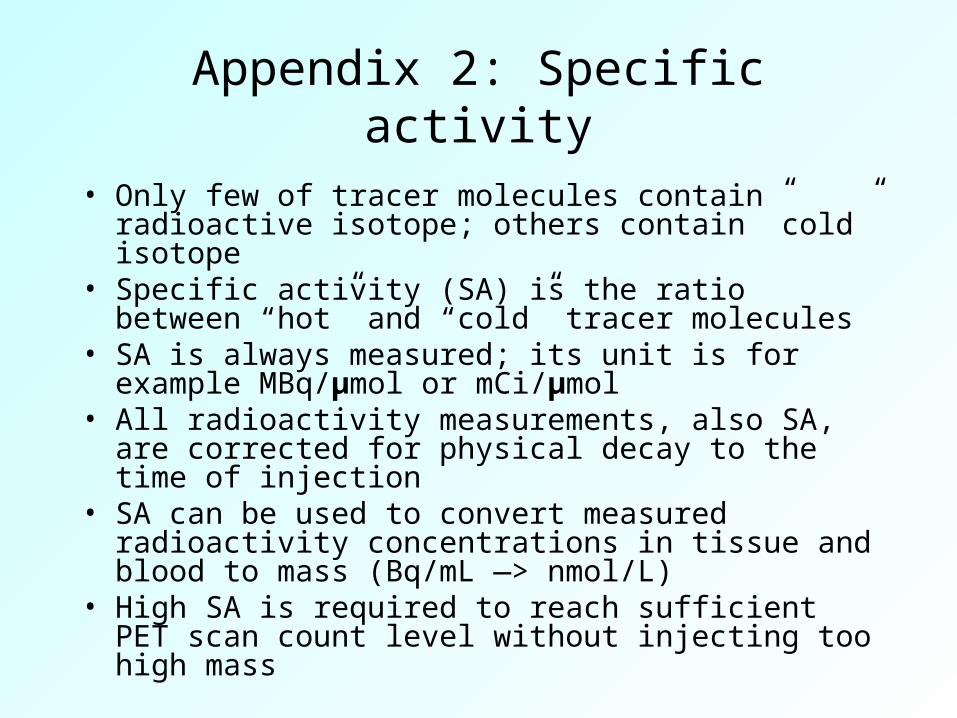
Appendix 2: Specific activity
• Only few of tracer molecules contain radioactive isotope; others contain ”cold” isotope
• Specific activity (SA) is the ratio between “hot” and “cold” tracer molecules
• SA is always measured; its unit is for example MBq/μmol or mCi/μmol
• All radioactivity measurements, also SA, are corrected for physical decay to the time of injection
• SA can be used to convert measured radioactivity concentrations in tissue and blood to mass (Bq/mL —> nmol/L)
• High SA is required to reach sufficient PET scan count level without injecting too high mass
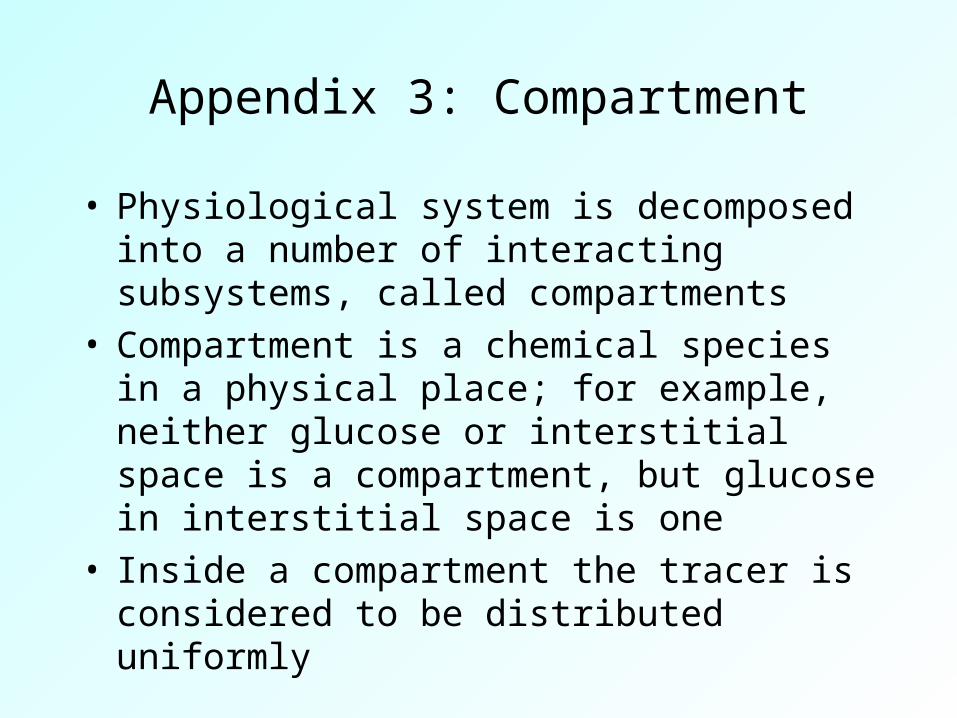
Appendix 3: Compartment
• Physiological system is decomposed into a number of interacting subsystems, called compartments
• Compartment is a chemical species in a physical place; for example, neither glucose or interstitial space is a compartment, but glucose in interstitial space is one
• Inside a compartment the tracer is considered to be distributed uniformly
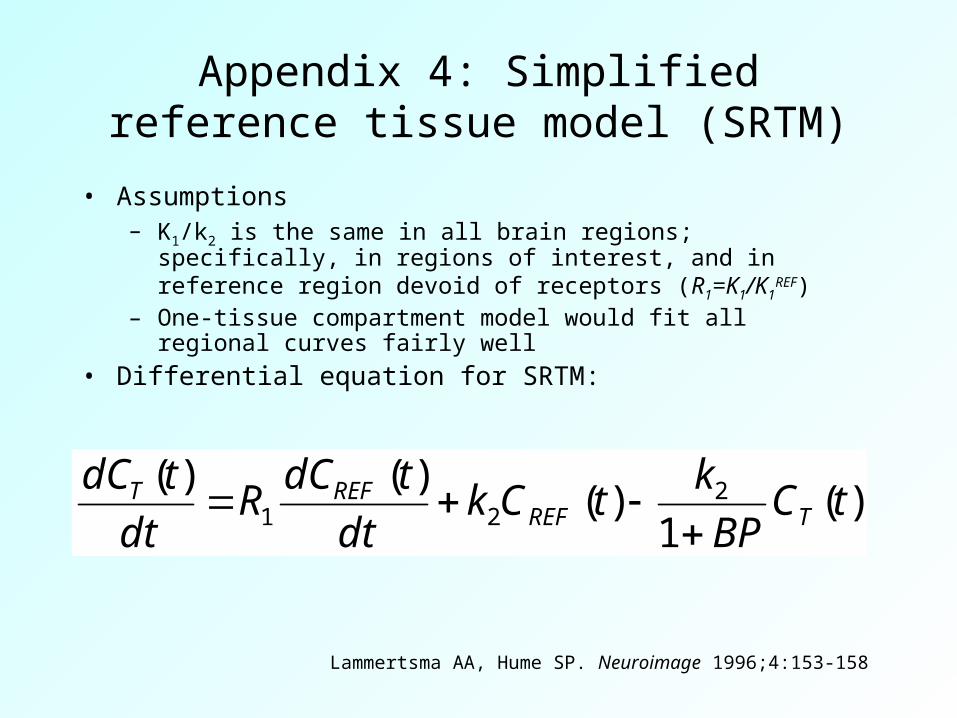
Appendix 4: Simplified reference tissue model (SRTM)
• Assumptions– K1/k2 is the same in all brain regions; specifically, in
regions of interest, and in reference region devoid of receptors (R1=K1/K1
REF)– One-tissue compartment model would fit all regional
curves fairly well• Differential equation for SRTM:
Lammertsma AA, Hume SP. Neuroimage 1996;4:153-158
)(1
)()()( 2
21 tCBP
ktCk
dt
tdCR
dt
tdCTREF
REFT
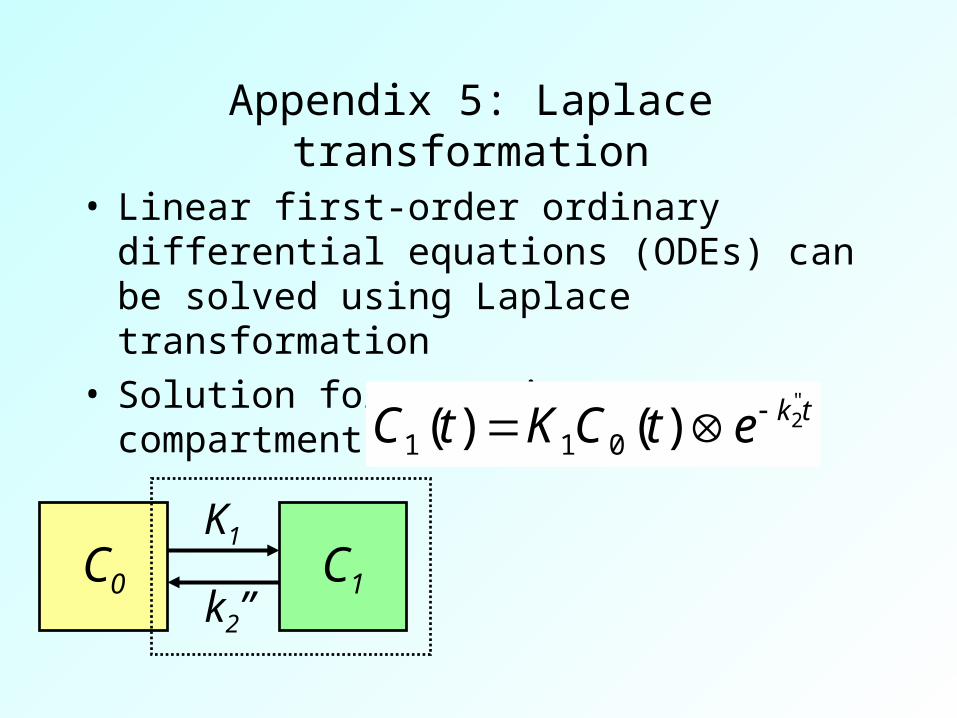
Appendix 5: Laplace transformation
• Linear first-order ordinary differential equations (ODEs) can be solved using Laplace transformation
• Solution for one-tissue compartment model: tketCKtC
"2)()( 011
C0 C1
K1
k2”
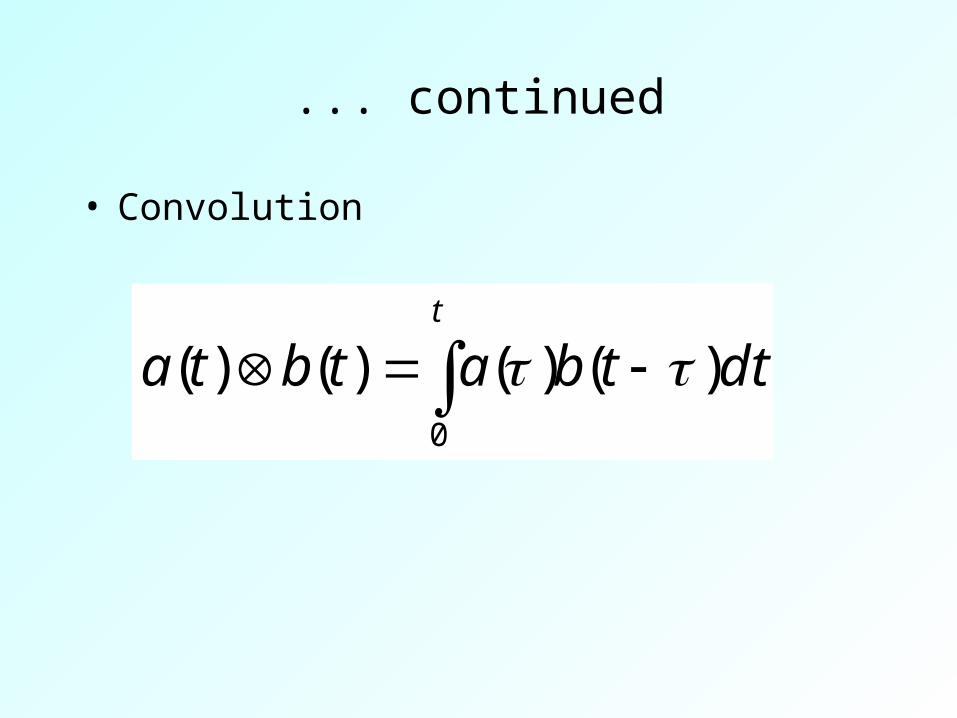
... continued
• Convolution
t
dttbatbta0
)()()()(
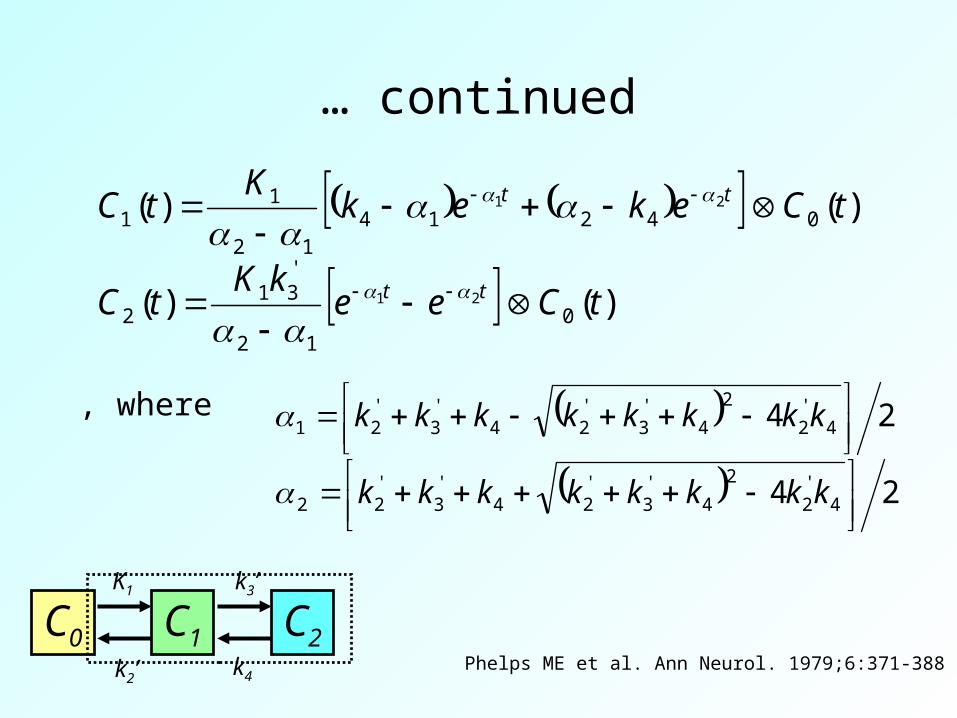
… continued
C0 C1 C2
K1
k2’
k3’
k4
)()(
)()(
012
'31
2
0421412
11
21
21
tCeekK
tC
tCekekK
tC
tt
tt
, where 24
24
4'2
2
4'3
'24
'3
'22
4'2
2
4'3
'24
'3
'21
kkkkkkkk
kkkkkkkk
Phelps ME et al. Ann Neurol. 1979;6:371-388
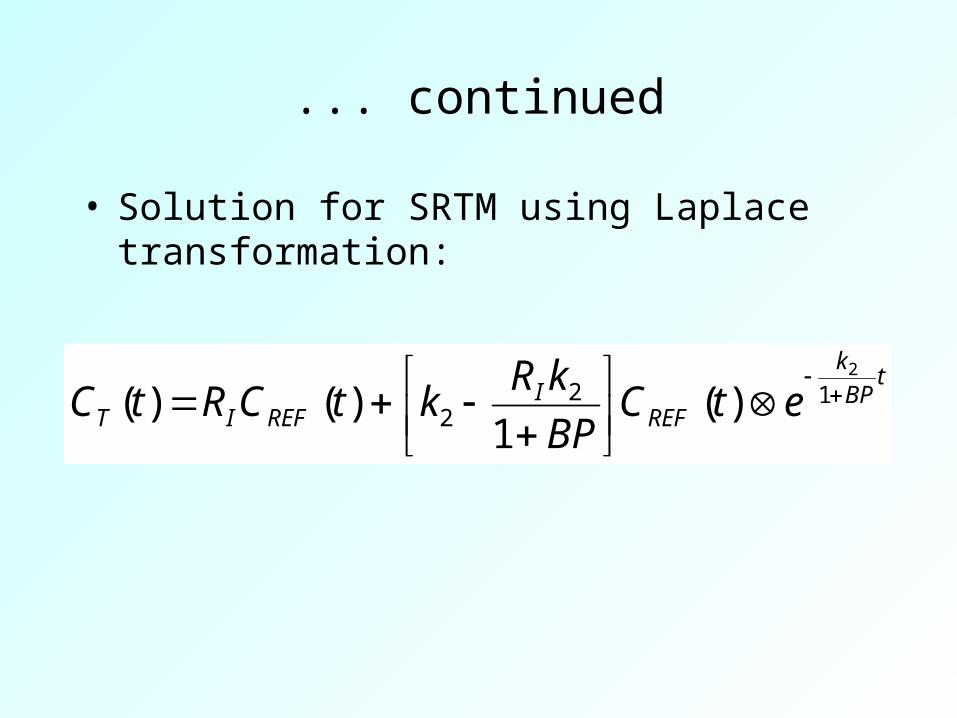
... continued
• Solution for SRTM using Laplace transformation:
tBP
k
REFI
REFIT etCBP
kRktCRtC
12
2
2
)(1
)()(
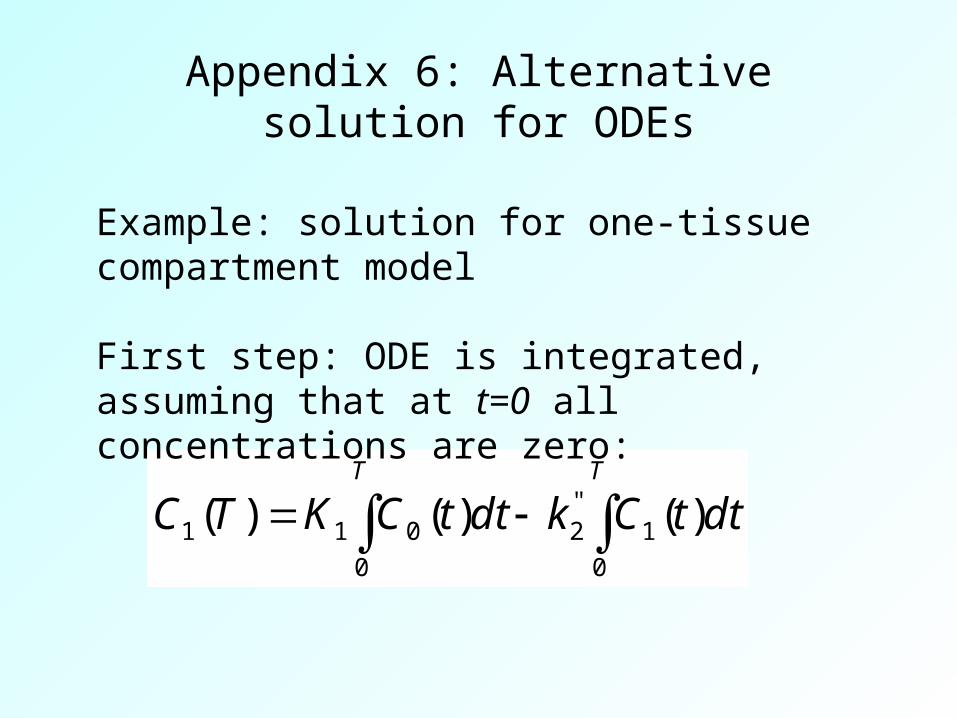
Appendix 6: Alternative solution for ODEs
TT
dttCkdttCKTC0
1"2
0
011 )()()(
Example: solution for one-tissue compartment model
First step: ODE is integrated, assuming that at t=0 all concentrations are zero:
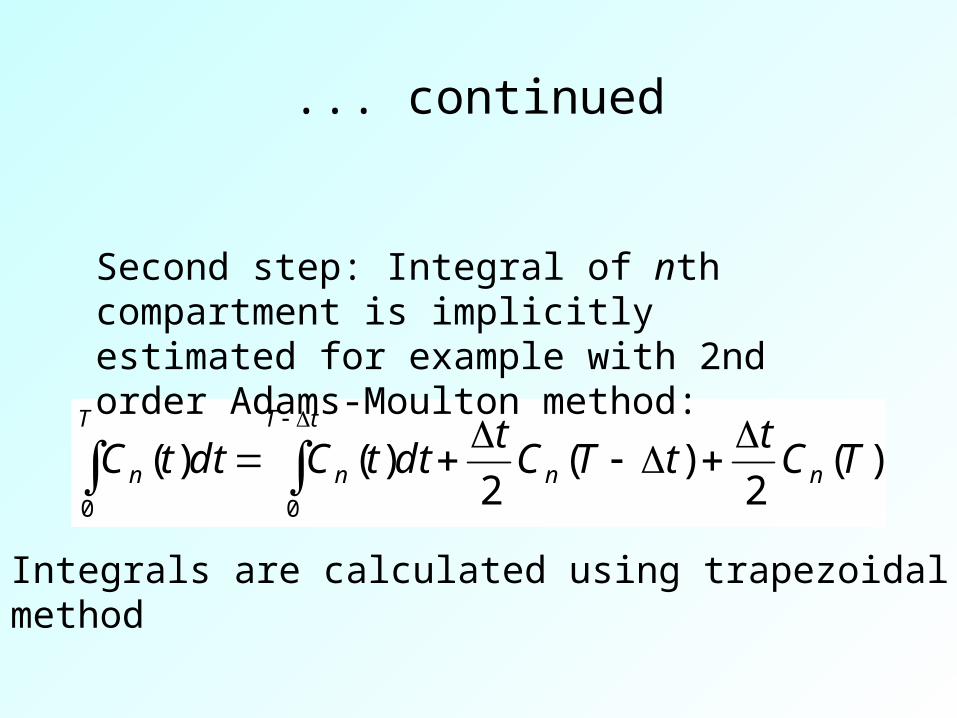
... continued
)(2
)(2
)()(00
TCt
tTCt
dttCdttC nn
tT
n
T
n
Second step: Integral of nth compartment is implicitly estimated for example with 2nd order Adams-Moulton method:
Integrals are calculated using trapezoidalmethod
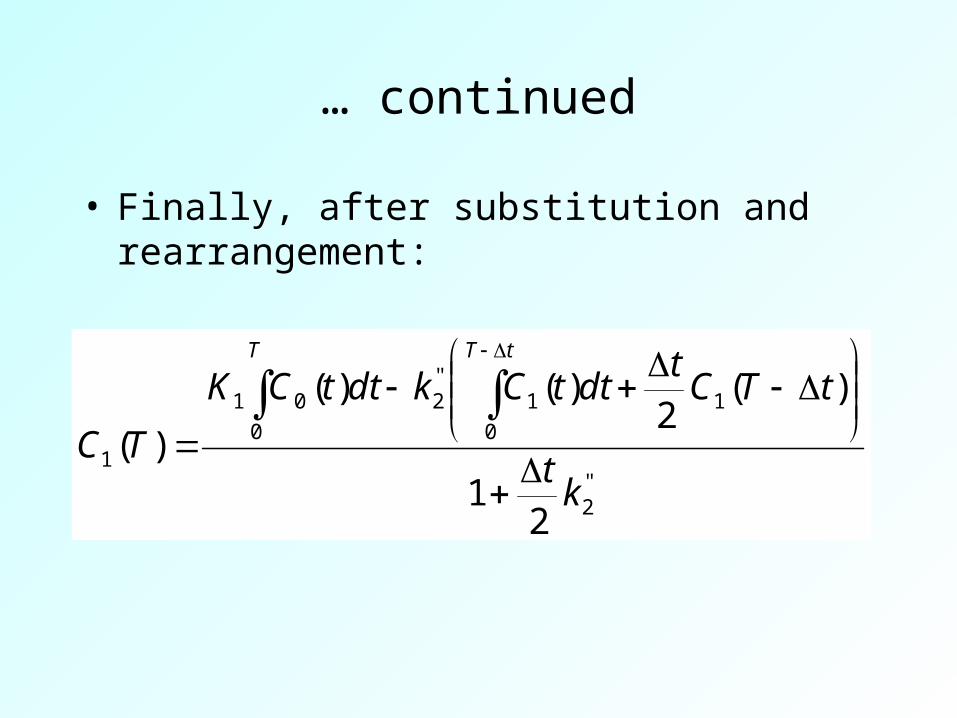
… continued
• Finally, after substitution and rearrangement:
"2
1
0
1"2
0
01
1
21
)(2
)()(
)(k
t
tTCt
dttCkdttCK
TC
tTT
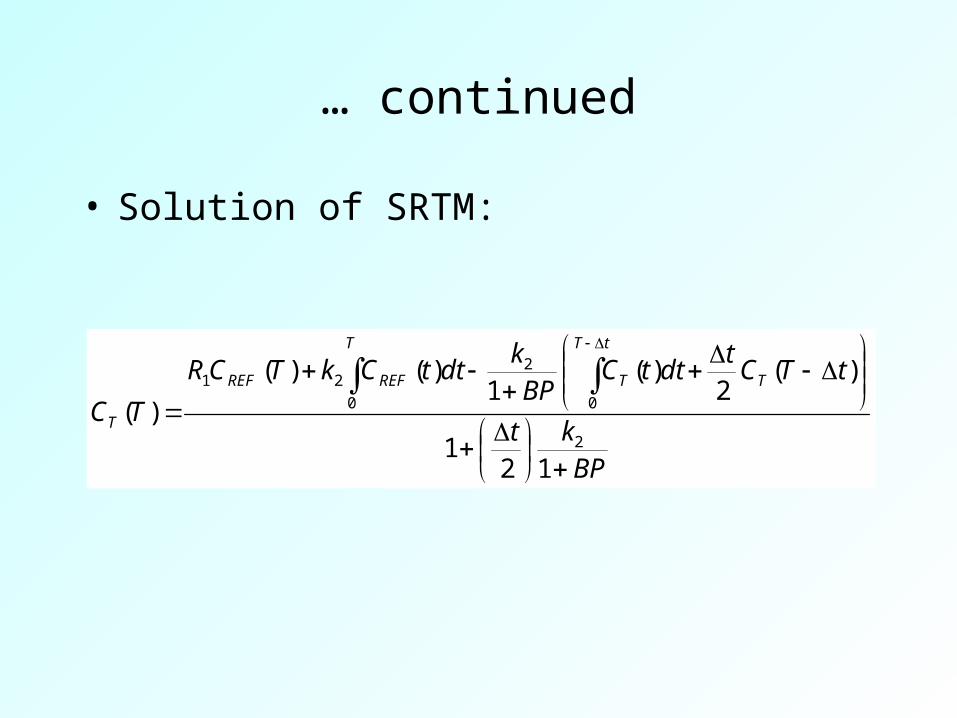
… continued
• Solution of SRTM:
BPkt
tTCt
dttCBP
kdttCkTCR
TCT
tT
T
T
REFREF
T
121
)(2
)(1
)()(
)(2
0
2
0
21


![Measurement of liver blood flow using [ 15 O]H 2 O and PET Literature review 7 th Modelling Workshop in Turku PET Centre, 20 th October 2005 Turku PET](https://img.pdfslide.us/doc/110x75/56649dc55503460f94ab8a09/measurement-of-liver-blood-flow-using-15-oh-2-o-and-pet-literature-review.jpg)