Embed Size (px)
Citation preview

1
Pesticides Research
No. 31 1997
Pesticide Re-entryExposure of Workersin Greenhouses
Erik Kirknel, A. Nøhr Rasmussen and Gitte EmdeDanish Institute of Agricultural SciencesFlakkebjergDK-4200 Slagelse
Published and economic supported by:
Ministry of Environment and Energy, DenmarkDanish Environmental Protection AgencyStrandgade 29DK-1401 København K
ISBN 87-7810-822-5

2
Content
Preface 4Acknowledgement 5
Abstract 6
Sammendrag 7
1 Introduction 8
1.1 Background 81.2 The present project 10
2 Materials and Methods 13
2.1 Green houses, pesticides and plants 132.1.1 Spray equipment 13
2.2 Assessment of exposure 132.2.1 Assessment of dislodgeable foliar residue 142.2.2 Assessment of exposure on inactive media as glass walls,
plastic curtains, heating tubes and aluminium tables 14
2.3 Chemical analysis of pesticides 152.3.1 Extraction and clean-up 152.3.1.1 Dermal exposure 152.3.1.2 Respiratory exposure 152.3.1.3 DFR (Dislodgeable foliar residue) 152.3.1.4 Inactive media 152.3.2 Detection 152.3.2.1 GC-conditions 152.3.2.1.1 Injector 162.3.2.1.2 Detectors 16
ECD 16NPD 16
2.3.2.2 HPLC-conditions 16Solvents and wavelengths 16
2.3.3 Quantification’s 172.3.4 Recovery 17
3 Results 19
3.1 Experiment 119Figures and tables 22
3.2 Experiment 2 24Figures and tables 29
3.3 Experiment 3 35Figures and tables 39
3.4 Experiment 4 42Figures and tables 44

3
3.5 Experiment 5 46Figures and tables 49
3.6 Experiment 6 51Figures and tables 55
3.7 Experiment 7 59Figures and tables 64
3.8 Experiment 8 69Figures and tables 73
3.9 Experiment 9 77Figures and tables 83
3.10 Experiment 10 95Figures and tables 97
3.11 Experiment 1198Figures and tables 103
3.12 Experiment 12 110Figures and tables 114
3.13 Experiment 13 119Figures and tables 122
3.14 Experiment 14 125Figures and tables 129
3.15 Experiment 15 134Figures and tables 138
3.16 Experiment 16 146Figures and tables 148
Conclusive figures and tables, 17 (x) 152
4 Discussion 170
5 Conclusion 173
6 References 175

4
Preface
Exposure of workers in green houses re-entering the crop after use ofpesticides has been an area of a lot of questions and few answers. In the pastthere has been severe accidents among workers re-entering green housesafter the treating with cyan gas. The focus on inhalation exposure wastherefore natural and dermal exposure after contacting the sprayed crop wasnot considered to be of importance.
10 years ago, pesticides were regularly used in all Danish green housesgrowing ornamentals and edible crops as e.g. tomatoes and cucumbers.Introducing biological control of pests especially in tomatoes and cucumbersleft the ornamentals as the main crop sprayed with pesticides. Contrary tothe use of pesticides on fruits and vegetables no residue limits of pesticidesexisted on ornamentals, only recommendations of ventilation of the greenhouse before re-entry based on “common sense”. Very few reports havebeen available in the registration procedure of pesticides for the nationalauthorities for evaluating the inhalation- and dermal exposure in thisworking environment.
The present project is aiming towards supplying the Danish authorities withexposure data from re-entering ornamental green houses after being treatedwith pesticides.
The project does not include any kind of risk assessment and this aspect willnot be dealt with.
The project is economically supported by The Ministry of Environment andMinistry of Agriculture and Fisheries and was co-ordinated with project“Geno- and spermatotoxic effects on and plasma cholinesterase activity inpesticide exposed green house workers” (Report from Ministry ofEnvironment, Abell et al., 1996).
The present project was planned, conducted and performed from 1993 to1996 by:
Erik Kirknel, cand. agro., M.Sc. (Department of Weed Control and PesticideEcology),
A. Nøhr Rasmussen, cand. agro. (Department of Plant Pathology and PestManagement) and
Gitte Emde, laboratory technician (Department of Weed Control andPesticide Ecology) all
The Ministry of Food, Agriculture and Fisheries,Danish Institute of Agricultural Sciences,Research Centre Flakkebjerg, Flakkebjerg,DK-4200 Slagelse, Denmark.Phone +45 5311 3300. Fax +45 5311 33 01.
The two projects were followed up by a steering group consisting ofchairman Thomas Bach Lauritsen and later cand. pharm. Lærke AmboNielsen, both from The Ministry of Environment.

5
The members were:
Jesper Lund Larsen, Specialarbejderforbundet (Workers Union),
Peter Bligård, Gartneribrugets Arbejdsgiverforening (Green HouseEmployers Union),
Aksel Stenvang, representing DEG´s Arbejdsgiverforening (GrowersUnion),
Jens Peter Bonde, cand. med., Arbejdsmedicinsk Klinik, ÅrhusKommunehospital,
Anette Abel, cand. med., Arbejdsmedicinsk Klinik, ÅrhusKommunehospital,
Flemming Lander, cand. med., Ph.D., Arbejdstilsynet, Odense,
A. Nøhr Rasmussen, cand.agro., Statens Planteavlsforsøg, Afdeling forPlantepatologi og Jordbrugszoologi and
Erik Kirknel, cand. agro., M.Sc., Statens Planteavlsforsøg, Afdeling forUkrudtsbekæmpelse og Pesticidøkologi
Acknowledgements
The experiments were done in commercial green houses and were onlypossible due to the extreme degree of co-operation from the owners of thegreen houses and the workers.
Through out the experiments we have (with only very few exceptions) beenmet with the “open door policy” and interest from both owners and workers.We will hereby express our thanks to these people, without this type of co-operation the project would not have been possible.
A special thank is devoted to our patient secretary Mrs. Sonja Graugaard.

6
AbstractRe-entry experiments have been made in 8 different commercial Danishgreen houses with ornamentals. 5 pesticides, pirimicarb, paclobutrazol,endosulfan, methomyl and mercaptodimethur, was sprayed with hydraulicspray boom, hand held rifle or cold foggers. 12 different plant species wereinvolved in the experiments.
Different working procedures were investigated when workers re-enteredthe green house after the spraying.
Whole body dosimeters were used to measure potential exposure, except forhead and feet. Static and personal air monitoring was made too.
Dislodgeable foliar residues (DFR) was correlated to hand exposure. Thecorrelation is called the transfer coefficient.
Inactive media such as glass walls, heating tubes, plastic curtains andaluminium tables were analysed for residues.
21 transfer coefficients were calculated for a range of working procedures.Within each pesticide there was a tendency to positive correlation betweenevaluated degree of contact with the plants and transfer coefficients. Poolingall pesticides this tendency was not apparent. Best fit for distribution of thetransfer coefficients was a log-normal distribution, probably due to fewindividuals in each individual experiment. Geometric mean for transfercoefficients above 10 cm²/h was 1495 cm²/h ÷525 (lower) and +4257 (upper)for one standard deviation (n = 16), thus giving a 90-percentile of 5199cm²/h. A default value for ornamentals in greenhouses with the workingprocedures described is suggested to 7000 cm²/h. The hands was the mainarea of exposure but the rest of the body was in some experiments exposedas much as the hands.
The respiratory exposure was rather low compared to dermal exposure.Endosulfan was measured to 60 µg/h at re-entry at respiration rate of 20L/min. Mercaptodimethur was observed resuspended in the air at re-entrywhen the ornamentals were hanging above the workers. Deposition ofpesticides an inactive media was most pronounced on heating tubes.
In general no pesticides were detected in the air before the spraying, despiteweekly spraying of the plants.
Cold foggers did not distribute the pesticides evenly in the green houses.There was a 4.3 to 195 -fold difference between the highest and lowestdeposited dosage/area. The consequences of this is discussed. For hand heldrifle the factor was only 3.
For registration purposes it is argued to conduct experiments withdislodgeable foliar residues for each pesticide. This is due to the correlationbetween applied dosage and DFR depends on the pesticide.

7
Sammendrag
Forsøg er blevet udført med eksponering af væksthusgartnere ipesticidbehandlede danske potteplantegartnerier (re-entry). 5 pesticider,pirimicarb, paclobutrazol, endosulfan, methomyl og mercaptodimethur blevudsprøjtet med hydraulisk sprøjtebom, håndbåren sprøjteriffel ellerkoldtågesprøjte. 12 forskellige potteplantearter indgik i forsøgene.
Forskellige arbejdsrutiner efter pesticidbehandling af potteplanter blevundersøgt.
Eksponering blev målt på hele kroppen undtagen hoved og fødder.Fastmonteret og personbåret luftopsamlingsudstyr, registrerede luftensindhold af pesticider.
Løst bundet pesticid på bladoverfladen (DFR = dislodgeable foliar residue)blev korreleret til håndeksponering. Korrelationen benævnestransferfaktoren.
Inaktive flader så som glasvægge, varmerør, plastskyggegardiner ogaluminiumsborde blev analyseret for pesticidrester.
21 transferfaktorer blev beregnet for forskellige arbejdsrutiner. Indenforhvert pesticid var der en tendens til positiv korrelation imellem estimeretgrad af kontakt med de sprøjtede planter og transferfaktoren. Denne positivekorrelation kunne ikke konstateres når transferfaktorerne ikke blev sorteretfor pesticider. Transferfaktorerne var bedst fordelt log-normalt,sandsynligvis på grund af få personer i de enkelte forsøg, hvor fordelingen iet større materiale anses for log-normalt. Geometrisk gennemsnit fortransferfaktorer over 10 cm²/t, var 1495 cm²/t ÷525 (nedre) og +4257 (øvre)for en standardafvigelse (n=16). Dette resulterer i en 90-percentil på 5199cm²/t. Derfor foreslås en transferfaktor for væksthusarbejdere somudgangspunkt på 7000 cm²/t. Hænderne var generelt den kropsdel sommodtog langt den største dosis pesticid ind på huden, men i nogle forsøg varden potentielle eksponering på krop÷hænder lige så stor som på hænderne.
Eksponering via indåndingen var generelt lav sammenlignet medhudeksponeringen (3.5% af total). Men endosulfan blev registreret up til 60µg/t ved re-entry (ved respirationsrate på 20 L/minut). Mercaptodimethurblev resuspenderet i luften ved arbejde med de sprøjtede planter der hangover hovedhøjde på væksthusarbejderen. Deponering af pesticider var mestudtalt på varmerør. Generelt blev der ikke målt pesticider i luften førsprøjtningen trods ofte ugentlige sprøjtninger.
Koldtågesprøjter fordelte ikke pesticiderne tilfredsstillende i disse forsøg.Der blev registreret en 4.3 til 195 gange forskel imellem højeste og lavestedosis/areal. Konsekvensen af dette forhold er diskuteret. For håndbårenhydraulisk riffel er faktoren kun 3.
I risikovurderingen er det nødvendigt for det enkelte pesticid at haveoplysninger om de løst bundne rester (DFR) ad en tidsakse. Grunden hertiler, at korrelationen imellem udsprøjtet pesticiddosis og DFR erpesticidspecifik.

8
1 Introduction
1.1 Background
Pesticide exposure and re-entry in agriculture (and green house crops) isexcellently reviewed by Joop van Hemmen et al. 1995 and is used in thefollowing. The re-entry exposure (exposure after application of pesticides) isdue to the pesticides available in the air, either residuals from the sprayingor pesticides re-entering the air from sprayed crop, inactive materials likefloor, glass surfaces and eventually resuspended pesticides due to workeractivity in the sprayed area. But the main source of exposure is the directcontact with the sprayed crop.
Potential exposure depends on the chemical/physical properties of thepesticide, the crop and the working task. A series of factors are intrinsic forabsorption of the potential exposure, of which shall not be discussed here.Therefore the most precise way of relating effects on the workers is togovern biological monitoring which requires pharmaco kinetic knowledgeon the pesticide in question.
First incidents The first incidents of detrimental effects on workers re-entering the sprayedcrop was reported in the early fifties and Maddy et al. 1990, have made areview of these cases from Californian citrus fruit crops, grapes and cotton.Re-entry intervals (minimum time period between pesticide application andworker re-entry) was developed on basis of these incidents. Popendorph(1992) have listed formal re-entry intervals and their background.
The main source of exposure was the sprayed crop and Gunther et al. 1977presented data for decay of pesticide residues on foliage. Especial attentionwas paid to toxic metabolites arising after the spraying and levels ofdislodgeable residues was an arising new concept in worker protection.
Dislodgeable foliar residue For prediction of dermal exposure on the workers a “source strength”(DFR) term was needed. Iwata et al. (1977) suggested a method for determining the
“dislodgeable” dosage of pesticides on the sprayed crop. The methodconsisted of punching leaf discs and gently rinsing the discs with watercontaining a mild detergent. The method has been used extensively, butmodified using whole leaves, different rinsing solutions etc. Dong et al.(1991) have discussed the different approaches. The most serious argumentagainst leaf punching is the damage done to the sub cuticular tissues and thefollowing extraction of pesticides penetrating the surface layers. The use ofdetergents may also interfere with a waxy foliage.
Half lives of pesticides Van Hemmen (1995) is summarising a series of half lives of pesticides ondifferent crops. The half lives indicated are approximate initial values basedon mainly first order decay. But decay of pesticides on plant material mayoften be complex of nature and difficult to express in mathematical terms.Timme et al. (1986) found out that on basis of “total residues”, in 420series of experiments, 35% made a best fit to a first order model, additional35% for root function. But, also in this case, the decay in general was not soeasy to characterise due to impact of pesticide and crop.
Transfer coefficient The relationship between dermal exposure (dosage/time unit) anddislodgeable foliar residue (dosage/area) seems natural. The correlation

9
coefficient between the two parameters, the transfer coefficient with the unitcm²/h, should represent an expression of how many cm² dislodgeable foliarresidue the worker was exposed to per hour. Popendorph and Leffingwell(1982) found a rather good linear relationship between the two variablesover a broad range of values. But crop type and work practice wereinfluencing the transfer coefficient. Nigg et al. (1984) and Zweig et al.(1985) found for a series of crop and pesticides transfer coefficients from800 cm²/h to 61.000 cm²/h. The average transfer coefficient was 5.000 cm²/h,one-sided projection of the leaf area. This average value was proposed usedas a default value but the need for studies in specific crop/pesticiderelationship was expressed by Zweig et al. (1985).
Krieger et al. (1990, 1992) found even greater variation in transfercoefficients, from 1.000 cm²/h to 400.000 cm²/h for different work tasks. Theattention on the work task was increased as a parameter of importance. (Fig.1).
Figure 1Transfer coefficients for different working tasks (Krieger, 1990, 1992; VanHemmen, 1995).
Transferfaktorer for forskellige arbejdsrutiner ( Krieger, 1990, 1992; VanHemmen, 1995).
Respiratory exposure and risk Very few papers exist on evaluating the hazard of re-entering the greenhouses after spraying with pesticides. Aerosols and vapours of pesticidesmay exist several days after low volume spraying (Williams 1978; Williamset al. 1980; Lindquist et al. 1987; Liesivvuori et al. 1988; Brouwer et al.1992d; Kangas et al. 1993). Based on these studies an 8 hour re-entryinterval with the last 2 hours with the windows opened, could berecommended for all pesticides. Spraying pesticides with vapour pressure

10
above 10 mPa at 200C it was recommended to open the windows more orless the next two days in order to prevent a build up of pesticides in the air.In normal build green houses this is probably not necessary in warm periodsdue to a rather high diffusion of air through the green house. In cold periodsthe glass panes are more tight due to water condensing between the panes.When high volume spraying of non-volatile pesticides only 8 hour re-entryinterval is recommended or one hour with the windows wide open for allpesticides, Brouwer et al. (1992d). Inhalation exposure of evaporatedpesticides during working is considered to be low. Resuspension of dustparticles from powders could eventually be a problem during working withthe sprayed plants Brouwer et al. (1990; 1993).
Dermal exposure in Risk of dermal exposure from imported ornamentals even aftergreen houses long periods after the spraying was shown to be considerable (Morse, 1982).
Measurable cholinesterase inhibition was the result in workers handlingchrysanthemum cutting treated 10-20 days earlier with granules of aldicarb(Löbel and Schunk, 1982).
in Finland In Finland Jauhiainen et al. (1992) and Kangas et al. (1992, 1993) studiedexposure of especially mevinphos on workers handling roses andchrysanthemum. Good correlation was observed between decay of pesticideson leaves and dermal exposure. The transfer coefficient was 133 cm²/h, butthe exposure was measured on the bare hands covered with a glove. Theresults can therefore not directly be compared to true potential exposure,which is exposure on the glove. But the results indicate a true transfercoefficient may be 10 to 100 times higher (1% to 10% penetration of thegloves).
in Sweden In Swedish experiments in green houses, Nilsson (1996a and b) andPapantoni (1995) have developed a new and very interesting DFR technique,using wettex discs to remove small volumes of ethanol applied to the leaf.Transfer coefficients were developed when harvesting cucumbers sprayedwith vinclozolin. In four experiments transfer coefficients were calculated tobe from 180 to 670 cm²/h. The method avoid damaging the sub cuticularlayers, but will maybe extract some of the wax on the cuticle.
in Germany and In German green houses methamidophos sprayed on gherkins, roses andgerbera´s resulted in a transfer coefficient of 700 cm²/h (Goediche, 1989).Half lives of different pesticides sprayed on different crops was determinedby Goediche (1987; 1988a; 1988b; 1989) and Goediche et al. (1989).
in Holland. Various pesticides were sprayed on roses and carnations in Dutch greenhouses. Sorting and bundling of roses led to lower transfer coefficients thanon carnations when harvested. For roses 1200-6250 cm²/h, for carnation2800-10000 cm²/h (Brouwer et al. 1992a; 1992b; 1992c; 1993) and vanHemmen et al. (1992).
1.2 The present project
The present project was performed in order to investigate potential exposureof workers re-entering ornamental green houses after spraying withpesticides. It was realised that the project could far from describe everypossible combination of pesticides, crop, spray equipment, workingprocedures, climate etc. All scenarios could not be covered. But it was

11
emphasised to select key parameters important for exposure. The resultscould subsequently be used together with results from the literature in theprocedures of pesticide registration in suggesting a model for exposure.
The model is based on Although the above described transfer coefficients seems to be dependenttransfer coefficients on a range of other key parameters as pesticide, crop etc., it was decided to
concentrate the expression of exposure to this unit. The choice was easy because all the present literature operate with transfer coefficients as the keyparameter in exposure. The ultimate best method in measuring exposure would be biological monitoring. This is only possible for pesticides with known pharmaco kinetic and would only be valid for few pesticides.
Transfer coeff. for a variety Different working procedures was investigated and characterised withof working tasks transfer coefficients. This was important when eventually counteractions
should be taken, such as changing working procedures and recommendingprotective gear. But no pesticide is registered for use in a green house wherethe only working procedure would be tagging plants or moving tables!Therefore we have been concentrating on developing a transfer coefficientof “worst case” under normal working conditions.
Full body dosimeter Transfer coefficients are in the literature normally based on dermal handexposure and dislodgeable foliar residues from the sprayed plants. This isalso the case in this study. But not only the crop is sprayed and not only thehands are exposed in a re-enter situation. Therefore a whole body dosimeterwas used as described under the chapter “materials and methods”.
Inactive media Glass from the walls, plastic curtains, heating tubes, and the tables, so calledinactive surfaces was analysed for residues after the spraying. These resultscould give information’s on the “background exposure” when the crop isremoved from the green house and maybe explain some of the potentialexposure detected on other parts of the body than the hands.
Air monitoring Air monitoring has been done in all of the experiments and in someinstances for a long period of time. Air monitoring means both static andpersonal air monitoring. The literature indicates that this route of exposureis of minor importance. We have the point of view that all the workers in thegreen house, and not only the ones working directly with the sprayed cropwill be exposed to inhalation exposure and documentation on this aspectshould be weighted with high priority.
Commercial green houses To understand the design and description of the individual experiment oneshould realise the working conditions in most Danish green houses. Thegreen houses are relatively small, the working procedures are very flexibleand the duration of the individual working procedure in question is oftenvery short. Short exposure time is in general a source to errors and should beavoided. One of the reasons for this is the low amount of pesticide depositedon the dosimeter and atypical working pattern.
Flexibility in the working procedures for the workers has also often resultedin changes in the planned activities such as cancelling parts of anexperiment.
Spray equipment Spray equipment as a factor of importance in exposure has also beeninvestigated. This does not mean that all types of spray equipment

12
systematically has been tested in this respect. For example has the velocityof a spray boom been measured to indicate the dosage sprayed per area unit.But we have not investigated the spray pattern of the nozzles mounted on thespray boom. These information can be obtained elsewhere. We haveanalysed the distribution of the spray solution from the use of questionableequipment as handhold rifles, and the extensive used cold foggers becausethis type of spray equipment obviously will give rise to questions about theuniformity of the dosage applied.
Not all the mentioned parameters are investigated in each experiment, butonly those found important.
Climatic measurements are reported when present. These data have not beenutilised systematically but are included in the report for reasons ofdocumentation.
The results are presented experiment by experiment and access to raw datashould in general by possible consulting the illustrations. Figures arepreferred because the dynamic expression is more pronounced here than intables. A uniformed text design enable a relatively fast comparison betweenthe individual experiments.

13
2 Materials and methods
2.1 Green houses, pesticides and plants
The experiments were conducted in 9 different green houses, eight of themcommercial and one (experiment 16) belonging to Department of WeedControl and Pesticide Ecology. Details of the individual green house isdescribed in each experiment.
The study was to a large extent based on the OECD draft guidelines forexposure studies by Graham Chester, Zeneca (unpublished).
5 different pesticides (Pirimicarb, paclobutrazol, endosulfan, methomyl andmercaptodimethur) were sprayed on ornamentals.
12 plant species were sprayed namely Mini-roses, Kalanchoë blossfeldiana,Hedera helix, cut-roses, Begonia elatior, Dracaena marginata, Codiaeumvariegatum, Polyschias balfouriana, Cordyline purple, Dendranthemaindicum-hybride, Aeschynanthus spp. and Columnea spp.
2.1.1 Spray equipment
3 types of spray equipment were used: hydraulic spray boom, hand heldhydraulic rifle and cold foggers. Further details at the individualexperiments.
2.2 Assessment of exposure
Dermal exposureFull body dosimeter of cotton A full body dosimeter was used except for the head and the foot region, T-
shirt type JBS no. 300-14 with long sleeves and long trousers type JBS no.310-21, all cotton, normal underwear. All cotton was pre-washed in anormal 90ºC wash and one 90ºC without soap due to interfering compoundsin the analysis. Gloves type Maco, delivered by S.F.K., Avedøreholmen 96-98, Copenhagen, phone 36399393 all cotton, were used in assessing handexposure. The gloves were analysed intact and individual, while T-shirt andtrousers were cut according to fig. 17.1. Immediately after exposure andsectioning the samples were stored at -20ºC until analysis.
Respiratory exposureAdsorption tubes for air Both static air monitoring and personal air monitoring were done.monitoring Sorbent sampling tubes type SKC XAD-2, 226-30-16 The tube has an inner
orifice of 10 mm. Flow rate when sampling was 1 L/min as recommendedby the producer: SKC Unit II, Sunrise Park, Higher Shaftsbury Road,Blandford Forum, Dorset. DT II 8ST, UK, phone 1258480188. 1 L/mingives a flow rate of 21.2 cm/sec. This flow is found satisfactory althoughflow rates on 125 cm/sec normally are recommended to catch aerosolsinhaled at 20 L/min respiratory rate, immediately after spraying. 1 hour afterthe spraying the aerosols of this size is absent from the spray zone and whatremains of aerosol and particles in the air will be sampled event at this low
14
sampling rate. The sample tube is constructed as a sample train. Afterentering the tube the air is filter through a glass fibre filter withholdingaerosols and particles. Next an XAD-2 Sorbent layer (270 mg), apolyurethane plug for separating this layer to the next XAD-2 Sorbent layer(140 mg) and finally a polyurethane plug. The second XAD-2 layer is usedas a break-through check. XAD-2 absorbs the pesticide gasses, that meansboth pesticides found in the gas phase in the sample area but also eventuallypesticide in the gas phase released from aerosols or carried on particles(dust) and sampled on the glass filter.
The pump was from the same company type SKC-224-PCXR7, fullyprogrammable and could run continuously from 1400 minutes up to 2200minutes depending on the condition of the battery . The pump was equippedwith a rotameter for observing severe malfunctioning but was calibratedbefore and after use with a sample tube mounted on the suction side in orderto establish the same resistance in the air flow as when sampling.
After sampling the tubes were stored at -20ºC until analysis.
2.2.1 Assessment of dislodgeable foliar residue (DFR)
DFR Samples of leaves were produced by the leaf punching method described byIwata et al. (1977). The leaf puncher was available in three different sizes 12mm, 18 mm and 25 mm diameter. Depending upon the leaf geometry, one ofthe sizes were used. At least 20 punches and 4 replications per samplingwere made. Immediately after sampling the discs were placed in a 50 mlPyrex tube Teflon capped with 20 ml of destilled water. The tubes weretilted for 30 minutes on a Swelab instrument type 440, Bie and Berntsen,Sandagervej, Copenhagen, phone 42948822. The tubes were gently tiltedfrom horizontal position ± 30ºC with a frequency of 15 cycles/min.After 30 minutes the leaves were removed with tweezers and 5 mldichloromethane (Rathburn un 1593 or Merck no. 106050) was added. Aftervigorously shaking the tubes were stored at 5ºC until analyses.
2.2.2 Assessment of exposure on inactive media as glass walls,plastic curtains, heating tubes and aluminium tables
Inactive media The inactive media were rinsed or extracted with ethanol: 96% commercialgrade (Danisco no. 633600). The sample sizes are indicated in the individualexperiments. Due to the different properties of the inactive media fromgreen house to green house, it was not tried to make a total residual analysis.For example some heating tubes were painted others not. The paint was ofdifferent type, age and thickness. Recovery was impossible to measureunder these circumstances. The results should only reflect residues loosebound. The rinse was done with a spray bottle 1-2 minutes with a surplus ofsolvent. The extract was stored at -20ºC until analysis. Plastic curtains wereextracted just like the body dosimeter.
Field recovery No field recovery was done due to immediate storage of thesamples in a portable freezer.

15
2.3 Chemical analysis of pesticides
2.3.1 Extraction and clean-up
2.3.1.1 Dermal exposure
Sections of T-shirts and trousers were extracted in 1 L of ethanol in 2 LPyrex glass bottles. The bottles were rolled horizontally for 2 h. Each glovewere extracted in a 0.5 L Pyrex glass bottle in a similar way. Dependingupon the concentration in the extract, 10 to 350 ml sub-sample was filteredthrough anhydrous, Na2SO4 , (Merck no. 6649 heated to 450ºC for 4 hours)evaporated to dryness and resuspended in 5 ml cyclohexane/ethylacetate 1:1(Cyclohexane, Merck no. 9666 or Fluka no. 28932, ethylacetate Rathburn un1173).
The sample was cleaned-up on a gel column 45 cm long x 1.5 cm diameterBiobead SX-3 (Biorad 200-400 Merck, no. 152-2750) in cyclohexane/ethylacetate 1:1. The sample was evaporated to dryness and resuspended in2 ml ethylacetate for GC analysis or appropriate mix of methanol/water(Mallinckrodt no. 3041) for HPLC analysis.
2.3.1.2 Respiratory exposure
All five layers of the SKC sample tube were individually extracted in 4 mlethyl acetate and treated ultrasonically intermittent for 2 h. Stored at +5ºCovernight and analysed.
2.3.1.3 DFR
The field sample with 20 ml water and 5 ml dichloromethane was extractedliquid-liquid with 3 x 10 ml dichloromethane, filtered through anhydrousNa2SO4, evaporated to dryness. For pesticides analysed on GC/ECD, thesamples were cleaned-up on gelfiltration as described for dermal exposure.For pesticides analysed on GC/NPD the samples were resuspended in 2 mlethyl acetate and analysed.
2.3.1.4 Inactive media
Filter paper used for measuring deposition of pesticides were placed in 30ml methanol, shake well for 5 minutes, stored overnight at +5ºC withappropriate solvent for GC-analysis (ethylacetate) and HPLC(methanol/water or acetonitrile/water) (Merck 14291).
2.3.2 Detection
2.3.2.1 GC-conditions
The typical GC-conditions for the HP-5890 were as follows, but the oventemperature program could deviate slightly due to problems with separatinginterfering peaks.

16
2.3.2.1.1 Injector
The HPGC 5890 was equipped with a temperature programmable injectortype Gerstel, CIS-3. This type of injector ensure reduced thermaldecomposition in the injector and allow large injection volumes (this modelup to 10 µl with practically no solvent peak). Initial temperature: 85°C.Initial time: 30 s. Solvent purging: 30 s. Splitless time 60 s. Injectortemperature programme: 12°C/s. Final temp: 250°C. Final time: 600 s.
2.3.2.1.2 Detectors
ECD
Column: HP-5 cat. no. 19091J-012. Inner diameter: 0.32 mm.Film thickness 0.17 µm. 25 m long.Column gas: 1.44 ml N2/min
Make-up gas: 60 ml N2/minAnode purge: 6 ml N2/min.Det. temp: 300°C
Oven initial: 40°C in 90 sTemperature programme: 15°C/min. to 270°CFinal time: 5 min.
NPD
Column: HP-1. Cat. no. 19091Z-105. Inner diameter: 0.2 mmFilm thickness: 0. 33 µm. 3 m longColumn gas: 1 ml N2/min
H2: 3-4 ml/minMake-up gas: 30 ml N2/mlDet. temp: 220°C
Oven initial: 100°C in 90 sTemperature programme: 25°C/min. to 250°CFinal time: 0 s
2.3.2.2 HPLC-conditions
The HPLC, HP 1050, was equipped with a diode array detector, DAD and aquaternary pump. Column: HP Sperisorb-ODS-1, no. 79924-01-584, 5 µm,250 mm x 4 mm.Flow: 1 ml/min
Solvents and wavelengths
Endosulfan80% acetonitrile/20% water. 215 nm
17
Methomyl35% methanol/65% water. 234 nm
Mercaptodimethur70% methanol/30% water. 225 nm
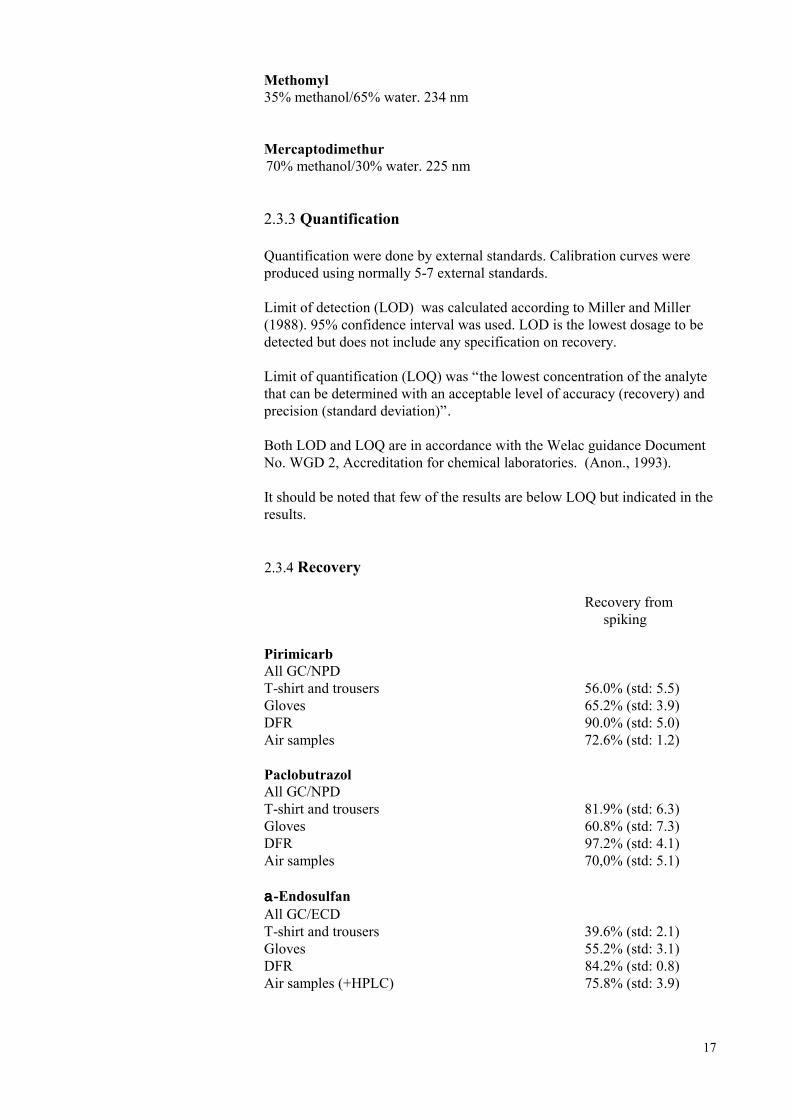
2.3.3 Quantification
Quantification were done by external standards. Calibration curves wereproduced using normally 5-7 external standards.
Limit of detection (LOD) was calculated according to Miller and Miller(1988). 95% confidence interval was used. LOD is the lowest dosage to bedetected but does not include any specification on recovery.
Limit of quantification (LOQ) was “the lowest concentration of the analytethat can be determined with an acceptable level of accuracy (recovery) andprecision (standard deviation)”.
Both LOD and LOQ are in accordance with the Welac guidance DocumentNo. WGD 2, Accreditation for chemical laboratories. (Anon., 1993).
It should be noted that few of the results are below LOQ but indicated in theresults.
2.3.4 Recovery
Recovery fromspiking
PirimicarbAll GC/NPDT-shirt and trousers 56.0% (std: 5.5)Gloves 65.2% (std: 3.9)DFR 90.0% (std: 5.0)Air samples 72.6% (std: 1.2)
PaclobutrazolAll GC/NPDT-shirt and trousers 81.9% (std: 6.3)Gloves 60.8% (std: 7.3)DFR 97.2% (std: 4.1)Air samples 70,0% (std: 5.1)
aaaa-EndosulfanAll GC/ECDT-shirt and trousers 39.6% (std: 2.1)Gloves 55.2% (std: 3.1)DFR 84.2% (std: 0.8)Air samples (+HPLC) 75.8% (std: 3.9)

18
ß-EndosulfanAll GC/ECDT-shirt and trousers 95.7% (std: 3.7)Gloves 97.6% (std: 5.8)DFR 76.6% (std: 2.7)Air samples (+HPLC) 79.4% (std: 5.2)
MethomylT-shirt and trousers (HPLC) 78.0% (std: 10.3)Gloves (HPLC) 68.4% (std: 5.4)DFR (HPLC) 94.6% (std: 4.7)Air samples (GC/NPD) 91.3% (std: 3.9)
MercaptodimethurT-shirt and trousers (HPLC) 87.8% (std: 2.2)Gloves (HPLC) 77.8% (std: 4.6)DFR (HPLC) 94.7% (std: 2.4)Air samples (GC/NPD) 67.7% (std: 3.9)
All results are adjusted for recovery.

19
3 Results
3.1 Experiment no. 1
Experiment started: 1-10-1993Experiment finished: 4-10-1993
Abstract
Mini roses grown in plastic pots was sprayed pirimicarb with an automatichydraulic boom sprayer.
One working procedure was investigated. Four persons were trimming rosecuttings for propagation with a pair of scissors. No DFR was measured.
At reentry the air only contained few µg/h of pirimicarb at respiration rate of20 L/minutes.
Exposure of four workers trimming rose cuttings after 3810 minutes reentryinterval was 146 µg/8 hours (geometric mean and 1400 µg/8 hours as the90% fractile). The 90% fractile is calculated on a very limited number ofworkers and should be interpreted carefully.
Spray data
Sprayed: 1-10-1993, 15.00 pmReentry after: 3810 minutesPesticide: Pirimor G (50% pirimicarb)Spray equipment: Automatic hydraulic spray boomNozzle type: Tee jet 11001Spray pressure: 4.5-5 barPosition ofspray equipment: The spray boom had nozzles directed forward in
an angle of 45° to the table surface. The orifice ofthe nozzles were at a distance of 40 cm from theculture. The culture was sprayed twice. At thesecond spray the direction of the spray boom wasreversed and so was the nozzles in order to get abetter penetration of the spray solution into theculture.
Spray conc.: 50 g x 50%/100 L = 0.25 ‰Spray volume: Normal volume: 79 L/378 m² = 209 L/1000 m²
Reduced volume (increased boom speed):60.5 L/378 m² = 160 L/1000 m² (76% of normalvolume)
Spray dosage: Normal dosage: 209 L x 0.25 ‰/1000 m² = 52.3 gpirimicarb/1000 m²Reduced dosage: 160 L x 0.25 ‰/1000 m² = 40 gpirimicarb/1000 m²

20
Area sprayed: 6336 m²
Physical parameters of the green house
Area: 132 m x 48 m = 6336 m²Cross sectionarea: (48 m x 3.2 m)+(2.9 m x 0.5 x 48 m) = 223.2 m²Volume: 132 m x 223.2 m = 29462 m³Fans: 3 meters above the plants ventilators was mounted
in order to increase wind velocity between theplants and in this way reduce the humidity. If R.H.exceeded 78%, the ventilators started.
Top windows: Yes, only opened very little in the course of theexperiment
Tables: Aluminium tables 3.5 x 1.5 m = 5.25 m²/table
Culture
The experiment was made in different varieties of potted roses (Rosa-hybride) belonging to the groups Parade® and Patiohit®. Most of the plantswere grown in 10.5 cm pots, each with four cuttings. At the spraying theplant height was approximately 20 cm high from rim of pot to the top of theplant. The plants were cut 2 times during the period of production. Thecutted material was used for cuttings.
Working procedure
After the spraying Friday afternoon, the culture was left until Mondaymorning when the upper part of the roses was machine cut. The cuttingswere delivered in buckets built into the tables where the workers weresitting.
The investigated working procedure started when these cuttings weremanually trimmed with a pair of scissors. The cuttings were held in the lefthand. All workers were right handed.
Results
Air samples
Air samples were taken before the spraying, when the spraying was doneand 64 minutes, 450 minutes, 1050 minutes, 1245 minutes and 2745 minutesafter the spraying. The sampling tubes were placed immediately above thesurface of the culture, oriented with the sampler inlet downwards. One pumpwas placed in each of the two areas sprayed, normal dosage and reduceddosage.
Air sampling before spraying showed less than 3.5 µg/hour at 20 L/minrespiration rate. The pumping period was 135 min.

21
Fig. 1.1 shows the sum of concentration of particles and gasses up to 2 daysafter spraying. At this point, the exposure via inhalation were below 2µg/hour at a respiration rate of 20 L/min for the normal spray dosage. Thefirst sampling, 64 min. after spraying was performed during the spraying i.e.in the spray mist. Both dosages seems to be at the same level while spraying.450 min. after the spraying, the air above the culture receiving the reduceddosage, is clearly reduced compared to the normal dosage. After one day nodifference between the two curves is seen.
Exposure
Due to the type of work, only hand exposure was registered. The exposuretime was 240 minutes. The results is illustrated in fig. 1.2. The totalexposure was for the four persons: 57.1, 97.6, 183.2 and 494.4 µgpirimicarb/8 hour. The geometric mean is calculated to 146 µg/8 hour (±standard deviation = 382 and 56 µg pirimicarb/8 hour). The 90% fractile iscalculated to 1.4 mg/8 hour. Arith. mean: 207±199.
Climatic conditions
The temperature during the experiment was 20-24°C. R.H. was measured tobe from 70-85%.
Fig. 1.3 illustrates the light intensity corrected for physical shadows. It isseen that at this time of the year, the net light influx is rather low and isstarted around 07.00 am and finished around 17.30 pm. Fig. 1.3 alsoillustrates that the top mounted windows practically speaking, was closedduring the period.

22
Figure 1.1Pirimicarb (sum of particles aerosols and gasses) in the air after sprayingmini roses with hydraulic boom sprayer. Samples taken 10 cm above thesprayed plants.
Pirimicarb (sum af partikler, aerosoler og gasser) i luften efter sprøjtning afminiroser med hydraulisk bomsprøjte. Prøver taget 10 cm over de sprøjtedeplanter.

23
Figure 1.2Exposure on hands of 4 persons trimming rose cuttings with a pair ofscissors. Reentry 3810 minutes after spraying. Sum of both hands for eachperson: Geom. mean: 146 µg pirimicarb ± 382 µg and 56 µg pirimicarb/8h. 90% fractile 1400 µg pirimicarb/8 h.
Håndeksponering på 4 personer der trimmer rosenstiklinger med saks. Re-entry 3810 minutter efter sprøjtningen. Sum for begge hænder for hverperson: Geom. gennemsnit.: 146 µg pirimicarb ± 382 µg og 56 µgpirimicarb/8 t. 90% fractil: 1400 µg pirimicarb/8 t.
Figure 1.3Light intensity in klux and percentage opening of the two top mountedwindows (average percentage).Lysintensitet i klux og gennemsnitlig procent åbning af vinduerne.

24
3.2 Experiment no. 2
Experiment started: 29-04-1996 and 06-05-1994Experiment finished: 09-05-1994
Abstract
Cultures of mini roses were sprayed pirimicarb with a hydraulic boomsprayer.
Reentry was done after 3725 minutes (2.6 days) and 13834 minutes (9.6days). Out of the 9.6 days the rose cutting were placed at 5°C storage afterbeing cut. At 3725 minutes DFR was 0.60 µg pirimicarb/50 cm² leaf area(=60% of LOQ). At 13834 minutes DFR was 0.35 µg/cm² leaf area (=30%of LOQ).
One working procedure was investigated, with a pair of scissors rosecuttings were trimmed for propagation. Only hand exposure was registered.Transfer coefficient for 3725 minutes reentry was 4466 cm²/h and forreentry after 13824 minutes was 1323 cm²/h, geometric mean, 2097 cm²/husing 90% fractile for exposure of the five workers.
Pirimicarb in air samples at reentry after 3725 minutes was 2 to 3 µg/8 h atrespiration rate of 20 L/minute.
Pirimicarb was found on heating tubes, aluminium tables and glass wallsafter spraying. A fast disappearance was registered. At reentry 3725minutes after spraying the residues were 0.05%, 1.3% and 0.01% of initialspray dosage respectively
Spray data
Sprayed: 29-04-1996 or 06-05-1994, 15.40 pmReentry after: 3725 minutes (sprayed 06-05-1996) or
13824 minutes (=9.6 days), sprayed 29-04-1996, cut after 3700 minutes and left at 5°C for one week before trimming
Pesticide: Pirimor G (50% pirimicarb)Spray equipment: Automatic hydraulic boom sprayerNozzle type: Tee-jet 11001Spray pressure: 5.5 barPosition ofspray equipment: The spray boom had nozzles directed
forward in an angle of 45° to the table surface. The orifice of the nozzles were at a distance of 40 cm from the culture. The culture was sprayed twice. At the second spray the direction of the spray boom was reversed and so was the nozzles in order to get a better penetration of the spray solution into the culture.
Spray conc.: 50 g x 50%/100 L = 0.25 ‰
25
Spray volume: 296.8 L/1000 m²Spray dosage: 296.8 L x 0.25 ‰/1000 m² = 74.2 g/1000 m²Area sprayed: 6336 m²
Physical parameters of the green house
Area: 132 m x 48 m = 6336 m²Cross sectionarea: (48 m x 3.2 m)+(2.9 m x 0.5 x 48 m) =
223.2 m²Volume: 132 m x 223.2 m = 29462 m³Fans: 3 meters above the plants ventilators was
mounted in order to increase wind velocity between the plants and in this way reducethe humidity. If R.H. exceeded 78%, the ventilators started.
Top windows: YesTables: Aluminium tables 3.5 x 1.5 m = 5.25
m²/table
Culture
The experiment was made in different varieties of potted roses (Rosa-hybride) belonging to the groups Parade® and Patiohit®. Most of the plantswere grown in 10.5 cm pots, each with four cuttings. At the spraying theplant height was approximately 20 cm high from rim of pot to the top of theplant. The plants were cut 2 times during the period of production. Thecutted material was used for cuttings.
Working procedure
After the spraying Friday afternoon, the culture was left until Mondaymorning when the upper part of the roses was machine cut. The cuttingswere delivered in buckets built into the tables where the workers weresitting.
The investigated working procedure started when these cuttings weremanually trimmed with a pair of scissors. The cuttings were held in the lefthand.
Results
Air samples
Air samples were taken 0.5 m above the rose culture, 300 min. before and20, 60, 140, 525, 1220, 2750, 4195, and 5635 minutes after the spraying.LOQ = 6 µg pirimicarb/sample for 20 L/min. All figures in fig. 2.1 areabove LOQ, except gas measurements for the last two samples (4195 and5635 minutes).

26
Fig. 2.1 clearly illustrates the domination of particles and aerosols comparedto the gasses. Only from 60 min. to 500 min. after spraying there seems to bea log-normal relationship. The inhalation expose at reentry seems to be inthe area of 2.4 µg pirimicarb/8 hours at an inhalation rate of 20 L/minutes.Reentry in this context means that the workers are in the spraying zone (andnot in the area where the workers were trimming the rose cuttings).
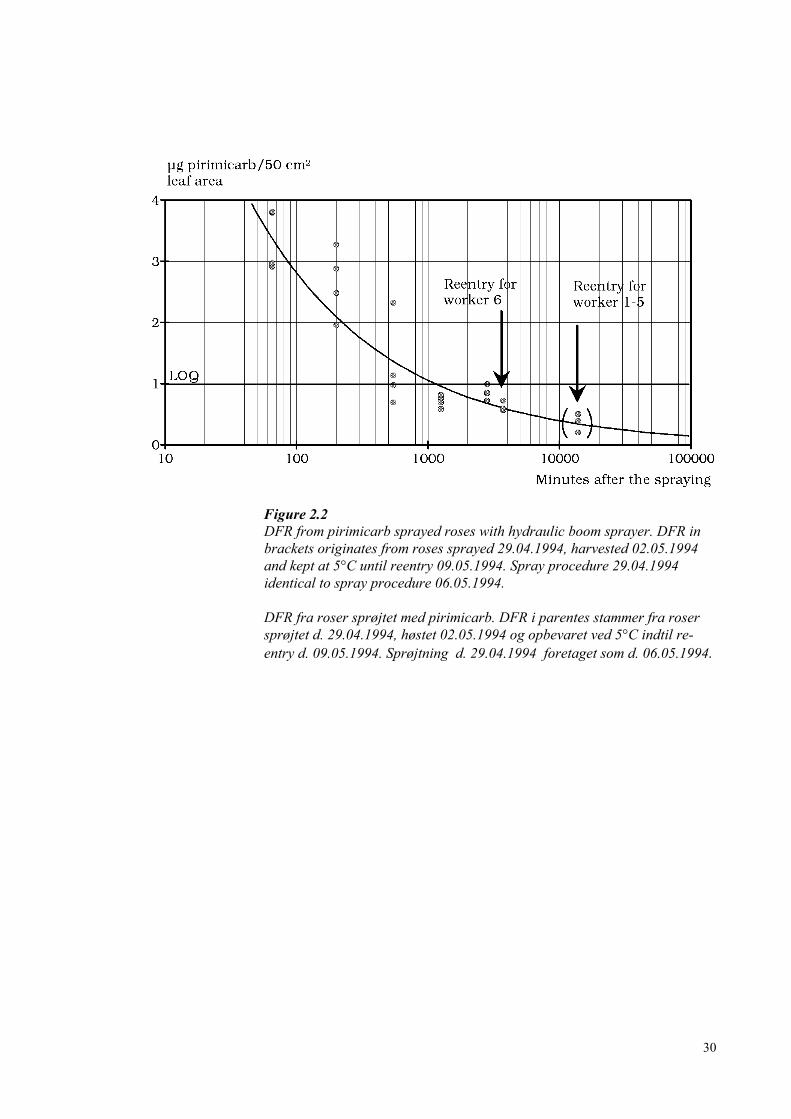
DFR
Samples were taken 205 min before spraying and 65, 200, 545, 1250, 2810,and 3725 min after spraying. 20 discs each with an area of 2.5 cm² wererandomly sampled.
Fig. 2.2 shows the DFR. LOQ = 1 µg pirimicarb/50 cm² leaf area or 0.2 gpirimicarb/1000 m² greenhouse. This amounts to 0.27% of the initial spraydosage. LOQ is reached after 1000 min. and, therefore, the DFR indicatedbelow 1 µg/50 cm² is not validated in the method.
At reentry 3725 min. after spraying DFR was 0.60 µg pirimicarb/50 cm²(60% of LOQ. 60 min. after spraying DFR is between 3 and 4 µgpirimicarb/50 cm² (= 1% of initial sprayed dosage). Worker 6 was trimmingleaves sprayed 06-05-1994.
DFR was also measured on rose leaves sprayed 29-4-95 with the same spraydosage. The DFR was approximately 30% of LOQ and therefore notquantified, but apparently lower than 3725 min after spraying 06/05/1994.
The leaves sprayed 29-04-94 were cut 3700 min. after spraying, left at lowtemperature (5°C) for one week and trimmed by workers 1-5.
Exposure
Exposure was measured on a full body dosimeter consisting of long sleevedT-shirt and long trousers of cotton. Hand exposure was measured on cottongloves. LOQ was 10 µg pirimicarb/8 h for hands, T-shirt and pants.
Five workers (worker 1-5, fig 2.3) all right handed, were trimming rosecuttings sprayed 9.6 days earlier (29-04-1995). Only exposure on the handscould be detected. Geometric mean for these five workers was 74 µgpirimicarb/8 hours, ± one standard deviation from 92 to 74 µg pirimicarb/8hours. 90% fractile was 117 µg pirimicarb/8 hour.
Fig. 2.3 clearly reflects the working procedure: the scissors were held in theright hand and the cuttings in the left hand.
Worker no. 6 was working with cuttings sprayed 2.6 days earlier (06-05-1994). Fig. 2.3 shows a 4 to 7 times higher exposure. In this case, the righthand on this right handed worker received the highest load. The exposuretime for both groups was 505-510 min.
Transfer coefficients

27
All exposure of pirimicarb by this working procedure was concentrated onthe hands.
One worker was exposed to pirimicarb 3725 min. (2.6 days) after spraying.DFR was 0.6 µg pirimicarb/50 cm², fig. 2.2 and the exposure was 428.7 µgpirimicarb/8 hours, fig 2.3.
Transfer coefficient for hand exposure was:
428.7 µg x 50 cm²/8 h x 0.6 µg = 4466 cm²/h.
Five workers were exposed to pirimicarb sprayed 13805 min. (9.6 days)before reentry. DFR was 0.35 µg pirimicarb/50 cm² and exposure was 74.09µg pirimicarb/8 hours (geometric mean).
The transfer coefficient is calculated to:
74.09 µg x 50 cm²/8 h x 0.35 µg = 1323 cm²/h
But using the 90% fractile of this group of five workers, 117.45 µgpirimicarb/8 h, the transfer coefficient is calculated to:
117.45 µg x 50 cm²/8 h x 0.35 µg = 2097 cm²/h
It should be emphasised that DFR is well below LOQ and best estimates.
Analysis of inactive media in the green house
Heating tubes
Painted heating tubes, horizontally mounted along the glass wall, approxi-mately 1.2 m above the floor, were analysed for residues of pirimicarb. Thesampling area was of 30 cm's length on a 42 mm diam. steel tube. Thesamples were taken 230 min. before the spraying, 40 minutes and 3965minutes after the spraying. The first sampling after the spraying was takenat exactly the same place as before the spraying. The consecutive samplingwas done at a new place.
Fig. 2.4 illustrates the disappearance of pirimicarb. The dosage after 40minutes averages 2.7 µg pirimicarb/126 cm² (=0.2 g pirimicarb/1000 m² =0.3% of initial spray dosage).
Recovery was not done on the painted heating tubes, because the layer ofpaint was heterogeneous and we only wanted to express what was looselybound to the surface of the tubes. This is probably the reason for therelatively low load on tubes compared to the glass walls. But also the hightemperature on the heating tubes will of course evaporate pirimicarb.
Aluminium tables
The rim of the tables were investigated for spray deposits. The rim wasconstructed of aluminium profiles 15 cm high and 2.5 cm wide. Samples
28
were taken on a 30 long piece of the rim. Horizontal area was then 75 cm².Vertical area: 450 cm².
Samples were taken 145 minutes before spraying and 25 minutes and 4020minutes after spraying. The first sampling after spraying was taken atexactly the same place as before spraying. The consecutive five sampleswere taken at new places.
Fig. 2.5 illustrates the disappearance of pirimicarb from the rim of the tablesin the greenhouse. The plants have been sprayed one week before and thelevel of pirimicarb before spraying is indicated. The level before spraying isassumed to be of the same magnitude after one week (10080 min.) and inorder to support the picture of disappearance of pirimicarb, this level isused. If the horizontal area is receiving the majority of the dosage: 20 µgpirimicarb/25 cm² ~ 2.67 g/1000 m² = 3.6% of initial dosage sprayed on theplants, is found after 25 min. The reason for this low dosage is that the plantto a high degree was covering the table rim for the spray mist.
The background after one week was approximately 0.5% of the initialdosage. The disappearance of pirimicarb within one week was tenfoldwhich means, a half life of 2 days.
Glass wall
225 cm² of the vertical glass wall was rinsed with ethanol in order to removedeposits of pirimicarb. Samples were taken before the spraying and 60minutes and 3995 minutes after the spraying. The first sampling afterspraying was taken at exactly the same place as was washed beforespraying. The consecutive samples was taken at a new place.
Fig. 2.6 illustrates the disappearance of pirimicarb from the glass. Thesample before spraying was well below even LOD. The plants were sprayedone week before spraying and this finding was accepted as a backgroundafter one week. Therefore, it is used at time 10080 min. after spraying tosupport the illustration of disappearance of pirimicarb.
After 60 minutes 20 µg/225 cm² was detected which corresponds to 0.9g/1000 m² (= 1.2 % of the initial dosage sprayed on the plants). The level isthe same as at the table rims after 2.5 days, but much lower after one week.
Climatic conditions
The temperature during the experiment was 22-24°C, R.H. varied between70-85%. Light intensity in klux corrected for physical shadows and theaverage percentage opening of the two top mounted windows is illustratedon fig. 2.7
Fig. 2.7 shows a rather high net flux of radiation in the period after thespraying. It is also seen that the windows practically speaking was closedafter the spraying, until the next day at 10-11 am. when the windowsbecause of the rising influx start to open.

29
Figure 2.1Pirimicarb in the air after spraying mini roses with hydraulic boom sprayer.Samples taken 50 cm above the plants. At the last two sample times, thegasses were below LOQ. Samples taken before spraying were below LOD.
Indhold af pirimicarb i luften efter sprøjtning af miniroser med hydrauliskbomsprøjte. Prøver taget 50 cm over planterne. Prøver taget førsprøjtningen samt ved de sidste to prøveudtagninger var indholdet iprøverne mindre end LOQ.
30
Figure 2.2DFR from pirimicarb sprayed roses with hydraulic boom sprayer. DFR inbrackets originates from roses sprayed 29.04.1994, harvested 02.05.1994and kept at 5°C until reentry 09.05.1994. Spray procedure 29.04.1994identical to spray procedure 06.05.1994.
DFR fra roser sprøjtet med pirimicarb. DFR i parentes stammer fra rosersprøjtet d. 29.04.1994, høstet 02.05.1994 og opbevaret ved 5°C indtil re-entry d. 09.05.1994. Sprøjtning d. 29.04.1994 foretaget som d. 06.05.1994.

31
Figure 2.3Exposure on hands after trimming pirimicarb sprayed rose cuttings.Workers no. 1 to 5, trimming cuttings 13824 minutes after spraying (9.6days. 7 days out of the 9.6 days on cold storage). Worker no. 6 wastrimming cuttings 3725 minutes (2.6 days) after spraying. Worker 1-5:Geometric mean: 74 µg pirimicarb/8 h ± one std. = 74 to 92 µgpirimicarb/8 h. 90% fractile = 117µg pirimicarb/8 h.
Eksponering med pirimicarb på hænderne ved trimning af rosenstiklinger.Person 1 til 5 trimmede stiklinger 13824 minutter efter udsprøjtning (=9.6dage. 7 dage ud af 9.6 dage på køl.). Person nr. 6 trimmede stiklinger 3725minutter (=2.6 dage) efter sprøjtning. Person 1 til 5: Geometriskgennemsnit: 74 µg pirimicarb/8t ± en standardafvigelse = 74 - 92 µgpirimicarb/8t. 90% fraktil = 117 µg pirimicarb/8t.

32
Figure 2.4Residues of pirimicarb on heating tubes after spraying with hydraulic boomsprayer at a distance of 5 meters. The greenhouse was sprayed 29.04.1994and 06.05.1994. The figures in brackets are transferred from just beforespraying 29.04.1994 and not actual measurements on the time indicated onthe scale.
Rester af pirimicarb på varmerør efter sprøjtning med hydrauliskbomsprøjte i en afstand på 5 m.Væksthuset blev sprøjtet d. 29.04.1994 og d.06.05.1994. Tallene i parentes er overført fra før sprøjtning og ikkemålinger foretaget som vist.

33
Figure 2.5Residues of pirimicarb on the aluminium table rim. The plants were sprayed29-04-1994 and 06-05-1994. The figures in brackets are data transferredfrom just before spraying 29-04-1994 and not actual measurements on thetime indicated of the scale.
Rester af pirimicarb på aluminiumsbordkanter. Planterne blev sprøjtet d.29.04.1994 og d. 06.05.1994. Tallene i parentes er overført fra førsprøjtning og ikke målinger foretaget som vist.

34
Figure 2.6Residues of pirimicarb on the glass wall. The greenhouse was sprayed29.04.1994 and 06.05.1994. The figures in brackets are data transferredfrom just before spraying 29.04.1994 and not actual measurements on thetime indicated on the scale.
Rester af pirimicarb på glasvægge. Planterne blev sprøjtet d. 29.04.1994 ogd. 06.05.1994. Tallene i parentes er overført fra før sprøjtning og ikkemålinger foretaget som vist.
Figure 2.7Light intensity in klux and the average percentage opening of the two topmounted windows.Lysintensitet i klux og gennemsnitlig procent åbning af vinduerne.

35
3.3 Experiment no. 3
Experiment started: 01-01-1995Experiment finished: 03-03-1995
Abstract
Cultures of Kalanchoë blossfeldiana were grown in plastic pots placed onaluminium tables.
At reentry, 2573 min after the spraying, DFR was measured to be 8 µgpirimicarb/62.5 cm² leaf area.
Two persons were making cuttings for propagation at the tables. No handexposure could be detected and therefore is transfer coefficient notavailable.
Air samples taken in the green house at reentry showed 0.5 µg pirimicarb/hat a respiration rate of 20 L/minute. Personal monitoring of air showed a 5to times higher value, especial of the fraction particles and aerosols,indication the working procedure as reason for this higher level.
Heating tubes, glass walls and aluminium tables were analysed for residuesshortly after the spraying and compared to initial spray dosage therespectively deposits were 0.45%, 0.04% and 1.1%. A rapid disappearanceof pirimicarb was observed.
Spray data
Sprayed: 01-03-1995, 01.00 pmReentry after: 2573 minutesPesticide: Pirimor G (50% pirimicarb)Spray equipment: Hand-held hydraulic rifleNozzle type: 1553 (25-30)Spray pressure: 75 barPosition ofspray equipment: Pump, hose and rifle was in the green house
when sprayed. Manual indirect (75 bar!) spraying.
Spray conc.: 75 g x 50%/50 L = 0.5 ‰Spray volume: 446 l/1000 m²Spray dosage: 446 L x 0.5/1000 x 1000 m² = 223 g/1000
m²Area sprayed: 168 m²
Physical parameters of the green house
Area: 20.9 m x 10 m = 209 m²

36
Cross sectionarea: (10 m x 2.5 m)+(2.5 m x 0.5 x 10 m)=37.5
m²Volume: 20.9 m x 37.5 m² = 784 m²Fans: NoTop windows: Yes
Cultures
The experiment was carried out in different varieties of Kalanchoëblossfeldiana.
Working procedure
Two persons were making cuttings for propagation. The working procedurewas performed at the tables which has been sprayed.
Results
Air samples
Air samples have been taken 1.60 m above the floor, 30 cm above thesprayed plants. Air samples were taken just before the spraying, 35 minutes,203 minutes, 1253 minutes and 2543 minutes after the spraying. The resultsare seen in fig 3.1. At reentry 2573 minutes after the spraying the level ofpirimicarb/hour at a respiration rather of 20 L/min was approximately 0.5µg pirimicarb.
DFR
Dislodgeable foliar residue was measured 180 minutes before the sprayingand 153 minutes, 2783 minutes and 2913 minutes after the spraying. Theresults are illustrated in fig. 3.2. The spray volume was in excess. DFR was40 µg pirimicarb/62.5 cm² leaf area and corresponds to 6.4 g pirimi-carb/1000 m² (=2.9% of the initial spray dosage).
At reentry, 2573 minutes after the spraying, DFR was approximately 8 µgpirimicarb/62.5 cm² leaf area.
Exposure
Two workers carried a full body dosimeter through the entire experiment,155 minutes. LOQ = 50 µg/8 h.
Reentry was done 2573 min. after spraying. Nothing was measured on thehands. The only body part exposed to pirimicarb on person 1 was the rightarm, 73 µg pirimicarb/8 h. On person 2, 68 µg pirimicarb/8 h was detectedon the chest.

37
This is an interesting finding. DFR was found in relatively large quantities,but practically nothing on the workers. The spray volume was used inexcess. Kalanchoë blossfeldiana is almost a succulent and might haveabsorbed the systemic pirimicarb to a very high degree.
The DFR samples were taken by punching the leaves and maybe extractedthe absorbed insecticide from the plant sap. If this is so, a rapid metabolismoccur in the plant by looking at fig. 3.2.
The two persons have carried air pumps for monitoring pirimicarb in the airwhile working.
The sample tube were fixed on the two persons in the breathing zone.Person 1 was measured for 95 minutes and person 2 for 150 minutes. Theresults are illustrated in fig. 3.3. The figures are 5 to 6 times higher than thebackground illustrated in fig. 3.1, which shows less than 0.5 µgpirimicarb/hour at 20 L/minutes at reentry.
Transfer coefficients
Nothing was found on the hands, therefore transfer coefficients are notcalculated.
Analysis of inactive media in the green house
Heating tubes
Heating tubes mounted along the glass wall 1.70 m above the floor wasanalysed for pirimicarb 90 minutes before spraying and 145 minutes, 2720minutes and 2982 minutes after the spraying. The results are illustrated infig. 3.4. 13 µg pirimicarb/129 cm² tube area, was detected after the first 60minutes (horizontal cross section), which equals 1 g/1000 m², (=0.45% ofinitial spray dosage). The tubes were not sprayed directly, but were only 2.5metres away from the sprayed tables. A rapid disappearance of pirimicarb isobserved.
Glass walls
Glass walls, 20 cm × 20 cm were analysed for residues of pirimicarb 90minutes before spraying and 130 minutes, 2730 minutes and 2980 minutesafter the spraying. The results are seen in fig. 3.5.
No residues could be detected before spraying, LOD was 0.08 µg/sample.
3.4 µg pirimicarb/400 cm² glass wall after 90 minutes after the spraying,corresponds to 0.09 g/1000 m² (=0.04% of initial spray dosage).
38
Tables
The rim of the aluminium tables were analysed for residues of pirimicarb.The vertical side of the rim, 13.5 cm × 30 cm were extracted with ethanol60 minutes before spraying, 140 minutes, 2730 minutes and 2930 minutesafter the spraying. The results are illustrated in fig 3.6. No residues ofpirimicarb were detected before the spraying. LOD = 0.08 µg pirimicarb/-sample.
60 minutes after the spraying was detected 100 µg pirimicarb/405 cm² tablerim equals to 2.5 g/1000 m² (=1.1% of initial spray dosage). The reasons forthis apparently low residue on the table rim are a the table rim had only avertical surface, excess volume of spray solution and a heavy plant cover.
Climatic conditions
The green house was not equipped with automatic registration of theclimatic parameters. Only temperature was registered with a thermometerhung up just above the plants.
The temperature varied from 01-03-1995 10.00 am to 03-03-1995 16.00 pmbetween 19 and 22°C.

39
Figure 3.1Pirimicarb in the air after spraying Kalanchoë with high pressure riflesprayer. Samples taken 1.6 m above the floor and 30 cm above the plants.
Pirimicarb i luften efter sprøjtning af Kalanchoë med højtryksriffel. Prøverudtaget 1.6 m over gulv og 30 cm over planterne
Figure 3.2DFR of pirimicarb on Kalanchoë after spraying with high pressurehydraulic rifle.
DFR af pirimicarb på Kalanchoë efter sprøjtning med højtryksriffel.

40
Figure 3.3Pirimicarb in the air detected by personal air monitors from two workerscutting Kalanchoë sprayed with high pressure hydraulic rifle.
Pirimicarb i luften målt i åndedrætszonen på to personer der fremstillerstiklinger på Kalanchoë sprøjtet med højtryksriffel.
Figure 3.4Residues of pirimicarb on painted heating tubes after spraying with highpressure hydraulic rifle sprayer.
Rester af pirimicarb på malede varmerør efter sprøjtning med højtryksriffel.

41
Figure 3.5Residues of pirimicarb on glass walls after spraying with high pressure riflesprayer.
Rester af pirimicarb på glasvægge efter sprøjtning med højtryksriffel.
Figure 3.6Residues of pirimicarb on the vertical rim after spraying with high pressurehydraulic rifle sprayer.
Rester af pirimicarb på lodrette bordkanter efter sprøjtning medhøjtryksriffel.

42
3.4 Experiment no. 4
Experiment started: 02-06-1995Experiment finished: 05-06-1995
Abstract
Mini roses grown in plastic pots was sprayed pirimicarb and methomyl inthe same spray solution with an automatic hydraulic boom sprayer.
Only air sampling was done. Methomyl was below 1 µg/8 h at a respirationrate of 20 L/minute 1170 minutes after the spraying. Pirimicarb wasdetected 3.22 µg/h at respiration rate of 20 L/minute 1170 minutes after thespraying. After 2750 minutes 0.46 µg pirimicarb/h at respiration rate of 20L/minute was detected.
Spray data
Sprayed: 02-06-1995, 03.40 pmReentry after: No reentryPesticide: A mixture of:
Pirimor G (50% pirimicarb) andLannate 20 (20% methomyl)
Spray equipment: Automatic hydraulic spray boomNozzle type: Tee-jet 11001Spray pressure: 4.5-5 barPosition ofspray equipment: The spray boom had nozzles directed
forward in an angle of 45° to the table surface. The orifice of the nozzles were at a distance of 40 cm from the culture. The culture was sprayed twice. At the second spray the direction of the spray boom was reversed and so was the nozzles in order to get a better penetration of the spray solution into the culture.
Spray conc.: Pirimicarb:50 g x 50%/100 L = 0.25 ‰Methomyl:50 g x 20%/100 L = 0.1 ‰
Spray volume: 298 L/1000 m²
Spray dosage: Pirimicarb:298 L x 0.25 ‰/1000 m² = 74.5 g/1000 m²
Methomyl:298 L x 0.1 ‰/1000 m² = 29.8 g/1000 m²
Area sprayed: 6336 m²
43
Physical parameters of the green house
Area: 132 m x 48 m = 6336 m²Cross sectionarea: (48 m x 3.2 m)+(2.9 m x 0.5 x 48 m) =
223.2 m²Volume: 132 m x 223.2 m = 29462 m³Fans: 3 meters above the plants ventilators was
mounted in order to increase wind velocity between the plants and in this way reduce
the humidity. If R.H. exceeded 78%, the ventilators started.
Top windows: YesTables: Aluminium tables 3.5 x 1.5 m = 5.25
m²/table
Culture
The experiment was made in different varieties of potted roses (Rosa-hybride) belonging to the groups Parade® and Patiohit®. Most of the plantswere grown in 10.5 cm pots, each with four cuttings. At the spraying theplant height was approximately 20 cm high from rim of pot to the top of theplant. The plants were cut 2 times during the period of production. Thecutted material was used for cuttings.
Working procedure
No working procedure was measured, only monitoring of pesticide in theair.
Results
Air samples
Air samplers have been placed 50 cm above the sprayed plants. Sampleshave been collected 60 minutes before the spraying, 60 minutes, 170 minu-tes, 500 minutes, 1170 minutes, 1580 minutes, 2750 minutes and 4025minutes after spraying. The results are illustrated in fig. 4.1 and fig. 4.2.
Methomyl could be detected after 1170 min. at 1.34 µg methomyl/8 h afterspraying, LOQ=1 µg methomyl/8 hour at respiration 20 L/min. At 1580minutes after the spraying the concentration in the air was below 1 µgmethomyl/8 h. Pirimicarb was present in the air even 4025 minutes afterspraying, pirimicarb was below LOQ, but raised in the consecutivesampling just above LOQ. Pirimicarb is measured mainly as gasses, whichis in contrast to experiment no. 2, where particles and aerosols weredominating.
Taken in consideration the dosage sprayed, the two insecticides appear atthe same relative concentration in the air and disappear at approximately thesame rate from the air.

44
Climatic data
During the experiment the temperature and % RH was from 22-25°C and63-85% RH. Fig. 4.3 illustrates the light intensity in klux and percentopening of the windows during the experiment.
Figure 4.1Methomyl in the air after spraying mini roses with a mixture of pirimicarband methomyl.
Methomyl i luften efter sprøjtning af roser med en blanding af pirimicarb ogmethomyl.

45
Figure 4.2Pirimicarb in the air after spraying mini roses with a mixture of pirimicarband methomyl.
Pirimicarb i luften efter sprøjtning af roser med en blanding af pirimicarbog methomyl.
Figure 4.3Light intensity in klux and percentage opening of the two top mountedwindows (average percentage).
Lysintensitet i klux og procent åbning af vinduer.

46
3.5 Experiment no. 5
Experiment started: 28-03-1996Experiment finished: 29-03-1996
Abstract
Hedera helix grown in plastic pots was sprayed pirimicarb with a hydraulicboom sprayer.
At reentry, 910 minutes after the spraying, DFR was measured to be 200 µgpirimicarb/50.9 cm² leaf area.
Spacing the pots placed on aluminium tables resulted in a transfercoefficient of 540 cm²/h.
The dosage of pirimicarb inhaled was < 10 µg pirimicarb/h at a respirationrate of 20 L/minute.
Spray data
Sprayed: 28-03-1996, 04.05 pmReentry after: 910 minutes after the sprayingPesticide: Pirimor G (50% pirimicarb)Spray equipment: Automatic hydraulic boom sprayerNozzle type: Hardi 1553-14Spray pressure: 3.5 barPosition ofspray equipment: Spray equipment was moving on rails
mounted above the aluminium tables.Spray conc.: 60 g x 50%/40 L = 0.75 ‰Spray volume: 32.5 L/150 m² = 217 L/1000 m²Spray dosage: 217 L x 0.75 ‰/1000 m² = 163 g
pirimicarb/1000 m²
Area sprayed: 150 m²
Physical parameters of the green house
Only a small part of a conventional green house was used in the experiment.The green house was equipped with aluminium tables, 1.6 m x 3.6 m.Access to the plants was either done by pushing the tables together or onecould get transported on a cart on rails hanging just above the plants. Thetables were pressed together while spraying leaving no space between them.This prevented the sides of the aluminium tables to be contaminated by thespray solution.

47
Cultures
The plants were Hedera helix grown in plastic pots.
Working procedure
One person was manually spacing the pots due to the growth of the plants,while she was removing withered leaves from the plant.
Results
Air samples
Air samplers were placed between the potted plants, sampling 10 cm abovethe surface of the culture. Air samples were taken before the spraying, 60minutes, 390 minutes, 895 minutes and 1302 minutes after the spraying.
LOQ was 20 µg/sample at a respiration rate of 20 L/minutes. Nothing couldbe detected before the spraying in a sampling period of 293 minutes whichmeans < 4 µg pirimicarb/h at a respiration rate of 20 L/minutes. Fig. 5.1illustrates the results.
DFR
DFR was measured before spraying and 910 minutes and 1300 minutes afterthe spraying. 20 discs of each 2.54 cm² leaf area was selected evenlydistributed in the sprayed area.
No DFR was measured before the spraying, not even on LOD-level. LODwas 0.32 µg pirimicarb/50.9 cm² leaf area.
Due to a very short reentry interval, 910 minutes, and still wet leaves even420 minutes after the spraying, only two samplings were done. Fig. 5.2illustrates the results.
At reentry DFR was measured to be 200 µg pirimicarb/50.9 cm² leaf area,which corresponds to 43 g pirimicarb/1000 m² (=26% of initial spraydosage) green house. This DFR is compared to other DFR values in theseexperiments a relative high value.
Exposure
Reentry was done 910 minutes after the spraying. The working procedurelasted for 345 minutes. Fig 5.3 illustrates exposure on the body parts.
86% of the total exposure was detected on the hands and only 14% on therest of the body. The relative high dosage received on an 8 hour basis with asystemic insecticide as pirimicarb is probably due to the short reentry

48
interval, but also due to the high detected DFR compared to what has beenseen in roses in experiment 6.
Personal air monitoring
The worker was equipped with personal air monitor positioned at thebreathing zone. Air samples were taken during the period of working exceptfor 60 minutes due to malfunctioning of the pump, namely 285 minutes.The amount of pirimicarb was measured. The amount of pirimicarbmeasured was 50% of LOD and therefore not quantified in the validatedmethod. 50% of LOD was 5 µg/h at respiration rate of 20 L/minutes.
Transfer coefficients
DFR at start and end of reentry was measured to be 219 and 180 µgpirimicarb/50.9 cm² leaf area. An average of 200 µg pirimicarb/50.9 cm²leaf area is used in calculation of the transfer coefficient.
Transfer coefficient for only hand exposure:
19730 µg x 0.86 x 50.9 cm²/8 h x 200 µg = 540 cm²/h
Climatic conditions
Three climatic parameters are illustrated on fig. 5.4 from 28-03-1996, 06.00am to 29-03-1996, 08.00 am.

49
Figure 5.1Pirimicarb in the air after spraying Hedera helix with hydraulic boomsprayer. Samples taken 10 cm above the sprayed plants. The third samplinglasted longer than programmed due to malfunctioning of the pump.
Pirimicarb i luften efter sprøjtning af Hedera helix med hydrauliskbomsprøjte. Prøverne taget 10 cm over planterne. Den tredieprøveudtagning varede længere end programmeret på grund affejlfunktionering af pumpen.
Figure 5.2DFR of pirimicarb on Hedera helix after spraying with hydraulic boomsprayer.DFR af pirimicarb på Hedera helix efter sprøjtning med hudrauliskbomsprøjte

50
Figure 5.3Percentage distribution of pirimicarb on the body parts of one personspacing pots with Hedera helix sprayed with hydraulic boom sprayer.
Fordeling af pirimicarb på kroppen af en person der stiller Hedera helix påafstand sprøjtet med hydraulisk bomsprøjte.
Figure 5.4Minimum and maximum of three climatic parameters in the green house28.03.1996, 06.00 to 29.03.1996, 08.00.
Minimum og maksimum af tre klimatiske parametre i væksthus fra d.28.03.1994 kl. 06.00 til 29.03.1994 kl. 08.00.

51
3.6 Experiment no. 6
Experiment started: 14-05-1993Experiment finished: 15-05-1993
Abstract
Cultures of cut-roses for cutting, was sprayed pirimicarb with a hand heldhydraulic rifle.
At reentry, 1376 minutes after spraying, DFR was measured to be 1.15 µgpirimicarb/75 cm² leaf area.
Two working procedures were investigated. One was cutting roses forflowers, another removing rose buds. The transfer coefficients for theseworking procedures were 4553 cm²/h and 4838 cm²/h respectively.
Air samples at reentry showed 1.46 µg pirimicarb/8 h at a respiration rate of20 L/minute.
Heating tubes were washed with ethanol and a deposit of 1.9 µg pirimi-carb/136 cm² horizontal cross section area was measured at reentry. Thisamounts to 2.0% of initial spray dosage.
Large volumes of spray solutions were used and the dripping off the roseson the ground was investigated. 1.72% (s=1.90%) of initial spray dosagewas collected on inactive sampling media 305 minutes after the spraying.
Spray data
Sprayed: 14-05-1996, 08.55 amReentry after: 1376 minutesPesticide: Pirimor G (50% pirimicarb)Spray equipment: Hand held hydraulic rifle with 3 nozzlesNozzle type: Hardi 1553-18Spray pressure: 2 barPosition ofspray equipment: The three-nozzle hand held rifle was moun-
ted on a hydraulic hose. The pump wasplaced outside the green house
Spray conc.: 50 g x 50%/10 L = 0.25 ‰ pirimicarbSpray volume: 250 L/708 m² = 353 L/100 m²Spray dosage: 353 L x 0.25 ‰/1000 m²= 88.25 g/1000 m²Area sprayed: 708 m²
Physical parameters of the green house
Area: 11.8 m x 60 m = 708 m²Cross sectionarea: (11.8 m x 2 m)+(2.8 m x 0.5 x 11.8 m)=
40.12 m²

52
Volume: 40.12 m² x 60 m= 2407 m³Fans: No fans installedTop windows: Two rows of top windows
Culture
In the green house was grown roses for flower cutting. The culture wasapproximately 1.6 m high. Six rows of flower beds were separated bywalking paths 0.6 m wide.
Working procedure
Two persons were working in the green house, both doing two differentworking procedures. First both persons were cutting roses in the culture for43 minutes. After this they removed buds from the roses in the culture for70 minutes.
Results
Air samples
Air monitors were mounted in the middle of the green house 1.7 m abovethe ground. Samples were taken in a period of 1060 minutes before thespraying. LOQ was 20 µg pirimicarb/sample at a respiration rate of 20L/minutes. No pirimicarb was detected before the spraying (< 1.1 µgpirimicarb/h at respiration rate of 20 L/minutes).
Samples were also taken from after spraying to 254 minutes, 1405 minutesand 1648 minutes after spraying. Fig. 6-1 illustrates the results.
The finding 1648 minutes after the spraying was < 0.1 LOQ. LOQ was atthis sampling interval calculated to 0.26 µg pirimicarb/h at 20 L/minuterespiration rate.
The reason for this fast disappearance of pirimicarb in the air was probablydue to the high temperature and the open windows during the entireexperiment.
DFR
4 x 30 pieces of 2.5 cm² leaf discs were punched from the roses, evenlysampled all over the green house.
Samples taken before spraying the roses, contained less than LOD = 0.3 µgpirimicarb/75 cm² leaf area.
Samples were also taken 320 minutes and 1475 minutes after spraying. Theresults are illustrated on fig 6.2

53
At reentry 1376 minutes after the spraying, DFR was calculated to be 1.15µg pirimicarb/75 cm² leaf area, which corresponds to 0.15 g pirimi-carb/1000 m² green house (=0.17% of initial spray dosage.
Exposure
Cutting roses resulted in a total body exposure of 3500 and 4200 µgpirimicarb/8 h for the two workers. Working in the dense culture of roses,resulted in larger exposure on the "body÷hands" compared to only "hands".Only 5.3% and 21.9% of the total exposure on the two workers, could bemeasured on the hands. Fig. 6.3 illustrates the results.
Removing the buds from the roses, resulted in a lower total exposure, 670and 1600 µg pirimicarb/8 hour for the two workers. 57.6% and 48.7% wasdetected on the hands. Fig. 6.4 illustrates the results.
Transfer coefficients
At reentry, 1376 minutes after spraying, DFR was calculated to 1.15 µgpirimicarb/75 cm² leaf area.
For two persons cutting roses, the transfer coefficient for hand exposurewas:
Arith. mean:
5585
8
75
1154553 2.
.
µµ
g
h
cm
g cm / h
2
× =
Geom. mean:
416 75
1153391
22µ
µg
8 h
cm cm h× =
./
g
For two persons removing buds from roses, the transfer coefficient for handexposure was:
Arith. mean:
5935 754838
./
µµ
g
8 h
cm
1.15 g cm h
22× =
Geom. mean:
558 2
8
75
1154553
2.
./
µµ
g
h
cm
g cm h2 × =
54
Analysis of inactive media in the green house
Heating tubes
Heating tubes mounted on the side wall of the green house were place 0.7 mabove the floor. The tubes were rinsed with ethanol before the spraying and335 minutes and 1430 minutes after the spraying. The horizontal crosssection area was 136 cm² for each rinse site and four replications wasdistributed evenly along the one side of the green house. LOD was 0.6 µgpirimicarb/136 cm² horizontal cross section area of the tube.
The findings are illustrated in fig. 6.5
Nothing could be detected before the spraying.
335 minutes after the spraying, the average deposition on heating tubes was24.4 µg pirimicarb/136 cm² horizontal cross section area, whichcorresponds to 1.79 g pirimicarb/1000 m² green house (=2% of initial spraydosage).
Compared to DFR this dosage is in the same range at reentry.
Spray pattern
The large spray volume used in this experiment, would presumably result indripping leaves after the spraying. In order to investigate this residue ofpirimicarb on an "inactive soil surface", 62 petri-dishes were placed evenlydistributed in the greenhouse in level with the soil underneath the roses. 305minutes after the spraying, when all petri-dishes were dried up, the disheswere collected, rinsed with ethanol and stored for analysis. The 62 analysisshowed an average deposition of 1.52 g pirimicarb/1000 m² green houseand a standard deviation of 1.68 g/1000 m² (=1.72 % and 1.9% respectivelyof the initial spray dosage). This level is almost the same as found at reentryon heating tubes.
Climatic conditions
The green house was not equipped with any automatic registration ofclimatic parameters.
Only minimum and maximum temperature was registered during theexperiment.
The minimum temperature 15-05-96 was 18.7°C, the maximum temperature31.9°C.
No clouds were present during the experiment.
The windows were opened during the entire experiment.

55
Figure 6.1Pirimicarb in the air after spraying roses with a hand held hydraulic rifle.
Pirimicarb i luften efter sprøjtning af snitroser med håndbåren hydrauliskriffel.
Figure 6.2DFR of pirimicarb on cut-roses after spraying with a hand held hydraulicrifle.
DFR af pirimicarb på snitroser efter sprøjtning med håndbåren hydrauliskriffel.

56
Figure 6.3Percentage distribution of pirimicarb on the body parts of two personscutting roses sprayed with a hand held hydraulic rifle. No indications:< LOQ.
Fordeling af pirimicarb på kroppen af to personer der skærer snitrosersprøjtet med håndbåren hydraulisk riffel. Ingen indikation: < LOQ.

57
Figure 6.4Percentage distribution of pirimicarb on the body parts of two personsremoving buds on roses sprayed with a hand held hydraulic rifle. Noindications: < LOQ.
Fordeling af pirimicarb på kroppen af to personer der fjerner knopper påsnitroser sprøjtet med håndbåren hydraulisk riffel. Ingen indikation: <LOQ.

58
Figure 6.5Residues of pirimicarb on heating tubes after spraying with a hand heldhydraulic rifle.
Rester af pirimicarb på varmerør efter sprøjtning med håndbårenhydraulisk riffel.

59
3.7 Experiment no. 7
Experiment started: 10-08-1994Experiment finished: 11-08-1994
Abstract
Cultures of mini roses were grown in plastic pots and sprayed withpaclobutrazol. The plants were ready for packing and sale the next day.
At reentry, 690 minutes after the spraying, DFR was detected to be 0.6 µgpaclobutrazol/40 cm² leaf.
Three working procedures were investigated. Machine packing, manualpacking and tagging the pots with a plastic stick (=quality control mark).Using arithmetic mean for exposure, the respective transfer coefficientswere 276 cm²/h, 1000 cm²/h and 505 cm²/h
Air samples at reentry showed < 32 µg paclobutrazol/8 h at respiration rate20 L/minute. In the area of packing the plants, the air contained < 35 µg/8 hat respiration rate 20 L/minute. Personal air monitoring was made when twoworkers were tagging the plants. Less than 130 µg paclobutrazol/8 h atrespiration rate of 20 L/minute was detected. In all the air analysis, not eventraces were registered of paclobutrazol.
Paclobutrazol was found on the heating tubes and table rims of thealuminium tables. At reentry, the deposits of paclobutrazol was respectively25.8% and 33.7% of initial spray dosage.
Spray data
Sprayed: 10-08-1994, 07.20 pmReentry after: 690 minutesPesticide: Bonzi (paclobutrazol 0.39%)Spray equipment: Automatic hydraulic spray boomNozzle type: Tee-jet 11001Spray pressure: 5.5 barPosition ofspray equipment: The spray boom was mounted on rails above
the plants. The speed of the spray boom determined the spray dosage. The spray boom had nozzles placed at a distance of 40 cm above the plants. The spray directionwas downwards. The plants were onlysprayed once.
Spray conc.: 900 g x 0.39%/200 L = 0.0175 ‰Spray volume: Normal volume (greenhouse no 1 and no 2):
91.8 L/1000 m²Reduced volume (greenhouse no 1):59.4 L/1000 m²
60
Spray dosage: Normal dosage = 91.8 L x 0.0175 ‰/1000 m² = 1.61 g paclobutrazol/1000 m²Reduced dosage = 59.4 L x 0.0175 pr/1000 m² = 1.04 g paclobutrazol/1000 m²
Area sprayed: Greenhouse no 1: 376 m² (normal) + 150 m²(reduced)Greenhouse no 2: 150 m² (normal)
Physical parameters of the green houses
Area: 100 m x 20 m = 2000 m²Cross sectionarea: (20 m x 3.2 m)+(2.9 m x 0.5 x 20 m) = 93
m²Volume: 93 m² x 100 m = 9300 m³Fans: 3 meters above the plants ventilators was
mounted in order to increase wind velocity between the plants and in this way reducethe humidity. If R.H. exceeded 78%, the ventilators started.
Top windows: Yes
Cultures
The experiment was made in different varieties of potted roses (Rosa-hybride) belonging to the groups Parade® and Patiohit®. Most of the plantswere grown in 10.5 cm pots, each with four cuttings. At the spraying theplant height was approximately 20 cm high from rim of pot to the top of theplant. The plants were cut 2 times during the period of production. Thecutted material was used for cuttings.
Working procedure
This experiment investigated mainly three working procedures. Two typesof packing mini roses, manual and machine packing. The plants packedcame from both green houses. The manual procedure consisted in removingwithered leaves from the plants and packing the plants in boxes. At themachine packing procedure, the pots and plants were cleaned by com-pressed air. But the plants were still packed in boxes manually. One personwas switching between these two procedures. The third person was taggingthe pots by inserting plastic tags in the soil. Tagging was made only in thereduced spray dosage area in green house no 1.
Results
Air samples
Air samples were taken 50 cm above the sprayed plants 245 minutes beforeand 59 minutes, 145 minutes and 640 minutes after the spraying.

61
LOQ = 33 µg paclobutrazol/sample at a respiration rate of to 20 L/min.None of the samples were above LOQ. Therefore, the three samples are <268 µg paclobutrazol/8 h, 184 µg paclobutrazol/8 h and 32 µg paclo-butrazol/8 h, all respiration rate of 20 L/minutes
Air samples were also taken near the outlet of the dust filter attached to therecirculated air from the machine packing procedure. The sampling timewas 457 minutes, resulting in < 35 µg paclobutrazol/8 h at respiration rate20 L/min.
The sampling time and exposure level for the two persons tagging the potswere 120 minutes and < 132 µg paclobutrazol/8 hour and 128 minutes and<124 µg paclobutrazol/8 h at respiration rate 20 L/min. The analyses did notin any of the samples show even traces (= < LOD) of paclobutrazol, whichmeans that the results are only determined by limits of the method.
DFR
Leaves of the mini roses were collected for analysis 70 minutes, 910minutes and 1300 minutes after the spraying in the reduced spray dosagearea. Fig. 7.1 shows the DFR of spraying the roses with paclobutrazol. LOQ= 0.24 µg paclobutrazol/40 cm² leaf area. This amounts to 0.06 g paclo-butrazol/1000 m² (=5.77% of the initial spray dosage). In greenhouse no. 1reentry was done after 690 min. Greenhouse no. 2 was sprayed with thedosage 1.61 g paclobutrazol/1000 m². DFR in greenhouse no. 2, 865minutes after the spraying, reflects this higher spray dosage. No othersamples than these four DFR samples was taken in greenhouse no. 2.
Exposure
Full body dosimeter was used on all the persons in this experiment. Theperiod of exposure was for all workers 7 to 8 hours
Fig. 7.2 illustrates the exposure of the packers. Mainly hand exposure wasdetected. Persons 1 to 6 packed manually all the time. Persons 8 and 9 waspacking by help from machine as described above. Person no. 7 changedbetween the two working procedures.
For manual packers were geometric mean 82.3 µg paclobutrazol/8 h, limitsfor one standard deviation 35.4-191.1. 90% fractile was 450. Arithmeticmean 107.95±80.44.
For machine packers was arithmetic mean 36.0 µg paclobutrazol/8 h. Forperson no. 7 was the exposure 29.8 µg paclobutrazol/8 hour.
The two persons tagging the plants, workers no 10 and no 11 on fig. 7.2,were only registered to be exposed on their right hands 36.8 and 44 µgpaclobutrazol/8 h. The finger tips of their gloves were cut off in order tobetter being able to manipulate the plastic tags. Finger wash with ethanolwas done on these persons. These samples were below LOQ. LOQ was 33µg paclobutrazol/8 h.

62
Their right hand was the only in contact with the sprayed plants, andtherefore no exposure was registered on the left hand.
Transfer coefficients
The packing procedure used plants from both the reduced spray dosage andthe normal spray dosage. An average of the two are used in calculating thetransfer coefficient, see fig 7.1. DFR for packing procedure is then 0.6 µgpaclobutrazol/40 cm². The transfer coefficient for the six manual packers,calculated on
Arithmetic mean:107.95 µg x 40 cm²/8 h x 0.6 µg = 1000 cm²/h
Geometric mean:82.3 µg x 40 cm²/8 h x 0.6 µg = 686 cm²/h
90% fractile:450 µg x 40 cm²/8 h x 0.6 µg = 3750 cm²/h
For the two packers using machine packing the transfer coefficient was thearithmetic mean
36.1 µg x 40 cm²/8 h x 0.6 µg = 300 cm²/h
For the one person working both with manual and machine packing, thetransfer coefficient was
29.8 µg x 40 cm²/8 h x 0.6 µg = 248 cm²/h
Fig. 7.1 shows DFR as 0.40 µg paclobutrazol/40 cm² (taken at the reducedspray dosage) when reentry was done after 690 min.
The two persons, working in the reduced spray dosage area tagging theplants had an average of 40.4 µg paclobutrazol/8 hours. The transfercoefficient is calculated to
40.4 µg x 40 cm²/8 h x 0.4 µg = 505 cm²/h
Analysis of inactive media in the green house
Heating tubes
Painted heating tubes were analysed for residues of paclobutrazol. Thesampling area was 30 cm of a 4.2 cm diameter steel tube. The sample wastaken 180 minutes before the spraying and 65 minutes and 955 minutesafter the spraying. The first sampling after the spraying was done at thesame place as before spraying. The consecutive sampling was done on newplaces.
Fig. 7.3 illustrates the residues of paclobutrazol found before and after thespraying. The average concentration before the spraying was 3.61 µg

63
paclobutrazol/126 cm² and 3.86 µg paclobutrazol/126 cm² 955 minutes afterspraying. 65 minutes after spraying the level was on LOQ 0.7 µgpaclobutrazol/126 cm². This illustrates that paclobutrazol is "hanging in theair" at least 65 minutes after the spraying and then the deposition takesplace.
3.61 and 3.86 µg paclobutrazol/126 cm² is equal to 0.29 g paclobutra-zol/1000 m² and 0.31 g paclobutrazol/1000 m², respectively. Compared tothe initial spay deposits (weighed average of the two spray dosages: 1.20g/1000 m²): 24.2% and 25.8%, respectively.
Tables
The rim of the tables were analysed for residues of paclobutrazol. The rimwas constructed of aluminium profiles, 15 cm high and 2.5 cm wide.
Samples were taken on a 30 cm long piece of the rim. Horizontal area was75 cm², vertical area: 450 cm². Samples were taken 135 minutes before thespraying, 75 minutes and 1000 minutes after the spraying. Samples taken 75minutes after the spraying were taken the same place as before thespraying. Samples taken 1000 minutes after the spraying were taken atanother place.
Fig. 7.4 illustrates the residues of paclobutrazol from the rim of the tables.The level of paclobutrazol before the spraying was below LOD. After thespraying, the level 1000 minutes after spraying (16.7 hours), was at least ashigh as the level before the spraying plus the level 75 minutes after thespraying.
Assuming the horizontal area of the rim is receiving most of the paclo-butrazol measured, 2.6 µg paclobutrazol/75 cm² = 0.35 g paclobutra-zol/1000 m² (=33.7% of initial reduced spray dosage). Compared to theculture in experiment no 8, it was more open, and probably therefore isfound higher deposits on the table rim in this experiment.
Climatic conditions
Light intensity and percentage opening of the windows is illustrated in fig7.5. The temperature varied between 22-25°C and the relative humiditybetween 75-88% during the experiment.
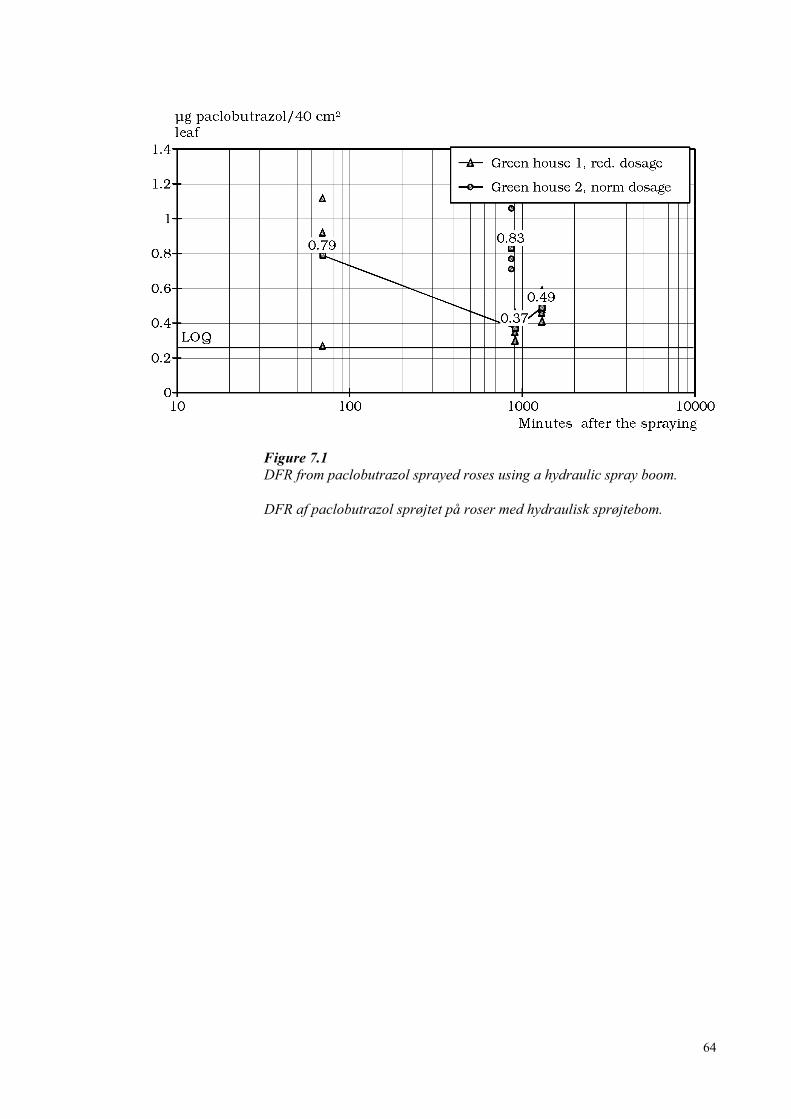
64
Figure 7.1DFR from paclobutrazol sprayed roses using a hydraulic spray boom.
DFR af paclobutrazol sprøjtet på roser med hydraulisk sprøjtebom.

65
Figure 7.2Exposure on the hands of 9 persons working with packing of potted miniroses and 2 workers placing plastic tags in the pots sprayed withpaclobutrazol the day before. * Persons no. 5 and 7 have only beenmeasured on the right hand due to practical reasons. The left hand on thesetwo persons is simulated. Only persons no. 4 and no. 9 were exposed onother places of the body. No. 4 was exposed to 40 µg paclobutrazol/8 h onthe trousers. No. 9 was exposed to 39.2 µg paclobutrazol/8 h on thetrousers. LOQ for trousers: 35 µg paclobutrazol/8 h.
Håndeksponering af 9 personer der pakker pottede miniroser og 2 personerder stikker plastikmærker i pottejorden. Planterne sprøjtede dagen før medpaclobutrazol. *Personerne nr. 5 og 7 blev kun målt på højre hånd på grundaf praktiske årsager, venstre hånd er simuleret. Kun personerne nr. 4 og 9var eksponeret på andre steder af kroppen. Nr. 4 havde 40 µgpaclobutrazol/8t, nr. 9 havde 39.2 µg paclobutrazol/8t på bukserne. LOQfor bukser: 35 µg paclobutrazol/8t.

66
Figure 7.3Residues of paclobutrazol on painted heating tubes before and afterspraying. Sampling 75 minutes after the spraying was done the same placeas before the spraying. Sampling 955 min. after spraying were done atdifferent places.
Rester af paclobutrazol på malede varmerør før og efter sprøjtning.Prøveudtagning 75 minutter efter sprøjtningen blev foretaget det sammested som før sprøjtningen. Prøveudtagning 955 minutter efter sprøjtningenblev foretaget forskellige steder.
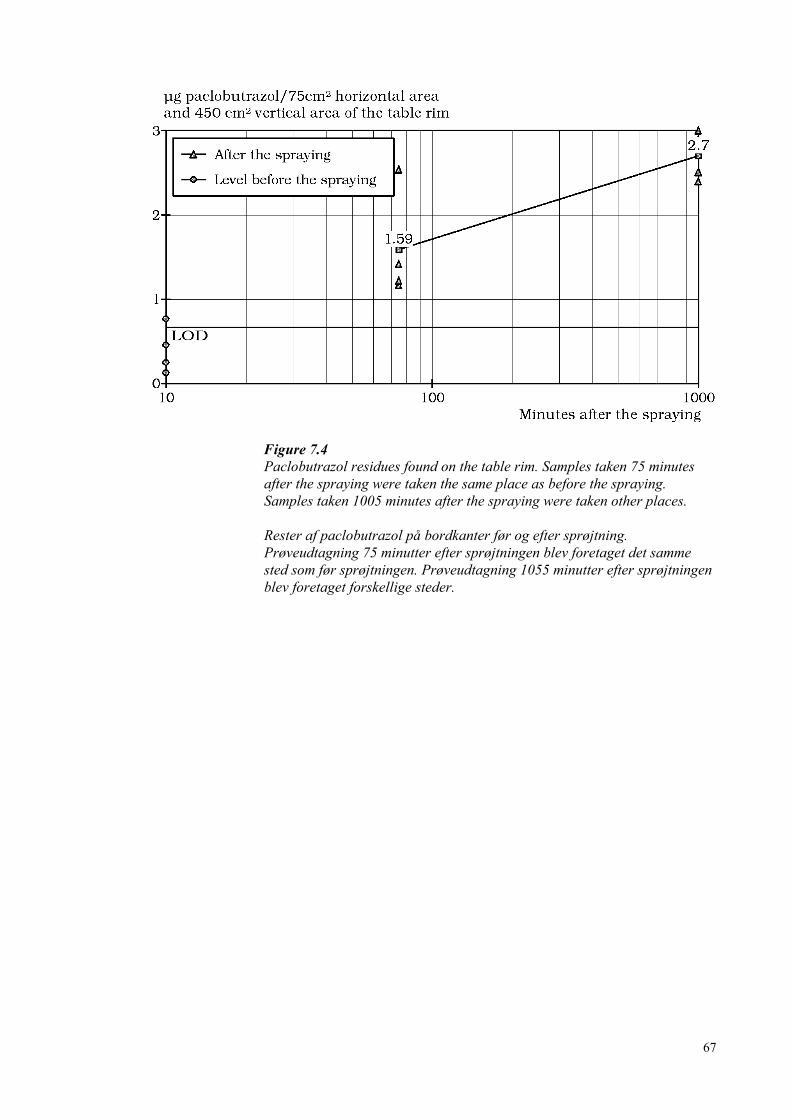
67
Figure 7.4Paclobutrazol residues found on the table rim. Samples taken 75 minutesafter the spraying were taken the same place as before the spraying.Samples taken 1005 minutes after the spraying were taken other places.
Rester af paclobutrazol på bordkanter før og efter sprøjtning.Prøveudtagning 75 minutter efter sprøjtningen blev foretaget det sammested som før sprøjtningen. Prøveudtagning 1055 minutter efter sprøjtningenblev foretaget forskellige steder.

68
Figure 7.5Light intensity in klux and percentage opening (average percentage) of thetwo top mounted windows.
Lysintensitet i klux og procent åbning af vinduerne.
69
3.8 Experiment no. 8
Experiment started: 10-08-1994Experiment finished: 11-08-1994
Abstract
Cultures of mini roses were grown in plastic pots and sprayed paclobutrazolwith a hydraulic spray boom.
At reentry, 690 min after the spraying, DFR was 0.44 µg paclobutrazol/50cm².
Removing buds from the roses resulted in a transfer coefficient of 1295cm²/h.
Manually pushing aluminium tables, exposed the two workers in experimentto 63.2 and 73.6 µg paclobutrazol/8 h. This dosage was at the same level asthe worker removing buds from the roses.
Handling the automatic washing machine for cleaning aluminium tables,resulted in exposure far below LOD.
All air samples were detected below LOQ = 33 µg paclobutrazol/sample.160 minutes after the spraying the air was measured to contain < 32 µgpaclobutrazol/8 h at respiration rate of 20 L/minute. Air samples at reentrytaken from the worker removing buds from the roses, contained < 206 µgpaclobutrazol/8 h at respiration rate 20 L/minute. The two workersoperating the washing machine was detected < 140 µg paclobutrazol/8 h atrespiration rate 20 L/minute.
Paclobutrazol was found on the heating tubes and the table rims of thealuminium tables. Respectively at 990 minutes and 1005 minutes after thespraying, paclobutrazol was found on heating tubes and aluminium tables at17.9% and 13.1% of initial spray dosage.
Spray data
Sprayed: 10-08-1994, 07.00 pmReentry after: 690 minutesPesticide: Bonzi (0.39% paclobutrazol)Spray equipment: Automatic hydraulic spray boomNozzle type: Tee-jet 11001Spray pressure: 5.5 barPosition ofspray equipment: The spray boom was mounted on rails above
the plants. The spray boom had nozzles placed at a distance of 40 cm above the plants. The spray direction was downwards. The plants were only sprayed once.
Spray conc.: 900 g x 0.39%/200 L = 0.0175 ‰Spray volume: 80.1 L/1000 m²

70
Spray dosage: 80.1 L x 0.0175 ‰/1000 m² = 1.4 g paclobutrazol/1000 m²
Area sprayed: 107 m²
Physical parameters of the green house
Area: 126 m x 48 m = 6048 m²Cross sectionarea: (3.2 m x 48 m)+(2.9 m x 0.5 x 48 m) =
223.2 m²Volume: 223.2 m² x 126 m = 28123.2 m³Fans: 3 meters above the plants ventilators was
mounted in order to increase wind velocity between the plants and in this way reducethe humidity. If R.H. exceeded 78%, the ventilators started.
Top windows: Yes
Cultures
The experiment was made in different varieties of potted roses (Rosa-hybride) belonging to the groups Parade® and Patiohit®. Most of the plantswere grown in 10.5 cm pots, each with four cuttings. At the spraying theplant height was approximately 20 cm high from rim of pot to the top of theplant. The plants were cut 2 times during the period of production. Thecutted material was used for cuttings.
Working procedure
Three working procedures have been investigated.
Two persons (person 1 and 2) have been controlling the automaticequipment that gives the individual pots more space due to growth on thetables. The greenhouse is regularly sprayed with paclobutrazol. It is ratherdifficult and not reproducible to characterise the degree of deposits ofpaclobutrazol for the tables. The experiment is some sort of "backgroundmeasurement" for this type of greenhouse.
One person (person 3) was removing buds from the roses the day afterspraying. Reentry interval 690 minutes.
Two persons (persons 4 and 5) were moving aluminium tables manually.The deposits of paclobutrazol on the tables have not been characterised asmentioned above. This procedure is also to be seen as some sort of"background measurement".
71
Results
Air samples
Air samples were taken 50 cm above the sprayed plants before and after thespraying. LOQ = 33 µg/sample corrected to 20 L/minutes respiration rate.None of the samples were above LOQ.
Before spraying the plants, the dosage of paclobutrazol at respiration rate of20 L/minute was in an eight hour period < 72 µg paclobutrazol. Immedi-ately after spraying the dosage was < 273 µg paclobutrazol/8 hour atrespiration rate 20 L/minutes, the sampling time was 58 minutes. 160minutes after the spraying, the air was sampled for a period of 500 minuteswhich led to <32 µg/8 hour at respiration rate of 20 L/minute.
The air analyses did not at any instances show traces of paclobutrazol. Thisis partly due to the extreme low dosage used in the spraying and low vapourpressure.
DFR
Fig. 8.1 shows DFR of paclobutrazol on mini roses. LOQ = 0.25 µgpaclobutrazol/50 cm² leaf, or 0.05 g paclobutrazol/1000 m² (=3.26% ofinitial spray dosage.
LOQ is reached after approximately 1000 minutes. Samples taken beforeand 1365 minutes after the spraying were far below LOQ. DFR at reentry(690 minutes after the spraying) was 0.44 µg paclobutrazol/50 cm². DFRvalues are only interesting for person no 3, who was working with thesprayed plants.
Exposure
Exposure was measured on a full body dosimeter on person no 3. Workersno 1, 2, 4 and 5 were only investigated for hand exposure. Worker no 3 hadthe finger tips on the gloves cut off in order to be able to manipulate thebuds. Wash of bare hands with ethanol was done on worker no 3. Person no3 made reentry to the sprayed plants 690 minutes after the spraying.
Fig. 8.2 illustrates the results. Persons no 1 and 2 were detected to beexposed far from LOQ.
Person no 3 was exposed to dosages around LOQ. The sum of paclobutrazolwas 91.2 µg/8 hour.
Persons no 4 and 5 were also exposed near LOQ 63.2 to 73.6 µg paclo-butrazol/8 h by moving tables, where some of the tables had been sprayedwith paclobutrazol up to two weeks ago.
Air samples have been collected for persons 1, 2 and 3. None of the sampleswere above LOQ. The sampling time on persons 1 and 2 was 113 min.which leads to < 140 µg paclobutrazol/8 hours.

72
Person no. 3 was exposed to < 206 µg paclobutrazol/8 hours with a samplingtime of 77 minutes.
The reason for these rather high levels is mainly due to the short workingperiods available in the experiment.
Transfer coefficients
Reentry for the person no 3 was done 690 minutes after the spraying. Fig.8.1 shows DFR to be 0.44 µg paclobutrazol/50 cm².
Removing buds from mini roses resulted in exposure of 91.2 µg paclo-butrazol/8 h, fig. 8.2.
Therefore, the transfer coefficient for this work is calculated to
91.2 µg x 50 cm²/8 h x 0.44 µg = 1295 cm²/h.
Analysis of inactive media in the green house
Heating tubes
Painted heating tubes were analysed for residues of paclobutrazol. Thesampling area was 30 cm of a 4.2 cm diameter steel tube.
The samples were taken 165 minutes before spraying and 75 minutes and990 minutes after the spraying. The first sampling after the spraying wasdone at the same place as before the spraying. The consecutive samplingwas done at a new place.
Fig. 8.3 illustrates the residues found of paclobutrazol before and after thespraying. If the 31 µg paclobutrazol found before spraying is considered asan outlier (which of course might not be the case), the averageconcentration before spraying was 4.88 µg paclobutrazol/126 cm² and 3.17µg paclobutrazol/126 cm² 990 minutes after the spraying, which is 27.6%and 17.9%, respectively, of the initial spray dosage. The findings looksrelatively high, especially when taken in consideration that the tubes areplaced at least 5 m away from the spray zone and exposed to heat and light.The same result has been found in experiment no 7. Paclobutrazol is used insmall concentrations (dosage/area), but is rather stable in biologicallyinactive media.
Tables
The rim of the tables were analysed for spray deposits. The rim wasconstructed of aluminium profiles 15 cm high and 2.5 cm wide. Sampleswere taken on a 30 cm long piece of the rim. Horizontal area was 75 cm²,vertical area 450 cm². Samples were taken 95 minutes before the sprayingand 70 minutes and 1005 minutes after the spraying.

73
Samples taken 70 minutes after the spraying were taken at the same place asbefore the spraying. Samples taken 1005 minutes after the spraying weretaken another place.
Fig. 8.4 illustrates the residues of paclobutrazol from the rim of the tables.The concentration of paclobutrazol before the spraying and 70 minutes afterthe spraying were below LOQ. This could be a reflection of the tables beingwashed frequently. 105 minutes after the spraying the concentration ofpaclobutrazol was well above LOQ.
Assuming the horizontal area receiving most of this residue: 1.5 µgpaclobutrazol/75 cm² = 0.2 g paclobutrazol/1000 m² (= 13.1% of initialspray dosage).
Climatic conditions
The temperature in the greenhouse was on 11-08-1994, 01.00 am to 11-08-1994, 02.00 pm between 22-24°C. RH between 70-86%.
Light intensity in klux corrected for physical shadows and the percentageopening of two top mounted windows (average percentages) are illustratedin fig. 8.4. The light flux was relatively low, but the temperature rather highand the demand for ventilation is reflected in the lower curve.
Figure 8.1DFR from paclobutrazol sprayed mini roses with a hydraulic spray boom.
DFR fra miniroser sprøjtet paclobutrazol med hydraulisk bomsprøjte.

74
Figure 8.2Exposure of 5 persons working in a greenhouse sprayed with paclobutrazol.The persons no. 1 and no. 2 were working with automatic spacing the minirose pots on aluminium tables. Person no. 3 was removing buds from themini roses. The persons no. 4 and no. 5 were moving the tables. The personsno. 1, 2, 4 and 5 were only measured for hand exposure. The person no. 3had a full body dosimeter, but only hand exposure was observed.
Eksponering af 5 personer der arbejder i væksthus sprøjtet medpaclobutrazol. Person nr 1 og 2 passer automatisk “stille-på-afstand”.Person nr. 3 fjerner knopper fra miniroser. Person nr. 4 og 5 flytter borde.Personerne nr. 1, 2, 4 og 5 blev kun målt for håndeksponering. Person nr. 3blev målt på hele kroppen men kun på hænderne blev der registrereteksponering.

75
Figure 8.3Residues of paclobutrazol on painted heating tubes after spraying miniroses. Sampling 75 minutes after the spraying was done at the same place asbefore spraying. Sampling 990 minutes after spraying was done at differentplaces.
Rester af paclobutrazol på varmerør efter sprøjtning af miniroser medhydraulisk bomsprøjte. Prøveudtagning 75 minutter efter sprøjtning blevforetaget de samme steder som før sprøjtning. Prøveudtagning 990 minutterefter sprøjtning blev foretaget forskellige steder.

76
Figure 8.4Paclobutrazol residues on the table rim. Samples taken 70 minutes after thespraying were taken the same place as before the spraying. Samples taken1005 minutes after the spraying were taken other places.
Rester af paclobutrazol på bordkanter efter sprøjtning af miniroser medhydraulisk bomsprøjte. Prøveudtagning 70 minutter efter sprøjtning blevforetaget de samme steder som før sprøjtning. Prøveudtagning 1005minutter efter sprøjtning blev foretaget forskellige steder.
Figure 8.5Light intensity in klux and percentage opening of the two top mountedwindows (average percentage).Lysintensitet i klux og procent åbning af vinduerne.

77
3.9 Experiment no. 9
Experiment started: 04-11-1994Experiment finished: 07-11-1994
Abstract
Cultures of Begonia elatior were grown in plastic pots on aluminium tablesand sprayed with endosulfan by cold fogging.
At reentry, 3785 minutes after the spraying, DFR was detected to be 3.87 µgendosulfan/100 cm².
Two working procedure were investigated. The production of cuttings forpropagation purpose, resulted in a transfercoefficient of 2990 cm²/h.Packing Begonia elatior at the aluminium tables, resulted in a transfercoefficient of 2638 cm²/h. Geometric mean was used in calculation of thepotential exposure/h.
The air above the plants at reentry contained 60 µg endosulfan/h atrespiration rate of 20 L/minute, almost solely in the gas phase. Personalmonitoring of air in the breathing zone at reentry was from 67% to 20% ofthe concentration of endosulfan measured above the plants at reentry.
At reentry, heating tubes, aluminium table rims, glass walls and curtainscontained 0.17%, 0.98%, 0.13% and 2.4% of the initial spray dosage.
A ten fold difference in deposition on filterpapers of endosulfan wasmeasured in this green house sprayed with cold fogger.
Spray data
Sprayed: 04-11-1994, 06.00 pmReentry after: 3785 minutesPesticide: Thiodan (35% endosulfan)Spray equipment: Cold fogger, Twin star.Nozzle type:Spray pressure:Position ofspray equipment: The cold fogger was hung up 3 m above the
floor at the end of the greenhouse. The sprayequipment should cover the entire green house, 134 m deep.
Spray conc.: 0.387%Spray volume: 30 L/1635 m² = 18.25 L/1000 m²Spray dosage: 18.25 L x 0.387%/1000 m² = 71 g/1000 m²Area sprayed: 1635 m²
Physical parameters of the green house
Area: 12.2 m x 134 m = 1635 m²

78
Cross sectionarea: (12.2 m x 2.6 m)+(12.2 m x 2.9 m x 0.5 m)
= 49.41 m²Volume: 49.41 m x 134 m = 6621 m³Fans: YesTop windows: YesTables: Aluminium tables with thin rim was used in
the green house
Cultures
The experiment was carried out in different varieties of Begonia elatior-hybride.
Working procedure
Two working procedures were investigated. The first procedure was theproduction of cuttings from Begonia elatior grown in pots. Nine personswere involved in this experiment. Other eight persons were manuallypacking the Begonia plants in plastic containers. The two working pro-cedures were carried out in the same green house.
Results
Air samples
Air samples were taken 195 minutes before the spraying, during thespraying and 375 minutes, 1125 minutes, 1725 minutes, 2580 minutes, 3225minutes and 3785 minutes after the spraying.
The air samplers were placed 1.6 m above the ground level in the middle ofthe green house. One sampler at a distance of 40 m and a second sampler110 m from the cold fogger.
Fig. 9.1 and fig. 9.2 shows the results. The air samplers nearest to the coldfogger has registered the highest dosage in the first sampling period, 2278µg endosulfan/h at 20 L/minutes respiration rate, almost 3 times higher thanthe samplers 110 m away from the sprayer. This is in agreement with thespray deposition from fig. 9.x. Particles and aerosols are the main fraction40 m from the sprayer just after spraying, vice versa at 110 m from thesprayer. The second sampling 110 m away from the sprayer stopped after144 minutes. Was programmed to be 750 minutes sampling time, see fig9.1, 40 m away from the sprayer. The 144 minutes sample is taken in thebeginning of the 750 minutes sampling period and naturally higher. Thefourth sample 40 m away from the sprayer was lost.
DFR
Samples were taken 120 minutes before the spraying, 1005 minutes, 1575minutes, 2430 minutes, 3075 minutes and 3660 minutes after the spraying.Twenty discs, each with an area of 5 cm² were sampled evenly distributed.

79
Fig. 9.3 show the DFR. All results were above LOQ. The ratio of the twoisomers α and ß endosulfan is 70:30 in the spray solution. The percentageof α-isomers in the DFR samples was from 13% to 47%. This couldindicate a faster uptake of α-endosulfan compared to ß-endosulfan either inthe wax surface of the leaf or a deeper penetration.
(If one assume the relation between the α-isomer and ß-isomer still shouldbe 70:30 in the DFR, an e.g. 20% α-isomer (2430 minutes after thespraying): 80% ß-isomer relation, the α-isomer/ß-isomer would be 186:80(=70:30) and the total endosulfan 186 + 80 = 267 or 2.67 times the totalfound amount of endosulfan. Conclusively, DFR should at least bemultiplied with 2.67 and will reduce the transfer coefficient proportional. Itwill be seen later on that the transfer coefficient is relatively high in thisexperiment compared to other similar experiments. The recovery of α- andß-endosulfan from the water used to extract DFR were 84.2 and 76.6%,respectively. The reason for the increase in DFR at reentry is not obvious.The use of DFR in this experiment should be done carefully.)
Exposure
CuttersExposure was measured on a full body dosimeter and some of the personswere equipped with air samplers.
The results are shown in fig. 9.4, and table 9.1. The exposure is relativelyhigh in this experiment and characterised by exposure on the body ÷ hands.
This exposure is probably coming from the contact with the tables. All thetime the workers are contacting the tables when working, both with thefront and the back of the body. But the most important route of absorptionis the hands, because they are unprotected, table 9.1. Effective protection ofthe hands in this type of work is rather impossible. The respirationexposure, fig. 9.5, is seen to be 5 times lower as measured above thesprayed plants at reentry. It does not look like an increase in exposure dueto manipulation of the plants.
PackersThe results from the packers are illustrated in fig. 9.5, fig. 9.6 and table 9.2.The average load is higher compared to cutters. The body ÷ hands exposureis smaller. Geometric mean for hand exposure is at the same level as forcutters, but if one looks at the 90% fractile for packers, it is almost 3 timesas high. This illustrates the big variation in exposure on the hands in thisworking procedure. Respiration exposure, fig. 9.5, is 1/3 to 2/3 of thebackground level in this green house.
Cutters and packersThe potential exposure is 40 % higher in the cutting procedure than thepacking procedure. But if one calculate the actual exposure the picture ischanged. The potential exposure on the hands are the same on the twoprocedures but if the 90% fractile of the distribution is calculated, one can

80
see in table 9.1 and 9.2 that due to the great variation in results frompackers hand exposure, the penetrated dosage is far bigger.
The distribution between the two isomers, α- and ß-endosulfan is illustratedin table 9.3. The ratio of α- and ß-endosulfan in the spray solution was67.04% α-endosulfan.
Table 9.3 illustrates a rather uniform ratio of α-endosulfan on the bodyminus hands regardless of working procedure. The average ratio for α-endosulfan is 84% for cutters and 86 for packers.
The reason for this might be different adsorption/transfer mechanismsbetween the isomers from the items contaminated in the green house andthe worker.
The ratio on the hand exposure is on the other hand lower to almost thesame relative degree. The results from DFR indicated a very low ratio forα-endosulfan, maybe a more intense transfer to wax or plant sap. If one usethis model on hands in table 9.3, the working procedure with the mostintense contact with the plants gives the lowest α-endosulfan ratio. Cuttersare using their left hand manipulation the plants. The right hand carries aknife or they move the pots around with the right hand. Maybe this exampleillustrates the influence of the pesticide on the transfer coefficients.
The exposure via inhalation at reentry 3785 minutes after the spraying is forboth samplers, fig 9.1 and fig 9.2, 60 µg endosulfan/h at a respiration rate of20 L/minute. The exposure constitutes of the gas phase. Only few per centparticles and aerosols.
Transfer coefficients
As mentioned above, transfer coefficients for endosulfan consisting of twoisomers, maybe behaving so differently so they actually should be regardedas two different pesticides.
It has been decided to try to define only one transfer coefficient for endosul-fan for each working procedure. The transfer coefficients are onlycalculated on basis of hand exposure.
DFR is considered to be 3.87 µg endosulfan/100 cm² leaf area at reentry, fig.9.3. DFR has unexpectedly increased at reentry but we have decided to usethis DFR at reentry despite it seems peculiar! Again: The transfercoefficients derived from this DFR should be handled with care!
For cutters, the exposure was measured to 926 µg/8 h (geometric mean).Transfer coefficient is then:
926 µg x 100 cm²/8 h x 3.87 µg = 2990 cm²/h.
For packers, the exposure was measured to 817 µg/8 h (geometric mean).Transfer coefficients is then:
817 µg x 100 cm²/8 h x 3.87 µg = 2638 cm²/h

81
Analysis of inactive media in the green house
Heating tubes
Painted heating tubes, horizontally mounted along an inner glass wall 1.2 mabove the floor, were analysed for residues of endosulfan before and afterthe spraying. The sampling area was 120 cm² (tube diameter 4 cm, 30 cmlong).
Before the spraying the tube was washed off with ethanol, 20 minutes laterthe same sample site was washed off again.
First sampling 960 minutes after the spraying was performed on the samesite as before the spraying. Consecutive sampling 1620 minutes and 3640minutes after the spraying, were done other places.
Fig. 9.7 illustrates the results. It is clearly demonstrated that the paintedheating tubes retain residues of endosulfan after being rinsed with ethanol.Even after the second extraction before the spraying, approximately 1% ofinitial spray dosage is still to be extracted. The sampling done 960 minutesafter the spraying amounts to 5.4% of initial spray dosage.
Tables
The rim of the tables were analysed for residues of endosulfan. The rim ofthe aluminium table was constructed of a flat piece of 11 cm high piece ofaluminium. No horizontal surface except for a few mm. A 30 cm long pieceof the rim, 330 cm², was washed with ethanol just before spraying and 980minutes, 1605 minutes and 3630 minutes after the spraying. The firstsample after the spraying was taken the same place as before the spraying.The consecutive samples were all taken in other places.
Fig. 9.8 illustrates the disappearance of endosulfan on the table rim. Theplants have been sprayed with endosulfan one month before.
The rims washed off, were parallel to the spray direction and not directlyexposed to the spray. But the first sample, despite the rim is placed vertical,received 2.7% of the initial spray dosage. A background level from theprevious spraying was on average 12 µg endosulfan/330 cm² whichaccounts to 0.4% of initial spray dosage.
Glass walls
Glass walls were analysed for residues of endosulfan. 225 cm² squares wererinsed with ethanol. The samples were taken 1.4 m above the floor. Theglass wall was analysed for residues of endosulfan before and after thespraying.
Before the spraying, the glass wall was rinsed off with ethanol twice, bothtimes the same place. The first sampling 960 minutes after the spraying wasdone on the same site as before spraying. Consecutive samples 1635minutes and 3660 minutes after the spraying was done at new places.

82
Fig. 9.9 illustrates the results. The first sample before the spraying was inaverage 1.16 µg endosulfan/250 cm², which is 0.073% of initial spraydosage. The second sample before spraying was well below LOD, whichwas 0.5 µg endosulfan/225 cm². In average the spray deposited 7.96 µgendosulfan/225 cm² (0.5% of initial spray dosage). 1635 minutes and 3660minutes after the spraying, the total residues were 4.16 and 2.08 µg endo-sulfan/225 cm², respectively. The last two samples represent 0.26% and0.13% of initial spray dosage, respectively. Contrary to the results from thepainted heating tubes, it looks like (not surprisingly), that the first rinse withethanol has removed most of the residues.
Curtains
Patches of curtain usually used for shadowing in green houses, were hungup vertically on the wall at four different distances from the sprayequipment. The patches, 20 cm × 20 cm, hang 2.5 m above the floor. At1060 minutes, 2430 minutes and 3735 minutes after the spraying one patchper site was removed for analysis.
Fig. 9.10 and fig. 9.11 illustrates the results. After nearly two days, theaverage reduction of residue amounts to 20%, fig. 9.10. Fig. 9.11 illustrateshigher residues (depositions) near the cold fogger, decreasing to site no. 3,and a tendency to increasing residues in the far end of the green house. Thereason for this is speculative. One could imagine a wave effect, the wavebeing stopped at the rear wall, but the results from the depositionexperiment, although deposited at a lower level, does not support thismechanism. The average residues at the three sampling times compared toinitial spray dosage were 2.5%, 2.2% and 2.0%, respectively. Compared tothe glass wall residues, the residues found at reentry on the curtains were 15times higher.
Spray pattern
Before the spraying, 10 filter papers were placed in level with the top of theBegonia culture. The filter papers were evenly distributed longitudinal inthe green house, at a distance of one third of the width of the green housefrom the wall. The filter papers were collected the day after the spraying at10.30 am.
Fig. 9.12 clearly illustrates the uneven distribution of endosulfan in thegreen house. There is a tenfold difference between the highest and thelowest concentration (dosage/area). In the middle of the green house was aconstruction 2.5 m high, probably a mayor coefficient in preventing theventilators to distribute the fog evenly in the green house.
The average dosage on the 10 filter papers was 827.8 µg endosulfan/100cm². The initial spray dosage was, as mentioned above, 71 g/1000 m² (=710µg/100 cm²). The average dosage deposited is probably highest in themiddle of the green house, but is not measured in this experiment. Theuneven distribution seen here will naturally cause the same unevenexposure at reentry.
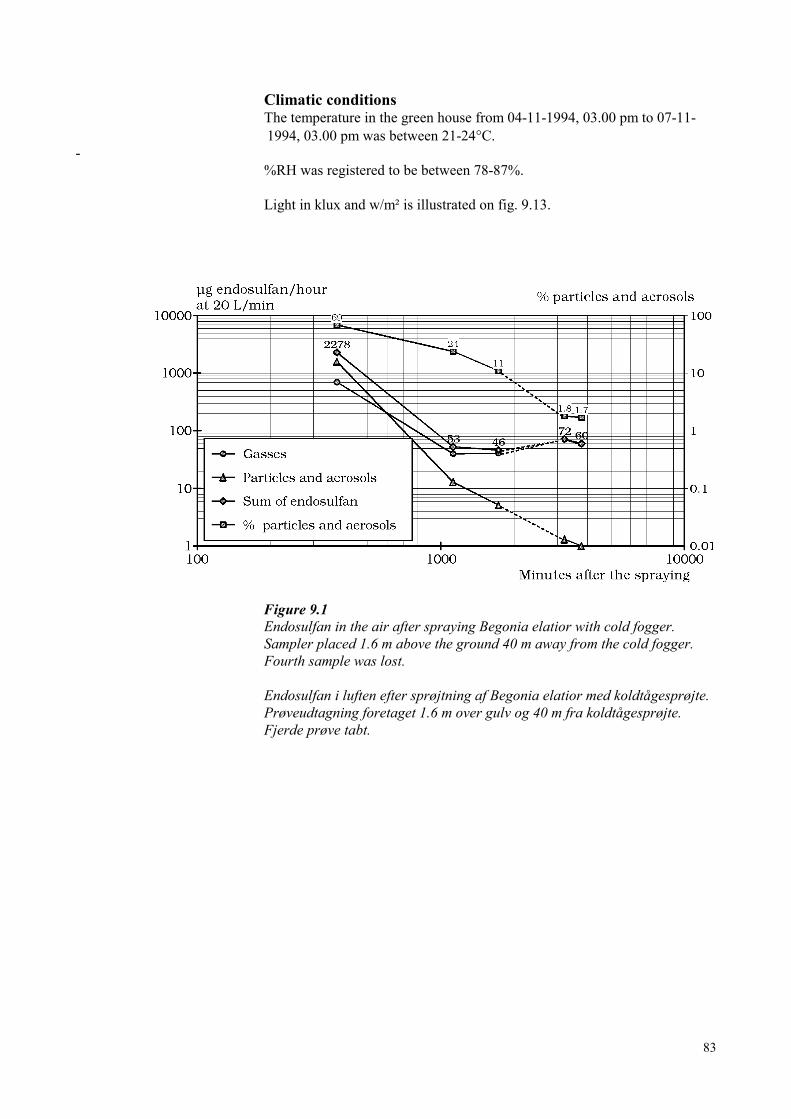
83
Climatic conditionsThe temperature in the green house from 04-11-1994, 03.00 pm to 07-11-1994, 03.00 pm was between 21-24°C.
-%RH was registered to be between 78-87%.
Light in klux and w/m² is illustrated on fig. 9.13.
Figure 9.1Endosulfan in the air after spraying Begonia elatior with cold fogger.Sampler placed 1.6 m above the ground 40 m away from the cold fogger.Fourth sample was lost.
Endosulfan i luften efter sprøjtning af Begonia elatior med koldtågesprøjte.Prøveudtagning foretaget 1.6 m over gulv og 40 m fra koldtågesprøjte.Fjerde prøve tabt.

84
Figure 9.2Endosulfan in the air after spraying Begonia elatior with cold fogger.Sampler placed 1.6 m above the ground 110 m away from the cold fogger.Second sampling only lasted 144 minutes due to malfunctioning of thepump.
Endosulfan i luften efter sprøjtning af Begonia elatior med koldtågesprøjte.Prøveudtagning foretaget 1.6 m over gulv og 110 m fra koldtågesprøjte.Anden prøveudtagning varede kun 144 minutter på grund affejlfunktionering af pumpen.
Figure 9.3DFR from endosulfan sprayed Begonia elatior with cold fogger.
DFR fra endosulfansprøjtede Begonia elatior med koldtågesprøjte.

85
Figure 9.4Exposure on nine persons manually cutting endosulfan sprayed Begoniaelatior sprayed with cold fogger.
Eksponering af 9 personer som manuelt fremstiller stiklinger fra Begoniaelatior sprøjtede med endosulfan.
Figure 9.5Endosulfan in the air measured in the breathing zone of workers packing orcutting endosulfan sprayed Begonia elatior with cold fogger.
Endosulfan i luften målt i åndingszonen af personer som pakker eller laverstiklinger af koldtågesprøjtede Begonia elatior.

86
Figure 9.6Exposure on eight persons manually packing endosulfan sprayed Begoniaelatior sprayed with cold fogger.
Eksponering af 8 personer som manuelt pakker endosulfansprøjtedeBegonia elatior. Sprøjtningen udført med koldtågesprøjte.
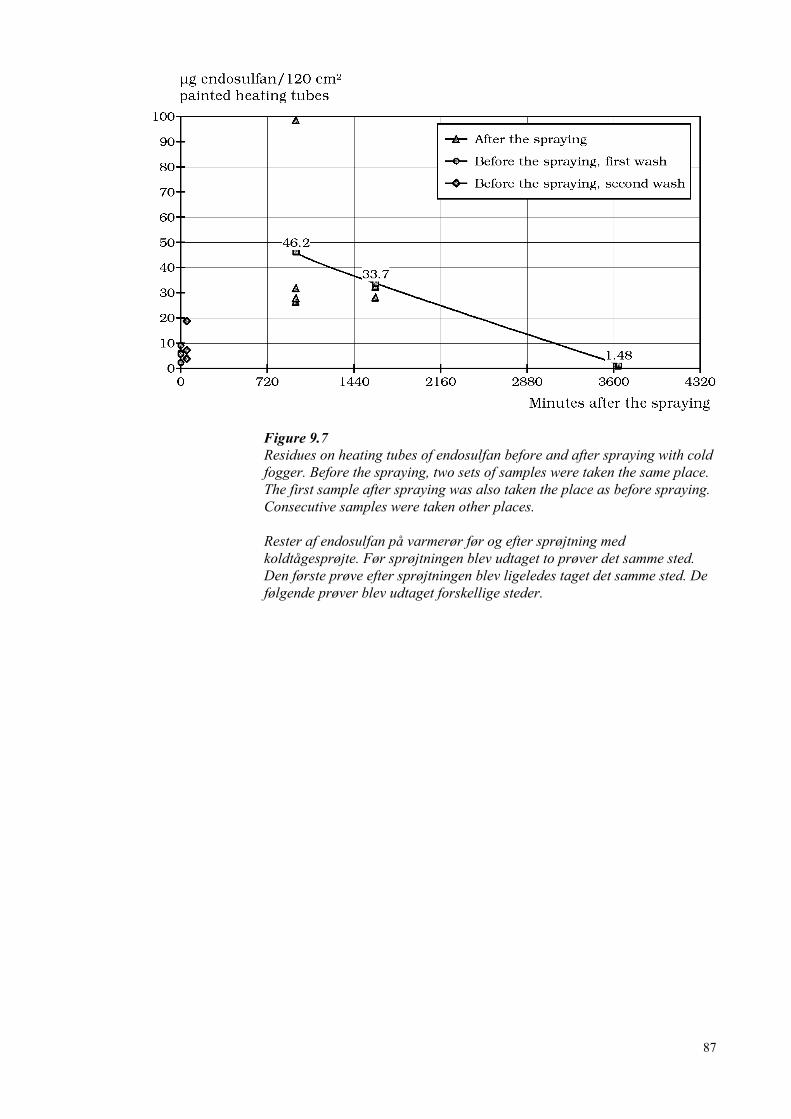
87
Figure 9.7Residues on heating tubes of endosulfan before and after spraying with coldfogger. Before the spraying, two sets of samples were taken the same place.The first sample after spraying was also taken the place as before spraying.Consecutive samples were taken other places.
Rester af endosulfan på varmerør før og efter sprøjtning medkoldtågesprøjte. Før sprøjtningen blev udtaget to prøver det samme sted.Den første prøve efter sprøjtningen blev ligeledes taget det samme sted. Defølgende prøver blev udtaget forskellige steder.

88
Figure 9.8Residues of endosulfan on aluminium tables sprayed with a cold fogger.Samples before spraying and first sample after spraying taken the sameplace. Consecutive sampling performed other places.
Rester af endosulfan på bordkanter før og efter sprøjtning medkoldtågesprøjte. Før sprøjtningen og første prøve efter sprøjtningen blevtaget det samme sted. De følgende prøver blev udtaget forskellige steder.

89
Figure 9.9Residues of endosulfan on glass walls before and after spraying with coldfogger. Before spraying, two sets of samples were taken the same place. Thefirst sample after the spraying was also taken this place. Consecutivesamples were taken other places.
Rester af endosulfan på glasvægge før og efter sprøjtning medkoldtågesprøjte. Før sprøjtningen blev udtaget to prøver det samme sted.Den første prøve efter sprøjtningen blev ligeledes taget det samme sted. Defølgende prøver blev udtaget forskellige steder.

90
Figure 9.10Deposition and disappearance of endosulfan from plastic curtains exposedto cold fogger sprayer. Four sampling sites at different distances from thesprayer.
Afsætning og fund af endosulfan fra plastskyggegardiner eksponeret forendosulfan udsprøjtet med koldtågesprøjte. Fire udtagningssteder iforskellig afstand fra sprøjteudstyret.

91
Figure 9.11Deposition and disappearance of endosulfan from plastic curtains exposedto cold fogger sprayer. Four sampling sites at different distances from thesprayer.
Afsætning og fund af endosulfan fra plastskyggegardiner eksponeret forendosulfan udsprøjtet med koldtågesprøjte. Fire udtagningssteder iforskellig afstand fra sprøjteudstyret.
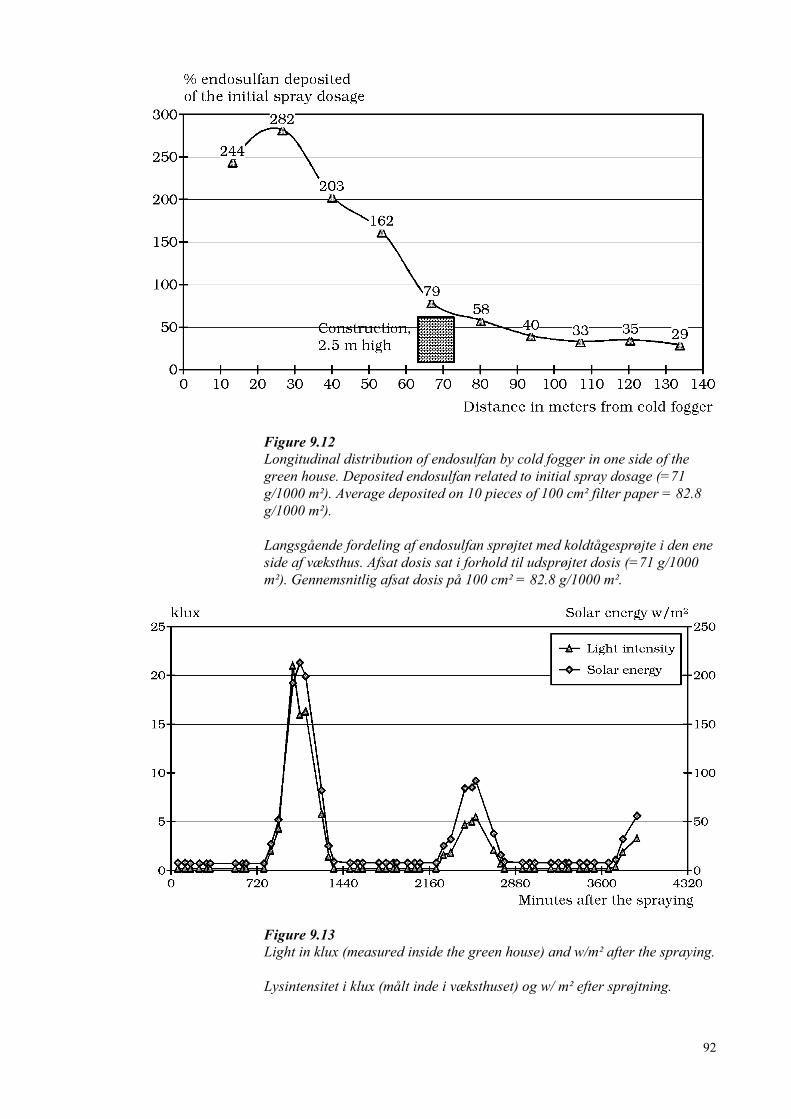
92
Figure 9.12Longitudinal distribution of endosulfan by cold fogger in one side of thegreen house. Deposited endosulfan related to initial spray dosage (=71g/1000 m²). Average deposited on 10 pieces of 100 cm² filter paper = 82.8g/1000 m²).
Langsgående fordeling af endosulfan sprøjtet med koldtågesprøjte i den eneside af væksthus. Afsat dosis sat i forhold til udsprøjtet dosis (=71 g/1000m²). Gennemsnitlig afsat dosis på 100 cm² = 82.8 g/1000 m².
Figure 9.13Light in klux (measured inside the green house) and w/m² after the spraying.
Lysintensitet i klux (målt inde i væksthuset) og w/ m² efter sprøjtning.

93
Table 9.1Eight hours potential exposure in µg of endosulfan for nine persons cuttingBegonia elatior, geometric mean, 90% fractile and a suggested penetrationto the skin leading to actual exposure. For “Body÷ hands”, “Hands” and“Total”, geometric means, s and 90% fractile are calculated on the numbersfrom the individual body parts. n=9, f=8.
Otte timers potentiel eksponering i µg endosulfan for 9 personer derfremstiller stiklinger af Begonia elatior, geometrisk gennemsnit, 90% fraktil,en foreslået penetrering igennem arbejdsbeklædning samt følgendehudeksponering. For “Krop÷hænder” , “Hænder” og “Total” ergeometrisk gennemsnit, s og 90%-fraktil beregnet på deltallene fra deenkelte kropsdele. n=9, f=8.

94
Table 9.2Eight hours potential exposure in µg of endosulfan for eight personspacking Begonia elatior, geometric mean, 90% fractile and a suggestedpenetration to the skin leading to actual exposure. For “Body ÷ hands”,“Hands”, “Hands” and “Total”, geometric mean, s and 90% fractile arecalculated on the numbers from the individual body parts.. n=8, f=7.
Otte timers potentiel eksponering i µg endosulfan for 9 personer der pakkerBegonia elatior, geometrisk gennemsnit, 90% fraktil, en foreslåetpenetrering igennem arbejdsbeklædning samt følgende hudeksponering. For“Krop÷hænder” , “Hænder” og “Total” er geometrisk gennemsnit, s og90%-fraktil beregnet på deltallene fra de enkelte kropsdele. n=8, f=7
Table 9.3% α-endosulfan in samples from body dosimeter from cutters and packers.
Procent α-endosulfan i prøver fra kropsdosimeteret fra personer somfremstiller stiklinger og pakker Begonia elatior.

95
3.10 Experiment no. 10
Experiment started: 02-06-1995Experiment finished: 05-06-1995
Abstract
Cultures of Begonia elatior were grown in plastic pots on aluminium tablesand sprayed with endosulfan by cold fogging
The experiment should be seen in conjunction with experiment no 9, butperformed during the summer season.
Air samples were taken during the spraying and after the spraying. Gassesconstitutes the largest fraction in the samples. Particles and aerosols wasonly 7.8% 945 after the start of the spraying. The results as a whole arelooking like the air samples taken in the winter season.
Spray data
Sprayed: 02-06-1995, 06.15-09.15 pmReentry after: No reentryPesticide: Thiodan (35% endosulfan)Spray equipment: Cold fogger, Twin StarNozzle type:Spray pressure:Position ofspray equipment: The cold fogger was hung up 3 m above the
floor at the end of the green house. Thespray equipment should cover the entire green
house, 134 m deep
Spray conc.: 0.387%Spray volume: 30 L/1635 m² = 18.25 L/1000 m²Spray dosage: 18.25 L x 0.387%/1000 m² = 71 g/1000 m²Area sprayed: 1635 m²
Physical parameters of the green house
Area: 12.2 m x 134 m = 1635 m²Cross sectionarea: (12.2 m x 2.6 m)+(12.2 m x 2.9 m x 0.5 m)
= 49.41 m²Volume: 49.41 m x 134 m = 6621 m³Fans: YesTop windows: YesTables: Aluminium tables with thin rim was used in
the green house
Cultures

96
The experiment was carried out in different varieties of Begonia elatior-hybride.
Results
Air samples
The sampler was placed in the middle of the green house, 1.7 m above thefloor.
Only air samples have been made in this experiment. Sampling was doneduring the first 60 minutes of the spraying which lasted 180 minutes.Nothing was registered in this sample (LOQ = 2 µg/sample).
The next sampling started 60 minutes after starting the spraying and 300minutes forward. This sample was in this way taken when the sprayer stillwas spraying for 120 more minutes plus 180 minutes. Three samples weretaken 945 minutes, 2395 minutes and 3835 minutes after starting thespraying.
The results are illustrated in fig. 10.1.
The levels of the sum of α- and β-endosulfan is almost the same as seen inexperiment 9 six month earlier with endosulfan. Similar is also thedisappearance of the sum of endosulfan and the disappearance of particlesand aerosols.
Climatic conditions
In the period 02-06-1995, 06.00 pm to 05-06-1995, 10.00 am, the tempera-ture and %R.H. in the green house varied between 21-22°C and 56-90%R.H., respectively.
The solar energy in w/m² and the % opening of the windows are illustratedin fig. 10.2.

97
Figure 10.1Endosulfan in the air after spraying Begonia elatior with cold fogger.LOQ=2 µg/sample.
Endosulfan i luften efter sprøjtning af Begonia elatior med koldtågesprøjte.LOQ = 2 µg/prøve.
Figure 10.2Light intensity in w/m² and % opening of the windows.
Lysintensitet i w/ m² og procent åbning af vinduerne.

98
3.11 Experiment no. 11
Experiment started: 29-09-1995Experiment finished: 02-10-1995
Abstract
Cultures of different varieties of ornamental flowers, among them Dracaenamarginata and Codiaeum variegatum, were grown in plastic pots onaluminium tables.
At reentry, 3465 minutes after the spraying of methomyl with a cold fogger,DFR was detected to be 1.56 µg methomyl/100 cm² leaf and 2.2 µgmethomyl/50 cm² leaf on the respective two plant species mentioned.
Two workers were while standing at the aluminium tables, manuallycleaning the plants for withered leaves and packing the plants in card boardboxes. No methomyl (<20 µg methomyl/8 h) could be detected on the hands,therefore no transfer coefficient was calculated. The rest of the body wasexposed to 246 µg and 1150 µg methomyl/8 h packing the respective plantspecies.
Air samples from the green house at reentry was in the range of 3 µgmethomyl/h at a respiration rate of 20 L/minute. The personal monitoring ofmethomyl in the breathing zone at reentry, was below LOQ due to a tooshort working period.
The disappearance of methomyl on heating tubes and plastic curtains afterthe spraying, could not be demonstrated in the experiment. 6.25% and 0.8%of the initial spray dosage was still present at reentry on the heating tubesand plastic curtains respectively.
930 minutes after the spraying, filter papers were collected from the tablesin order to demonstrate the distribution of the deposition of methomyl. Only19% of the initial spray dosage was recovered. A 5.6-fold difference ofdeposition could be registered in the green house.
Spray data
Sprayed: 29-09-1995, 06.15 pm - 09.15 pmReentry after: 3465 minutes after the sprayingPesticide: Lannate 20 L (20% methomyl)Spray equipment: Cold fogger, Twin StarNozzle type: No 92Spray pressure:Position ofspray equipment: The cold fogger was a twin-nozzle type and placed
in the middle of the green house, spraying inlongitudinal direction with each nozzle in oppositedirection.
Spray conc.: 750 ml x 20% x 1000/25 L = 6 ‰Spray volume: 25 L/2000 m² = 12.5 L/1000 m²Spray dosage: 12.5 L x 6 ‰/1000 m² = 75 g/1000 m²

99
Area sprayed:
Physical parameters of the green house
Area: 100 m x 20 m = 2000 m²Cross sectionarea: (3 m x 20 m)+(4.6 m x 20 m x 0.5) = 106 m²Volume: 106 m² x 100 m = 10600 m³Fans: YesTop windows: YesTables: Aluminium tables, 1.6 m x 9.13 m, packed close
together. The tables were lined up in two rowseach row along one of the side walls in the greenhouse.
Cultures
In the green house was growing a variety of different ornamental plantspecies, mainly imported cuttings. The working procedures in the ex-periment mainly dealt with two types, different varieties of Dracaenamarginata with narrow and the long leaves and the broad leaf specieCodiaeum variegatum 'Aucubaefolia'.
Working procedure
The two species were grown in plastic pots on the aluminium tables. Fromhere they were manually packed in cardboard boxes. While packing theplants, the workers removed wilted leaves from the pots and the plants. Thebody of the workers were physically in close contact with the tables whilepacking.
Results
Air samples
The air sampler was placed in the middle of the green house, 1.7 m abovethe floor, and 24 m away from the two nozzles, approximately 25 m fromthe spray equipment. Air samples were taken before the spraying and 240minutes (while the spraying was done plus 60 more minutes), 360 minutes,720 minutes, 1185 minutes, 2645 minutes and 4081 minutes after the startof the spraying.
LOQ was 3 µg methomyl/sample. Nothing could be detected before thespraying. Fig. 11.1 illustrates the findings. The air sample taken while thespraying was performed plus 60 minutes more, showed large quantities ofmethomyl in the filter indicating particles and aerosols. 60 minutes after thesprayer was stopped (the sample taken from 240 minutes to 360 minutesafter start of the spraying), nothing was found in the filter. This is in goodagreement with findings in experiment no 12. At reentry gasses of
100
methomyl were detected in the range of 3 µg/h at a respiration rate of 20L/minute.
DFR
Leaf samples for DFR analysis were taken for both plant species, Dracaenamarginata and Croton variegatum. D. marginata was impossible to punchdue to high fibre contents. In stead of taking samples by punching, the areaof this slim leafed plant was measured manually. 100 cm² leaf was used inthe analysis for D. marginata, 50.9 cm² (20 pieces, 2.54 cm diameterpunches) for C. variegatum.
Both species were analysed before the spraying. D. marginata was analysed1020 minutes, 2490 minutes and 3555 minutes after the spraying. C.variegatum was analysed 975 minutes, 2495 minutes and 3497 minutes afterthe spraying.
The results are illustrated in fig. 11.2 and fig. 11.3.
The DFR measured on D. marginata was at re-entry 1.56 µg methomyl/100cm² in average of four samples. This figure corresponds to 0.156 gmethomyl/1000 m² (=0.2% of initial spray dosage). The DFR measured onC. variegatum was 2.2 µg methomyl/50.9 cm² at re-entry, as an average offour samples. Similar this corresponds to 0.43 g methomyl/1000 m²(=0.57% of initial spray dosage). The relatively low findings are probablydue to the systemic property of this pesticide.
DFR determined by gently removing pesticides by washing the sprayedleaves with water, is an attempt to express the loose bound residues afterthe spraying. There is no doubt that DFR is pesticide- and plant speciesspecific. Pesticides have different polarity, plants have different degrees ofwax covering the leaf surface, etc.
It has been tried in this experiment to use another method for DFR, a moregentle way of removing residues from the surface of the leaf. A handcovered with a cotton glove was gently sweeping on the surface of theleaves. One stroke with the hand was 50-60 cm, 80 stroke/minutes andsampling time 10 minutes The sampling was done on both plant species.3555 minutes after the spraying. LOQ was 30 µg/glove. Not even tracesaround LOD were detected. DFR made by washing the leaf with water wasin the area of 2-4 µg methomyl/100 cm² and 30 µg methomyl representsonly 700-1500 cm². The results indicate that the washing and punching pro-cedure removes more residues from the leaf than is loosely present on thesurface when spraying with methomyl, probably due to the systemicproperties of methomyl.
Exposure
3465 min after the spraying, re-entry was done in the sprayed green house.The results are illustrated on fig. 11.4 and fig. 11.5.

101
Nothing could be detected on the hands of the two persons. LOQ for gloveswas 20 µg methomyl/8 h.
The exposure originates from body contact with tables when packing. Thesystemic insecticide methomyl has already penetrated the surface of theleaves and is not accessible only by contacting the plants.
If a penetration factor of 5% is assumed for body ÷ hands, the exposure onthe body is rather low, 57 µg methomyl/8 h and 12 µg methomyl/8 h forpacking Croton spp. and D. marginata, respectively. The variations in thesefigures are rather an individual variation in a green house sprayed with suchan uneven distribution as the cold fogger.
The air was monitored in the breathing zone of the two persons re-enteringthe green house 02-09-1995. The sample time was 410 minutes and 459minutes respectively. Not even traces of methomyl was detected, mainlydue to the relatively short sampling period. Detection of methomyl in thebackground seen in fig. 11.1, was due to a much longer sample period.
Transfer coefficients
Transfer coefficients are calculated to zero due to not detected exposure onthe hands. This is probably a pesticide specific case.
Analysis of inactive media in the green house
Heating tubes
Heating tubes were mounted in the middle of the green house, 2.2 m abovethe floor. They were rinsed with ethanol in order to remove any residuesbefore the spraying. The residues were detected to be 3.4 µgmethomyl/144.9 cm², horizontal cross section of the tube, as an average offour sampling sites. A control rinse 60 minutes later was detected to be 2.4µg methomyl/144.9 cm². All samples taken after the spraying was taken onplaces rinsed before the spraying. Samples after spraying were taken 945minutes, 2475 minutes and 3490 minutes after spraying. There were twosampling sites in the direction of each of the two spray directions. In onedirection the sample sites were placed 39 m and 22 m from the nozzle, inthe opposite spray direction the sample sites were placed at a distance of 12m and 42 m from the nozzle.
Fig. 11.6 illustrates the results of the residue analysis. It is clearlydemonstrated that the disappearance of methomyl on the heating tubes isextremely slow. It is also seen from fig. 11.6 that there is a rather goodcorrelation between distance from the sprayer and deposition on the samplesites. 79.3 µg methomyl/144.9 cm² calculated average 945 minutes after thespraying corresponds to 5.47 g/1000 m² (= 7.3% of the initial spray dosage).
Curtains
Pieces of plastic curtain, 20 cm x 20 cm were mounted vertically along oneof the side walls in the glass house, parallel to the spray direction, 1.4 m

102
above the floor. The distance between the sprayer and the glass wall was 10m (=middle of the green house). Four sample sites, two on each side in thespray direction as described for heating tube sampling. The distances fromthe sprayer were in the one spray direction 40 m and 15 m and in the otherdirection the distance was 22 m and 12 m.
Fig. 11.7 illustrates the findings. As seen for residues on heating tubes fig.11.6, the disappearance of methomyl is not obvious in this experiment. Thevariation between the replicates is also much smaller than it has beenobserved on residues on the heating tubes. The reason is obvious, thecurtain patches were not placed in the direction of the sprayer but 10 mparallel aside. 24.5 µg methomyl/400 cm² patch is equal to 0.6 g metho-myl/1000 m² (=0.8% of initial spray dosage).
Spray pattern
Two rows of filter papers (one row on each row of tables, see fig. 11.8),were placed on pots, in level with the top of the plants. The filter paperswere collected for analysis 930 minutes after the spraying.
Fig. 11.8 shows the positions of the filter papers and fig. 11.9 the depositedpesticide on the filter papers in percentage of average deposition. Theaverage deposited methomyl was 90.72 µg methomyl/63.62 cm² whichcorresponds to 14.26 g methomyl/1000 m² (=19% of the initial spraydosage).
It is clearly illustrated in fig. 11.9, that the highest deposition in bothspraying directions is at filter paper no 3 and no 18. The cold fogger waspresumably turned a little bit to the left, resulting in this skew distribution.
Climatic conditions
The temperature in the green house and R.H. during the experiment wasregistered to be 21-27°C and 64-86 %RH, respectively. Solar energy and %opening of the windows is illustrated in fig. 11.10

103
Figure 11.1Methomyl in the air while spraying and after spraying with a cold fogger.No particles and aerosols detected after the first sampling
Methomyl i luften under sprøjtning og efter sprøjtning med koldtågesprøjte.Ingen partikler eller aerosoler påvist efter den første prøveudtagning.
Figure 11.2DFR from methomyl sprayed on C. variegatum. Sprayed with cold fogger.
DFR af methomyl sprøjtet på C. variegatum med koldtågesprøjte.

104
Figure 11.3DFR from methomyl sprayed D. marginata. Sprayed with cold fogger.
DFR af methomyl sprøjtet på D. marginata med koldtågesprøjte.
Figure 11.4Exposure of methomyl on the body of one person packing mostly C.variegatum after spraying the green house with cold fogger.
Fordeling af eksponering af methomyl på kroppen af 1 person der pakkerfortrinsvis C. variegatum efter sprøjtning med koldtågesprøjte.

105
Figure 11.5Exposure of methomyl on the body of one person packing mostly D.marginata after spraying the green house with cold fogger.
Fordeling af eksponering af methomyl på kroppen af 1 person der pakkerfortrinsvis D. marginata efter sprøjtning med koldtågesprøjte.

106
Figure 11.6Deposition and disappearance of methomyl on heating tubes placed atdifferent distances in meters from the cold fogger.
Afsætning og fund af methomyl på varmerør i forskellig afstand frakoldtågesprøjte.

107
Figure 11.7Deposition and disappearance of methomyl on plastic curtains placed at 16m to 41 m distance from cold fogger.
Afsætning og fund af methomyl på plastskyggegardiner i forskellig afstandfra koldtågesprøjte.
Figure 11.8Horizontal cross section of green house. Length 100 m, width 20 m.C.f.=cold fogger. Numbers are numbers on filter papers placed formeasuring deposition. Filter papers placed equidistant from each other. Seefig. 11.9.
Horisontalt snit af væksthus. Længde 100 m, bredde 20 m. C.f. =koldtågesprøjte. Tallene indikerer placering af filterpapir tilafsætningsmålinger. Se fig. 11.9. Filterpapirerne er placeret med ensindbyrdes afstand.

108
Figure 11.9Deposited methomyl after spraying with cold fogger in green house. “Filterpaper no”, see fig. 11.8
Afsat methomyl efter sprøjtning med koldtågesprøjte i væksthus.“Filterpapir nr.” se fig. 11.8.

109
Figure 11.10Solar energy in w/m² measured outside the green house and % opening ofthe windows.
Solenergi i w/m² målt uden for væksthuset og procent åbning af vinduerne.

110
3.12 Experiment no. 12
Experiment started: 20-10-1995Experiment finished: 26-10-1995
Abstract
In the green house was grown a variety of ornamentals, mainly imported cut-tings. Polyscias balfouriana was the dominating specie. The plants weresprayed with methomyl using a cold fogger.
At reentry, 7800 minutes after the spraying, DFR on P. balfouriana was 2.7µg methomyl/50.9 cm².
Two workers standing at the aluminium tables with the sprayed plants, wereremoving wilted leaves from the plants and manually packing in card boardboxes. Two different plant species were handled by the respective twoworkers. Packing P. balfouriana or Cordyline purple resulted in therespective transfer coefficients 8.2 cm²/h and 10.1 cm²/h.
Air samples 1155 minutes before reentry (sample period 2805 minutes)indicated a concentration of less than 4 µg methomyl/h at a respiration rateof 20 L/minute. Personal air monitoring showed < 10 µg methomyl/435minutes at a respiration rate of 20 L/minute.
Heating tubes were rinsed with ethanol and analysed for methomyl. 8040minutes after the spraying no significant disappearance of methomyl couldbe detected. At reentry 3.3 g methomyl/1000 m² (=4% of the initial spraydosage) could still be detected.
840 minutes after the spraying filter papers were collected in order toinvestigate the distribution of the spraying. 11.9% of the initial spraydosage was recovered. The difference between the highest and the lowestconcentration deposited was a factor of 4.3.
Spray data
Sprayed: 20-10-1995, 06.00 pm-09.00 pmReentry after: 7800 minutesPesticide: Lannate 20 L(20% methomyl)Spray equipment: Cold fogger, Twin StarNozzle type: No 92Spray pressure: -Position ofspray equipment: The cold fogger was a twin-nozzle type and
placed in the middle of the green house, spraying in longitudinal direction with each nozzle in the opposite direction.
Spray conc.: 750 ml x 20%/25 L = 6 ‰Spray volume: 25 L/1800 m² = 13.9 L/1000 m²Spray dosage: 13.9 L x 6 ‰/1000 m² = 83.4 g/1000 m²

111
Area sprayed: 1800 m²
Physical parameters of the green house
Area: 100 m x 18 m = 1800 m²Cross sectionarea: (18 m x 3.1 m)+(4.9 m x 0.5 x 18 m) = 99.9
m²Volume: 100 m x 99.9 m² = 9990 m³Fans: YesTop windows: YesTables: 8 m x 1.6 m aluminium tables. The tables
were arranged in four groups, separated by amiddle and a transverse passage. The fourth group of tables included a canteen, 11.8 m x8 m x 2.3 m, see fig 12.6.
Cultures
In the green house was growing a variety of different plant species, mainlyimported cuttings. The dominating specie was Polyscias balfouriana onwhich DFR was determined.
Working procedure
Two persons were manually packing either Polyscias balfouriana orCordyline purple grown in plastic pots, at the aluminium tables. Wiltedleaves were removed when packing.
Results
Air samples
Air samples before spraying were not taken. The air sampler was placed 1.8m above the floor in the middle of the green house, 26 m away from one ofthe two nozzles. The samples were taken while the spraying was done, 240minutes, 480 minutes, 960 minutes, 2400 minutes, 3840 minutes and 6645minutes after the spraying. The results are illustrated in fig 12.1. 60 minutesafter the spraying the air contained 18% particles and aerosols of the totalmethomyl detected. But the consecutive samples did only consist ofmethomyl gasses. At reentry, 7800 minutes after start of spraying, the airstill contained 4 µg methomyl/h at 20 L respiration/minute.
DFR
DFR was measured on P. balfouriana 180 minutes before the spraying andno methomyl was detected. 840 minutes, 3810 and 7965 minutes afterspraying DFR was measured and the results are illustrated in fig. 12.2. Atreentry 7800 minutes after the spraying, the average DFR was detected to

112
be 2.7 µg methomyl/50.9 cm². 30 µg methomyl/50.9 m² corresponds to 5.9 gmethomyl/1000 m² (=7.1% of the initial spray dosage).
Exposure
Re-entry was made 7800 minutes after the spraying. Full body dosimeterwas used to measure exposure. The results are seen in fig. 12.3. and fig.12.4.
Practically nothing is measured on the hands and only 146 µg methomyl and285 µg methomyl were detected on the remaining parts of the body whenmanually packing P. balfouriana or C. purple respectively.
The two persons packing, were carrying personal air monitors. LOQ was 10µg methomyl/sample. The air was monitored for 435 minutes for bothpersons. No methomyl could be detected in this sampling period.
Transfer coefficients
Probably due to the systemic property of methomyl, very little residues weremeasured on the hands. The transfer coefficient is only calculated based onhand exposure. Transfer coefficient based on DFR of P. balfouriana.
Packing mainly P. balfouriana:
3.5 µg x 50.9 cm²/2.7 µg x 8 h = 8.2 cm²/h.
Packing mainly C. purple:
4.3 µg x 50.9 cm²/2.7 µg x 8 h = 10.1 cm²/h.The transfer coefficients for manually packing these two plant speciessprayed with methomyl was practically zero.
Analysis of inactive media in the green house
Heating tubes
Heating tubes with an outside diameter of 7.61 cm, were placed along theglass wall in the green house, 2.15 m to 2.5 m above the floor. Before thespraying all consecutive sampling sites were rinsed with ethanol. When thetubes were dry after rinsing, a new rinse was performed in order to measureany residues after the first rinse. 855 minutes, 3800 minutes and 8040minutes after the spraying, the tubes were rinsed new places every time.
The results are illustrated in fig. 12.5.
The average residues in the first ethanol rinse were 14.7 µg methomyl/152.2cm² tube. The second rinse 15.7 µg methomyl/152.2 cm². This illustrates anincomplete extraction of the painted heating tubes. The residues after thespraying does not decline significantly with time. 50.7 µg methomyl/152.2

113
cm² corresponds to 3.3 g methomyl/1000 m² (=4.0% of the initial spray dos-age).
Spray pattern
Two rows of filter papers, one row on each row of tables (see fig. 12.6),were placed on pots in level with the top of the plants. The filter paperswere collected 840 minutes after the spraying. The deposited methomyl isillustrated on fig. 12.7. It is seen in fig. 12.7 that filter paper 3 to 5 have thehighest dosage. The difference between the highest and lowest dosage is afactor of 4.3.
The average residue was equal to 9.89 µg methomyl/1000 m² and corre-sponds to 11.9% of the initial spray dosage.
Climatic conditions
The temperature in the green house varied between 20-27°C, and % RHvaried between 65-90%. The windows were closed during the experiment.
Light intensity in klux after start of the spraying is illustrated in fig. 12.8.

114
Figure 12.1Methomyl in the air while spraying and after spraying with a cold fogger.
Methomyl i luften under og efter sprøjtning med koldtågesprøjtning.
Figure 12.2DFR from methomyl sprayed Polyscia balfouriana with a cold fogger.
DFR af methomyl sprøjtet på Polyscia balfouriana med koldtågesprøjte.

115
Figure 12.3Exposure of methomyl on the body of one person manually packing mainlyPolyscia balfouriana after spraying with a cold fogger.
Eksponering af kroppen med methomyl på 1 person der manuelt pakkerfortrinsvis Polyscia balfouriana efter sprøjtning med koldtågesprøjte.

116
Figure 12.4Exposure of methomyl on the body of one person manually packing mainlyCordyline purple spraying with a cold fogger.
Eksponering af kroppen med methomyl på 1 person der manuelt pakkerfortrinsvis Cordyline purple efter sprøjtning med koldtågesprøjte.

117
Figure 12.5Deposition and disappearance of methomyl on heating tubes after sprayingwith cold fogger.
Afsætning og fund af methomyl på varmerør efter sprøjtning medkoldtågesprøjte.
Figure 12.6Horizontal cross section of green house with four groups of tables and acanteen. Length = 100 m. Width = 18 m. C.f.= cold fogger. The distancebetween the filter paper approximately 7-8 meters and equidistant fromeach other.
Horisontalt snit af væksthus med 4 grupper af borde og en kantine. Længde100 m, bredde 18 m. C.f. = koldtågesprøjte. Tallene indikerer placering affilterpapir til afsætningsmålinger. Se fig. 12.7. Filterpapirerne er placeretmed 7-8 meters afstand.
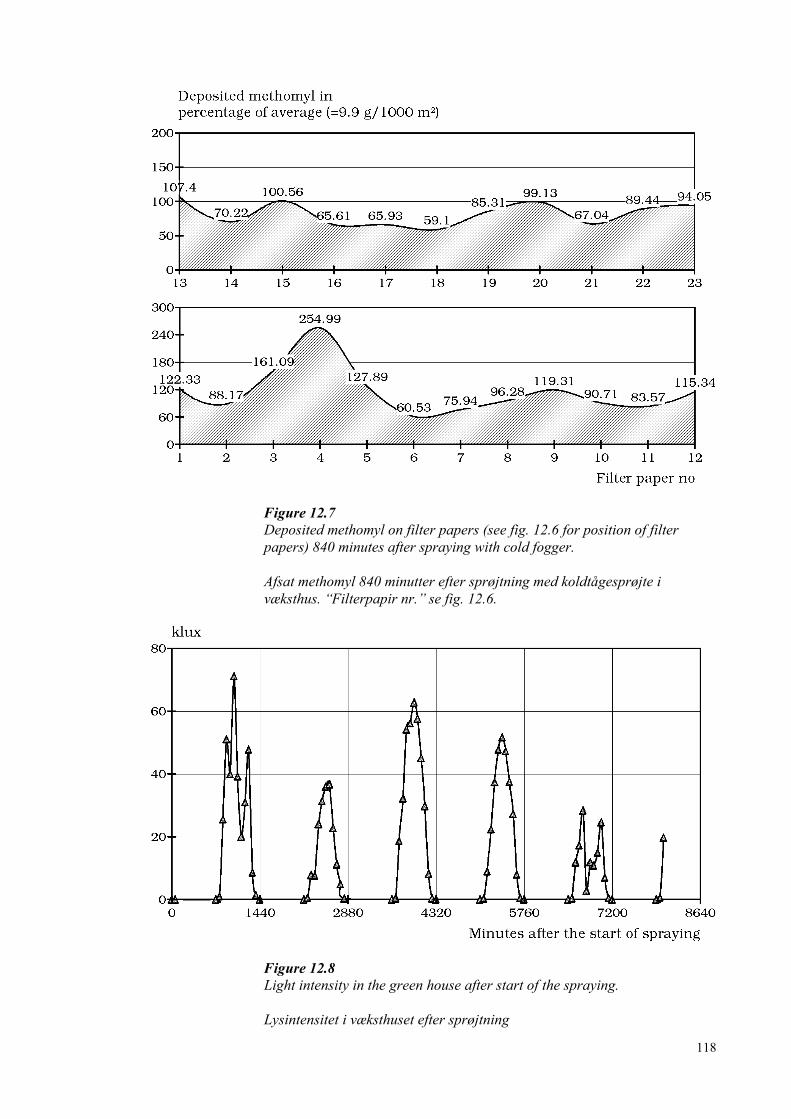
118
Figure 12.7Deposited methomyl on filter papers (see fig. 12.6 for position of filterpapers) 840 minutes after spraying with cold fogger.
Afsat methomyl 840 minutter efter sprøjtning med koldtågesprøjte ivæksthus. “Filterpapir nr.” se fig. 12.6.
Figure 12.8Light intensity in the green house after start of the spraying.
Lysintensitet i væksthuset efter sprøjtning

119
3.13 Experiment no. 13
Experiment started: 21-04-1995Experiment finished: 24-04-1995
Abstract
Cultures of Dendranthema indicum-hybride was sprayed withmercaptodimethur using a cold fogger.
Mercaptodimethur is rather stable on the surface of chrysanthemum leaves.3780 minutes after the spraying no significant disappearance ofmercaptodimethur could be detected.
Air samples taken 810 minutes after the spraying showed < 2 µg/samplingperiod.
The cold fogger deposited 72.3% of the total deposited spray dosage on7.7% of the green house area, which is very unsatisfactory and could lead touncontrolled worker exposure.
Spray data
Sprayed: 21-04-1995, 05.30 pm to 06.30 pm.Reentry after: -Pesticide: Mesurol WP 50 (50% mercaptodimethur)Spray equipment: Cold fogger, Twin nozzle. IGBA.Nozzle type: 1.0Spray pressure: -Position ofspray equipment: The cold fogger placed in the middle of the
green house with the nozzles directed in180° opposite direction (see fig. x)
Spray conc.: 500 g x 50%/20 L = 12.5 ‰Spray volume: 20 L/3072 m² = 6.51 L/1000 m²Spray dosage: 6.51 L x 12.5 ‰/1000 m² = 81.4 g/1000 m²Area sprayed: 3072 m²
Physical parameters of the green house
Area: 128 m x 24 m = 3072 m²Cross sectionarea: (3.15 m x 24 m)+(2.7 m x 12 m x 0.5) x 2 =
75.6 m² + 16.2 m² x 2 = 108 m²Volume: 108 m² x 128 m = 13824 m³Fans: YesTop windows: YesCurtain: A horizontal curtain mounted 3.15 m above
the floor limits the volume of the greenhouse (to 3.15 m x 24 m x 128 m = 9677 m³)
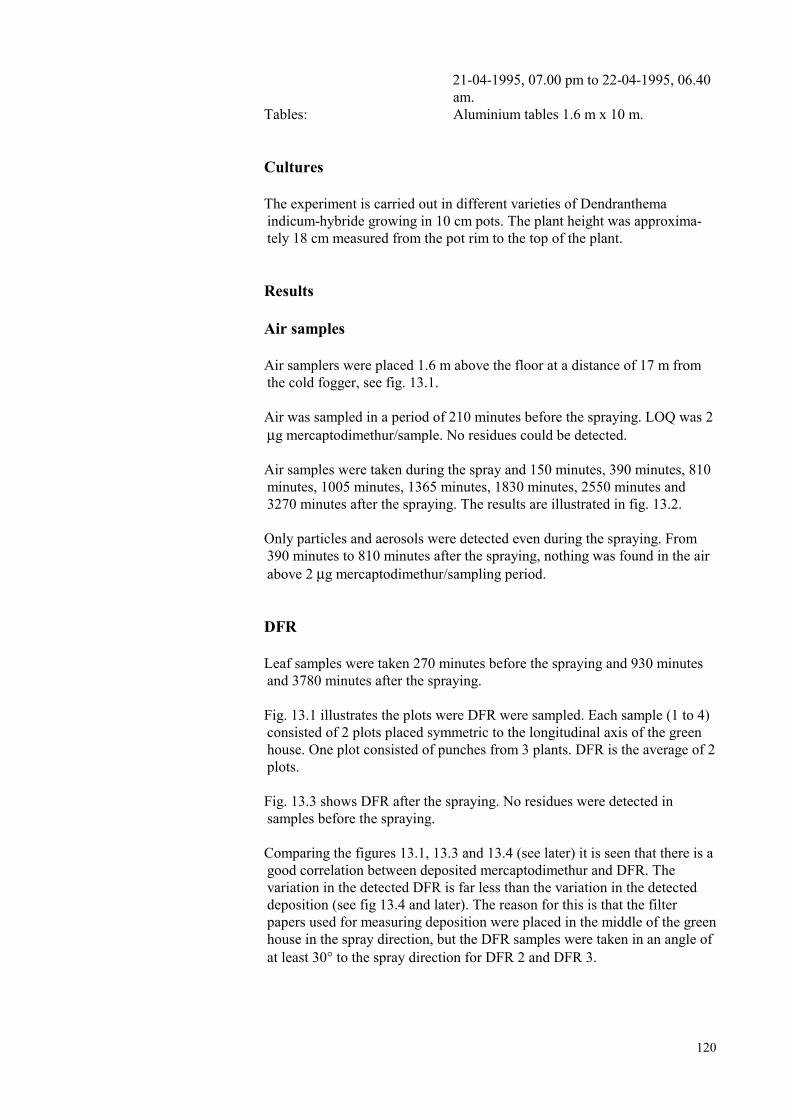
120
21-04-1995, 07.00 pm to 22-04-1995, 06.40 am.
Tables: Aluminium tables 1.6 m x 10 m.
Cultures
The experiment is carried out in different varieties of Dendranthemaindicum-hybride growing in 10 cm pots. The plant height was approxima-tely 18 cm measured from the pot rim to the top of the plant.
Results
Air samples
Air samplers were placed 1.6 m above the floor at a distance of 17 m fromthe cold fogger, see fig. 13.1.
Air was sampled in a period of 210 minutes before the spraying. LOQ was 2µg mercaptodimethur/sample. No residues could be detected.
Air samples were taken during the spray and 150 minutes, 390 minutes, 810minutes, 1005 minutes, 1365 minutes, 1830 minutes, 2550 minutes and3270 minutes after the spraying. The results are illustrated in fig. 13.2.
Only particles and aerosols were detected even during the spraying. From390 minutes to 810 minutes after the spraying, nothing was found in the airabove 2 µg mercaptodimethur/sampling period.
DFR
Leaf samples were taken 270 minutes before the spraying and 930 minutesand 3780 minutes after the spraying.
Fig. 13.1 illustrates the plots were DFR were sampled. Each sample (1 to 4)consisted of 2 plots placed symmetric to the longitudinal axis of the greenhouse. One plot consisted of punches from 3 plants. DFR is the average of 2plots.
Fig. 13.3 shows DFR after the spraying. No residues were detected insamples before the spraying.
Comparing the figures 13.1, 13.3 and 13.4 (see later) it is seen that there is agood correlation between deposited mercaptodimethur and DFR. Thevariation in the detected DFR is far less than the variation in the detecteddeposition (see fig 13.4 and later). The reason for this is that the filterpapers used for measuring deposition were placed in the middle of the greenhouse in the spray direction, but the DFR samples were taken in an angle ofat least 30° to the spray direction for DFR 2 and DFR 3.

121
Spray pattern
Twenty-six filter papers 80 mm in diameter were placed in the middle of thegreen house 21/4-95 02.00 pm., separated by equal distances. Afterspraying, the filter papers were collected 22/4-95 10.00 am.
Fig. 13.4 illustrates the distribution of mercaptodimethur on this longitu-dinal row of filter papers. Filter paper no. 14 and no. 15 received 72.3% ofthe total deposited dosage! The average deposition was 316.74 µg/50.3 cm²,which corresponds to 63 g/1000 m² (=77.45% of the initial spray dosage).The average dosage/50.3 cm² for the filter papers 1-9 and 20-26 were 22.25µg (=7.0% of the average deposited dosage) and 24.34 µg (=7.6% of theaverage deposited dosage) mercaptodimethur, respectively. In other words,62% of the filter papers received only 7.3% of the deposited spray dosage!
Evaluation of worker exposure to pesticide is extremely difficult under suchlow spraying quality, because DFR is a very vital parameter whencalculating the transfer coefficients. It could lead to worst case scenarios inthe registration procedure, when evaluating DFR from spraying conditionslike these. If not, the worker could risk a many fold higher exposure thanpredicted. This is one of the reasons why spray patterns have been includedin some of the experiments.
Climatic conditions
750 minutes after the spraying (22-04-95, 07.00 am) the windows wereopened 15% for 60 minutes. The rest of the day the windows were 10%opened.
The temperature during the experiment varied between 17 and 25°C andR.H. between 35 and 89%.
The light intensity in klux, measured under the glass roof is illustrated in fig.13.5.

122
Figure 13.1Horizontal cross section of the green house. Length = 128 m, width = 24 m.A.s.=Air sampler, placed 17 m from the nozzles. C.f.=Cold fogger withspray directions. O=DFR, (3 pots taken each plot). Filter paper no. refers tofig. 13.4. The filter papers were placed on the tables in the middle of thegreen house and equidistant from each other.
Horisontalt snit af væksthus. Længde = 128 m, bredde = 24 m. A.s. =luftpumpe placeret 17 m fra koldtågesprøjten (=C. f.). Pil er sprøjteretning.O = DFR-prøver, 3 potter på hvert sted. Filterpapir nummeret refererer tilfig. 13.4. Filterpapirerne var placeret på bordene i midten af væksthuset ogmed ens indbyrdes afstand.
Figure 13.2Mercaptodimethur in the air after spraying with cold fogger.
Mercaptodimethur i luften efter sprøjtning med koldtågesprøjte.
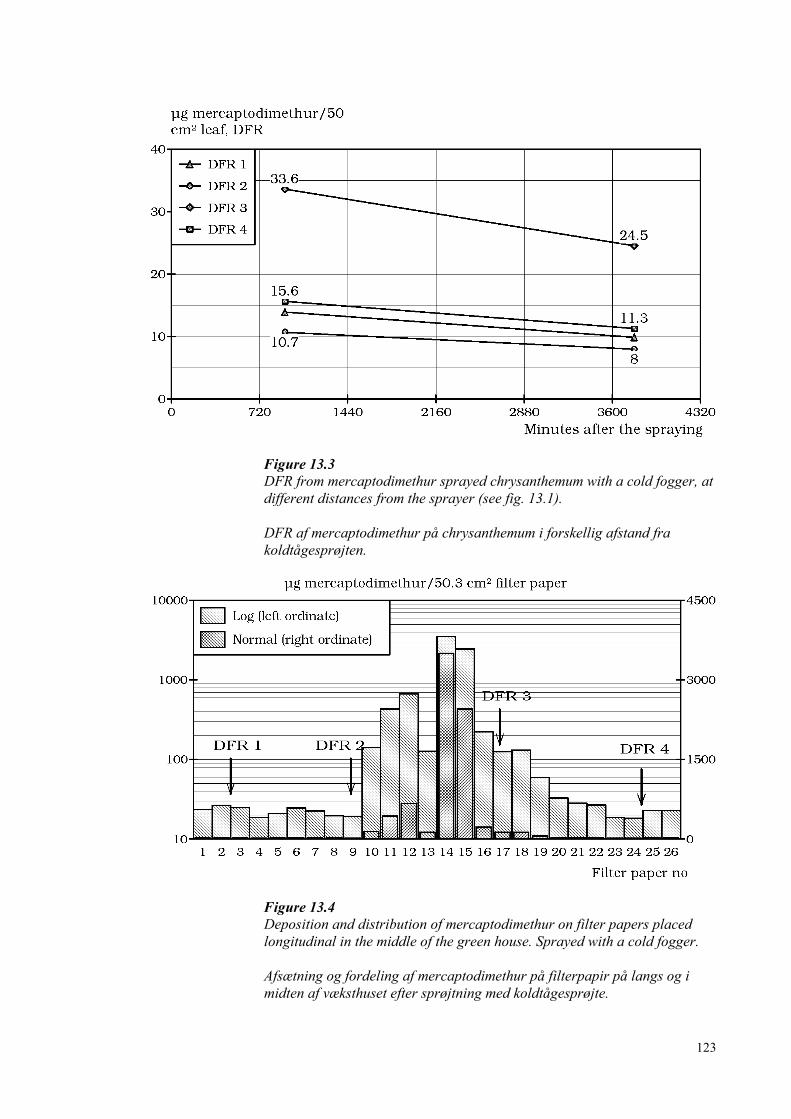
123
Figure 13.3DFR from mercaptodimethur sprayed chrysanthemum with a cold fogger, atdifferent distances from the sprayer (see fig. 13.1).
DFR af mercaptodimethur på chrysanthemum i forskellig afstand frakoldtågesprøjten.
Figure 13.4Deposition and distribution of mercaptodimethur on filter papers placedlongitudinal in the middle of the green house. Sprayed with a cold fogger.
Afsætning og fordeling af mercaptodimethur på filterpapir på langs og imidten af væksthuset efter sprøjtning med koldtågesprøjte.
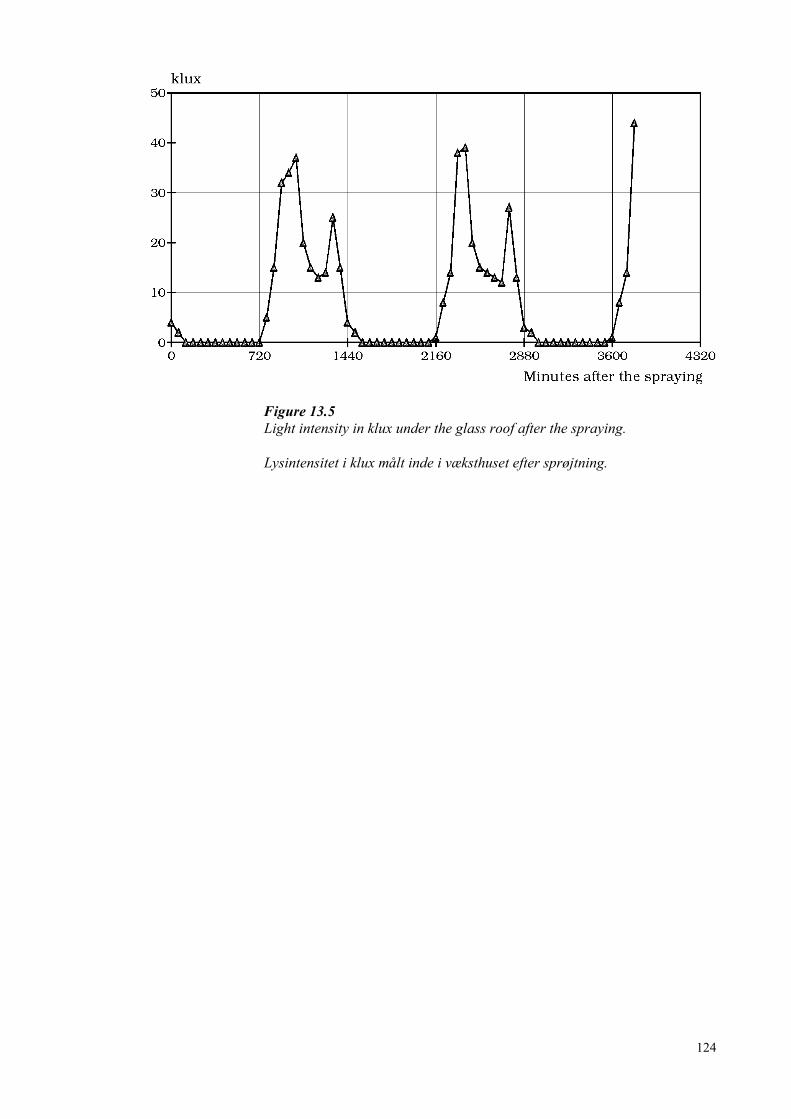
124
Figure 13.5Light intensity in klux under the glass roof after the spraying.
Lysintensitet i klux målt inde i væksthuset efter sprøjtning.
125
3.14 Experiment no. 14
Experiment started: 22-09-1995Experiment finished: 25-09-1995
Abstract
Cultures of mainly Columnea hybridae 'Kolibri' (with short runners) andAeschynanthus hybridae “Mona Lisa” (with long runners), were sprayedwith mercaptodimethur with a hydraulic hand held high pressure rifle. Theplants were hung up in frames up to 2.4 m above the floor.
At reentry, 3915 minutes after spraying for Aeschynanthus and 3965minutes for Columnea, DFR was detected to be 122.5 µg mercaptodimet-hur/49 cm² and 137.9 µg mercaptodimethur/49 cm², respectively.
The working procedure consisted of reaching for the pots, putting the pots inplastic bags and pack them in card board boxes. The transfer coefficient forAeschynanthus and Columnea was 1555 cm²/h and 1168 cm²/h respectively.But the total body exposure gave a different picture: PackingAeschynanthus resulted in a total exposure on the body of 58520 µgmercaptodimethur/8 h. The figures for Columnea was 28805 µg mer-captodimethur/8 h.
Static air samples at reentry was below 1.4 µg mercaptodimethur/h at arespiration rate of 20 L/minute. But personal monitoring in the breathingzone indicated, despite of a very short sampling period, packing Aescy-nanthus (with long runners) gave a respiratory exposure of 111 µgmercaptodimethur/h at a respiration rate of 20 L/minute. Packing Columnearesulted in < 50 µg mercaptodimethur/h at a respiration rate of 20 L/minute.
The concentration of mercaptodimethur on the heating tubes (dosage/area),was 53% of the total deposited dosage in the green house 325 minutes afterthe spraying. Half time of mercaptodimethur was approximately 3000minutes (=2 days).
27% of the initial spray dosage was recovered after 315 minutes. Thedifference in deposition (dosage/area) was detected to be 3-fold.
Spray data
Sprayed: 22-09-1995, 04.15 pmReentry after: 3915 minutes for Aeschynanthus and 3965
minutes for ColumneaPesticide: Mesurol 50 WP (50% mercaptodimethur)Spray equipment: Hand held high pressure rifle with to paral-
lel nozzles directed the same way.Nozzle type: Tee-jet, TN 14Spray pressure: 50-60 barPosition ofspray equipment: The entire spray equipment was placed in
the sprayed green house. The spray operator

126
was walking along the racks were the plantwere hanging.
Spray conc.: 263 g x 50%/175 L = 0.75 ‰Spray volume: 175 L/410 m² = 427 L/1000 m²Spray dosage: 0.75 ‰ x 427 L/1000 m² = 320 g/1000 m²Area sprayed: 410 m²
Physical parameters of the green house
Area: 32.8 x 12.5 m = 410 m²Cross sectionarea: 69 m² (irregular shaped, but "normal" roof
shape.Volume: 69 m² x 32.8 m = 2263 m³Fans: NoTop windows: Yes
Cultures
Two cultures, Columnea hybride 'Kolibri' and different varieties ofAeschynanthus hybride “Mona Lisa” were the main culture in the greenhouse.
The plants were grown in pots which were hung up in a frame in threehorizontal levels: 0.8 m, 1.6 m and 2.4 m above the floor.
Working procedure
Two experiments were done with the same working procedure, packing theplants in card board boxes. The packing procedure consisted of picking thepots either with the hands for the lowest hung pots or with a stick from thehighest hung pots, put them in plastic bags and pack them into boxes. Theplastic bags were carried in a belt on the front of the worker. The workerseemed to be potential highly exposed to dust in the head region whenremoving the pots from the highest level. No exposure studies wasunfortunately done on head exposure. Two plant species were packed,Aeschynanthus with long runners and Columnea with the short runners. Thesame person was packing the two cultures. The packing of Aeschynanthuslasted for 35 minutes and for Columnea for 26 minutes. (One of thedisadvantages of making this kind of study in small commercial greenhouses!)
Results
Air samples
Air samples have been taken 1.4 m above the floor in the middle of thegreen house. LOQ was 1 µg mercaptodimethur/sample. No residues wasdetected in the air before the spraying. Sampling was started immediatelyafter finishing the spraying and then for 45 minutes. Consecutive sampleswere taken 105 minutes, 295 minutes, 1125 minutes, 2565 minutes and
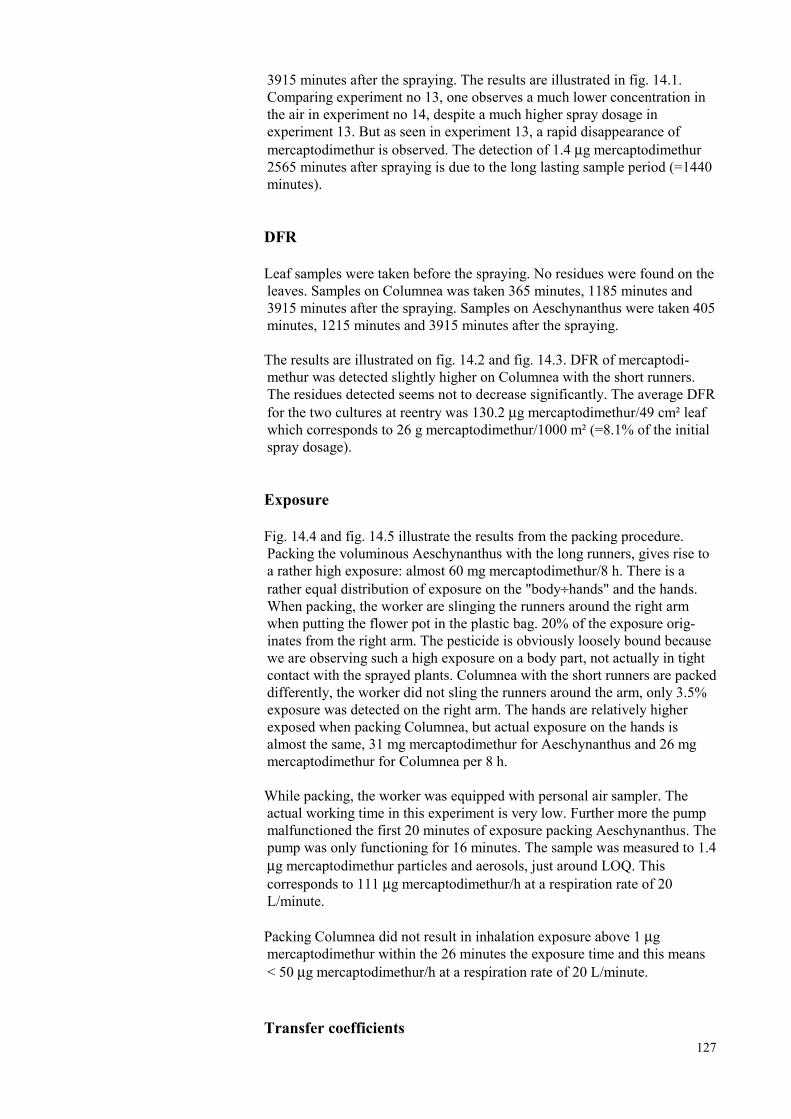
127
3915 minutes after the spraying. The results are illustrated in fig. 14.1.Comparing experiment no 13, one observes a much lower concentration inthe air in experiment no 14, despite a much higher spray dosage inexperiment 13. But as seen in experiment 13, a rapid disappearance ofmercaptodimethur is observed. The detection of 1.4 µg mercaptodimethur2565 minutes after spraying is due to the long lasting sample period (=1440minutes).
DFR
Leaf samples were taken before the spraying. No residues were found on theleaves. Samples on Columnea was taken 365 minutes, 1185 minutes and3915 minutes after the spraying. Samples on Aeschynanthus were taken 405minutes, 1215 minutes and 3915 minutes after the spraying.
The results are illustrated on fig. 14.2 and fig. 14.3. DFR of mercaptodi-methur was detected slightly higher on Columnea with the short runners.The residues detected seems not to decrease significantly. The average DFRfor the two cultures at reentry was 130.2 µg mercaptodimethur/49 cm² leafwhich corresponds to 26 g mercaptodimethur/1000 m² (=8.1% of the initialspray dosage).
Exposure
Fig. 14.4 and fig. 14.5 illustrate the results from the packing procedure.Packing the voluminous Aeschynanthus with the long runners, gives rise toa rather high exposure: almost 60 mg mercaptodimethur/8 h. There is arather equal distribution of exposure on the "body÷hands" and the hands.When packing, the worker are slinging the runners around the right armwhen putting the flower pot in the plastic bag. 20% of the exposure orig-inates from the right arm. The pesticide is obviously loosely bound becausewe are observing such a high exposure on a body part, not actually in tightcontact with the sprayed plants. Columnea with the short runners are packeddifferently, the worker did not sling the runners around the arm, only 3.5%exposure was detected on the right arm. The hands are relatively higherexposed when packing Columnea, but actual exposure on the hands isalmost the same, 31 mg mercaptodimethur for Aeschynanthus and 26 mgmercaptodimethur for Columnea per 8 h.
While packing, the worker was equipped with personal air sampler. Theactual working time in this experiment is very low. Further more the pumpmalfunctioned the first 20 minutes of exposure packing Aeschynanthus. Thepump was only functioning for 16 minutes. The sample was measured to 1.4µg mercaptodimethur particles and aerosols, just around LOQ. Thiscorresponds to 111 µg mercaptodimethur/h at a respiration rate of 20L/minute.
Packing Columnea did not result in inhalation exposure above 1 µgmercaptodimethur within the 26 minutes the exposure time and this means< 50 µg mercaptodimethur/h at a respiration rate of 20 L/minute.
Transfer coefficients

128
Transfer coefficients are only calculated on basis of hand exposure. Transfercoefficient for Aeschynanthus is calculated to:
58520 µg x 53.16% x 49 cm²/8 h x 122.5 µg = 1555 cm²/h.
Transfer coefficient for Columnea is calculated to:
28805 µg x 91.27% x 49 cm²/8 h x 137.9 µg = 1168 cm²/h.
The experiment illustrates that the only use of transfer coefficients inevaluating exposure, should be done carefully. 60 mg pesticide/8 h is thehighest exposure measured in this series of experiments, but the corre-sponding transfer coefficients are in the lower end.
Analysis of inactive media in the green house
Heating tubes
44 mm diameter steal tubes used for heating the green house, were mountedon the south glass wall, 1 m above the floor. The glass wall was on theinside covered with transparent plastic in order to avoid direct sun radiation.Before the spraying all the sites for consecutive sampling were rinsed withethanol. A following rinse of the tubes with ethanol was performed in orderto control the first rinse. Samples were taken on these rinsed sites 325minutes, 1155 minutes and 3980 minutes after the spraying. The results areillustrated in fig. 14.6.
No residues were found before the spraying or in the control rinse either.LOQ was 0.6 µg mercaptodimethur/sample. The deposited dosage on thetubes measured 325 minutes after the spraying was in average 947 µgmercaptodimethur/207.5 cm² = 45.6 g/1000 m² (=14.3% of the initial spraydosage). This does not mean the tubes only have retained 14.3% of thesprayed dosage, because the spray volume is high and is close to the drip-off volume.
Spray pattern
10 pieces of 9 cm diameter filter paper were mounted in horizontal position1 m above the floor. The filter papers were placed between the plants in themiddle of the green house evenly distributed. 315 minutes after thespraying, the filter papers were collected.
Fig. 14.7 illustrates the deposition of mercaptodimethur.
The average deposition was 549.8 µg/63.6 cm² which is 27% of initial spraydosage.
Climatic conditions
The green house did not have any automatic registration of the climaticconditions. But an ordinary thermometer was hung up in the culture 1.6 m
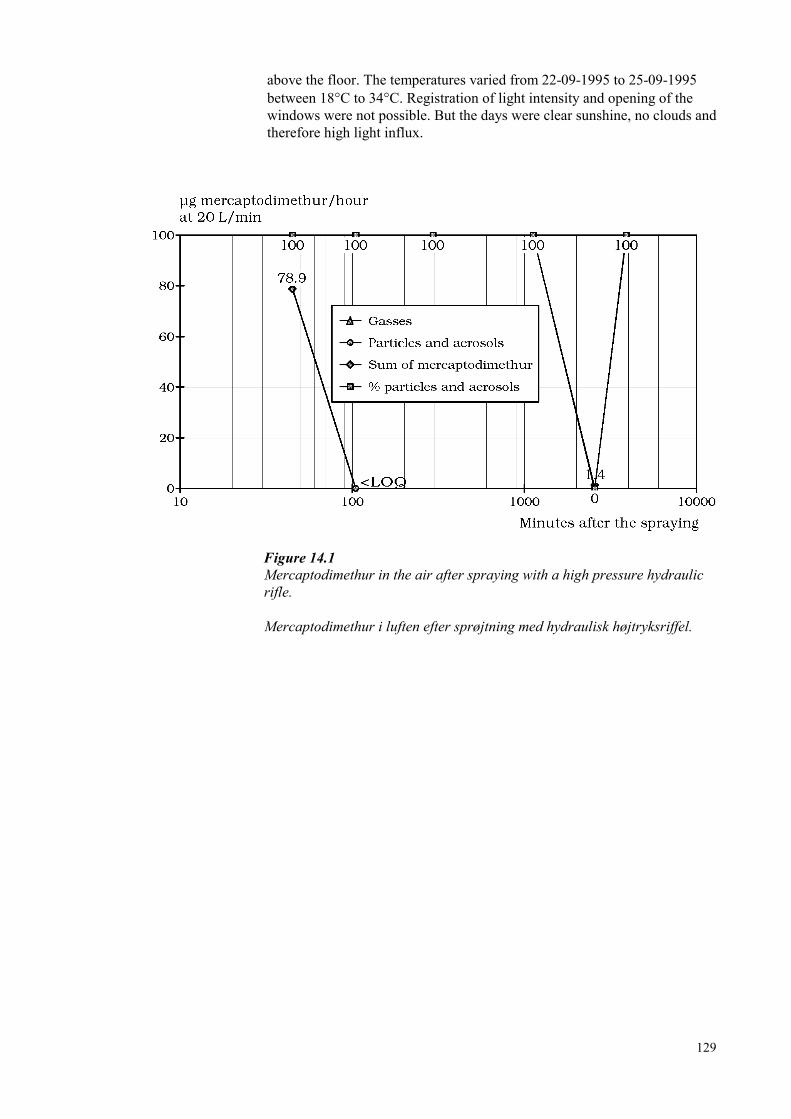
129
above the floor. The temperatures varied from 22-09-1995 to 25-09-1995between 18°C to 34°C. Registration of light intensity and opening of thewindows were not possible. But the days were clear sunshine, no clouds andtherefore high light influx.
Figure 14.1Mercaptodimethur in the air after spraying with a high pressure hydraulicrifle.
Mercaptodimethur i luften efter sprøjtning med hydraulisk højtryksriffel.

130
Figure 14.2DFR of mercaptodimethur on Columnea hybride “Kolibri” (with shortrunners) sprayed with high pressure hydraulic rifle.
DFR af mercaptodimethur på Columnea hybride “Kolibri” (med korteranker) sprøjtet med hydraulisk højtryksriffel.
Figure 14.3DFR of mercaptodimethur on Aeschynanthus hybride “Mona Lisa” (withlong runners) sprayed with high pressure hydraulic rifle.
DFR af mercaptodimethur på Aeschynanthus hybride “Mona Lisa” (medlange ranker) sprøjtet med hydraulisk højtryksriffel.

131
Figure 14.4Exposure of one person packing mercaptodimethur sprayed Columneahybride “Kolibri” (with short runners) with high pressure hydraulic rifle.
Eksponering af 1 person der pakker Columnea hybride “Kolibri” (med korteranker), sprøjtet mercaptodimethur med hydraulisk højtryksriffel.

132
Figure 14.5Exposure of one person packing mercaptodimethur sprayed Aescynanthus(with long runners) with high pressure hydraulic rifle.
Eksponering af 1 person der pakker Aeschynanthus hybride “Mona Lisa”(med lange ranker), sprøjtet mercaptodimethur med hydrauliskhøjtryksriffel.

133
Figure 14.6Deposition and disappearance of mercaptodimethur on heating tubessprayed with a high pressure hydraulic rifle.
Afsætning og fund af mercaptodimethur på varmerør sprøjtet medhydraulisk højtryksriffel.
Figure 14.7Distribution of mercaptodimethur when sprayed with a high pressurehydraulic rifle.
Fordeling af mercaptodimethur ved udsprøjtning med hydrauliskhøjtryksriffel.

134
3.15 Experiment no. 15
Experiment started: 22-03-1996Experiment finished: 29-03-1996
Abstract
Hedera helix were sprayed mercaptodimethur with a cold fogger. The plantswere hung up in racks up to 2.5 m above the floor.
Reentry was done 3780 minutes and 8115 minutes after the start of thespraying. No significant decline in DFR was observed within 9945 minutes.The overall average of DFR was 70.4 µg mercaptodimethur/50 cm² leaf(=14% of the initial spray dosage).
The working procedure at both re-entries, was cutting and packing Hederaspp. in card board boxes. At the first reentry less cutting was donecompared to the second reentry. The is reflected in the transfer coefficients.After 3780 minutes the transfer coefficient was 4150 cm²/h, after 8115minutes the transfer coefficient was 7067 cm²/h.
Static air monitoring at reentry showed < 0.8 µg mercaptodimethur/h atrespiration rate of 20 L/minute. Personal air monitoring at reentry 3780minutes after the start of the spraying, showed 45.8 µg mercaptodimethur/hat respiration rate of 20 L/minute. The personal air monitoring at reentry8115 minutes after start of the spraying, showed 138.2 µg/h at respirationrate of 20 L/minute. Total body exposure was 58682 µg and 88656 µgmercaptodimethur/8 h for the two reentry intervals.
The heating tubes were analysed for residues of mercaptodimethur. Thedeposition varied considerably due to the spraying technique, but was wellcorrelated to investigations of depositions also made. The residues on theheating tubes disappeared much faster than seen on the leaves, probably dueto the high temperature on the surface of the tubes.
Deposition of the pesticide was investigated and the concentrations(dosage/area) observed varied 35-fold.
Spray data
Sprayed: At first position:22-03-1996, 04.00 pm to 07.00 pm.
At second position:22-03-1996, 07.00 pm to 10.00 pm.
Reentry after: 3780 minutes and 8115 after the start of the spraying.
Pesticide: Mesurol WP 50 (50% mercaptodimethur)Spray equipment: Cold fogger, Motan Twin-starNozzle type: 120Spray pressure: -Position of

135
spray equipment: The green house was divided up in two and sprayed from two positions due to 1) the spray equipment and 2) the size of the greenhouse. The first position was in the end ofthe green house, the second position in the middle of the green house (see fig. 15.1)
Spray conc.: 200 x 50%/7.7 L = 13 ‰Spray volume: 7.7 L/1000 m²Spray dosage: 7.7 L x 13 ‰/1000 m² = 100 g mercapto
dimethur/1000 m²Area sprayed: 5198 m²
Physical parameters of the green house
Area: 46 m x 113 m = 5198 m²Cross sectionarea: 4 green houses x ((11.5 m x 3.5 m)+(11.5 m
x 3.5 m x 0.5)) = 241.5 m² (Fig. 15.1)Volume: 113 m x 241.5 m² = 27290 m³Fans: YesTop windows: Yes
Cultures
The plants in the experiment were different species of Hedera, grown inplastic pots and hung up as described under working procedure.
Working procedure
One person was manually packing Hedera spp. in card board boxes andmaking cuttings.
The plants were hung up in V-shape racks in five vertical levels. The upperlevel was 2.5 meter, the lower level 0.9 m above the floor. The worker wasin this way walking in a tunnel-like path, surrounding her with plants.
The plants were directly packed in the boxes.
This working procedure was used when reentry was made the day after thespraying and 7 days after the spraying. The working procedure 7 days afterspraying was less packing and more cutting.
Results
Air samples
Air pumps were placed in the middle of the green house 1.7 m above thefloor, see fig. 15.1.No residues of mercaptodimethur could be detected in the air before thespraying. Air samples were collected 180 minutes, 600 minutes, 1200

136
minutes, and 1800 minutes after the start of the spraying. The results arepresented in fig. 15.2.
It is seen that particles and aerosols constitutes the major part of the totaldetected mercaptodimethur.
DFR
Leaf samples were only taken in the first sprayed half of the green house,(the left half on fig. 15.1). Leaf samples were taken evenly distributed overthe entire area. The DFR is illustrated in fig. 15.3
7.9 µg mercaptodimethur/50 cm² leaf was detected before the spraying. Leafsamples were collected for analysis of DFR, 1080 minutes, 2520 minutes,4050 minutes, 8430 minutes, and 9945 minutes after the spraying. Nodecline in DFR was seen within this period (6.9 days). The overall averageof DFR was 70.4 µg mercaptodimethur/50 cm² leaf, which equals 14 gmercaptodimethur/1000 m² (=14% of the initial spray dosage).
Exposure
Reentry in the green house was done at 3780 minutes and 8115 minutesafter the start of the spraying. The working procedures were almost thesame, packing and making cuttings of Hedera spp., except for moreemphasis on making cuttings 8115 minutes after the start of the spraying,compared to 3780 minutes after the start of spraying. The results areillustrated in fig. 15.4 and fig. 15.5.
At both reentry, the hand exposure dominates over the exposure of the restof the body. DFR, see fig. 15.3, did not differ between the two reentry, butthe total exposure was approximately 50% higher at reentry 8115 minutesafter start of the spraying compared to the earlier reentry. This increase inexposure is mainly due to increased hand exposure, and probably a reflec-tion of more cutting at the later reentry.
At the first reentry the total inhalation exposure (particles, aerosols andgasses) of mercaptodimethur at a respiration rate of 20 L/minutes, wasdetected to be 45.8 µg/h. 90.9% was in the fraction of particles andaerosols.
At the second reentry a total of 138.2 µg mercaptodimethur at 20 L/minuteswas detected, 94.2% was particles and aerosols.
The stationary air sampling illustrated in fig. 15.2, showed a concentrationof below 0.8 µg mercaptodimethur/h at a respiration rate of 20 L/minutes,dominated by a gaseous fraction.
It is concluded that the dramatically increased concentration of mercaptodi-methur in the personal air monitors, was due to the working activity atreentry.
Transfer coefficients

137
No significant decline in DFR could be detected within 9945 minutes afterstart of the spraying. The overall average was 70.4 µg mercaptodimethur/50cm² leaf.
At reentry 3780 minutes after the start of the spraying, the exposure on thehands was 46747 µg mercaptodimethur/8 h.
The transfer coefficient is then calculated to:
46747 µg x 50 cm²/8 h x 70.4 µg = 4150 cm²/h
At reentry 8115 minutes after the start of the spraying, the exposure on thehands was 79600 µg/8 h.
The transfer coefficient is then calculated to:79600 µg x 50 cm²/8 h x 70.4 µg = 7067 cm²/h
Analysis of inactive media in the green house
Heating tubes
Heating tubes were placed 1 m above the floor at the entire length of thegreen house. Samples were taken at the distances of 8 m, 50 m, 82 m, and113 m from the end of the green house, see fig. 15.1. The first sample afterthe spraying was taken the same place as the sample before the spraying.Consecutive samples were taken other places, not rinsed before the spray-ing. The results are illustrated in fig 15.6. There is a good correlationbetween the residues on the tubes found after the spraying and what havebeen found on filter papers showing the spray pattern (see later, fig. 15.7)
79.50 µg mercaptodimethur/126 cm² horizontal tube area is equal to 6.3 gmercaptodimethur/1000 m² (=6.3% of the initial spray dosage). Thedisappearance of mercaptodimethur on heating tubes, is clearly much fasterthan has been registered on leaves, see fig. 15.3.
The reason for this is probably that the heating tubes throughout theexperiment had a temperature between 40-50°C.
Spray pattern
48 filter papers were distributed in four rows, 8 m, 50 m, 82 m and 113 mfrom the end of the green house, for measuring the spray deposition. Theywere placed 2 m above the floor in the four rows perpendicular to thelongitudinal axis of the green house, see fig. 15.7. The cold fogger wereplaced at the end wall at the first spray interval, and eight meters away fromthe first row of filter papers.
The cold fogger was placed 54 meters from the end wall of the green houseat the second spray interval. The filter papers were removed 1035 minutesafter the start of the spraying. There was a coefficient of 35 between the

138
highest and the lowest deposition. Under such spraying conditions it isextremely difficult to evaluate the exposure of workers at reentry.
The average deposition of the filter papers was 18.3 g mercaptodimet-hur/1000 m², which corresponds to 18.3% of initial spray deposition.
Climatic conditions
Only maximum and minimum of climatic important parameters wereregistered. Fig. 15.8, 15.9 and 15.10 illustrates the climatic conditions. Thewindows were opened 100% the morning after the spraying between 07.00am to 08.00 am.
Figure 15.1Horizontal cross section of the green house(s). c.f.=cold fogger. a.p.=airpump. h.t.s.= samples taken on heating tubes.
Horisontalt snit af væksthus(e). c.f. = koldtågesprøjte. a.p. = luftpumpe.h.t.s. = prøver udtaget på varmerør.

139
Figure 15.2Mercaptodimethur in the air after spraying Hedera with cold fogger (seefig. 15.1).
Mercaptodimethur i luften efter sprøjtning af Hedera med koldtågesprøjte(se fig. 15.1).
Figure 15.3DFR from mercaptodimethur sprayed on Hedera with a cold fogger.
DFR af mercaptodimethur på Hedera sprøjtet med koldtågesprøjte.

140
Figure 15.4Exposure of mercaptodimethur on the body of one person packing andcutting Hedera after spraying the green house with cold fogger. The packingwas dominating compared to the reentry illustrated in fig. 15.5. Reentry wasdone 3780 minutes after the spraying.
Eksponering af kroppen på 1 person som pakker og fremstiller stiklinger afHedera der er sprøjtet med koldtågesprøjte. Pakningen dominerede iforhold til eksemplet i fig. 15.5. Re-entry blev foretaget 3780 minutter eftersprøjtningen.

141
Figure 15.5Exposure of mercaptodimethur on the body of one person packing andcutting Hedera after spraying the green house with cold fogger. The cuttingwas dominating compared to the reentry illustrated in fig. 15.4. Reentry wasdone 8115 minutes after the spraying.
Eksponering af kroppen på 1 person som pakker og fremstiller stiklinger afHedera der er sprøjtet med koldtågesprøjte. Fremstilling af stiklingerdominerede i forhold til eksemplet i fig. 15.4. Re-entry blev foretaget 8115minutter efter sprøjtningen.

142
Figure 15.6Deposition and disappearance of mercaptodimethur on heating tubes atdifferent distances from the first cold fogger position. First c.f.=The firstposition for the cold fogger. Second c.f.= The second position for the coldfogger.
Afsætning og fund af mercaptodimethur på varmerør i forskellig afstand frakoldtågesprøjten. “First c.f.” = den første position for sprøjten. “Secondc.f.” = den anden position for sprøjten.

143
Figure 15.7Deposition of mercaptodimethur on filter papers (placed in four rows atindicated distances from the end of the green house) after the spraying withcold fogger in the green house. Filter papers collected 1035 minutes afterthe start of the spraying. C.f.= cold fogger.
Afsætning af mercaptodimethur på filterpapir efter sprøjtning medkoldtågesprøje. Filterpapirerne blev placeret i fire rækker i de indikeredeafstande fra endevæggen. Filterpapirerne blev indsamlet 1035 minutterefter start af sprøjtningen.

144
Figure 15.8Minimum and maximum % relative humidity in the green house.
Minimum og maksimum procent relativ fugtighed i væksthuset.
Figure 15.9Minimum and maximum temperature in the green house.
Minimum og maksimum temperatur i væksthuset.

145
Figure 15.10Light intensity in the green house measured outside the house. Lightintensity 0 klux started 06.30 pm and finished 06.00 am.
Lysintensitet målt uden for væksthuset. Lysintensitet 0 kl. 06.30 og 18.00.

146
3.16 Experiment no. 16
Experiment 1 started: 26-03-1996Experiment 1 finished: 03-04-1996
Experiment 2 started: 07-05-1996Experiment 2 finished: 17-05-1996
Abstract
Begonia elatior and Hedera helix was sprayed with either pirimicarb,mercaptodimethur, methomyl or iprodion in a spray cabinet. DFR wasdetermined at different time elapse after the spraying.
DFR was related to the initial spray dosage 1200 minutes after the spraying(=%DFR 1200).
The variation in '%DFR 1200' between the plant species was from 1.9 to 4-fold. This variation also included climatic variations because the twoexperiments were made at different times in the spring although the climatewas almost the same. The most influential parameter was the pesticide.'%DFR 1200' detected on Begonia spp. varied between pirimicarb andmethomyl 68-fold.
Spray data
Experiment 1Plant specie: Hedera helix in plastic pots.Sprayed: 26-03-1996, 01.00 pmSampling: Samples taken before the spraying and after
the spraying: 1260 minutes, 1740 minutes, 2820 minutes, 8400 minutes and 11550 minutes.
Replications: 4 replications, one pot is one replication and20 pieces of a 5 cm² punch per pot.
Experiment 2Sprayed: 07-05-1996, 02.30 pmPlant specie: Begonia elatior in plastic potsSampling: Samples taken before the spraying and after
the spraying: 1170 minutes, 2895 minutes, 5580 minutes, 8460 minutes and 14220 minutes.
Replications: 4 replications, one pot is one replication and20 pieces of a 5 cm² punch per pot.
Spray equipment: Automatic hydraulic boom sprayer.Nozzle type: Hardi, flat fan, 4110-30Spray pressure: 1.7 barPosition of

147
spray equipment: The plants were sprayed in an experimental spray cabin.
Spray volume: 240 L/1000 m²
Pesticide: Pirimor G (50% pirimicarb)Spray conc.: 0.05% x 50% = 0.025% pirimicarbSpray dosage: 240 L x 0.025%/1000 m² = 60 g/1000 m²
Pesticide: Mesurol 50 WP (50% mercaptodimethur)Spray conc.: 0.1% x 50% = 0.05% mercaptodimethurSpray dosage: 240 L x 0.05%/1000 m² = 120 g/1000 m²
Pesticide: Lannate 20 L (20% methomyl)Spray conc.: 0.1% x 20% = 0.02% methomylSpray dosage: 240 L x 0.02%/1000 m² = 48 g/1000 m²
Pesticide: Rovral flo (25% iprodion)Spray conc.: 0.2% x 25% = 0.05% iprodionSpray dosage: 240 L x 0.05%/1000 m² = 120 g/1000 m²
Results
DFR
DFR was detected and the results from the four pesticides, two plant speciesand the five sampling after the spraying is illustrated in fig. 16.1, 16.2, 16.3and 16.4.
DFR (g/1000 m²) from the first sampling times, was related in percent to theinitial spray dosage (g/1000 m²). The first sampling after the spraying wasfor Begonia elatior 1170 minutes, for Hedera helix 1260 minutes.
%DFR of the initial spray dosage '1200' minutes after the spraying for
Pirimicarb, fig 16.1:Begonia elatior: 0.63 g x 100/60 g = 1.05Hedera helix: 1.48 g x 100/60 g = 2.47
Mercaptodimethur, fig 16.2:Begonia elatior: 13.43 g x 100/120 g = 11.2Hedera helix: 25.18 g x 100/120 g = 21
Methomyl, fig 16.3:Begonia elatior: 8.69 x 100/48 g = 71.7Hedera helix: 34.4 x 100/48 g = 18.1
Iprodion, fig 16.4:Begonia elatior: 31.8 x 100/120 g = 34.1Hedera helix: 40.93 x 100/120 g = 26.5
The idea behind the experiment is to demonstrate the influence of plantspecie, leaf area index, undefined climatic differences (which is "normal"conditions in practice) and pesticide on DFR. At 2880 minutes (two days)after the spraying, there is a 1.3 to 4 fold difference between the two plant

148
species (leaf area, climate) in DFR. But the most influential parameter is inthis experiment the pesticide. Between pirimicarb and methomyl forBegonia spp., there is a 68-fold difference. Iprodion shows a differentad(ab)sorption kinetic on the two plant species.
These results indicate the necessity of using the actual pesticide whendeveloping DFR values.
Climatic conditions
The temperatures varied between 12 and 30°C in the green house 30 cmabove the plants during the two experiments.
Figure 16.1g DFR of pirimicarb/1000 m² leaf for two ornamentals sprayed with anautomatic hydraulic boom sprayer. % DFR (1200) for Hedera helix: 2.47and for Begonia elatior.: 1.05.
g DFR af pirimicarb/1000 m² blad for to potteplantearter sprøjtet medhydraulisk bomsprøjte. % DFR (1200) for Hedera helix: 2.47 og forBegonia elatior: 1.05.

149
Figure 16.2g DFR of mercaptodimethur/1000 m² leaf for two ornamentals sprayed withan automatic hydraulic boom sprayer. % DFR (1200) for Hedera helix: 21and for Begonia elatior: 11.2.
g DFR af mercaptodimethur/1000 m² blad for to potteplantearter sprøjtetmed hydraulisk bomsprøjte. % DFR (1200) for Hedera helix: 21 og forBegonia elatior: 11.2.

150
Figure 16.3g DFR of methomyl/1000 m² leaf for two ornamentals sprayed with anautomatic hydraulic boom sprayer. % DFR (1200) for Hedera helix: 71.7and for Begonia elatior.: 18.1
g DFR af methomyl/1000 m² blad for to potteplantearter sprøjtet medhydraulisk bomsprøjte. % DFR (1200) for Hedera helix: 71.7 og forBegonia elatior: 18.1.

151
Figure 16.4g DFR of iprodion/1000 m² leaf for two ornamentals sprayed with anautomatic hydraulic boom sprayer. % DFR (1200) for Hedera helix: 34.1and for Begonia elatior: 26.5.
g DFR af methomyl/1000 m² blad for to potteplantearter sprøjtet medhydraulisk bomsprøjte. % DFR (1200) for Hedera helix: 71.7 og forBegonia elatior: 18.1.

152
Table 17.1Summary of experiments 1 to 15. Oversigt over eksperimenterne 1 til 15.
Experim. No 1 No 2 No 3 No 4 No 5 No 6 No 7 No 8 No 9 No 10 No 11 No 12 No 13 No 14 No 15
Pesticide Pirimi-carb
Pirimi-carb
Pirimi-carb
Pirimi-carb
Pirimi-carb
Pirimi-carb
Paclo-butrazol
Paclo-butrazol
Endosul-fan
Endosul-fan
Metho-myl
Metho-myl
Mer-captodi-methur
Mer-captodi-methur
Mer-captodi-methur
Metho-myl
Pirimi-carb
Paclo-butrazol
Paclo-butrazol
Endosul-fan
Paclo-butrazol
Paclo-butrazol
Paclo-butrazol
Reentry time 3810minutes
3725minutes
2573minutes
- 910minutes
1376minutes
690minutes
690minutes
3785minutes
- 3465minutes
7800minutes
- 3915minutes
3780minutes
13834minutes
- 1376minutes
690minutes
690minutes
3785minutes
3965minutes
8115minutes
690minutes
690m71inu-tes
690minutes
Spr.equipm.
Hydr.spr.boom
Hydr.spr.boom
H.h.hydr.rifle
Hydr.spr.boom
Hydr.spr.boom
H.h.hydr.Rifle
Hydr. spboom
Hydr.spr.boom
Coldfogger
Coldfogger
Coldfogger
Coldfogger
Coldfogger
H.h.hydr.rifle
Coldfogger
Hydr.spr. boom
Hydr.spr.boom
H.h.hydr.rifle
Hydr.spr.boom
Hydr.spr.boom
Coldfogger
H.h.hydr.rifle
Coldfogger
Hydr.spr.boom
Hydr.spr.boom
Hydr.spr.boom

153
Table 17.1 continue. Fortsat
Experim. No 1 No 2 No 3 No 4 No 5 No 6 No 7 No 8 No 9 No 10 No 11 No 12 No 13 No 14 No 15
g/1000 m2
40 and52.3
74.2 223 74.5 163 88.25 1.04 and1.61
1.4 71 71 75 83.4 81.4 320 100
74.2 29.8 88.25 1.04 and1.61
1.4 71 320 100
1.04 and1.61
1.4
1.04
Plant sp. Miniroses
Miniroses
Kalan-choëbloss-feldiana
Miniroses
Hederahelix
Cut roses Miniroses
Miniroses
Begoniaelatior
Begoniaelatior
Dracaenamar-ginata
Polysciasbalfouri-ana
Dendrat-hemaindicum-hybride
Aeschy-nanthushybridae
Hederaspp.
Miniroses
Miniroses
Cut roses Miniroses
Miniroses
Begoniaelatior
Codiae-um vari-egatum
Cordyli-ne purple
Colum-neahybridae
Hederaspp.
Miniroses
Miniroses
Miniroses

154
Table 17.1 continue. Fortsat
Experim. No 1 No 2 No 3 No 4 No 5 No 6 No 7 No 8 No 9 No 10 No 11 No 12 No 13 No 14 No 15
Work. pro-ced.
Manual-ly.trimm.
Manually.trimm.
Cutting - Manual-ly spa-cing
Cutting Manual-ly pac-king
Auto-maticspacing
Cutting - Manual-ly pac-king
Manual-ly pac-king
- Manual-ly pac-king
Man.-packing(mostly),andmakingcuttings
Manually.trimm.
- Removebuds
Machinepacking
Remo-vingbuds
Manual-ly pac-king
Manual-ly pac-king
Manual-ly pac-king
Manual-ly pac-king
Man.packing,andmakingcuttings(mostly)
Man.+mach.packing
Mowingtables
Taggingplants
Month Oct May Mar Jun Mar May Aug Aug Nov Jun Oct Oct Apr Sep Mar
May Jun May Aug Aug Nov Oct Oct Sep Mar
Aug Aug
Aug

155
Table 17.1 continued. Fortsat
Experim. No 1 No 2 No 3 No 4 No 5 No 6 No 7 No 8 No 9 No 10 No 11 No 12 No 13 No 14 No 15
Stat. air (20L/min.) atreentry:
< 2 µg/h 2.4 µg/h 0.5 µg/h 3.22µg/h, at1170min.
10 µg/h 1.46µg/h
<LOQ =4.4 µg/h
<LOQ =4 µg/h
60 µg/h 22.4µg/h,3825minutesafter thespraying
3 µg/h 2 µg/h 7 µg/h,390 min.after thespray-ing<0.3µg/h1365min.after thespray-ing
<0.04µg/h
0.8 µg,1800min. aft.spr.
2.4 µg/h 1.3 µg/h,at 1170min.
1.46µg/h
<LOQ =4.4 µg/h
<LOQ =4 µg/h
60 µg/h 3 µg/h 2 µg/h <0.04µg/h
0.8 µg,1800min. aft.spr.
<LOQ =4.4 µg/h
<LOQ =4 µg/h
<LOQ =4 µg/h
DFR µg/100cm2 atreentry:
N.m. 1.2 µg 12.8 µg N.m. 392.9 µg 1.5 µg 1.5 µg - 3.87 µg - 1,56 µg 5.3 µg 16 to 49µg, 3700min.after thespray-ing
250 µg 140.8 µg
0.7 µg N.m. 1.5 µg 1.5 µg 0.88 µg 3.87 µg 2.2 µg 5.3 µg(P.balf.)
281 µg 140.8 µg
1.5 µg -
1.0 µg

156
Table 17.1 continued. Fortsat
Experim. No 1 No 2 No 3 No 4 No 5 No 6 No 7 No 8 No 9 No 10 No 11 No 12 No 13 No 14 No 15
Number ofworkers
4 1 2 0 1 2 6 2 9 0 1 1 0 1 1
5 0 2 2 1 8 1 1 1 1
1 2
2
Exposure,arith. orindiv.hand/8 h:
206.7 µg 428 µg N.d. N.m. 16968µg
931 and186 µg
107.95µg
<LOQ =33 µg
991 - N.d. 3.5 µg N.m. 31109µg
46747µg
75.5 µg N.m. 391 and795 µg
20.8 and51.2 µg
91.2 µg 1310 N.d. 4.3 µg 26290µg
79600µg
29.8 µg 63.2 and73.6 µg
36.8 and44.0
Exposure gmeanhand/8 h:
146 µg - - - - 416 82.3 µg - 925.7 - - - - - -
74 µg - 557 32.6 - 817.5 - - - -
- 68.2
40.4
Exposure,90% fractilehand/8 h
1400 µg - - - - - 450 µg - 1955,7µg
- - - - - -
117 µg - - - 5266 µg - - - -
-

157
Table 17.1 continued.Fortsat
Experim. No 1 No 2 No 3 No 4 No 5 No 6 No 7 No 8 No 9 No 10 No 11 No 12 No 13 No 14 No 15
Exposurebody/8 h:
N.m. N.d. 68 and73 µg
- 2762 µg 3315 and3315 µg
N.d. (seefig. 7.2)
N.m. Geom.mean:2569.390%fractile:4855.6
- 246 µg 281 µg N.m. 27411µg
11913µg
N.d. - 288 and837 µg
- - Geom.mean:1494.390%fractile:1844.5
1150 µg 142 µg 2516 µg 9043 µg
- N.m
-

158
Table 17.1 continued. Fortsat
Experim. No 1 No 2 No 3 No 4 No 5 No 6 No 7 No 8 No 9 No 10 No 11 No 12 No 13 No 14 No 15
Transfercoefficient,cm²/h
DFRn.m.
4466 No handexposure
No handexp., noDFR
540 Arithm.mean:4553Geom.mean:3391
Arithm.mean:1000Geom.mean:68690%fractile:3750
- Arithm.mean:3201Geom.mean:299090%fractile:6317
- =0, Nohandexp.
8.2 No handexpo-sure
1555 4150
Arithm.mean:1349Geom.mean:132390%fractile:2097
No handexp., noDFR
Arithm.mean:4838Geom.mean:4551
Arithm.mean:300Geom.mean:272
1295 Arithm.mean:4231Geom.mean:263890%fractile:17009
=0, Nohandexp.
10.1 1168 7067
248 -
Arithm.mean:505Geom.mean:502.5

159
Table 17.1 continued. Fortsat
Experim. No 1 No 2 No 3 No 4 No 5 No 6 No 7 No 8 No 9 No 10 No 11 No 12 No 13 No 14 No 15
Pers. airmonitoring atreentry:
N.m. N.m. 2.5 and2.9 µg/h
N.m. <LOQ =4.2 µg/h
N.m. <LOQ =4.4 µg/h
<LOQ =17.5µg/h
12.2µg/h
- <LOQ=0.5 µg/h
<LOQ =1.4 µg/h
N.m. 111 µg/h 45.8µg/h
N.m. N.m. N.m. <LOQ =4.4 µg/h
<LOQ =25.8µg/h
33.5µg/h
LOQ=0.4 µg/h
<LOQ =1.4 µg/h
<50 µg/h(shortpump-ing peri-od)
138.2µg/h
<LOQ =4.4 µg/h
N.m.
<LOQ =16 and16.5µg/h
Heating tubes% residues atreentry of theinitial spraydosage:
N.m. .05 .2 N.m. N.m. 2 25.8 N.m. .17 N.m. 6.25 4 N.m. 4.4 2.7
N.m. N.m. - N.m. N.m. .17 6.25 4 4.4 1.5
N.m. N.m.
N.m.
Tables %residues atreentry of theinitial spraydosage:
N.m. 1.3 .06 N.m. N.m. N.m. 33.7 N.m. .98 N.m. N.m. N.m. N.m. N.m. N.m.
N.m. N.m. - N.m. N.m. .98 N.m. N.m. N.m. N.m.
N.m. N.m.
N.m.

160
Table 17.1 continued. Fortsat
Experim. No 1 No 2 No 3 No 4 No 5 No 6 No 7 No 8 No 9 No 10 No 11 No 12 No 13 No 14 No 15
Curtains %residues atreentry of theinitial spraydosage:
N.m. N.m. N.m. N.m. N.m. N.m. N.m. N.m. 2.4 N.m. .8 N.m. N.m. N.m. N.m.
N.m. N.m. - N.m. N.m. 2.4 .8 N.m. N.m. N.m.
N.m. N.m.
Walls %residues atreentry of theinitial spraydosage:
N.m. .01 .003 N.m. N.m. N.m. N.m. N.m. .13 N.m. N.m. N.m. N.m. N.m. N.m.
N.m. N.m. - N.m. Nm. .13 N.m. N.m. N.m. N.m.
N.m. N.m.
N.m.

161
Table 17.2Potential exposure at re-entry and static air monitoring for 5 pesticides sprayed in green houses.Potentiel eksponering ved re-entry og luftmålinger for 5 pesticider sprøjtet i væksthuse.
N.m. = not measuredC = cuttingM.p. = manually packingM.a.p. = machine packingTag = taggingAut. sp. = automatic spacingR. bud = remove budsM.t. = moving tablesM.trim. = manually trimmingMan. sp. = manually spacing* = geometric mean used when individuals >2Exp. no. Pesticide g/1000 m2 Working
procedureRe-entry timeminutes afterspraying
Static airmonitoring at20 L/minutesµg/h
Personal airmonitoring at20 L/minutesµg/h
Exposure onhands, geom.mean* orarithm. meanµg/h
Exposure onbody ÷ handsgeom. mean*or arithm.mean µg/h
Total µg/h % resp./hands/body÷hands
10 Endosulfan 71 - - 22.4 (3825min. after spr.)
N.m. N.m. - - -
9 Endosulfan 71 C. 3785 60 12.2 116 321 497 12/23/669 Endosulfan 71 M.p. 3785 60 33.5 102 187 349 17/29/54
13 Mercaptodimethur 81.4 - - <0.3 (11365min. after spr.)
N.m. N.m. N.m. -
14 Mercaptodimethur 320 M.p. 3915 <0.04 111 3889 3426 7426 1/52/4614 Mercaptodimethur 320 M.p. 3965 <0.04 <50 3286 315 3601 -/91/915 Mercaptodimethur 100 M.p. (+c) 3780 0.8 (1800 min.
after spr.)45.8 5843 1489 7378 1/79/20
15 Mercaptodimethur 100 C. (+m.p.) 8115 0.8 (1800 min.after spr.)
138.2 9950 1130 11218 1/87/10
11 Methomyl 75 M.p. 3465 3 <0.5 <2.5 31 31 -/-/10011 Methomyl 75 M.p. 3465 3 <0.5 <2.5 144 144 -/-/10012 Methomyl 83.4 M.p. 7800 2 <1.4 <0.5 35 35 -/-/10012 Methomyl 83.4 M.p. 7800 2 <1.4 <0.5 18 18 -/-/1004 Methomyl 29.8 M.p. - 1.3 (1170 min.
after spr.)N.m. N.m. N.m. -
7 Paclobutrazol 1.04-1.61 M.p. 690 <4.4 <4.4 10.3 <1 10.3 -/100/-7 Paclobutrazol 1.04-1.61 M.a.p. 690 <4.4 <4.4 4.1 <1 4.1 -/100/-

162
Table 17.2 continued. Fortsat
Exp. no. Pesticide g/1000 m2 Workingprocedure
Re-entry timeminutes afterspraying
Static at 20L/min. µg/h
Personal at 20L/min. µg/h
Exposure onhands, geom.mean* or auth.mean µg/h
Exposure onbody ÷ handsgeom. mean*or auth. meanµg/h
Total µg/h % resp./hands/body÷hands
7 Paclobutrazol 1.04-1.61 M.p. + ma.p. 690 <4.4 <4.4 3.7 <1 3.7 -/100/-7 Paclobutrazol 1.04 Tag. 690 <4 <17 5.1 <1 5.1 -/100/-8 Paclobutrazol 1.4 Aut. sp. 690 <4 <17.5 <4.1 N.m. -8 Paclobutrazol 1.4 R. bud 690 <4 <25.8 11.4 <1 11.4 -/100/-8 Paclobutrazol 1.4 M.t. 690 <4 N.m. 8.5 N.m. 8.5 -/100/-
1 Pirimicarb 40-52.3 M. trim. 3810 <2 N.m. 18.3 N.m. 18.3 -/100/-2 Pirimicarb 74.2 M. trim. 3725 2.4 N.m. 53.5 <1 53.5 -/100/-2 Pirimicarb 74.2 M. trim. 13834 2.4 N.m. 9.3 <1 9.3 -/100/-3 Pirimicarb 223 C. 2573 0.5 2.6 <6.3 8.8 11.4 23/-/774 Pirimicarb 74.5 - - 3.22 (1170
min. after spr.)N.m. N.m. N.m. -
5 Pirimicarb 163 Man. sp. 910 10 <4.2 2121 345 2466 -/86/146 Pirimicarb 88.25 C. 1376 1.46 N.m. 52 414 466 -/11/896 Pirimicarb 88.25 R.bud. 1376 1.46 N.m. 70 70 140 -/50/50

163
Table 17.3% DFR of applied dosage 1000 minutes after the spraying of 5 pesticides.
% DFR af udsprøjtet dosis 1000 minutter efter udsprøjtning.
Exp.no.
Pesticide g.a.i. applied/1000m2
DFR µg/100 cm2
1000 min. afterspraying
% DFR of applied
9 Endosulfan 71 7 1.0
15 Mercaptodimethur 100 134.5 13.514 Mercaptodimethur 320 364.0 11.414 Mercaptodimethur 320 460.0 14.4
11 Methomyl 75 4.6 0.611 Methomyl 75 17.7 2.412 Methomyl 83.4 55 6.6
7 Paclobutrazol 1.61 1.5 9.37 Paclobutrazol 1.04 1 9.68 Paclobutrazol 1.4 0.88 6.3
2 Pirimicarb 74.2 2 0.36 Pirimicarb 88.25 2 0.25 Pirimicarb 163 393 24.1*3 Pirimicarb 223 48 2.2
* At re-entry 910 minutes after the spraying the plants were still wet.

164
Figure 17.1Sectioning of T-shirt and trousers after exposure.
Opdeling af T-shirt og bukser efter eksponering.

165
Figure 17.2Transfer coefficients and working procedures for five pesticides sprayed ondifferent ornamentals.
Transferfaktorer og arbejdsrutiner for 5 pesticider udsprøjtet på forskelligepotteplanter.

166
Figure 17.3Hand exposure and working procedures for five pesticides sprayed ondifferent ornamentals.
Håndeksponering og arbejdsrutiner for 5 pesticider sprøjtet på forskelligepotteplanter.

167
Figure 17.4Transfer coefficients, based on geometric mean, and working procedures forfive pesticides sprayed on different ornamentals, not sorted for workingprocedures.
Transferfaktorer, baseret på geometrisk gennemsnit, og arbejdsrutiner for 5pesticider sprøjtet på forskellige potteplanter, ikke sorteret forarbejdsrutiner.

168
Figure 17.5Transfer coefficients and working procedures for five pesticides sprayed ondifferent ornamentals. * = Kalanchoë.
Transferfaktorer og arbejdsrutiner for 5 pesticider sprøjtet på forskelligepotteplanter. * = Kalanchoë.

169
Figure 17.6µg DFR approximately 1000 minutes after the spraying/100 cm² leaf and gpesticide applied/1000 m² for all 5 pesticides. Average=0.12 g DFR/1 gapplied dosage.A: Parameter estimate, y= 1.1183* x (forced to 0,0), s=0.1777, Prob>|T|= 0.0001.B: Lower 95% mean, C: Upper 95% mean (on y = f(x)).D: Lower 95% predict,E:Upper 95% predict.
µg DFR/100 cm² blad ca 1000 minutter efter udsprøjtningen og g pesticidudsprøjtet/1000 m² for alle 5 pesticider. Gennemsnit = 0.12 g DFR/1 gudsprøjtet pesticid.A: Parameter estimat, y= 1.1183*x (tvunget gennem 0,0), s=0.1777,Prob>T=0.0001B: Nedre grænse for 95% gennemsnit. C: Øvre grænse for 95% gennemsnit(for y=f(x)).D: Nedre grænse 95% predikteret. E: Øvre grænse 95% predikteret.

170
4 Discussion
Exposure In average of all experiments, the potential exposure on respiration, handsand body÷hands was 2.4%, 63.3% and 34.3% respectively, table 17.2. Ifworker are working with bare hands and a 10% penetration of pesticidesthrough clothing is assumed, the figures for pesticides reaching the skin andinhaled, changes to 3.5%, 91.6% and 4.9% respectively. The hands areclearly the body part exposed to pesticides at re-entry in greenhouses. Thesefigures are subject to great variation in the individual experiment, as can beseen in table 17.2.
Transfer coefficients The range of transfer coefficients found is in good agreement with both theDutch, Swedish (even the Swede’s use a different DFR technique) , Germanand Finnish results (although the Finnish experiments were reportingexposure on the bare hand but covered with a glove). The transfercoefficients ranged from 0-7067 cm2/h (Fig. 17.2). Arithmetic mean = 1755cm2/h, s = 1985 cm2/h (n = 21) for all transfer coefficients (Geometric meannot calculated due to zero values). Table 17.1 summarises the 15experiments in commercial green houses.
Table 17.2 and 17.3 show selected data from table 17.1. Figure 17.3illustrates the huge variation in hand exposure in µg/8 h at re-entry. Thedifference in 25000-fold.
If methomyl and pirimicarb on Kalanchöe is excluded (extremely lowtransfer coefficients) the arithmetic mean was 2303 cm2/h ± one standarddeviation = 1979 cm2/h, geometric mean was 1495 cm2/h ± one standarddeviation = ÷525 (lower) and +4257 (upper) cm2/h (n = 16) and thus give a90-percentile of 5199 cm2/h. The distribution of the transfer coefficientsabove 10 cm2/h, was tested on SAS, univariate procedure with a Shapiro-Wilk test. The normal distribution was tested and Pr<W was 0.0501. If log-normal distribution was tested, Pr<W was 0.4124. Log-normal distributionshould be preferred due to a better fit although the normal distribution issignificant just above 95%limits. The reason for a better fit for the log-normal distribution could be due to the relatively few workers behind themajority of the transfer coefficients in the individual experiment, Fig. 17.4.
The experiment with methomyl is somewhat unexpected and disagreeingwith Bolelj et al (1991). We found relatively high dosages of methomyl onthe body ÷ hands (142-1150 µg methomyl/8 h) but only few µg methomyl/8h on the hands. Working with tomatoes and cucumbers Bolelj et al. found upto 2.9 mg methomyl/8 h. It could indicate a very plant specific dependantDFR. Experiment 16 did only show a 1.3 to 4 fold difference between fourornamental species and four pesticides. The use of the leaf punch methodwill probably tend to increase the DFR, especially for the systemicpesticides when the sub cuticular layers are extracted by the water. The DFRin experiment 11 and 12 could be “sap-DFR” and therefore not available forsurface contact of the plants. In experiment 11, a dry cotton glove waswiped over the leaves for 10 minutes, only touching the surface of the plantand was not in contact with the subcuticlar layers. No methomyl could bedetected by this gentle method of removing methomyl from the surface.

171
Transfer coefficients are When pooling all pesticides no significant correlation could be observedpesticide dependant between working procedures and transfer coefficient, Fig. 17.2. But within
eachpesticide there was a clear tendency to correlation between transfercoefficients and degree of contact with the plants (i.e. working procedures)fig 17.5. This means that the transfer coefficients in this Seri of experimentsseems to be pesticide dependant. No statistical evaluation has been tried dueto the small number of experiments.
Exposure on body ÷ hands Transfer coefficients are only based on hand exposure in these experimentsand in the literature. And the transfer coefficient is the key target in thisinvestigation. But in almost all the experiments, body exposure beside thehand exposure has been registered (Table 17.3). In experiment 15, theexposure of the body of mercaptodimethur was 10-20% of the totalexposure, in experiment 14 the body exposure accounted for 46% of thetotal exposure. Endosulfan and pirimicarb show similar distributions.Normally workers are wearing light clothing and if dry this ensure a reducedtransport of pesticide to the skin. If this is not the case, dermal exposurethrough unprotected skin and humid/wet skin should be considered. This issome of the reasons why we have raised the default transfer coefficientsabove what has been calculated only by hand exposure.
Applied dosage and DFR A significant correlation between applied dosage and DFR within eachpesticide is not present due to the interference from plant species. But table17.3 and Figure 17.6 show DFR approximately 1000 minutes after thespraying of all pesticides/100 cm2 leaf area. The correlation is positive andsignificant different from 0. The average value is 12% of applied dosagefound as DFR 1000 minutes after the spraying. Figure 17.6 shows that thereis a big variance in DFR in the experiments made, when applying the samedosage. Influential parameters are plant species, pesticide and applicationtechnique. Totally it means there is a positive significant correlation but thevariation in DFR is too big to be able to set a default value between gapplied pesticide and DFR.
Respiratory exposure The respiratory exposure seems low at re-entry for methomyl, paclobutrazoland pirimicarb (table 17.2). Endosulfan is registered up to 60 µgendosulfan/h when static air samples were made. Mercaptodimethur is inexperiment 14 and 15 resuspended in the air when workers are handling theplants. In general, no measurable amounts of pesticides occurred in the airbefore the sprayings, despite depositions of pesticides on inactive mediaafter spraying was registered.
Inactive media Deposition of pesticides on inactive media was measured on heating tubes,tables, glass walls and curtains. When analysed, we could always reportresidues to a smaller or larger extent. Most was detected of methomyl andpirimicarb on heating tubes. These two pesticides were applied with coldfogger. When using spray boom for application, pirimicarb was deposited invery small dosages, but the use of hand held rifle increased (off course) thedeposition up to 10-fold on heating tubes. The percentages of depositedpesticides at re-entry in table 17.1 seems low, compared to the applieddosage.
Spray pattern The spray deposition pattern was investigated in experiment 9, 11, 12, 13,and 15 using cold foggers and experiment 14 using hand held rifle. The
172
differences between the lowest and the highest deposition using cold foggerwas 10, 5.6, 4.3, 195 and 35-fold. For the hand held rifle in experiment 14, itwas only 3 fold. The deposition of pesticides is closely related todislodgeable foliar residues. Exposure of workers beyond the predictedaverage DFR-level could introduce a health risk. On the other hand onecould incorporate the variation in deposition using cold foggers and thiswould be reflected in the risk assessment of the worker. This wouldeventually lead to restrictions in the use of some pesticides in green houses.A 10-fold variation in deposition of pesticides is unacceptable. If pestcontrol is satisfactory under such spray conditions, it indicates the averagepesticide consumption is too high.
Influence on plant specie Experiment 16 shows the influence of plant specie and pesticide on DFR. Atand pesticide on DFR 1200 minutes after the spraying there was a 1.9 to 4-fold difference in DFR
between the plant species within the individual pesticide. The mostimportant parameter in this experiment seems to be the pesticide, with a 68-fold difference per g. a.i. applied leading to the conclusion that a defaultvalue of DFR related to applied dosage is difficult to obtain. Fig. 17.5support this view. DFR should be investigated with the actual pesticide.

173
5 Conclusion
Re-entry experiments have been made in 8 Danish commercial green housesgrowing potted flowers and cut roses. The investigated parameters were 5pesticides, 11 working procedures, 3 different spray equipment’s and avariety of plant species. 50 individual workers have been detected forexposure.
In average of all experiments, the potential exposure on respiration, handsand body÷hands was 2.4%, 63.3% and 34.3% respectively. If worker areworking with bare hands and a 10% penetration of pesticides throughclothing is assumed, the figures for pesticides reaching the skin and inhaledchanges to 3.5%, 91.6% and 4.9% respectively. The hands are clearly thebody part exposed to pesticides at re-entry in greenhouses. These figures aresubject to great variation in the individual experiment.
The measured transfer coefficients ranged from 0 to 7067 cm2/h ± onestandard deviation = 1937 cm2/h for all transfer coefficients (n=21).Excluding transfer coefficients below 10 (practically zero due to no DFR),arithmetic mean was 2303 cm2/h ± 1979 cm2/h, geometric mean was 1495cm2/h ± one standard deviation = ÷ 525 (lower) and +4257 (upper) cm2/h(n=16), thus leading to a 90-percentile of 5199 cm2/h. Log-normaldistribution of the transfer coefficients made a better fit than a normaldistribution. Only hand exposure was used in calculating the transfercoefficients due to the normally not protected hands. Working between thetables in the green houses resulted in many cases in exposure comparable tohand exposure. If the workers were wearing short pants, the dosage shouldbe considered as interesting as the hand exposure. The correlation betweenthe transfer coefficient and working procedure was poor when pooling allpesticides.
There was a better correlation within the individual pesticides. Makingcuttings or removing buds were correlated to the higher transfer coefficients,packing and spacing the plants at the tables were correlated to lower transfercoefficients. DFR one day after the spraying compared to initial spraydosage seems to be pesticide dependant.
Differences in DFR between plant species have been registered, but seemsto be of less importance with few exceptions.
Stationary air monitoring at re-entry showed that exposure via inhalation isless important except for endosulfan which was measured to be 60 µg/h at arespiration rate of 20 L/min. Personal air monitoring showed further more inthe experiments with mercaptodimethur that the concentration in airincreased to between 45.8 and 138.2 µg/h at a respiration rate of 20 L/m.due to the working activity.
Heating tubes, tables and to a lesser extent glass walls were contaminatedwith residues after the spraying. Endosulfan was found to be absorbed inplastic curtains and the residues persisted for a long time. In general, the airbefore the spraying in the green houses did not contain high concentrationsof pesticides.

174
Spray patterns of cold foggers have revealed a depression in spray quality.The differences in concentrations (dosage/area) have been measured forcold foggers to be from 4.3 to 195-fold. In the last case, 72.3% of the totaldeposited dosage was found on 7.7% of the sprayed area. This unevendistribution could lead to uncontrolled exposure of the workers, or themodels used to estimate exposure in green houses should include this kindof worst- case scenarios. The consequence would be a model which in anincreasing number of cases exceeds the accepted AOEL value. Reduction inthe number of pesticides allowed in green houses would be the result.
In summary, the transfer coefficients registered in this type of green housesis on the same level as the Dutch, Swedish, German and Finnish transfercoefficients in the same working area doing other working procedures,namely 5000-7000 cm2/h as the worst case. The DFR values should bedetected for each individual pesticide up to one week after the spraying. Itshould be investigated in a shorter series of experiments, how many andwhich plant species should be sprayed in order to obtain a picture thatcovers the practical situation.
Based on the present results and the literature a model for assessingexposure in green houses with ornamentals is suggested:
1) Default value of transfer coefficient should be no less than 7000 cm2/hfor working with ornamentals under green house conditions.
2) DFR of each individual pesticide should be documented if used in greenhouses. The duration of the experiment should be 7 days and dislodgeablefoliar residue studies should be present on at least 3-4 plant species. Thenumber of species should be investigated in a small scale experiment.
3) For non-systemic pesticides, data on personal air monitoring whenworking should be required. Increased exposure seems probable for this typeof pesticides, especially were the culture is placed above the worker.
4) When working between tables and in dense cultures personal protectionshould be considered, especially on uncovered parts of the body.

175
6 ReferencesAnonymous. 1993. Welac, Eurachem. Eurachem Guidance Document No. 1,Welac Guidance Document No. WGD 2, 1 st. ed. April 1993.
Bolelj, J., S. M., Hans Kromhaut, Mark Fleuren, Wim Tieleman and GovertVerstoppen. 1991. Re-entry after methomyl application in green houses.Appl. Occup. Environ. Hyg. 6(8), 672-676.
Brouwer, D.H., Brouwer, R. and Van Hemmen, J.J., 1990, Respiratoryexposure to field strength dusts in greenhouses during application and re-entry in Book of Abstracts Seventh International Congress of PesticideChemistry. Hamburg (H.Frehse, E.Kessler-Schmitz and S.Conway, eds.)Vol.III, p.375, IUPAC, Hamburg, Germany.
Brouwer, D.H., Brouwer, R., De Mik, G., Maas, C.L. and Van Hemmen,J.J., 1992a, Pesticides in the cultivation of carnations in greenhouses: Part I -Exposure and concomitant health risk, Am. Ind. Hyg. Assoc. J. 53:575-581.
Brouwer, D.H., De Vreede, J.A.F., Ravensberg. J.C., Engel, R. and VanHemmen, J.J., 1992d, Dissipation of aerosols from greenhouse air afterapplication of pesticides using a low-volume technique. Implications forsafe re-entry, Chemosphere 24:1157-1169.
Brouwer, R., Brouwer, D.H., Tijssen, S.C.H.A. and Van Hemmen, J.J.,1992b, Pesticides in the cultivation of carnations in greenhouses: Part II -Relationship between foliar residues and exposures, Am Ind. Hyg. Assoc. J.53:582-587.
Brouwer, R., Van Maarleveld, K., Ravensberg, L., Meuling, W., De Kort.W. and Van Hemmen, J.J., 1993, Skin contamination, airborneconcentrations and urinary metabolite excretion of propoxur duringharvesting of flowers in greenhouses, Am. J. Ind. Med., 24: 593-603.
Brouwer, R., Marquart, H., De Mik, G. and Van Hemmen, J.J., 1992c. Riskassessment of dermal exposure of greenhouse workers to pesticides after re-entry. Arch. Environ. Contam. Toxicol. 23:273-280.
Chester, G. 1995, Revised Guidance document for the conduct of fieldstudies of exposure to pesticides in use. Zeneca, June 1995. Draft.
Goedicke, H.-J., 1987, Rückstände von Planzenschutzmitteln aufPflanzenoberflächen als Quelle Für Intoxikationen und Möglichkeiten derExpositionsnormierung. Z. ges. Hyg. 33:339-342.
Goedicke, H.-J., 1988a, Zum Rückstandverhalten von Pflanzenschutzmittelnan Pflanzenoberflächen, Z. ges. Hyg. 34:279-282.
Goedicke, H.-J., 1988b, Zum Rückstandsverhalten von pirimiphos-methylauf Tomaten, Blatt- und Bodenoberflächen im Gewächshaus, Nahrung5:475-480.
Goedicke, H.-J., 1989, Exposition durch Rückstände auf Blattoberflächennach Anwendung von Phosphororganischen Insektiziden im intensivenApfelanbau. Z. ges. Hyg. 35:533-535.

176
Goedicke, H.-J., Hermes, H. and Wagner, R., 1989, Exposition durchRückstände auf Pflanzenoberflächen nach Anwendung vonPflanzenschutzmitteln im Gewächshaus, Z. ges. Hyg. 35:531-533.
Gunther, F.A., Iwata, Y., Carman, G.E. and Smith, C.A. 1977, The citrusreentry problem: Research on its causes and effects, and approaches to itsminimalization, Residue Reviews 67:1-139.
Iwata, Y., Knaak, J.B., Spear, R.C. and Foster, R.J., 1977, Worker reentryinto pesticide-treated crops I. Procedure for the determination of dislodgablepesticide residues on foliage, Bull. Environ. Contam. Toxicol. 18:649-655.
Jauhiainen, A., Kangas, J., Laitinen. S. and Savolainen, K., 1992, Biologicalmonitoring of workers exposed to mevinphos in greenhouses, Bull. Environ.Contam, Toxicol. 49:37-43.
Kangas, J., Laitinen, S., Jauhiainen, A. and Savolainen, K., 1992. Exposureof workers to mevinphos in greenhouses. Poster presented at a workshopon Occupational Skin Exposure to Chemical Substances of the FirstInternational Scientific Conference on Occupational Hygiene in Brussels.
Kangas, J., Laitinen, S., Jauhiainen, A. and Savolainen, K., 1993, Exposureof sprayers and plant handlers to mevinphos in Finnish greenhouses, Am.Ind. Hyg. Assoc. J. 54:150-157.
Krieger, R., Blewett, C., Edmiston, C., Fong, H., Gibbons, D., Meinders, D.,O`Connell, L., Ross, J., Schneider, F., Spencer, J. and Thongsinthusak, T.,1990, Gauging pesticide exposure of handlers (mixer/loader/applicators) andharvesters in California agriculture, Med. Lav. 81:474-479.
Krieger, R.I., Ross, J.H. and Thongsintusak, T., 1992, Assessing humanexposure to pesticides, Rev. Environ. Contam. Toxicol. 129:1-15.
Liesivuori, J., Lihkkonen, S. and Pirhonen, P., 1988, Re-entry intervals afterpesticide application in greenhouses, Scand. J. Envion. Health 14, Suppl.1:35-36.
Lindquist, R.K., Krueger, H.R. and Powell, C.C., 1987, Airborne andsurface residues of Permethrin after high- and low-volume applications ingreenhouses, J. Environ. Sci. Health B22:15-27
Löbel, H. and Schunk, W., 1982, Zur Exposition undGesundheitsgefährdung der Werktätigen in Gewächshausern durchRückstände cholinesterasehemmender Pflanzenschutzmittel, Z. ges. Hyg.28:697-699.
Maddy, K.T., Edmiston, S. and Richmond, D., 1990, Illnesses, injuries, anddeaths from pesticide exposures in California 1949-1988, Rev. Environ.Contam. Toxicol, 114:57-123.
Miller, J. C. and Miller, J. N. 1988, Statistics for analytical chemistry.Chapter 5, 3rd ed. Ellis Horwood, Chichester p. 227.
Morse, D.L., Baker, E.L. and Landrigan, P.J., 1982, Cut flowers: A potentialpesticide hazard, Am. J. Public Health 69:53-56.

177
Nigg, H.N., 1980, Prediction of agricultural worker safety reentry times fororgano phosphate insecticides, Am. Ind. Hyg. Assoc. J. 41:340-345.
Nigg, H.N., Stamper, J.H. and Queen, R.M., 1984, The development and useof a universal model to predict tree crop harvester pesticide exposure, Am.Ind. Hyg. Assoc. J. 45:182-186.
Nilsson, U., Nybrant, T., Papantoni, M., Mathiasson, L. 1996a, Long-termstudies of fungicide concentrations in greenhouses. 2. Fungicideconcentrations in air and on leaves after different exposure times and indifferent climate conditions. J. Agric. Food Chem. 44, no. 9, 2878-2884.
Nilsson, U., Papantoni, M. 1996b, Long-term Studies of FungicideConcentrations in Greenhouses. 3. Exposure Risks after Spraying inGreenhouses. J. Agric. Food Chem., 44, no. 9, 2885-2888.
Papantoni, M., Mathiasson, L., Nilsson, U. 1995, Long-Term Studies ofFungicide Concentrations in Greenhouses. 1. Technique for DeterminingSurficial Foliar Residues of Fungicides with Vinclozolin and Triadimefon asModel Compounds. J. Agric. Food Chem., 43, 157-164.
Popendorf, W.J. and Leffingwell, J.T., 1982, Regulating organo phosphateresidues for worker protection, Residue Reviews 82:125-201.
Timme, G., Frese, H. and Laska, V. 1986. Zur statistischen Interpretationund graphischen Darstellung des Abbouverhaltens vonPflanzenbehandlungsmittel-Rückständen II, Pflanzenschutz NachrichtenBayer 39: 188-204.
Van Hemmen, J. J. 1993. Re-entry Exposure and Product Development.Pesticides and green house crops: An example. Symposium, June 1993.Jellinek, Schwartz and Conally. Washington, DC. USA.
Van Hemmen, J.J., Brouwer, R. and Brouwer, D.H., 1992, Worker exposureto pesticides in greenhouses. Health risks during harvesting of flowers, MedFac. Landbouww. Univ. Gent, 57/3b:1269-1283.
Van Hemmen, J.J, Yvette, G.C., Van Golstein Brouwers and Derk, H.Brouwer. 1995. Pesticide exposure and re-entry in agriculture. In Methodsof Pesticide Exposure Assessment. Edited by P.B. Curry et al. Plenum Press.New York.
Williams, I.H., 1978, Dissipation of sulfotep and nicotine in a greenhouseatmosphere following their use as fumigants, J. Environ. Sci. HealthB13:235-241.
Williams, D.T., Denly, H.V. and Lane, D.A., 1980, On site determination ofsulfotep air levels in a fumigating greenhouse, Am. Ind. Hyg. Assoc. J.41:647-651.
Zweig, G., Leffingwell, J.T. and Popendorf, Wm., 1985, The relationshipbetween dermal exposure by fruit harvesters and dislodgeable foliarresidues. J. Environ. Sci. Health B20:27-59