Embed Size (px)
Citation preview
W O R K I N G P A P E R N O . 2 6
ChIld NutRItIONAl stAtus IN POOR EthIOPIAN hOusEhOlds:
the role of gender, assets and locationAlemu MekonnenBekele teferatassew WoldehannaNicola JonesJohn seagertekie AlemuGetachew Asgedom
As one of the poorest countries in the world, Ethiopia’s rate of child malnutrition is one of the highest, even within sub‑Sahara Africa. The causes and relative importance of various determinants of malnutrition in Ethiopia are not well understood. This paper specifically explores some of the less obvious factors affecting children’s nutritional status in Ethiopia. It is based on information collected in 2002 from 1001 households with eight‑year‑old children mainly from food insecure communities in Tigray, Amhara, Oromia, SNNP and Addis Ababa Regional States. As part of the Young Lives Project, this study is particularly important because the determinants of the nutritional status of eight‑year‑old children is much less researched than that of younger children, not only in Ethiopia but in other developing countries.
The results from simple correlation analysis indicated that a number of variables were significantly related to weight‑for‑height z‑score (WHZ) (as an indicator of wasting). In addition to analysing WHZ for the whole sample, we have also separately analysed WHZ for urban and rural households, and found that the determinants differed.
The results show that weight‑for‑height z‑scores depend on the sex of the child and suggest that short‑term malnutrition is higher for male children than for female children. We conclude that variables such as physical and natural capital (wealth index, ownership of radio, television and land), human capital (education of members of the household), social capital (strength of a caregivers’ ties to social organizations and networks), age‑sex composition of households (the number of girls, the number of female adults) and location of residence (rural or urban) are important in influencing WHZ in eight‑year‑olds.
We conclude that addressing child malnutrition, especially WHZ, requires a multi‑dimensional approach that takes into account food security, public health and gendered intra‑household dynamics if it is to be effective. Moreover, a cross‑sectoral nutrition policy is needed to improve policy synergies.
Published by
Young lives save the Children uK 1 st John's lane london EC1M 4AR
tel: 44 (0) 20 7012 6796 Fax: 44 (0) 20 7012 6963 Web: www.younglives.org.uk
IsBN 1-904427-27-8 First Published: 2005
All rights reserved. this publication is copyright, but may be reproduced by any method without fee or prior permission for teaching purposes, though not for resale, providing the usual acknowledgement of source is recognised in terms of citation. For copying in other circumstances, prior written permission must be obtained from the publisher and a fee may be payable.
designed and typeset by Copyprint uK limited
Young Lives is an international longitudinal study of childhood poverty, taking place in Ethiopia, India, Peru and Vietnam, and funded by DFID. The project aims to improve our understanding of the causes and consequences of childhood poverty in the developing world by following the lives of a group of 8,000 children and their families over a 15-year period. Through the involvement of academic, government and NGO partners in the aforementioned countries, South Africa and the UK, the Young Lives project will highlight ways in which policy can be improved to more effectively tackle child poverty.

the Young lives Partners Centre for Economic and social studies (CEss), India
department of Economics, university of Addis Ababa, Ethiopia
Ethiopian development Research Institute, Addis Ababa, Ethiopia
General statistical Office, Government of Vietnam
Grupo de Análisis para el desarrollo (GRAdE), Peru
Institute of development studies, university of sussex, uK
Instituto de Investigación Nutricional (IIN), Peru
london school of hygiene and tropical Medicine, uK
london south Bank university, uK
Medical Research Council of south Africa
RAu university, Johannesburg, south Africa
Research and training Centre for Community development, Vietnam
save the Children uK
statistical services Centre, university of Reading, uK
Child nutritional status in poor Ethiopian housEholds: thE rolE of gEndEr, assEts and loCation
Child nutritional status in poor Ethiopian housEholds:
the role of gender, assets and locationalemu MekonnenBekele teferatassew Woldehannanicola JonesJohn seagertekie alemugetachew asgedom
WorKing papEr no.26
Child nutritional status in poor Ethiopian housEholds: thE rolE of gEndEr, assEts and loCation
ii
ii
prefaceThispaperisoneofaseriesofworkingpaperspublishedbytheYoungLivesProject,aninnovativelongitudinalstudyofchildhoodpovertyinEthiopia,India(AndhraPradeshState),PeruandVietnam.Between2002and2015,some2000childrenineachcountryarebeingtrackedandsurveyedat3-4yearintervalsfromwhentheyare1until14yearsofage.Also,1000olderchildrenineachcountryarebeingfollowedfromwhentheyareaged8years.
YoungLivesisajointresearchandpolicyinitiativeco-ordinatedbyanacademicconsortium(composedoftheUniversityofOxford,theUniversityofReading,theLondonSchoolofHygieneandTropicalMedicine,LondonSouthBankUniversityandtheSouthAfricanMedicalResearchCouncil)andSavetheChildrenUK,incorporatingbothinterdisciplinaryandNorth-Southcollaboration.
YoungLivesseeksto:
Producelong termdataonchildrenandpovertyinthefourresearchcountries
Drawonthisdatatodevelopanuancedandcomparativeunderstandingofchildhoodpovertydynamicstoinformnationalpolicyagendas
Traceassociationsbetweenkeymacropolicytrendsandchildoutcomesandusethesefindingsasabasistoadvocateforpolicychoicesatmacroandmesolevelsthatfacilitatethereductionofchildhoodpoverty
Activelyengagewithongoingworkonpovertyalleviationandreduction,involvingstakeholderswhomayuseorbeimpactedbytheresearchthroughouttheresearchdesign,datacollectionandanalyses,anddisseminationstages
Fosterpublicconcernabout,andencouragepoliticalmotivationtoacton,childhoodpovertyissuesthroughitsadvocacyandmediaworkatbothnationalandinternationallevels.
Initsfirstphase,YoungLiveshasinvestigatedthreekeystorylines–theeffectsonchildwellbeingofi)accesstoanduseofservices,ii)socialcapital,andiii)householdlivelihoods.Thisworkingpaperisoneofaserieswhichconsideranaspectofeachofthesestorylinesineachcountry.Asaworkingpaper,itrepresentsworkinprogressandtheauthorswelcomecommentsfromreaderstocontributetofurtherdevelopmentoftheseideas.
TheprojectreceivedfinancialsupportfromtheUKDepartmentforInternationalDevelopmentandthisisgratefullyacknowledged.
Forfurtherinformationandtodownloadallourpublications,visitwww.younglives.org.uk
•
•
•
•
•
Child nutritional status in poor Ethiopian housEholds: thE rolE of gEndEr, assEts and loCation
iiiiii
the authorsTheauthorsofthispaperarebasedatthefollowinginstitutionsandtheleadauthorscanbecontactedatthegivenemailaddresses:
AlemuMekonnen,DepartmentofEconomics,AddisAbabaUniversity,Ethiopia;email:[email protected]
BekeleTefera,YoungLives,SavetheChildrenUK-Ethiopia;email:[email protected]
TassewWoldehanna,DepartmentofEconomics,AddisAbabaUniversity,Ethiopia;email:[email protected]
NicolaJones,YoungLives,SavetheChildrenUK;email:[email protected]
JohnSeager,HumanSciencesResearchCouncil,SouthAfrica
TekieAlemu,AddisAbabaUniversity,Ethiopia
GetachewAsgedom,AddisAbabaUniversity,Ethiopia
acknowledgementsTheauthorswouldliketothankArabellaDuffieldofSavetheChildrenUK,HowardWhiteoftheInstituteofDevelopmentStudies,SharonHuttlyandBridgetFennoftheLondonSchoolofHygieneandTropicalMedicine,RachelMarcusandColetteSolomonfortheirhelpfulcomments.ThepaperwaseditedbyColetteSolomon.
Child nutritional status in poor Ethiopian housEholds: thE rolE of gEndEr, assEts and loCation
iv
abstractAsoneofthepoorestcountriesintheworld,Ethiopia’srateofchildmalnutritionisoneofthehighest,evenwithinsub-SaharanAfrica.ThecausesandrelativeimportanceofvariousdeterminantsofmalnutritioninEthiopiaarenotwellunderstood.Thispaperspecificallyexploressomeofthelessobviousfactorsaffectingchildren’snutritionalstatusinEthiopia.Itisbasedoninformationcollectedin2002from1001householdswitheight-year-oldchildrenmainlyfromfoodinsecurecommunitiesinTigray,Amhara,Oromia,SNNPandAddisAbabaRegionalStates.AspartoftheYoungLivesProject,thisstudyisparticularlyimportantbecausethedeterminantsofthenutritionalstatusofeight-year-oldchildrenismuchlessresearchedthanthatofyoungerchildren,notonlyinEthiopiabutinotherdevelopingcountries.
Theresultsfromsimplecorrelationanalysisindicatedthatanumberofvariablesweresignificantlyrelatedtoweight-for-heightz-score(WHZ)(asanindicatorofwasting).InadditiontoanalysingWHZforthewholesample,wehavealsoseparatelyanalysedWHZforurbanandruralhouseholds,andfoundthatthedeterminantsdiffered.
Theresultsshowthatweight-for-heightz-scoresdependonthesexofthechildandsuggestthatshort termmalnutritionishigherformalechildrenthanforfemalechildren.Weconcludethatvariablessuchasphysicalandnaturalcapital(wealthindex,ownershipofradio,televisionandland),humancapital(educationofmembersofthehousehold),socialcapital(strengthofacaregiver’stiestosocialorganisationsandnetworks),age-sexcompositionofhouseholds(thenumberofgirls,thenumberoffemaleadults)andlocationofresidence(ruralorurban)areimportantininfluencingWHZineight-year-olds.
Weconcludethataddressingchildmalnutrition,especiallyWHZ,requiresamulti-dimensionalapproachthattakesintoaccountfoodsecurity,publichealthandgenderedintra-householddynamicsifitistobeeffective.Moreover,across-sectoralnutritionpolicyisneededtoimprovepolicysynergies.
Child nutritional status in poor Ethiopian housEholds: thE rolE of gEndEr, assEts and loCation
�
Contents
Preface ii
Theauthors iii
Acknowledgements iii
Abstract iv
�. Introduction 2
objectives of this paper 4
2. Reviewoftheliterature 6
2.1 household economic welfare 6
2.2 household factors 6
2.3 access to services 8
2.4 food aid 9
3. Approachandmethod ��
3.1 sustainable livelihoods approach 11
3.2 data and methods used 11
4. Empiricalresults �3
4.1 description of the data 13
4.2 Bivariate analysis of WhZ and its determinants 16
4.3 Multivariate analysis of WhZ and its determinants 16
5. Policyimplications 2�
5.1 food security 21
5.2 public health services 22
5.3 gender 23
5.4 the need for an integrated cross‑sectoral approach 23
Tables 25
Appendix:Definitionofwasting 42
References 43
Child nutritional status in poor Ethiopian housEholds: thE rolE of gEndEr, assEts and loCation
2
1. introductionEthiopiaisoneoftheleastdevelopedcountriesintheworldasmeasuredbythe(PurchasingPowerParity)GNPpercapitaorHumanDevelopmentIndex(UNDP,2002;WorldBank,2004),withabout44percentofthepopulationlivingbelowthepovertyline(MoFED,2002a).In2001,theunder-fivemortalityrateinEthiopiawasabout17percent(WorldBank,2004).Asisthecaseinmostdevelopingcountries,mostofthecausesofunder-fivemortalityinEthiopiaarerelatedtoacutelowerrespiratorytractinfections(ARI),malaria,diarrhoea,malnutrition1andmeasles(MoH,2002).Malnutritionisaloneresponsibleforover50percentofdeathsofunder-fivesindevelopingcountries,makingitoneofthemostimportantpublichealthproblems(Pelletier,1994;ShanghviandMurray,1997).Theconsequencesofchildmalnutritionincludepoorphysicaldevelopmentandlimitedintellectualabilitieswhichcanhavenegativeimpactsoneconomicgrowthbecausetheydiminishtheworkingcapacityofthesechildrenwhentheyreachadulthood(GirmaandGenebo,2002;Aldermanet al.,2004).
Wasting(acutemalnutritionwithlowweight-for-height)andstunting(chronicmalnutritionwithlowheightcomparedtostandardheight-for-age)inchildrenaged6-59monthswereestimatedtobe9.6and56.7percentrespectivelyforEthiopiain1999/2000.Thesefiguresareamongthehighestintheworldandevenwithinsub-SaharaAfrica(MoFED2002a,2002b;WorldBank,2004).AccordingtotheCentralStatisticsAuthority’sDemographicandHealthSurvey(CSA,2000),morethan50percentofchildrenunderfivewerestunted,some11percentwerewasted,and47percentwereunderweight(lowweight-for-age).Thiscomparespoorlywiththesub-Saharaaverageincidenceofunderweightandstuntedchildreninthe1990s,whichwas33percentand39percentrespectively(ChristiaensenandAlderman,2004).
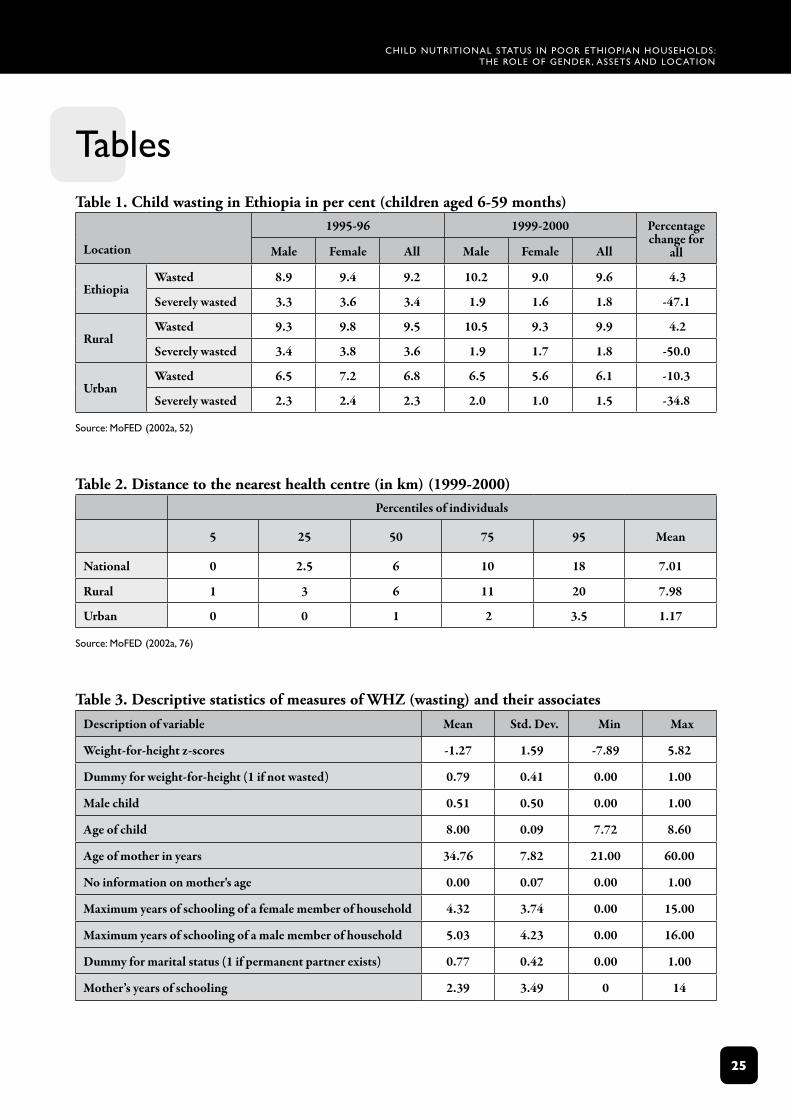
Atthenationallevel,theproportionofwastedchildrenincreased(from9.2percentto9.6percent)between1995/1996and1999/2000(MoFED,2002a).However,theproportionofseverelywastedchildrendeclinedsignificantlyfrom3.4percentto1.8percentinthesameperiod.ThisdirectlyreflectstheachievementsobservedinruralEthiopiawherewastingincreasedfrom9.5percentto9.9percent,butseverewastingdecreasedfrom3.6percentto1.8percent.Asfarasurbanareasareconcerned,wastingdeclinedby10.3percent,andseverewastingby34.8percentduringthesameperiod.Genderdisaggregationshowsthatfemaleswerebetteroffin1999/2000,whilemalesfaredbetterin1995/1996forbothwastingandseverewasting.Anegative(butweak)correlationwasfoundbetweenchildwastingandexpenditurequintilesforEthiopia(MoFED,2002a).2
Giventhesebleakstatistics,therehasbeenmuchdebateabouthowbesttoaddresschildmalnutritioninEthiopia(UNICEF,1994;EPHA,1996).Historically,inthe1950s,childmalnutritionpolicyinitiativesinitiallyfocusedondevelopingalowcostindigenoussupplementarydiet(EPHA,1996).However,followingtheestablishmentoftheEthiopianNutritionInstitutewithintheMinistryof
1 Theterm‘malnutrition’embracesunder-nutrition,over-nutritionandlackofessentialnutrients(WHO,1995).Inthispaper,however, we are primarily interested in determinants of under-nutrition, which has as its primary proximal determinant,inadequatefoodsupply.
2 Whenregionalprofilesareconsidered,thehighestproportionofwastedchildrenwasobservedinGambella(13percent)followedbyDireDawa(12.3percent),Afar(11.8percent)andTigray(11.7percent).DireDawawasfoundtohavethelargest proportionof severelywasted children (3.1per cent), followedbyTigray (2.3per cent) andAmhara,BenshangulGumuzandSomaliwith2.2percenteach(MoFED2002a).Wedonothaveinformationonthereasonsfortheseregionaldifferences. MoFED (2002a) suggested that the deterioration in the incidence of short term malnutrition (indicated bywasting)in1999/2000couldbeattributedtothedeclineininternationalaidduetothewarwithEritreaaswellasthedroughtexperiencedinthecountry.
Child nutritional status in poor Ethiopian housEholds: thE rolE of gEndEr, assEts and loCation
3
Healthinthelate1960s,interventionsexpandedtoincludethepromotionofbetterweaningpractices,researchintothenutritionalcontentofmajorstaplefoodsinthecountryandtheestablishmentofworkingrelationshipsatthegrassrootslevelbetweentheMinistriesofAgriculture(MoA),Health(MoH)andEducation(MoE).Totreatmalnutrition,nutritionrehabilitationcentreswerealsoestablishedatthistime,mainlyinthemajorcitiestoprovidemalnourishedchildrenwith6-8mealsperday(ESPC,1971).
Inthe1980s,inlinewithaglobalshiftinnutritionprogrammesfromverticaltomulti-sectoralprogrammes,thefocusinEthiopiaturnedtoaccesstofood,improvedchildcareandhealthintervention(Levinet al.,2003).Inthe1990s,theEthiopianNutritionInstituteamalgamatedwiththeNationalResearchInstitutetoformtheEthiopianHealthandNutritionResearchInstitutewhichwasresponsibleforresearch(EPHA,1996).Currently,theInstitute’sfocusonresearchandnutritionhasbeenconceptualisedasacross-cutting/cross-sectoralissue.
Theseadvancesnotwithstanding,Ethiopiastilllacksanintegratedcross-sectoralpolicytoguidenutritionprogrammesandinterventions.Forexample,whilefoodsecurityissueshavereceivedconsiderableattention,inadequateattentionhasbeenpaidtohealth-relateddimensionsofnutrition(EPHA,1996).Thus,althoughthePhase1HealthSectorDevelopmentProgrammewhichcoveredtheperiod1997/98-2001/02definednutritionasacross-sectoralissueintheFamilyHealthSectionoftheMinistryofHealth,nostaffwereassignedtoleadrelatedprogrammes(MoH,2000).Currently,governmentandinternationaldonor-supportednutritionprogrammesadoptoneofthreebasicapproaches:thefood-basedapproach,thepublichealthapproachandthegenderapproach.
The food‑based approachisenshrinedwithintheAgriculturalDevelopment-ledIndustrialisationStrategy,theNationalFoodSecurityStrategy,theRuralDevelopmentProgrammeandtheSustainableDevelopmentandPovertyReductionProgramme(SDPRP),allofwhichhave(implicitorexplicit)linkstofoodsecurityandeconomicgrowth.Theargumentisthatbecausepovertyandfoodinsecurityaretheunderlyingfactorsthatexposepeopletohungerandmalnutrition,nutritioninterventionprogrammesmustbelinkedtopovertyreductionpoliciesandstrategies(USAID,2003).Itassumesthatstimulatingagriculturalgrowthisinstrumentaltoincreasinghouseholdincomeandprovidingnecessaryhouseholdfoodfromownproductionorpurchasefromthemarket(FAO,1992;Admasu,2000;MoRD,2003).Alimitationofthisapproachisthatfoodavailabilityisnottheonlysolutiontomalnutrition;italsoinvolvescaringpractices,healthcareandsanitationservices(UNICEF,1990;1998).InEthiopia,malnutritionhasstillbeenhighevenwhenagoodharvesthasbeenachieved.TheEthiopiaDHSwhichwasconductedin2000,whichwasconsidered‘agoodnon-droughtyear,thelevelofmalnutritionwasextremelyhighamongchildren’(MoH,2004).
The public health approachassumesthatmalnutritionisapublichealthproblemwhichshouldbesolvedthroughpublicandcommunitymeasures,suchasthecontrolofdiarrhoealdiseases,improvingenvironmentalandpersonalhygiene,immunisationagainstmeasles,promotionofexclusivebreastfeeding,nutritioneducationandgrowthmonitoring.Inadditiontohealthandcarepractices,thepublichealthapproachfocusesonthepreventionofmicronutrientdiseasesthroughnutritionandhealtheducation,andthesupplyoffortifiedfoodandvitaminAandDcapsules,withanemphasisonchildrenunderfive(UNICEF,1994;MoH,2002).However,whileyoungadolescentgirlsaretargetedforironsupplements,therehasbeenlittleattentionpaidtothenutritionofschool-ageadolescent
Child nutritional status in poor Ethiopian housEholds: thE rolE of gEndEr, assEts and loCation
4
children.ThepublichealthapproachisadoptedbytheMinistryofHealth,supportedparticularlybyUSAIDandUNorganisations(egWHOandUNICEF),andincludes,inadditiontotheaboveactivitiesandprogrammes,nutritiontrainingintrainingcentresforhealthprofessionalssuchasnursesandfrontlinehealthworkers(MoH,2002).
The gender approach,whichdrawsonthesignificanceofmaternalcontrolofresourcesandcaringcapacity,recognisesthisascriticalforensuringthegoodnutritionalstatusofchildren(ACC/SCN,1998).Althoughtheresponsibilityofprovidingcareforachildshouldbethatofbothparents,inrealitythemajorresponsibilityofcareusuallyrestswiththemotherwhoalsohasaroleinincome-generation,maintainingacleanenvironmentforthehousehold,caringforsickchildren,andpreparingfoodforthehousehold(ibid).Alltheseresponsibilitiescompeteforthemother’stimeandmayaffecthercaringcapacity.Therefore,interventionsaimedatimprovingmothers’caringcapacityshouldbegearedtowardsmaximisingtheircontrolofresourcesandenablingthemtospendmoretimecaringfortheirchildren.Thisapproachemphasisestheimportanceofgender-sensitiveplanningandmothers’formaleducationincontributingtodecreasingthemalnutritionriskofchildren(Kabutha,1999).Animportantissueinthisconnectionisthespecificroleofnutritionaleducationandknowledge,asopposedtoeducationingeneral.TheEthiopianGovernmenthasendorsedaNationalPolicyonWomenwhichhassupportintheConstitutionoftheFederation,whiletheSustainableDevelopmentandPovertyReductionProgramme(SDPRP)hasalsotakengenderasoneofthecross-cuttingissuesrequiringattention(MoFED,2002b).
Objectives of this paper
WhiletheproblemofthenutritionalstatusofchildreninEthiopiaisfairlywell-documented,albeitforyoungerchildren,itsspecificdeterminantsarenotwellunderstood;onemustunderstandthecausesinordertoreducemalnutrition(SmithandHaddad,2000;SCUKEthiopia,2002;Yamanoet al.,2003;SCUK,2003).Areviewoftheliteratureshowsthatthereislittleagreementontherelativeimportanceofvariousfactorsaffectingnutritionalstatus.Forexample,somestudiesstresstheimportanceofamother’s(orparents’)educationand/ornutritionalknowledge(Block,2002)andintegratingwomen’sperspectivesandprioritiesintointerventioninitiatives(Caouetteet al.,notdated),whileothersrecommendtheneedtofocusonimprovingthepoverty/wealthstatusofhouseholds,particularlyinpoorcountrieslikeEthiopia(SCUKEthiopia,2002;SCUK,2003;ChristiaensenandAlderman,2004).
Thequestionisnotonlyofacademicinterest,butalsoofconsiderablepolicyrelevance,bothamongnationalandinternationalpolicy-makers.Forexample,SCUK(2003)questionsthenutritioncomponentofWorldBank-fundedprojectsinBangladesh,EthiopiaandUgandawhichincorporategrowthmonitoringasakeystrategytoreducemalnutritionamongyoungchildren.SCUK(2003:5)notesthattheseprojectsarebasedonthequestionableassumptionthatlackofknowledge,confidenceandcapacitytosolveproblemsaremajorcausesofmalnutrition,andthatprovidingcounsellingandmotivationtowomenabouthowtocarefortheirchildrenwillsignificantlyimprovenutrition,evenwhenfamiliesarepoorandservicessuchashealthandsanitationareveryweak.SCUK(2003)challengesthenotionthatusinggrowthmonitoringandpromotiontochangethebehaviourofmotherswillhaveasignificantimpactonnutritionalstatus,andarguesthatitisimportanttotakethebroadersocio-economicdeterminantsofmalnutritionintoconsideration.
Child nutritional status in poor Ethiopian housEholds: thE rolE of gEndEr, assEts and loCation
5
Whiletheliteratureonchildmalnutritionsuggestsdifferencesinmalnutritionratesthatdependonthesexofthechildandlocationofresidence,mosthavenotexploredthisindetail,particularlyinEthiopia.Othervariablessuchashouseholdcomposition(sexandage),socialcapital,maritalstatus,communitycharacteristics,economicshocksandfoodaidarealsopresentedintheliteratureasdeterminantsofchildren’snutritionalstatus.Knowledgeofthemagnitudeanddirectionoftheimpactsofmostofthesevariables,whichmaybedifferentacrosstimeandspace,iseitherabsentorverylimitedandthereforehindersthedevelopmentofeffectivepoliciesanddistributionofresources.Theaimhereisnottoarguethatoneapproach(foodsecurity,publichealth,gender)isbetterthananother,buttoshowthatensuringbetternutritionforchildrenrequiresastrategic,evidence-informedcombinationofalloftheapproachesdiscussedabove.
Theoverallobjectiveofthispaperistoexaminethedeterminantsofchildren’snutritionalstatususingweight-for-heightz-score(WHZ),whichisaninternationallyacceptedoutcomeindicator.WHZwasselectedbecausetheinformationcollectedforeight-year-oldchildrenfocusedontheir(andtheirhouseholds’)currentcircumstancesaswellasexperiencesofeconomicshocksinthepreviousthreeyears.Stuntingorgrowthretardation,whichisanindicatorofchronicmalnutrition,wasnotconsideredanappropriateoutcomemeasureasitsunderlyingdeterminantsmayhaveoccurredduringinfancy,whichwasoutsidethescopeoftheYoungLivessurveyofeight-year-olds.Inotherwords,stuntingoccursinyoungchildrenduetorecurrentepisodesorprolongedepisodesofnutritiondeficiency(intermsofcaloriesand/orproteinavailabletobodytissue),inadequatefoodintakeorpersistentorrecurrentill-health.WHZisalsoofmoreinterestfromapolicyperspectiveforeight-year-oldchildrensince,becauseitisanacutecondition,itcanbereversedgivenfavourableconditions,whereaslowheight-for-agez-score(HAZ)islargelyirreversibleinchildrenoverthreeyearsofage(Martorellet al.,1994).3
Whileexaminingthedeterminantsofchildwastingingeneral,thepaperfocusesonconsideringdifferencesbetweenboysandgirlsandacrosslocationsofresidence(urbanversusrural).Sincemanyofthesechildrenareengagedinpaidorunpaidwork,anattemptisalsomadetofindoutwhetherthereisanyrelationshipbetweenchildwastingandchildwork.Thepaperusesthesustainablelivelihoodsapproach(SLA)asaconceptualframework.WealsomakeuseofUNICEF’sconceptualframeworkasaguideforempiricalanalysisforlookingattheunderlyingdeterminantsofmalnutrition(UNICEF,1990;1998).
Section2providesabriefreviewoftheliterature.Section3presentstheapproachandmethodusedinthepaper,whiletheempiricalresultsarepresentedinSection4.Thepaperendswithasummaryoftheresultsandadiscussionofthepolicyimplications,whichattemptstointegratetheinsightsofthefood-based,publichealthandgenderapproaches(Section5).
3 Note,however,thatresearcherssuchasYaqub(2002)suggestthat,insomecases,reversalmaybepossible–iechildrenmaybeabletomakeupforpriorunder-developmentatlaterstages.
Child nutritional status in poor Ethiopian housEholds: thE rolE of gEndEr, assEts and loCation
6
2. review of the literatureThissectionbrieflyreviewstheliteratureonthedeterminantsofchildren’snutritionalstatus.Variablesrelatedtohouseholdeconomicwelfare,householdcompositionandeducation,accesstoservicesandfoodaidareconsideredinturn.
2.1 Household economic welfare
Wealth/income of the household
Asacknowledgedinmanystudies,anincreaseinhouseholdincome/wealthisexpectedtoreducechildmalnutrition(Moen,1993;Haideret al.,nodate;Glewweet al.,2002;ChristiaensenandAlderman,2004).Forexample,Haideret al.(basedontheirstudyundertakeninHolettaworeda (district),Oromiyaregion)reportedthatchildmalnutrition(measuredbystunting)issignificantlylowerinhouseholdswithcrossbredcows(iebetterquality)thaninthosewithout.Itwasalsoshownthathouseholdswithcrossbredcowshadahigherlevelofconsumptionofcalories,proteinandothernutrients.Thehigherconsumption,theynoted,wasduetothehigherincomebecauseoftheownershipofcrossbredcows.AccordingtoChristiaensenandAlderman(2004),sustainedincomegrowthof2.5percentperadultoverafifteen-yearperiodcouldbeassociatedwitha3-6percentdeclineinchronicchildmalnutritioninEthiopia.Theyargued,however,thatincomegrowthalonemightnotbesufficienttoalleviatechildmalnutrition.Similarly,Glewweet al.(2002)observedthat,duetorapideconomicgrowthinVietnamsince1986,adramaticdeclineinpovertyandchildstuntingwasachieved.Basedontheirempiricalinvestigation,theyconcludedthatgrowthinhouseholdincome,althoughnotverylarge,hadapositiveimpactonchildnutritioninVietnamduringthe1990s.Theyalsonotedthat,overtime,childstuntingdeclinedwithineachquintileevenafteradjustmentforchangeinincomewasmade,whichsuggeststhatthereareotherfactors,inadditiontoincomegrowth,whichledtoimprovementsinchildnutrition.
Shocks
Differentshocks,suchasdrought,arealsoconsideredtobeimportantininfluencingthenutritionalstatusofchildren(HoddinottandKinsey,2001;Aldermanet al.,2002;DerconandHoddinott,2003;Yamanoet al.,2003;CarterandMallucio,2003).DerconandHoddinott(2003)consideredtheimpactofshocksonhealthstatususingdatafromEthiopiaandZimbabwe,andfoundthattheimpactofshockswithinthehouseholdisnotuniform.Theyfoundthatyoungerpreschoolersweremoreadverselyaffectedbyshockssuchasdroughtthanolderpreschoolerswere.
2.2 Household factors
Agrowingnumberofstudiesrecognisetheimportantrolethathouseholdcompositionandparentallevelsofeducationplayinshapingchildren’snutritionaloutcomes.
Household composition
Theevidenceonhouseholdcompositionandchildmalnutritionismixed.ChristiaensenandAlderman(2004)foundthatlargerfamilysizeresultsinlessstuntingamongchildreninEthiopia.Theyargue
Child nutritional status in poor Ethiopian housEholds: thE rolE of gEndEr, assEts and loCation
�
thateconomiesofscaleintimeforchildcareandexpenditurecanbeenjoyedinlargefamiliesandthatchildrenbenefitfromparents’accumulatedexperiencesincareofyoungchildren.However,Desai’s(1995)cross-countrystudyfoundthatthenutritionofachildagedbetween6and36monthsislikelytobenegativelyaffectedbythepresenceofasiblingaged0-5yearsassiblingsofasimilaragearelikelytocompeteforparentalresources.Havingsiblingsof6-12yearshasalesscleareffect,whichissometimesnegative.Thepresenceofsiblingsof13-15yearshasapositiveeffectonachild’snutritionalstatus.
“Since children in many less developed countries tend to become economically productive at a very early age, it is not surprising that competition for parental resources is strongest from children less than five years old, well before the age when they can be self-supporting” (ibid:201).
Desaiarguesthattheabilityforparentstoprovideadequatenutritionforyoungchildreninlargefamiliesmaybeenhancedbytheexistenceofextendedkinshipnetworksor,alternatively,statesubsidiesforchild-relatedexpenses.
Sex of a childAnumberofstudiesinAfricasuggestthatratesofmalnutritionamongboysareconsistentlyhigherthanamonggirls(Svedberg,1990;MoFED,2002a;Glewweet al.,2002;SahnandStifel,2002;ChristiaensenandAlderman,2004).SahnandStifel(2002)presentthreepossibleexplanationsforsucharesult.Thefirstisthatthereisaproblemwiththegender-specificstandardfortheAfricanpopulation–similartotheinconsistenciesnotedregardingtheweight-for-heightcurvesforyoungchildren(<2years)inanumberofAfricancountries(Macfarlane,1996).Thesecondisthatgirlsaregeneticallymorerobustthanboysare.Thereissomeevidencethatamongpre-adolescentchildrenthereisanincrementoffatinpreparationforthegrowthspurt;thiswasalsotrueforoursample.Thisincreaseoffatisgreaterforgirlsthanboys(Whitney,2002,citedinBrown,2002).Thethirdisthatthereisgreaterinvestmentinyounggirlsthanboys,althoughthiswouldbecounter-intuitivesincegirlsarewidelyregardedasa‘poorerinvestment’sincetheyeventuallymarryandleavetojointheirhusbands’family.Wemayalsoaddafourthpossibleexplanation:thatitreflectsboys’andgirls’gender-specificroles–iegirls’betteraccesstofoodthroughtheirrolesincooking,togetherwithacombinationofboys’higherenergyexpenditureandlackoffoodduringthedaywhentheyareinvolvedintaskssuchasherdinganimals.4Notealsothattheenergyrequirementisdifferentforboysandgirls.Fortheage-groupbetweenfiveandnineyearsofage,whichisrelevantforthispaper,therequirementis1980kcalforboyscomparedto1730kcalforgirls(WHO,1985).
Household educationVariousstudieshaveconcludedthatparentaleducation,especiallymothers’education,isakeyelementinimprovingchildren’snutritionalstatus(Moen,1993;ChristiaensenandAlderman,2004).Glewwe(1999)investigatedthemechanismsthroughwhicheducation(schooling)resultsinbetterchildnutritionand/orhealth.Specifically,Glewwe(ibid)identifiedthreepossiblepathways:1)directlessonsinnutritionandhealthinschoolstofuturemothers;2)gainingnutritionalknowledgebecauseofliteracyandnumeracyskillsacquiredinschool;and3)exposureto,andfamiliaritywith,modernsocietythroughschoolwhichfacilitatestheuseofmodernmedicines.Theimplicationisthatschoolingisassociatedwithchildnutritiononlyifitcanimprovemothers’nutritionalknowledge.Glewwe(1999)furthersuggestedthatsuchknowledgecouldbeattainedoutsidetheclassroom.Aswillbe
4 Werecognisethatthisgenderdivisionoflabourisnotrigidbecausegirlsarealsoinvolvedinherding;ingeneral,however,moreboysareinvolvedintheactivity.
Child nutritional status in poor Ethiopian housEholds: thE rolE of gEndEr, assEts and loCation
�
discussedintheconcludingsectiononpolicyimplications,thisfindingmaybeofsignificanceforapoorcountrylikeEthiopia,whereformaleducationislimited,butwhereitispossibletoimprovenutritionalknowledgethroughspecificnutritioneducationprogrammes(ChristiaensenandAlderman,2004)withoutformalschooling.
However,theimpactofmothers’schoolingonchildnutritionisnotonlythroughnutritionalknowledge.Aneducatedmotherislikelytohaveahigherincome(whichcandirectlyaffectherchildren’shealthandnutrition)andhigherstatusandpowerinthehouseholdandcommunity(whichwillputherinabetterpositiontomakedecisionsaboutherchildren’sneeds)(Moen,1993).Theliteraturealsonotesthat,particularlywherethegenerallevelofeducationofthecommunityislow,thelevelofeducationoffemaleandmalemembersofthehouseholdcouldbeparticularlyimportantinindirectlyinfluencingchildnutritionalstatus(BasuandFoster,1998;Gibson,2001).
Morespecifically,ChristiaensenandAlderman(2004)foundthattheeffectofmaternaleducationisabouttwiceasimportantasthatofpaternaleducation.Moreover,theyfoundthatprimaryschoolcompletionofatleastoneadultfemaleinahouseholdresultsina6-11percentdeclineinstunting,whilecompletionofprimaryschoolbyatleastonemaleadultreduceschildstuntingbyonly2-8percent.5
2.3 Access to services
Water and sanitation
Ahousehold’saccesstofacilitiesislikelytobecorrelatedwithcommunitycharacteristics.Householdslivinginwealthiercommunitiesmighthavearelativelyhealthyenvironment,whichimpliesbettersanitationfacilities,accesstocleanwaterandhealthcarefacilities(Glewweet al.,2002).Waterandsanitationplayaparticularlyimportantroleinchildnutritionduetotheirimpactondiarrhoealdiseases.
ChristiaensenandAlderman(2004)notedthatinEthiopia,14percentofhouseholdsinurbancommunitiesgetwaterfromtheirowntapand3percenthaveflushtoilets.However,nohouseholdsinruralareashadpipedwaterintheirhomeandonly1percenthadflushtoiletfacilities.Theirfindingsindicateasignificantandpositiveimpactofthesefacilitiesonchildnutrition.Glewweet al.(2002)consideredtheimpactofcleanwater,asanitarytoiletandelectricityonchildhealthinVietnam.Theyfoundthat,whenthethreevariablesareincludedseparately,thelackofasanitarytoiletandelectricityhadsignificantnegativeeffectsonchildhealthwhilecleanwaterhadnosignificanteffect.Whenthethreevariableswereaddedsimultaneously,electricitylostitsstatisticalsignificancewhileasanitarytoiletremainedsignificant.Theyconcludedthatpoliciesdirectedatimprovingsanitarytoiletsinacommunitywouldhavebetterhealthoutcomesthaneitherwaterorelectricityalone.
Esrey(1996)andEsreyet al.(1992)foundinamulti-countrystudythatimprovedsanitationhadasubstantialeffectonnutritionalstatus,whileimprovementinwatersupplyenhancestheseeffects.Theyalsonotethatwhenconsideredseparately,watersupplyhasasmallereffectonnutritionalstatusthansanitation.
5 PrimaryschoolcompletionbyallEthiopianwomenwouldresultina7percentdecreaseinthe(stunting)gapof2.48HAZpoints(accordingtoChristiaensenandAlderman’sestimate)betweentheHAZscoreoftheEthiopianpopulationandthestandardisednormof ahealthypopulation.Post-secondary schoolingalsohas anadditional impact to thatofprimaryorsecondaryschooling.Theseresultscouldpossiblybeduetoapositivecorrelationbetweeneducationlevelandincome,andthefactthathigherincomeresultsinbetter-nourished(healthy)children.
Child nutritional status in poor Ethiopian housEholds: thE rolE of gEndEr, assEts and loCation
�
Access to health services
Accesstohealthservicesisthemaindeterminantofwhetherthepublicisgoingtoutilisetheservices.However,onealsohastoconsiderthequalityandpricesassociatedwiththeservice,althoughtheyobviouslyhavelittlerelevanceifaccessislimited(MoFED,2002a;2002b).Accesstohealthservicesisexpectedtoinfluencenutritionalstatus,aschildrenwithoutaccesstosuchservicesaremorelikelytobemalnourished,reflectedthroughweightlosswhichisassociatedwithuntreateddiarrhoeaandotherinfectiousdiseases.
InEthiopia,itisestimatedthatonly38-47percentofthetotalpopulationhaveaccesstohealthservices(DegefeandNega,2000).Healthservicesarealsounevenlydistributed,asmorethan50percentareconcentratedinafewurbanareas,mostoftheminAddisAbaba,inacountrywhereurbandwellerscompriseonlyabout15percentofthepopulation.Theratioofnationalpopulationtohospitalbedsisabout6000:1(thehighestratiointheworld),whichisaboutfourtimeslargerthantheaverageforsub-SaharaAfrica.Thetotalpopulationperprimaryhealthcarefacilityisabout21,992,whichisthreetimeshigherthantheaverageforsub-SaharaAfrica.Urbanareasareservedby72percentofmedicaldoctors,89percentofhealthofficersand58percentofnurses,whileabout35percentofallhospitalbedsarelocatedinAddisAbaba(DegefeandNega,2000).
Oneoftheimportantmeasuresofaccesstohealthfacilitiesusedintheliteratureisthedistancebetweenthehousehold’shomeandthenearesthealthcarefacility(MoFED,2002a;Roberts,2003;ChristiaensenandAlderman,2004).Thisindicator,aproxyforavailabilityofhealthcare,whichaffectshealthcarechoices,iswidelyusedinmalnutritionstudies(ChristiaensenandAlderman,2004),andisparticularlyusefulforacountrylikeEthiopiawheretransportationnetworksarepoorintermsofcoverage,roadqualityandsafety(MoFED,2002a).Theaveragedistancefromahouseholdtothenearesthealthcentre,asreportedbyMoFED(2002a)andbasedonthewelfaremonitoringsurveyof1999-2000,isgiveninTable2.However,ChristiaensenandAlderman(2004)foundthataftercontrollingforanumberofotherdeterminantsofchildmalnutrition,distancetothenearesthealthcentreisnotasignificantdeterminant.Theysuggestthatthislackofexplanatorypowerofthedistancevariablemightbeexplainedbythefactthattheproxyforaccesstohealthcentredoesnotcapturethequalityofhealthcareprovided,whichisasimportantasdistance.
2.4 Food aid
Giventheimportanceofdisasterreliefinmanydevelopingcountries,foodaidprogrammesaresignificant.Foodaidisexpectedtoaffectthegeneralnutritionalstatusofhouseholdsreceivingit.However,thedistributionoffoodwithinthehouseholdisalsoanimportantissue,particularlyforchildrenastheirwelfaredependsonthedecisionsandactionsofadultmembersofthehousehold.Usingpaneldata,Quisumbing(2003)studiedtheeffectsoffoodaidonchildnutritionalstatus(iestuntingandwasting)inruralEthiopia.Inadditiontoaconsiderationoftheeffectsoftotalfoodaid,shealsolookedatthepossibledifferentialeffectsoffreedistribution(FD)andfood-for-work(FFW)onthenutritionalstatusofboysandgirls.Sheconcludedthattheeffectsoffoodaidonchildmalnutritionaredifferentdependingonthemodalityoffoodaidandthegenderofthechild.Inparticular,shefindsthatbothFDandFFWhaveapositiveimpactonwasting,ameasureofmalnutritionexpectedtorespondmoretosuchinterventionsintheshortterm.However,householdsseemtoinvestFDingirls’nutritionwhileproceedsfromFFWareinvestedinboys’nutrition.Two
Child nutritional status in poor Ethiopian housEholds: thE rolE of gEndEr, assEts and loCation
�0
possibleexplanationsthatQuisumbingprovidesforthedifferentialimpactsoffoodaidonboysandgirlsare:1)thathouseholdsareattemptingtoredressimbalancesexistinginthenutritionalstatusofchildren(whichareworseforboysthanforgirls);and2)FFW,whichisincreasinglytargetedtowardswomen,maygomoretoboyswhomaybefavouredastheyareimportantsourcesofoldagesecurity.However,FDwhichleadstoageneralincreaseinhouseholdincome/wealthmaybeusedtoimprovethenutritionalstatusofbothboysandgirls.Similarly,Yamanoet al.(2003)useddatafor1995-96inEthiopiaandfoundthatfoodaidhasasubstantialeffectonthegrowthofchildrenagedbetween6and24months.
Insummary,theliteraturereviewhashelpedusidentifyimportantfactorsthatareassociatedwithchildmalnutritionindevelopingcountries,includingfactorsrelatedtohouseholdeconomicwelfare,householdcompositionandeducationlevels,accesstoservices(health,waterandsanitation)andfoodaidprovision.DrawingontheYoungLivessampleof1001eight-year-oldsfromfivedifferentregionsofthecountry,thispaperwillcontributeamorecomprehensiveanalysisofthedeterminantsofwastingofeight-year-oldchildreninmainlypoorEthiopianhouseholds,aswellasprovideinsightsintotheirinteractiveimpactandrelativeimportance.
Inaddition,weidentifythreemajorgapsintheliteratureonchildmalnutritioninEthiopia.First,whilemostnutritionalstudiesfocusonunder-fivesoradolescents,wearelookingatchildrenbetweentheagesof7.5and8.5years.Thisisoneoftheimportantanduniquecontributionsofthisstudy.
Second,childlabourhasnotbeenexploredasadeterminantofchildmalnutrition.Ithasthepotentialtoinfluencechildren’snutritionalstatusbothpositivelyandnegatively:workingmaygeneratemoreincomeforthefamilytobuyfood,butmayalsoresultinmoreenergyconsumption.Thenetresultofsuchpositiveandnegativeimpactscanbemeasuredbywasting.
Third,ourreviewoftheliteraturesuggeststhat,withveryfewexceptions,socialcapitalhasnotbeenexploredasapossibledeterminantofchildmalnutrition.(TheYoungLivesdefinitionofsocialcapitalispresentedbelow).Onecouldexpectsocialcapitaltoinfluencethenutritionalstatusofpoorchildrenbecauseitmayserveasasubstituteforoneormoreofthefollowingproblems:lowlevelsofhouseholdeducationbyallowingforsharingofinformation,lowlevelsofhouseholdincomebypoolinglabourorassets,imperfectionsofcreditmarkets(egthroughinvolvementininformalrotatingcreditschemes),andtheabsenceofformalinsuranceagainstrisksandshocks(CarterandMallucio,2003).
Lastly,itcanbearguedthatinadditiontoknowingthespecificeffectsofchildlabour,socialcapitalandurban/ruraldifferences,theeffectsofothervariablesusedintheliteraturecouldbedifferentwhenthesethreevariablesareincludedinouranalyticalmodel.
Child nutritional status in poor Ethiopian housEholds: thE rolE of gEndEr, assEts and loCation
��
3. approach and method
3.1 Sustainable livelihoods approach
Thispaperusesthesustainablelivelihoodsapproach(SLA)astheconceptualframework.SLAisaholisticapproachthathelpsdevelopmentpolicyaddresstheissuesofdevelopment,sustainableresourcemanagementandpovertyalleviationsimultaneously(UNDP,1997).Theframeworkrepresentsanattempttoprovideaholisticanddynamicunderstandingofthecausesanddimensionsofpoverty,asopposedtothepreviousnarrowconceptualisationswhichtendtocharacterisepovertyuni-dimensionallyintermsofincomeandconsumptioncriteria(Farringtonet al.,1999;Majale,2002).Itincorporateshouseholds’physical,natural,financial,humanandsocialcapitalassets,andthewayhouseholdscombinetheseresourcesastheypursueproductiveandreproductivelivelihoodstrategies.Asnotedearlier,wealsobasetheempiricalanalysisonUNICEF’smalnutritionframework,whichconsidersinadequatenutrientintakeanddiseaseasimmediatetriggerfactorscausingmalnutrition.Theframeworkconsiderstheseimmediatecausestoberesponsivetothefollowingunderlyingcauses:insufficienthouseholdfoodsecurity,inadequatematernalandchildcare,insufficienthealthservicesandanunhealthyenvironment(UNICEF,1990;1998).
3.2 Data and methods used
Thedatausedforthisstudyderivefromasurveyof1001householdswitheight-year-oldchildreninmainlyfoodinsecurecommunitiesinTigray,Amhara,Oromia,SNNPandAddisAbabaRegionalStates.Thedatacover20sentinelsites(12ruraland8urbanareas)whichwerepurposefullyselected;thesesitesgenerallycontainpoorhouseholds.Theselectionofhouseholdswithinasitewasdonebygoingdoor-to-doorineachareatoidentifythosehouseholdswithchildrenbetween7.5and8.5yearsofageatthetimeofthesurvey(inthesecondhalfof2002).6
Variablesthatinfluencehouseholdeconomicwelfare,suchaswealth,landandcattleownership,foodavailabilityandeconomicshocks,arealsoincludedintheanalysis,astheyarelikelytoinfluencewasting.Awealthindexwasusedtoassesstheeconomicstatusofthehouseholdbecauseofthedifficultiesinobtainingdataonexpenditureorincomeandtherelativeunimportanceofcashincomeinverypoorruralhouseholds.
Thewealthindexwasconstructedfromvariablesthatarebroaderthanproductionassets,suchashomeownershipandthedurabilityofthehome,plusaccesstoinfrastructuresuchaswaterandsanitation.7Theweightsweattacharenotbasedontherelativeimportanceoftheitemsincludedinthewealthindexasweassignavalueof1ifthepersonhastheitemand0ifnotirrespectiveofitscharacteristics,suchashowexpensiveitis.Asthecontributingvariablesarecorrelatedthismaynotbea(serious)problem.
6 Foradetaileddiscussionoftheselectionandnatureofthesitesselected,seeAlemuetal.(2003).7 Thewealth index is constructed from: (1) thenumberof roomsperperson as a continuous variable; (2) a set of eleven
consumer durable dummy variables, each equal to one if a household member owned a radio, fridge, bicycle, TV, motorbike/scooter,motor vehicle,mobilephone, landlinephone,modernbed, tableor chair, and sofa; (3) a setof threedummyvariablesequaltooneifthehousehadelectricity,brickorplasteredwall,orasturdyroof(suchascorrugatediron,tilesorconcrete);(4)adummyvariableequaltooneifthedwellingfloorwasmadeofafinishedmaterial(suchascement,tileoralaminatedmaterial);(5)adummyvariableequaltooneifthehousehold’ssourceofdrinkingwaterwaspipedintothedwellingoryard;(6)adummyvariableequaltooneifthehouseholdhadaflushtoiletorpitlatrine;(7)adummyvariableequaltooneifthehouseholdusedelectricity,gasorkerosene.
Child nutritional status in poor Ethiopian housEholds: thE rolE of gEndEr, assEts and loCation
�2
Thesurveyincludedweighingalltheeight-year-oldchildrenandmeasuringtheirheight.Childweightwasmeasuredusingcalibratedchildscalesandrecordedtothenearest0.1kg.Childheightwasmeasuredtothenearest0.1cmusingheightboardsmadeforthepurpose.Thesemeasureswereusedtocomparetheweight-for-heightofthesampledchildrenwithaninternationalstandardpopulationusingtheCentreforDiseaseControl/WorldHealthOrganisationreferencepointsandtheEpi-Infostatisticalpackage(Dibleyet al.,1987).Whileheight-for-ageisprimarilyindicativeofchronicorlong termnutritionalstatus,weight-for-heightcanassessrecentnutritionalstatus.Weelectedtoinvestigateweight-for-heightsincethisismorelikelytobeinfluencedbycurrentsocio-economiccircumstanceswhichwewouldbeabletoassess,whereaslowheight-for-ageisoftencausedbyconditionsduringinfancy,aboutwhichwehadnoinformationforthesechildren.
Wewereabletoobtaincompleteanduseablechildage,weightandheightmeasurementsfor920outofatotalof1001eight-year-olds.Althoughwehadtodiscardsomeobservationsbecauseofprobablemeasurementerrorsandmissingvalues,mostoftheobservationsexcludedwerebecauseoftheinabilityoftheenumeratorstomeasureallthechildreninonesentinelsitebecauseofamalariaepidemicatthetime.AccordingtoaWHOExpertCommittee(WHO,1995),weight-for-heightz-scoreslessthan-4SDbelowthemeanshouldbeexcluded,sincetheymaybeduetomeasurementerrors.However,inouranalysis,wefoundthatthereweremanychildren(67)whoserecordedweightsand/orheightswereverylowbutwereconsideredvalid,giventhatthesamplespecificallytargetedhouseholdsinsomeverypoorfoodinsecureareas.Byincludingchildrenwithverylowweight-for-heightinthemodel,moreconsistentresultswereobtained.
Thispaperusesdescriptivestatisticsandbivariateandmultivariatestatisticalanalyses.Theempiricalresultsarepresentedinthenextsection.
Child nutritional status in poor Ethiopian housEholds: thE rolE of gEndEr, assEts and loCation
�3
4. Empirical results
4.1 Description of the data
Thissectionpresentsadescriptionoftherelevantvariablesforthisstudy.Table3showsthemean,standarddeviation,minimumandmaximumvaluesforthenutritionalstatus(weight-for-height)ofthechildandvariablesexpectedtoberelatedtoWHZ.Aweight-for-heightz-scoreof-2SDwasusedasthecut-offfordefiningwasting(seeAppendixforfurtherdetails).
Anthropometric measures
Theresultsshowthatabout21percentoftheeight-year-oldchildrenwerewasted.Themeanoftheweight-for-heightz-scoresis-1.27(Table3);thesevaluesarewellbelowtheinternationalstandardandconsistentwithaseverelyundernourishedpopulation.8
WemayalsonotethattherearedifferencesinWHZbylocationofresidenceandsexofchild.Themeanweight-for-heightz-scoreforruralareaswas-1.4comparedwith-1.1forurbanareas.Similarly,about23percentofchildrenwerewastedinruralareas,whileabout19percentwerewastedinurbanareas.
Intermsofsexofthechild,meanweight-for-heightz-scoresoffemaleandmalechildrenwere-1.2and-1.4.Similarly,thepercentageofwastedfemaleandmalechildrenwas20and23respectively.9
Household composition and education/knowledge
Theaverageageofthemotherwasabout35years.Averagehouseholdsizeforthesamplewas6.4.Wealsousethecaregiver’s(whichin98percentofYLhouseholdswasthechild’smother)perceptionofthehealthofthechildandcomparedittootherchildrenofthesameageasanindicatoroftheknowledgeofthecaregiveraboutthehealthstatusofthechild.About14percentofthecaregiversperceivedthehealthofthechildasworsethanthatofotherchildren,whileapproximately38percentfeltitwasbetterandtheremainderfeltitwasthesame.
Themeanofthemaximumlevelofeducationofanymalememberofthehouseholdwas5yearswhilethecorrespondingfigureforanyfemalememberofthehouseholdwas4.3years.Useofthisvariableisparticularlysuggestedforcontextswherethelevelofeducationinthecommunityisgenerallylow,whichisthecaseforoursample(BasuandFoster,1998;Gibson,2001;ChristiaensenandAlderman,2004).10Forpurposesofcomparison,wealsousedtheeducationlevelofmothersandfathers.Theaveragelevelofeducationofmotherswas2.4yearswhilethatoffatherswas3.9.About75percentofhouseholdheadsweremale,whowerealsotypicallythefathersofthechildren.About77percentofthecaregivershadapermanentpartner.
8 Wemaynotehere that,comparedwith thenational figures for1999/2000(shown inTable1), thepercentageofwastedchildrenintheYoungLivessampleishigher.Whilethisisgenerallytobeexpectedduetothenatureofoursamplewhichisbiasedtowardsthepoor,thefiguresinTable1arenotcomparabletoourYoungLivesdataastheformerreferstochildrenaged6-59months.
9 Acomparisonoftheseresultswiththenationalfiguresfor1999/2000(showninTable1)showsaconsistentresultwherewasting isgenerallymoreserious inruralareasandmalechildrenaremorewasted.However, thecaveatoncomparabilitymentionedinfootnote8abovealsoapplieshere.
10 Theliteraturesuggeststheuseofmeasuresof(themaximumyearsof )schoolingofamemberofthehouseholdsincepositiveexternalitiesareexpected(BasuandFoster,1998;Gibson,2001).
Child nutritional status in poor Ethiopian housEholds: thE rolE of gEndEr, assEts and loCation
�4
Household economic welfare
Theaveragewealthindexwas0.18–rangingfrom0.01to0.77.Wealsousedownershipofcattleandlandasadditionalindicatorsofassetsorresources.About57percentofthehouseholdsownedorrentedland.About72percentownedcattlewiththeaveragenumberofcattleownedbeingabout1.5.
Economicshocksarealsoexpectedtoinfluencewasting.Theindicatorsofeconomicshocksmostfrequentlyreportedwereadecreaseintheavailabilityoffoodandcropfailureduringthethree-yearperiodbeforethesurvey.Abouthalfofthehouseholdsfacedadeclineinfoodavailabilitywhilecropfailurewasexperiencedby41percentofhouseholds.
Child work
IntheYoungLivesquestionnaire,parentswereaskedtoassessthenumberofdayschildrenspend(permonth)workingeitherformoneyorgoods;childrenwereaskedaboutthenumberofhoursperdayandperweektheywereengagedinhouseholdchores.Inanattempttoexaminethelinksbetweenchildworkandwasting,informationonwhetherthechildworkedandforhowmanyhours,wasusedintheanalysis.About68percentoftheeight-year-oldchildrenhaddonesomeworkwithorwithoutpay.Approximately45percentwereengagedinhousekeepingactivitiesorchoresfortheirhouseholdforanaverageof1.7hoursperday.
Food aid and school feeding
Itisalsoexpectedthatfoodaidandschoolfeedingprogrammesshouldhavesomeinfluenceonwasting.Ourdatashowthatabout23percentofthehouseholdsreceivedfoodaidduringtheone-yearperiodbeforethesurvey,whileabout6percentofthechildrenparticipatedinschoolfeedingprogrammes.
Social capital
Measuresofsocialcapitalarealsoincludedaspossibleexplanatoryvariables.11Socialcapitalwasassessedinrelationtothecaregiverbecauses/hehasadirectinfluenceontheYoungLivesindex(one-year-old)child.
Thefollowingtypesofsocialcapitalwereassessed:
Absolutestructuralsocialcapital(ASSC)isbasedonthenumberofgroupsofwhichthecaregiverisamember.Weusedmembershipofthefollowingfourgroupswhichhadthehighestparticipationofwomeninoursample:communityassociationsorco-operatives(17percent),women’sgroups(28percent),religiousgroups(40percent)andfuneralgroups(65percent).
Socialsupport (SS)ismeasuredbythenumberofgroupsorindividualsfromwhichthecaregiverhasreceivedsupport(emotional,economicorother)intheyearbeforethesurvey.About71percentofthehouseholdsreceivedsomesocialsupport.Themeanscoreonoursocialsupportmeasurewas2.5,whichwaswellbelowthemaximumvalueof12.
11 TheYoungLivesquestionnaire focusedon thebondingaspectof social capital (relationshipwithincommunity),not thebridgingaspect(relationshipbetweencommunities)becausebridgingrequiresquestionsregardingtherelationshipbetweencommunitiesthatwerenotfeasiblegiventheavailabletimeandbudget.Hence,theframeofreferenceforsocialcapitalinthispaperisthecommunity,anditwasthecaregiver’sperceptionoftheirownsocialcapitalintheirrespectivecommunitiesthatwasassessed.
•
•
Child nutritional status in poor Ethiopian housEholds: thE rolE of gEndEr, assEts and loCation
�5
Cognitivesocialcapital(CSC)ismeasuredasanindexofacombinationoftheresponsestofourquestionsonwhetherthecaregiverfeelss/heispartofthecommunity,whethers/hefeelspeoplecangenerallybetrusted,whethers/hefeelspeoplewouldtryandtakeadvantageofher/himiftheycould,andwhethers/hefeelspeoplegenerallygetalongwitheachother.Themeanvalueofcognitivesocialcapitalis3.5,whichisclosetothemaximumvalueof4.
Access to services
Availabilityofsafesourcesofdrinkingwaterandsanitationfacilitiesisalsoexpectedtoinfluencewasting.About39percentofhouseholdshadeitheraflushtoiletorpitlatrine(privateorcommunal),12whileabout56percenthadasafesourceofdrinkingwater(whichincludestapwaterandprotectedwells/springs).
Distancetopublichealthfacilitieswasusedasanindicatorofaccesstohealthservices.Thisdistancemeasureisanaveragemeasureforaparticularsentinelsite.Sincethepoorwereover-sampledinourdata,weonlyconsideredthedistancetotheclosestpublichealthclinicbecauseprivatehospitalsandclinicsaretypicallynotaccessibletothepoor.Weusedadummyvariableof1ifthestudysiteiswithin10kmdistancefromapublichealthclinic,13and0inothercases.Thedatashowthat53percentofthesitesarewithin10kmofapublichealthclinic.14
Access to information
OwnershipofradioandTVwasusedasanindicatorofaccesstocommunicationinfrastructure,whichmaybeexpectedtofacilitatetheacquisitionofnutritionalinformationandwhichcouldinfluencethenutritionalstatusofchildren.15Whileabout43percentofhouseholdsownedaworkingradio,onlyabout6percentownedaworkingtelevision.
Child illness
Tolookattheassociationbetweenchildillnessandwasting,weusedinformationaboutillnessofthechildinthetwo-weekperiodbeforethesurvey.Thedatashowthatabout18percentofchildrenwereillinthetwo-weekperiod.
Perception about availability of food
Whileideallywewouldhavelikedtomeasurechildren’sfoodintake,thiswasbeyondthescopeofthestudy.Instead,asaproxyweusedchildren’sperceptionsoftheamountoffoodtheyeat.Thechildrenwereaskedwhethertheyhaveenoughfoodtoeat.Theresponsesshowthatabout76percentofthechildrenfeltthattheyhaveenoughfoodtoeat.
12 NotethatintheEthiopiancontext,theimportantissueiswhetherhouseholdsuselatrinesornot.13 TenkilometresisaninternationaldefinitionofaccesstohealthcareserviceswhichwasdevelopedinordertoreachtheHealth
forAlltargetofthe1978AlMataDeclaration.14 Thedataondistancetohealthfacilitieswasgivenasarange,andweconsideredtheaveragevalueoftherange.15 OwnershipofradioandTVandavailabilityofsafewaterandsanitationfacilitiesareincludedinthewealthindexusedin
thispaper.However, the correlationbetween thewealth index and these four variables isnothigh and this suggests thatmulti-collinearityisnotaproblem.Moreover,exclusionofthesefourvariablesfromthewealthindexreducesthecorrelationbetweenthewealthindexandthefourvariablesonlybyaverysmallamount.
•
Child nutritional status in poor Ethiopian housEholds: thE rolE of gEndEr, assEts and loCation
�6
LocationWealsousedadummyvariableforlocationofresidence(urbanorrural)tocapturepossibleinfluencesoflocation-specificvariablesasopposedtothehousehold-levelvariablesreportedabove.Thedatashowthatabout37percentofhouseholdswereinurbanareas(whichincludesmalltowns).
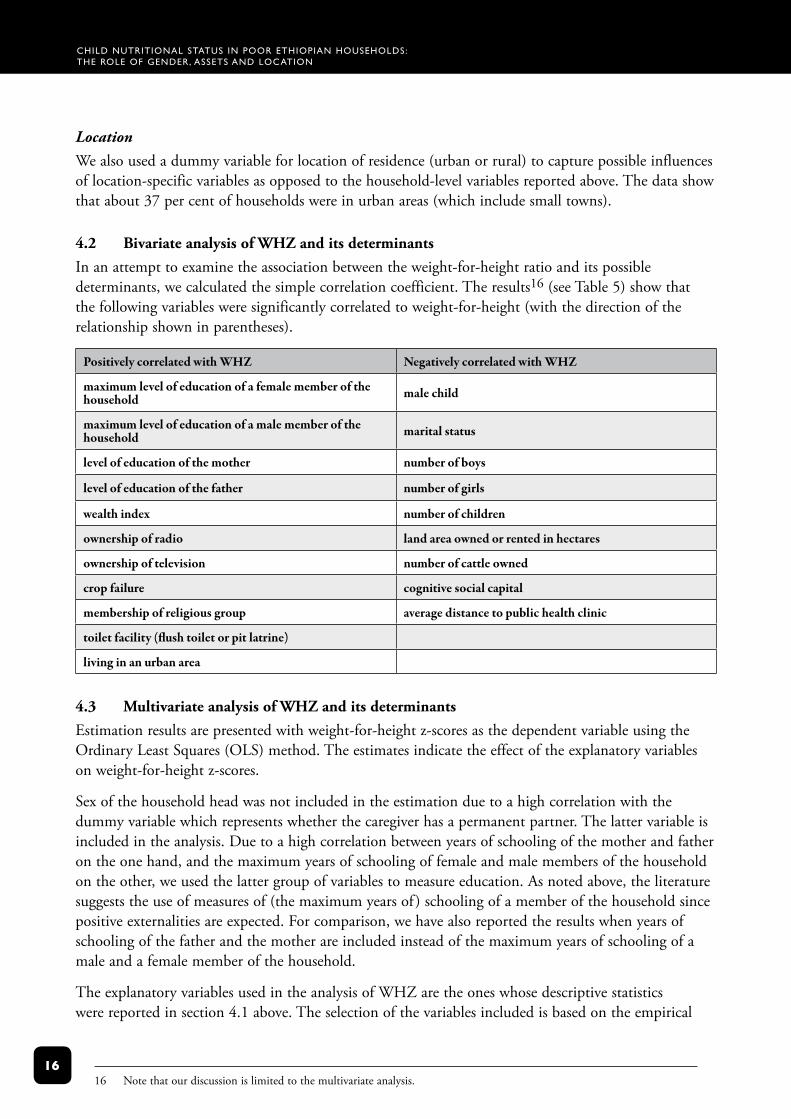
4.2 Bivariate analysis of WHZ and its determinantsInanattempttoexaminetheassociationbetweentheweight-for-heightratioanditspossibledeterminants,wecalculatedthesimplecorrelationcoefficient.Theresults16(seeTable5)showthatthefollowingvariablesweresignificantlycorrelatedtoweight-for-height(withthedirectionoftherelationshipshowninparentheses).
Positively correlated with WHZ Negatively correlated with WHZ
maximum level of education of a female member of the household male child
maximum level of education of a male member of the household marital status
level of education of the mother number of boys
level of education of the father number of girls
wealth index number of children
ownership of radio land area owned or rented in hectares
ownership of television number of cattle owned
crop failure cognitive social capital
membership of religious group average distance to public health clinic
toilet facility (flush toilet or pit latrine)
living in an urban area
4.3 Multivariate analysis of WHZ and its determinants Estimationresultsarepresentedwithweight-for-heightz-scoresasthedependentvariableusingtheOrdinaryLeastSquares(OLS)method.Theestimatesindicatetheeffectoftheexplanatoryvariablesonweight-for-heightz-scores.
Sexofthehouseholdheadwasnotincludedintheestimationduetoahighcorrelationwiththedummyvariablewhichrepresentswhetherthecaregiverhasapermanentpartner.Thelattervariableisincludedintheanalysis.Duetoahighcorrelationbetweenyearsofschoolingofthemotherandfatherontheonehand,andthemaximumyearsofschoolingoffemaleandmalemembersofthehouseholdontheother,weusedthelattergroupofvariablestomeasureeducation.Asnotedabove,theliteraturesuggeststheuseofmeasuresof(themaximumyearsof )schoolingofamemberofthehouseholdsincepositiveexternalitiesareexpected.Forcomparison,wehavealsoreportedtheresultswhenyearsofschoolingofthefatherandthemotherareincludedinsteadofthemaximumyearsofschoolingofamaleandafemalememberofthehousehold.
TheexplanatoryvariablesusedintheanalysisofWHZaretheoneswhosedescriptivestatisticswerereportedinsection4.1above.Theselectionofthevariablesincludedisbasedontheempirical
16 Notethatourdiscussionislimitedtothemultivariateanalysis.
Child nutritional status in poor Ethiopian housEholds: thE rolE of gEndEr, assEts and loCation
��
literatureonbothchildmalnutritionandpracticalconsiderations.Weusedarobustestimationmethodinwhichthestandarderrorsarecorrectedforheteroscedasticityofunknownform.Wehavealsotestedforomittedvariablebias.Inordertoexaminetheeffectofinteractionsbetweenvariables,wealsousedinteractiontermstoassesstherelationshipbetweenmeasuresofshocksandassets(wealthindexandeducation)aswellasbetweenfoodaidandmeasuresofshocksandWHZ.
Results for the whole sample
TheresultsforWHZforthewholesamplearereportedinTables6and7.InTable6,wepresenttheresultswithinteractiontermsincludedincolumn1andthosewithoutinteractiontermsincolumn2.WhiletheeducationvariablesincludedinTable6measurethemaximumyearsofschoolingofmaleandfemalemembersofthehousehold,theeducationvariablesinTable7measureyearsofschoolingofthemotherandthefather.17
Wefindthatweight-for-heightz-scoresarelowerformalesthanforfemales,whichsuggeststhatmale-femaledifferencesareimportantforshort termmalnutrition.Toassesswhetherthereisaneedtoestimateseparatefunctionsformaleandfemalechildren,weconductedaChowtestandfoundthatthedifferencesarenotsignificant;hence,wedidnotdoaseparateestimation.18Olderchildrenhavehigherweight-for-heightwiththerateofincreasedecreasingaschildrengrowolder.
Themaximumyearsofschoolingofafemalememberofthehouseholdispositivelyassociatedwithweight-for-heightratio.However,theresultsshowthatthemaximumyearsofschoolingofamalememberofthehouseholdisnotsignificantlyassociatedwithweight-for-heightz-scores.Theseresultsconfirmtheimportanceofeducatingfemalemembersofthehouseholdtoimprovethenutritionalstatusofchildren.Asindicatedabove,wehavealsousedschoolingofthemotherandthefathertoassesswhethertheresultsaredifferent.Acomparisonoftheseresults(Tables6and7)showsthatthecoefficientforfather’seducationisnotsignificant,asisthemaximumlevelofeducationofamalememberofthehousehold.Ontheotherhand,theeffectofonemoreyearofmother’seducationonweight-for-heightis0.07,whilethatofthemaximumlevelofeducationofafemalememberofthehouseholdisslightlyhigher(0.08).Thisdifferencemayreflectthespill-overeffectsofeducationofotherfemalemembersofthehousehold.19
Theresultssuggestthatmaritalstatusandageofthemotherarenotassociatedwithweight-for-heightratio.20Ontheotherhand,householdswithmorefemaleadults(over15yearsofage)andmoregirls(between5and15yearsold)haveeight-year-oldchildrenwithlowerweight-for-height.Ifthecontributionoffemalestohouseholdincomeearningsislowerthanthatofmales(whichisfrequentlythecaseinEthiopia),theseresultsmayalsoreflecttheeffectoflowerincome/expenditureonapercapitabasis.However,thereareinsufficientdatatoexplainthenegativeassociationbetweenmalnutritionandthenumberofgirlchildreninthehousehold.
17 We should note that child labour and food aid are included as possible determinants of wasting which could introduceendogeneity.Thisisbecausetheremaybetwo-waycausationsincethedecisiononinvolvementinchildlabourandthereceiptoffoodaidmayalsobeinfluencedbythenutritionalstatusofthechild.
18 ThecalculatedFvaluewasF(47,826)=1whichisnotsignificantat95percent.19 Itmustbenoted,however,thattheeffectofeducationcouldbedifferentifwecontrolledfornutritionknowledgeofmothers,
forwhichwedonothavedata(Charmarbagwalaet al.,2004).20 Noteherethatinourdata,inalmostallcases,childrenwithsingleparentsarethosefromhouseholdsheadedbywomen.For
thisreason,weincludedmartialstatusintheanalysisandexcludedthesexoftheheadofthehousehold.Theresultsdidnotchangewhenweincludedthelatterandexcludedtheformer.
Child nutritional status in poor Ethiopian housEholds: thE rolE of gEndEr, assEts and loCation
��
Asexpected,weseefromtheresultsinTable6thatthewealthierhouseholds,asmeasuredbythewealthindex,haveeight-year-oldchildrenwithbetterweight-for-height.
Fromthefourindicatorsofabsolutestructuralsocialcapitalused,membershipofreligiousgroupshadasignificantpositiveassociationwithweight-for-heightofchildren,whilemembershipoffuneralgroupshadasignificantnegativeassociation.Onepossiblehypothesisisthatbecausemembersofreligiousgroupssuchasmahber (women’sreligiousassociationsthatmeetmonthlytocelebrateholydays)ispartiallydeterminedbywealthstatus,thelowerWHZinthissub-groupcouldbebecauseofthegreaterlevelofresourcesavailabletogroupmembers.Conversely,inthecaseoffuneralgroupswherenon-attendanceispenalised,thepoormaybemorelikelytoattendthanthebetter-offforwhomthepenaltiesarenotsosignificant.Moreover,becauseattendanceatfuneralsisrelativelytime-consuming,itmayhaveanegativespill-overimpactonthetimeavailabletoparentstotakecareoftheirchildren.
Weusedadummyvariabletorepresentaveragedistanceofasitetoapublichealthclinicasanindicatorofaccesstopublichealthclinics.Theresultsshowthatsitesthathavepublichealthclinicswithina10kmaveragedistancehavefewerwastedchildren.
WemustalsonotethatcropfailurehasasignificantassociationwithWHZ,butinthecounter-intuitivedirection.Onepossibleexplanationforthepositiveassociationofcropfailureisthatthesehouseholdsaregettingvarioustypesofsupportthatwerenotfullycapturedinourdata.Toassesswhetherthereisaninteractiveeffect,weincludedinteractiontermsbetweenshocksandassets,aswellasbetweenfoodaidandshocks.Theseinteractionterms,however,werenotsignificant(Table6),suggestingtheneedforfutureresearch.
Althoughthedummyvariableincludedintheregressiontoascertainwhetherresidenceinurbanorruralareasmakesadifferenceisnotsignificant,aChowtestindicatedthattherearesignificantdifferencesinthecoefficientsofthevariablesincludedbetweenurbanandruralareas.21Forthisreason,separateregressionswereestimated.TheseresultsarepresentedinTables8and9anddiscussedbelow.
Results stratified by locationEstimationresultsbylocation(urbanandrural)arepresentedinTables8and9.Table8presentsresultsofmaximumlevelsofeducationofmaleandfemalemembersofthehousehold,whileinTable9weuseparentalyearsofschooling.TheresultspresentedinTable8showthatthereisnosignificantdifferencebetweenmaleandfemalechildren,bothinurbanandruralareas.Wefindthatchildrenofoldermothersaremorewastedinruralareas.
Theresultsforeducationshowthathouseholdswithbetter-educatedfemalemembershavechildrenwithhigherweight-for-heightbothinruralandurbanareas.However,forurbanhouseholds,thepresenceofbetter-educatedmalesinthehouseholdhasanegativeandsignificantassociationwithchildren’snutritionalstatus(asmeasuredbyweight-for-height),whilethesamevariabledoesnothaveasignificantassociationinruralareas.Whilethisisoneoftheresultswefounddifficulttoexplain,apossiblehypothesisisthatchildrenofmoreeducatedmalemembersofthehouseholdareeatingless‘traditional’foodinfavourofprocessedfooditemswhichmayhaveanegativeeffectonweight-for-height.InitialfindingsfromtheYoungLivesqualitativeworksuggestthatasmaleincomes
21 ThecalculatedFvaluewasF(47,826)=4.4whichissignificantat99percent.
Child nutritional status in poor Ethiopian housEholds: thE rolE of gEndEr, assEts and loCation
��
rise,additionalearningsarenotnecessarilyusedtoaugmenthouseholdexpenditure(includingchild-relatedexpenses).Rather,thereisatendencyformentospendthismoneyonitemssuchasalcohol(forfurtherdiscussionofthegenderedpatterningofhouseholdexpenditureseeKabeer,2003).
Intermsoftheage-sexcompositionofhouseholdmembers,whilethereisanegativeassociationbetweenWHZandthenumberoffemaleadultsinbothruralandurbanareas,thenumberofgirlsinthehouseholdhasasignificantnegativeassociationwithWHZonlyinruralareas.
Wealsofindthatthereisasignificantandpositiveassociationwithwealthindexinurbanareas,buttheassociationisnotsignificantinruralareas.Thismaypartlybebecausethenatureofthewealthindexweusedforthisstudywasmoresensitivetourbanwealthindicatorsthanruralones.Theareaoflandownedorrentedalsohasasignificantpositiveassociationinurbanareasbutnotinruralareas.WealsonotefromTable8thatanumberofthecoefficientsoftheinteractiontermsbetweenassetsandshocksaresignificant,particularlyforurbanareas.Theresultsalsosuggestthatownershipofatelevisionhasasignificantpositiveeffectonthenutritionalstatusofurbanchildren.Wefindtheoppositeresultforruralareas,butthedatashowthatonlyonehouseholdownedatelevisioninruralareas.Forurbanareas,childrenwhospentmoretimeonhouseholdchoreshavehigherWHZ,whileinruralhouseholdschildrenwhoreceivedfoodaidhavehigherWHZ.Whiletheresultsforfoodaidareexpected,theresultsforchildrenengagedinhouseholdchoresinitiallyappearcounter-intuitive.
Cropfailurehasasignificantassociationbothinruralandurbanareas,butthedirectionoftheassociationisnotasexpected,asnotedabove.Children’sresponsestothequestionwhethertheyreceivedenoughfoodtoeatwasnotsignificantlyassociatedinurbanareas,whilethisvariableissignificantbutnegativeforruralareas.Cognitivesocialcapitalhasanegativeandsignificantassociationwithweight-for-heightofruralchildren.Membershipofreligiousgroupsissignificantlyandpositivelyassociated(at1percent)inruralareaswhilemembershipofwomen’sgroupshasasignificantandnegativeassociationinurbanareas.Thenegativeassociationofcognitivesocialcapitalandmembershipofwomen’sgroupsmaybeareflectionofthetimecaregiversgivetoactivitiesthatcontributetotheformationofthesetwotypesofsocialcapital,whichmay,however,haveanegativeeffectonchildren’snutritionalstatus.Forexample,wemayexpectthatwomen’sgroupmembersinurbanareasmaynothavethesameaccesstorelativesorneighbourstosubstituteforchildcarewhiletheyattendgroupmeetings,whichmaytakeseveralhours.Thismighthavesomeeffectontheregularityandqualityofthechild’sfoodintake.Wealsofindthatdistancetoapublichealthclinichastheexpectednegativeandsignificantassociationwithweight-for-heightinruralareas,buttheresultistheoppositeforurbanareas.Whileaccesstosafedrinkingwaterhastheexpectedpositiveandsignificantassociationinruralareas,theresultistheoppositeforurbanareas,whichisnotexpected.Wealsofindanunexpectednegativeandsignificantassociationforaccesstobettersanitationfacilitiesinruralareas.Thismightbebecauseinruralareaspeoplemaystillprefertousetheopenfieldratherthanunfamiliarpitlatrines.
SummaryThispaperhasusedaneconometricmodeltoanalysethecorrelatesofchildWHZ.22Theresultsshowthathouseholdwealth,theleveloffemaleadulteducationandcaregivers'membershipofreligiousgroupsarepositivelyandrobustlycorrelated(atthe1percentsignificancelevel)withweight-for-height.Inotherwords,childrenlivinginhouseholdswithinthehighestwealthcategory,withhigheradultfemaleeducationandcaregivermembershipofreligiousgroups,arelikelytohave
22 Aswithall cross-sectional studies, causalitycannotbeattributed to theassociations found in thispaper. Inaddition, theover-samplingofpoorrespondentsfortheYoungLivesstudymeansthattheseresultscannotbegeneralisedtothepopulationofEthiopiaasawhole,butareindicativeofthesituationofpoorchildren.
Child nutritional status in poor Ethiopian housEholds: thE rolE of gEndEr, assEts and loCation
20
higherWHZ.Atthe5percentand10percentsignificancelevels,thefollowingvariableswerepositivelycorrelatedwithweight-for-heightindecliningorderofmagnitude:thesizeoflandthathouseholdspossess,foodaidreceivedandchildrenbenefitingfromschoolfeedingprogrammes.Inaddition,thenumberoffemaleadultsinahouseholdisnegativelyassociatedwithweight-for-heightandtheassociationissignificantatthe1percentlevel.Lastly,somevariablesbehaveddifferentlythanexpectedintheregressionanalysis.Inparticular,thenumberoffemaleadultsinahousehold,accesstosafedrinkingwaterandabsenceofcropfailurehaveshownsignificantandnegativecorrelationwithweight-for-height.However,inthelattercase,giventhatacross-tabulationofcropfailureandfoodaidshowedapositivecorrelation,foodaidmayactasabufferagainstchildmalnutritioninthecaseofshocks.
Child nutritional status in poor Ethiopian housEholds: thE rolE of gEndEr, assEts and loCation
2�
5. policy implicationsThislastsectiondiscussestheimplicationsofthesefindingsforpolicyinterventions.Thediscussionisdividedintothreefactorsthatrelatetothefood-basedapproach,publichealthapproachandgenderapproach.Itconcludeswithreflectionsontheimportanceofdevelopinganinter-sectoralapproachtoaddresschildmalnutrition,includingaconsiderationofsocialcapitalvariables.
5.1 Food securityOurfindingsconfirmedtheimportanceofhouseholdincome/wealthforchildnutritionalwellbeingwhichsuggeststhat,inordertoimprovechildWHZ,theproblemmustbeconsideredwithinbroaderpolicyprogrammesthatfocusonincome-generationtofacilitatehouseholdeconomicwellbeingandtheabilitytoprovidechildrenwithsufficientfood.
Inthisregard,onecrucialconcerninvolveslandproductivity.WhileourfindingsshowedthatlandownershipandlandsizehaveapositiveimpactonchildWHZbecauseofgreatercapacitytoproducefood,policyinterventionswillalsoneedtoconsideralternativesforpeoplewithlittleornoland.Indeed,landshortageisaproblemacrossmanyoftheYoungLivessurveysites.
Currently,thegovernmentisundertakinginitiativestopromoteresettlementprogrammesaspartofitsfoodsecuritystrategy.DestitutepeoplearemovedundertheNewFoodSecurityProgrammefromdrought-pronefoodinsecureareastouncultivatednon-drought-proneareaswithinthesameregions(MoRD,2003).Whileproponentsofthisprogrammearguethatitwillhelptosolvetheissueofinsufficientlandsizeandinfertilityofsoil,particularlyinthehighlandareas,otherobserversaremorecautiousbecausetheefficacyandoutcomesofthestrategyhavenotyetbeenestablished.TherewerealsomanydeleteriousimpactsofasimilarschemecarriedoutundertheDerginthe1980s.Theconcernisthatpeoplearebeingmovedtouninhabited,malarialareaswherebasicservicesareundeveloped.Itwillthereforebeimperativetomonitorcarefullytheimpactsofresettlementonchildrenandtheirfamilies.
OurdataalsoshowthatreceiptoffoodaidispositivelyassociatedwithWHZ,particularlyforruralchildren.WhiletherearenowconcernsinEthiopiathatfoodaidisleadingtoacultureoffoodaiddependency,cautionisalsoneededwithregardtoalternativessuchasemploymentgenerationschemes(EGS)andfood-for-work(FFW)programmesandwhethertheyareinthebestinterestsofchildren.Suchprogrammesneedtobecarefullymonitoredtoensurethatchildrenbenefitfromthechangeinthemodalityoffoodaiddelivery,andthatchildren’spaidorunpaidlabourisnotexploitedbytheirand/ortheirfamily’sparticipationinthescheme.
TowhatextentdoestheNewCoalitionforFoodSecurityinEthiopia(MoRD,2003)–anewpartnershipofgovernment,donors,civilsociety,theprivatesectorandcommunities,mandatedtodevelopanewstrategytoaddresstheunderlyingcausesoffoodinsecurity–incorporatethepolicycomponentsidentifiedaboveasessentialfortacklingchildnutrition?Overall,itseekstoreducewastingbyensuringfoodavailabilitythroughcropandlivestockproduction,therebyincreasingfoodaccessibilityatthehousehold-level.Itarguesthatsurplusproductioncanbeenhancedbyincreasingproductivityoflandandlabour,andexpandingroadandmarketsinfrastructure.Landproductivityistobeincreasedthroughtechnologicalinputssuchasfertilisersandimprovedseeds,
Child nutritional status in poor Ethiopian housEholds: thE rolE of gEndEr, assEts and loCation
22
whilelabourwillbestrengthenedthroughcapacity-buildingandimprovedhealthandnutrition.Thisself-sustainability-orientedstrategywillbeaccompaniedbynon-agricultureincome-generationmechanismssuchaswageemploymentinmanufacturingindustries(MoFED,2002b).
Inpractice,however,therearelimitationsregardingthefeasibilityofmeetingthenutritionalrequirementsofpoorhouseholdsthroughself-production(Riley,2000).Whilethecarryingcapacityofthelandisdegradedandfragmentedbeyondlimits,theoverwhelminglyruralpopulationisgrowingatarateof2.7percentperannum,andisdependentonintensivefarmingofsmallplotsoflandfortheproductionoffoodforhouseholdconsumptionandforsaletopurchasenon-foodessentials.Inanyaverageyear,outofthetotalruralhouseholdssurveyedbytheCentralStatisticsAuthority,morethan2millionor22percentofthehouseholdshavefoodforabout3months,33percentofthehouseholds(3millionhouseholds)haveproducedfoodfor4-6months,and21percentofthehouseholds(about2millionhouseholds)producesufficientfoodfor7-9months(CSA,2001).Compoundingthisvulnerability,isanill-functioninglabourmarketandscarceincome-generatingopportunitiesfortheunskilledruralpopulation.AlthoughtheNewCoalitionforFoodSecurityseekstoaddresstheseissuesbyintroducingaproductivesafetynetandtransferstovulnerablegroupssuchaschildreninschool,lactatingandpregnantwomenandchronicallypoormothers(MOR,2003),coverageofthisprogrammeisstilllow(Woldehannaet al.,2005).
5.2 Public health services
Whileextantprimaryhealthcarefacilitiesplaceconsiderableemphasisonnutritionpromotionforchildrenunderfive,thereisoftenlessemphasisonnutritioninterventionsforschool-agechildren.However,ifhealth-relatedproblemsareallowedtoaffectthenutritionalstatusofpre-adolescentchildren,theymaymisstheopportunityofcatchinguponnormalgrowthanddevelopment.GiventhatourYoungLivesfindingsshowedthataccesstohealthfacilitiescorrelatespositivelywiththenutritionofeight-year-olds,itwouldappearthatgreaterattentiontosuchhealth-relatedneedsofolderchildrenisnecessaryifmalnutritioninthisage-groupistobeeffectivelytackled.
Specificnutrition-relatedservices,whicharecurrentlyincludedinthehealthserviceextensionpackageforearlyschool-agechildren,consistofde-wormingandhealtheducation;butmoreneedstobedone.Amoreco-ordinatedapproachamongschools,healthfacilitiesandparentscouldhelpreducetheeffectofpoorhealthonchildnutritionamongschool-agechildren.However,giventhelinkwefoundbetweenwealthandwastingandasimilarlinkbetweenwealthandchildschooling(Woldehannaet al.,2005),itislikelythatsomeofthemostnegatively-affectedchildrenwillnotbeinschoolandwillthereforebemissedbyschool-basednutritionalinterventions.Itwillthereforebeimportanttodevelopnutritionpromotionprogrammeswhichareintegratedwithotherdevelopmentpackages,suchasagriculturalextensionandinterventionsbynon-governmentalorganisations,forexample,schoolfeedingprogrammesandsupplementaryfoodsforhouseholdseligibleforrelieffood.Moreover,asdiscussedabove,althoughtheNationalFoodSecurityProgrammelinksworedahealthofficesandhealthfacilitieswiththeEthiopianHealthandNutritionResearchInstitute(EHNRI)(MoRD,2003),todatethisinitiativehasbeenunder-funded,under-staffedandweaklyco-ordinated,thusseriouslylimitingtheroletheEHNRIcouldtheoreticallyplayindevelopingnutritionresearchtoinformcommunitynutritioninterventions.
Child nutritional status in poor Ethiopian housEholds: thE rolE of gEndEr, assEts and loCation
23
Healthproblems,especiallyparasiticanddiarrhoealdiseases,canbefurtherexacerbatedbypoorenvironmentalconditions,includingunsafewatersupplies.Althoughourresultscounter-intuitivelyfoundthatchildrenwithaccesstoacleanwatersourceandfunctioningtoiletappearedtobemorewasted,weexpectthatitisrelatedtoanunaccountedforconfoundingvariableandwouldthereforenotwishtodownplaytheimportanceofsanitationservicesincontributingtobetterchildhealthoutcomes.
5.3 Gender
Whiletheliteratureemphasisestheimportanceofmaternaleducationforchildmalnutritionoutcomes,wefoundthatthemaximumschoolinglevelofadultfemales(notonlymothers)inthehouseholdhadapositiveimpactonchildWHZ.Therearethreepossiblereasonsforthisrelationship.First,educatedfemaleadultstendtohavebetterhealth-seekingbehaviour.Forexample,theyaremorelikelytohavetheirchildrenvaccinatedwhichwillreducethelikelihoodofdiarrhoeaandfever,bothofwhichcandecreaseWHZ.Asecondpossibilityisthatfemaleadultswithhigherlevelsofeducationarelikelytohavebetteraccesstopaidworkorareengagedintheinformalincome-generatingsector,egpettytrade.Wecanassume,asotherstudieshavefound(Kabeer,2003),thatthishigherincomewillbeusedtoimprovethewelfareofthehouseholdingeneral,andthechildinparticular.Third,better-educatedwomenaremorelikelytohavesuperioraccesstoinformationaboutchildcareandchildhealthpractices,andthuswecouldarguethattheyarebetterplacedtotakemeasurestoimprovetheWHZoftheirchildren,assumingsufficientfoodavailability.
Thepolicyimplicationsofthisfindingaretwofold.Asweargueinaforthcomingpaperonchildeducation,giventheimportanceoffemaleadulteducationforbothchildschoolingandchildnutritionalstatus,itisimperativethatthegovernmentinvestinbothgirls’educationaswellasadulteducationprogrammeswhichtargetwomen.Second,income-generationprogrammesshouldpayparticularattentiontodevelopingproductiveeconomicopportunitiesforwomen.
5.4 The need for an integrated cross‑sectoral approach
Itisclearfromourfindingsthatwastingisnotonlyrelatedtofoodsufficiency,butalsotofoodinsecurity,inadequatecareandpoorhealth(Johnson-Welch,2000),whileindirectcausesincludelackofemploymentopportunitiesandthelowstatusofwomen.Hence,thereisaclearneedtodevelopagenuinelycross-sectoralapproachtoaddressingwasting.Asdiscussedintheintroduction,nutritionisgenerallydiscussedwithinthedomainsofpublichealthandfoodsecurity.Whiledifferentsectorsandorganisationsmaybeinvolvedinnutrition-relatedprogrammes,accountabilityto,andresponsibilityfor,co-ordinatingactivitieshavebeentransferredbackandforthbetweenthehealthandfoodsecuritysectors.BecauseofthegravityoffoodinsecurityinEthiopia,nutritionandfoodsecurityhavebecomesynonymous,althoughtheyarenot:foodsecurityalonedoesnotguaranteegoodnutrition.
Thefoodavailabletothehouseholdmustbesharedaccordingtoindividualneeds,mustbeofsufficientquantityandquality,andindividualsmustbehealthyinordertobenefitfromit.Moreover,asourfindingsonsocialcapitalsuggest,nutritionprogrammedelivererswillneedtopayparticularattentiontothecommunitygroupsthroughwhichtheychanneldeliveryofinformationandnutritionservices.Forexample,whilewefoundthatchildrenwhosemothersbelongedtotraditionalandreligiousassociationswerelesswasted,Woldehannaet al.(2005)foundthatthesamegroupswere
Child nutritional status in poor Ethiopian housEholds: thE rolE of gEndEr, assEts and loCation
24
negativelyassociatedwithchildschoolenrolment.Wewouldarguethat,giventhehighabsolutenumbersofcaregiversparticipatinginfuneralsocieties,andreligious,communityandwomen’sgroups,governmentorganisations,NGOsanddonorswouldbewelladvisedtoworkalongsidesuchgroupswhenimplementingnewpolicyprogrammes.
Thecross-cuttingnatureofnutritionwouldsuggestthattherecentpolicyproposalbytheMinistryofHealthtointroduceanoverarchingnutritionpolicyshouldbesupportedinordertoregulateeffectivelyandco-ordinateprogrammes,andavoidfragmentationandduplication.ThereisconsiderabledebateamongtheMinistryofHealth,thePublicHealthAssociationandinternationaldonorsabouthowbesttorealisethisproposalandwhichgovernmentbodyshouldhaveprimaryresponsibility.Akeyconcernwillbeaboutadequateintegrationofnutrition-improvingactivitiesintothePRSPandrelatedSectorDevelopmentPlansatthenational,regionalandworedalevels.Becausetheextentoftheeffectsofdifferentvariablesonweight-for-heightofchildrendependedonthelocationofresidence,decision-makerswillneedtothinkcontextuallytodealwithfactorsinfluencingwasting,ratherthanemployinga‘one-size-fits-all’approach.AsinglesolutiontothenationalproblemoflowWHZmayleadtoawasteofresources,asitmaybeeffectiveforalimitednumberofcases/areasonly.
Child nutritional status in poor Ethiopian housEholds: thE rolE of gEndEr, assEts and loCation
25
tablesTable 1. Child wasting in Ethiopia in per cent (children aged 6‑59 months)
Location
1995-96 1999-2000 Percentage change for
allMale Female All Male Female All
EthiopiaWasted 8.9 9.4 9.2 10.2 9.0 9.6 4.3
Severely wasted 3.3 3.6 3.4 1.9 1.6 1.8 -47.1
RuralWasted 9.3 9.8 9.5 10.5 9.3 9.9 4.2
Severely wasted 3.4 3.8 3.6 1.9 1.7 1.8 -50.0
UrbanWasted 6.5 7.2 6.8 6.5 5.6 6.1 -10.3
Severely wasted 2.3 2.4 2.3 2.0 1.0 1.5 -34.8
source: MofEd (2002a, 52)
Table 2. Distance to the nearest health centre (in km) (1999‑2000)Percentiles of individuals
5 25 50 75 95 Mean
National 0 2.5 6 10 18 7.01
Rural 1 3 6 11 20 7.98
Urban 0 0 1 2 3.5 1.17
source: MofEd (2002a, 76)
Table 3. Descriptive statistics of measures of WHZ (wasting) and their associatesDescription of variable Mean Std. Dev. Min Max
Weight-for-height z-scores -1.27 1.59 -7.89 5.82
Dummy for weight-for-height (1 if not wasted) 0.79 0.41 0.00 1.00
Male child 0.51 0.50 0.00 1.00
Age of child 8.00 0.09 7.72 8.60
Age of mother in years 34.76 7.82 21.00 60.00
No information on mother's age 0.00 0.07 0.00 1.00
Maximum years of schooling of a female member of household 4.32 3.74 0.00 15.00
Maximum years of schooling of a male member of household 5.03 4.23 0.00 16.00
Dummy for marital status (1 if permanent partner exists) 0.77 0.42 0.00 1.00
Mother’s years of schooling 2.39 3.49 0 14
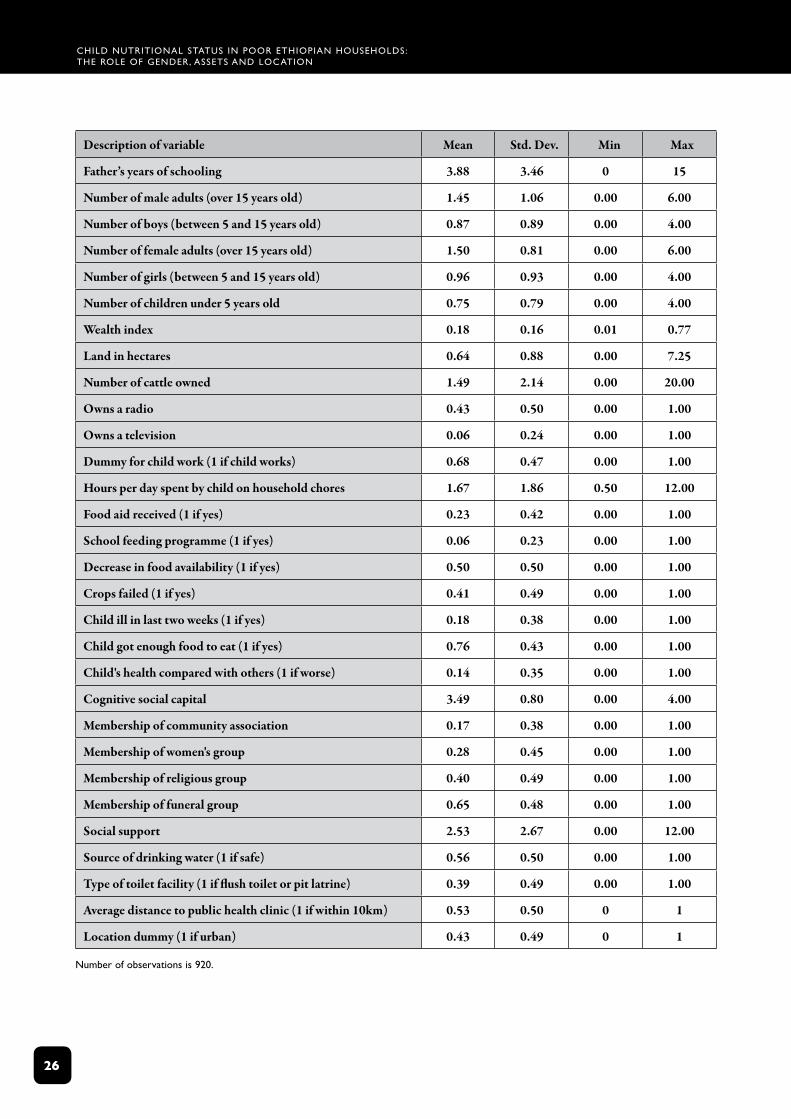
Child nutritional status in poor Ethiopian housEholds: thE rolE of gEndEr, assEts and loCation
26
Description of variable Mean Std. Dev. Min Max
Father’s years of schooling 3.88 3.46 0 15
Number of male adults (over 15 years old) 1.45 1.06 0.00 6.00
Number of boys (between 5 and 15 years old) 0.87 0.89 0.00 4.00
Number of female adults (over 15 years old) 1.50 0.81 0.00 6.00
Number of girls (between 5 and 15 years old) 0.96 0.93 0.00 4.00
Number of children under 5 years old 0.75 0.79 0.00 4.00
Wealth index 0.18 0.16 0.01 0.77
Land in hectares 0.64 0.88 0.00 7.25
Number of cattle owned 1.49 2.14 0.00 20.00
Owns a radio 0.43 0.50 0.00 1.00
Owns a television 0.06 0.24 0.00 1.00
Dummy for child work (1 if child works) 0.68 0.47 0.00 1.00
Hours per day spent by child on household chores 1.67 1.86 0.50 12.00
Food aid received (1 if yes) 0.23 0.42 0.00 1.00
School feeding programme (1 if yes) 0.06 0.23 0.00 1.00
Decrease in food availability (1 if yes) 0.50 0.50 0.00 1.00
Crops failed (1 if yes) 0.41 0.49 0.00 1.00
Child ill in last two weeks (1 if yes) 0.18 0.38 0.00 1.00
Child got enough food to eat (1 if yes) 0.76 0.43 0.00 1.00
Child's health compared with others (1 if worse) 0.14 0.35 0.00 1.00
Cognitive social capital 3.49 0.80 0.00 4.00
Membership of community association 0.17 0.38 0.00 1.00
Membership of women's group 0.28 0.45 0.00 1.00
Membership of religious group 0.40 0.49 0.00 1.00
Membership of funeral group 0.65 0.48 0.00 1.00
Social support 2.53 2.67 0.00 12.00
Source of drinking water (1 if safe) 0.56 0.50 0.00 1.00
Type of toilet facility (1 if flush toilet or pit latrine) 0.39 0.49 0.00 1.00
Average distance to public health clinic (1 if within 10km) 0.53 0.50 0 1
Location dummy (1 if urban) 0.43 0.49 0 1
number of observations is 920.
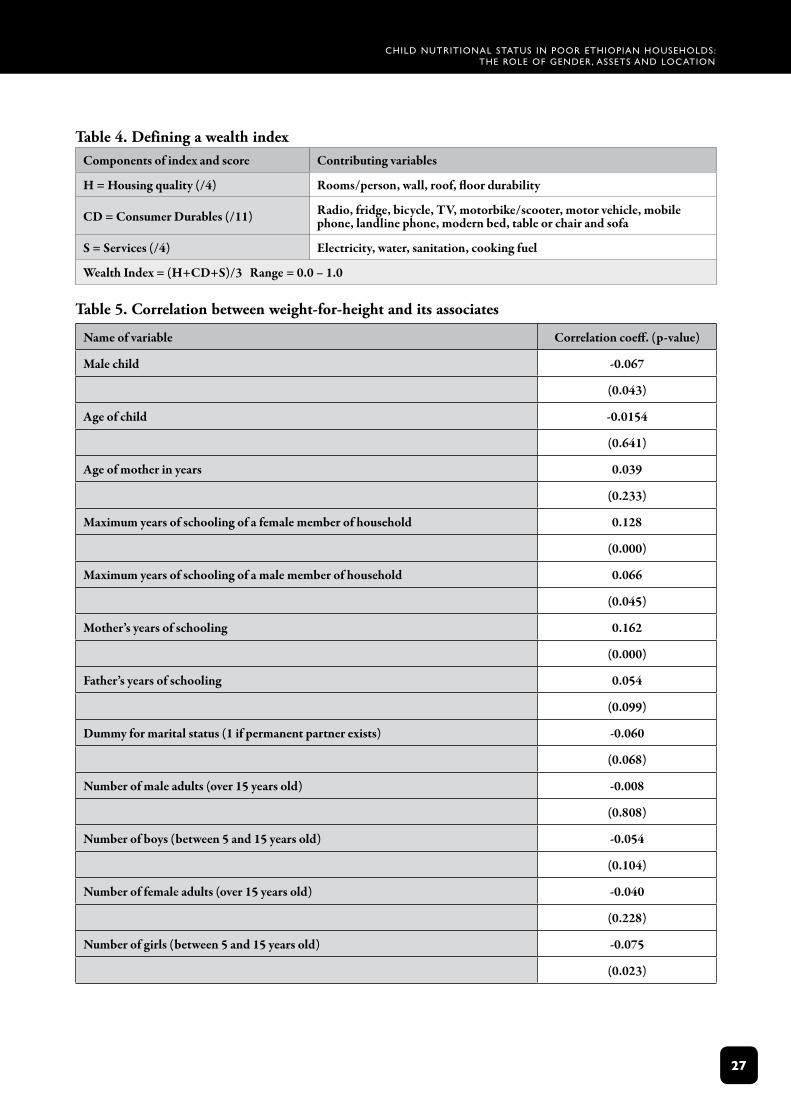
Child nutritional status in poor Ethiopian housEholds: thE rolE of gEndEr, assEts and loCation
2�
Table 4. Defining a wealth indexComponents of index and score Contributing variables
H = Housing quality (/4) Rooms/person, wall, roof, floor durability
CD = Consumer Durables (/11) Radio, fridge, bicycle, TV, motorbike/scooter, motor vehicle, mobile phone, landline phone, modern bed, table or chair and sofa
S = Services (/4) Electricity, water, sanitation, cooking fuel
Wealth Index = (H+CD+S)/3 Range = 0.0 – 1.0
Table 5. Correlation between weight‑for‑height and its associates
Name of variable Correlation coeff. (p-value)
Male child -0.067
(0.043)
Age of child -0.0154
(0.641)
Age of mother in years 0.039
(0.233)
Maximum years of schooling of a female member of household 0.128
(0.000)
Maximum years of schooling of a male member of household 0.066
(0.045)
Mother’s years of schooling 0.162
(0.000)
Father’s years of schooling 0.054
(0.099)
Dummy for marital status (1 if permanent partner exists) -0.060
(0.068)
Number of male adults (over 15 years old) -0.008
(0.808)
Number of boys (between 5 and 15 years old) -0.054
(0.104)
Number of female adults (over 15 years old) -0.040
(0.228)
Number of girls (between 5 and 15 years old) -0.075
(0.023)
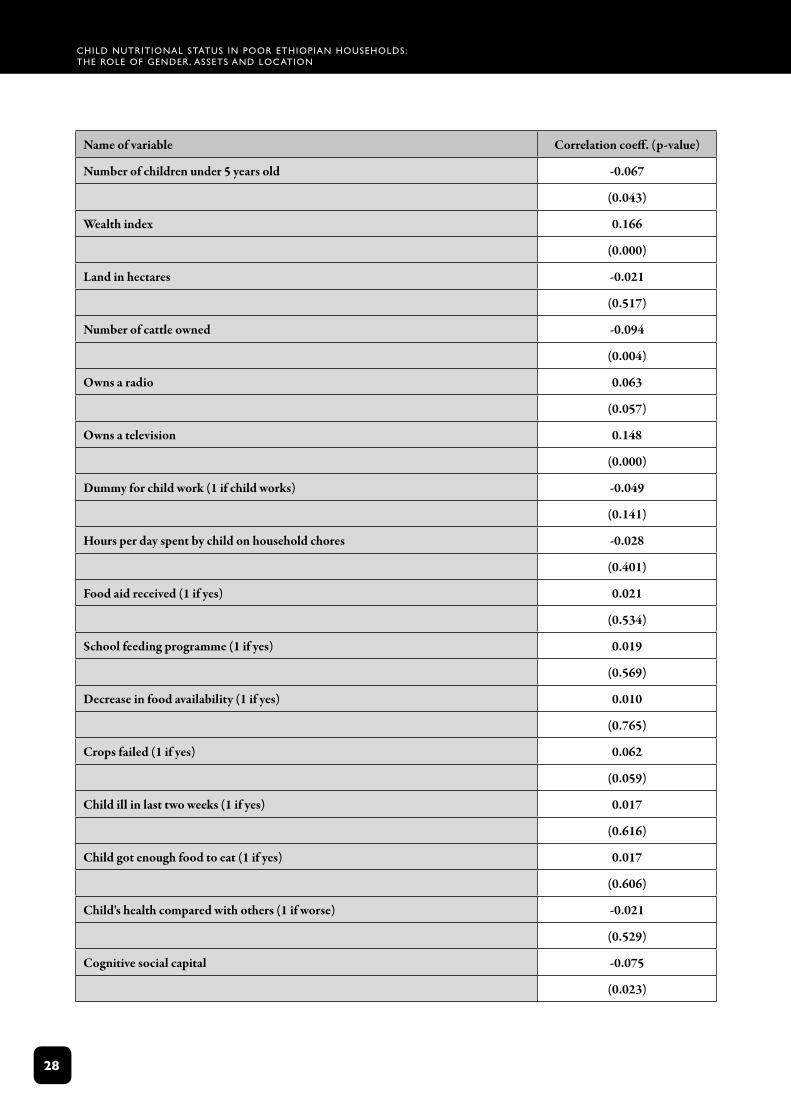
Child nutritional status in poor Ethiopian housEholds: thE rolE of gEndEr, assEts and loCation
2�
Name of variable Correlation coeff. (p-value)
Number of children under 5 years old -0.067
(0.043)
Wealth index 0.166
(0.000)
Land in hectares -0.021
(0.517)
Number of cattle owned -0.094
(0.004)
Owns a radio 0.063
(0.057)
Owns a television 0.148
(0.000)
Dummy for child work (1 if child works) -0.049
(0.141)
Hours per day spent by child on household chores -0.028
(0.401)
Food aid received (1 if yes) 0.021
(0.534)
School feeding programme (1 if yes) 0.019
(0.569)
Decrease in food availability (1 if yes) 0.010
(0.765)
Crops failed (1 if yes) 0.062
(0.059)
Child ill in last two weeks (1 if yes) 0.017
(0.616)
Child got enough food to eat (1 if yes) 0.017
(0.606)
Child's health compared with others (1 if worse) -0.021
(0.529)
Cognitive social capital -0.075
(0.023)
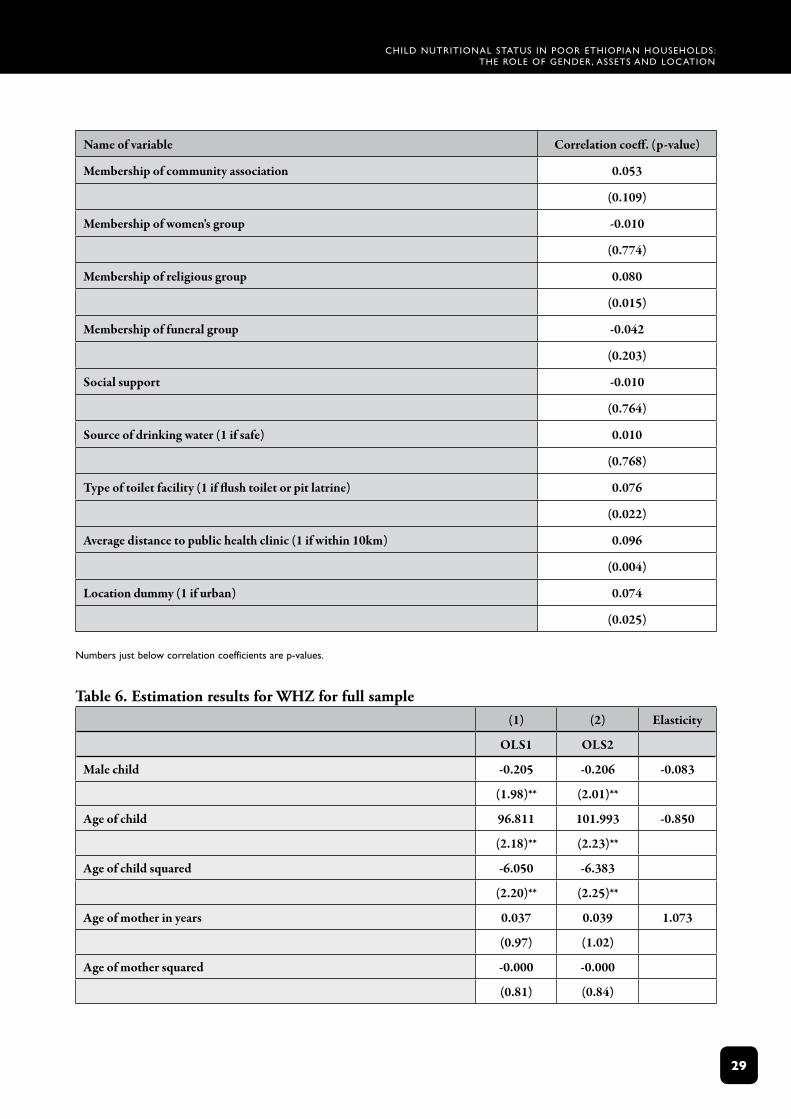
Child nutritional status in poor Ethiopian housEholds: thE rolE of gEndEr, assEts and loCation
2�
Name of variable Correlation coeff. (p-value)
Membership of community association 0.053
(0.109)
Membership of women's group -0.010
(0.774)
Membership of religious group 0.080
(0.015)
Membership of funeral group -0.042
(0.203)
Social support -0.010
(0.764)
Source of drinking water (1 if safe) 0.010
(0.768)
Type of toilet facility (1 if flush toilet or pit latrine) 0.076
(0.022)
Average distance to public health clinic (1 if within 10km) 0.096
(0.004)
Location dummy (1 if urban) 0.074
(0.025)
numbers just below correlation coefficients are p‑values.
Table 6. Estimation results for WHZ for full sample(1) (2) Elasticity
OLS1 OLS2
Male child -0.205 -0.206 -0.083
(1.98)** (2.01)**
Age of child 96.811 101.993 -0.850
(2.18)** (2.23)**
Age of child squared -6.050 -6.383
(2.20)** (2.25)**
Age of mother in years 0.037 0.039 1.073
(0.97) (1.02)
Age of mother squared -0.000 -0.000
(0.81) (0.84)
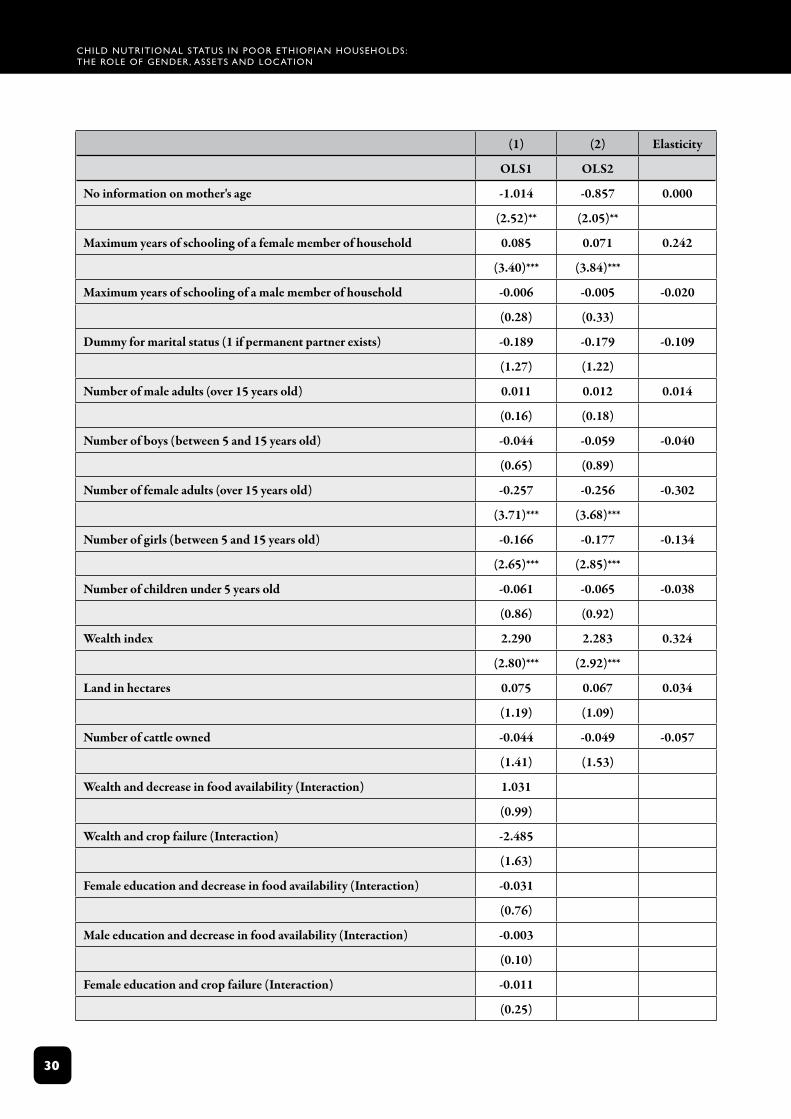
Child nutritional status in poor Ethiopian housEholds: thE rolE of gEndEr, assEts and loCation
30
(1) (2) Elasticity
OLS1 OLS2
No information on mother's age -1.014 -0.857 0.000
(2.52)** (2.05)**
Maximum years of schooling of a female member of household 0.085 0.071 0.242
(3.40)*** (3.84)***
Maximum years of schooling of a male member of household -0.006 -0.005 -0.020
(0.28) (0.33)
Dummy for marital status (1 if permanent partner exists) -0.189 -0.179 -0.109
(1.27) (1.22)
Number of male adults (over 15 years old) 0.011 0.012 0.014
(0.16) (0.18)
Number of boys (between 5 and 15 years old) -0.044 -0.059 -0.040
(0.65) (0.89)
Number of female adults (over 15 years old) -0.257 -0.256 -0.302
(3.71)*** (3.68)***
Number of girls (between 5 and 15 years old) -0.166 -0.177 -0.134
(2.65)*** (2.85)***
Number of children under 5 years old -0.061 -0.065 -0.038
(0.86) (0.92)
Wealth index 2.290 2.283 0.324
(2.80)*** (2.92)***
Land in hectares 0.075 0.067 0.034
(1.19) (1.09)
Number of cattle owned -0.044 -0.049 -0.057
(1.41) (1.53)
Wealth and decrease in food availability (Interaction) 1.031
(0.99)
Wealth and crop failure (Interaction) -2.485
(1.63)
Female education and decrease in food availability (Interaction) -0.031
(0.76)
Male education and decrease in food availability (Interaction) -0.003
(0.10)
Female education and crop failure (Interaction) -0.011
(0.25)
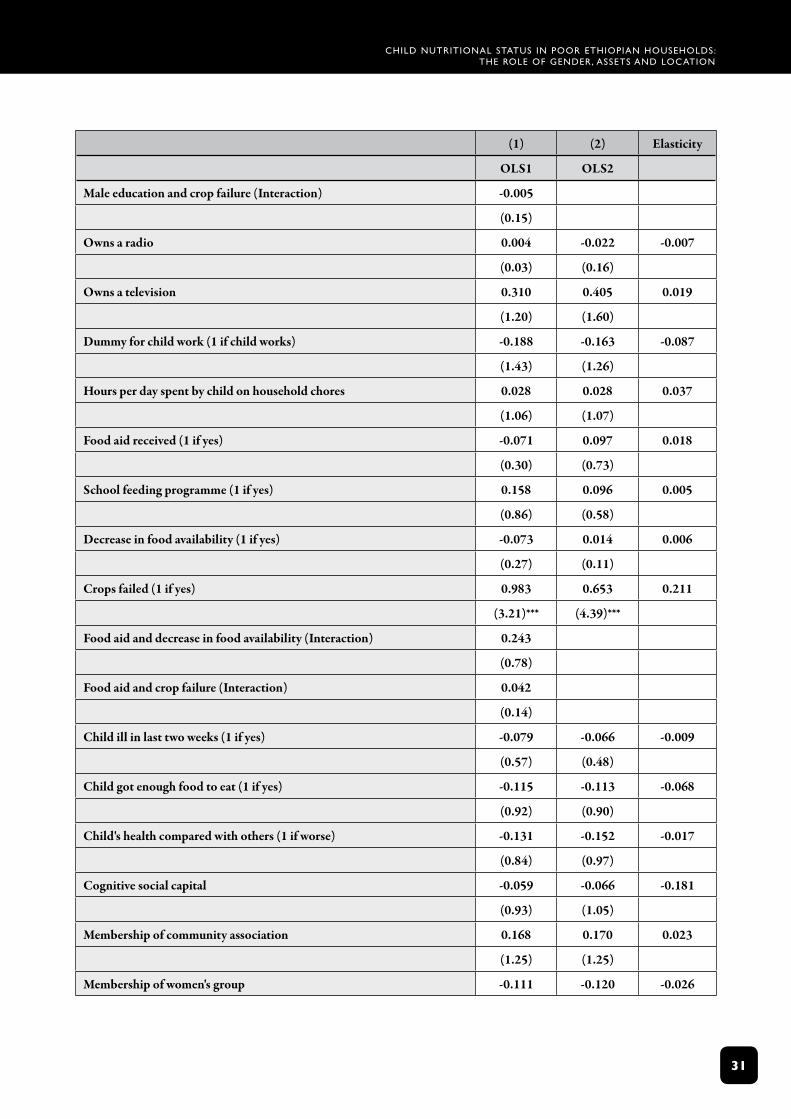
Child nutritional status in poor Ethiopian housEholds: thE rolE of gEndEr, assEts and loCation
3�
(1) (2) Elasticity
OLS1 OLS2
Male education and crop failure (Interaction) -0.005
(0.15)
Owns a radio 0.004 -0.022 -0.007
(0.03) (0.16)
Owns a television 0.310 0.405 0.019
(1.20) (1.60)
Dummy for child work (1 if child works) -0.188 -0.163 -0.087
(1.43) (1.26)
Hours per day spent by child on household chores 0.028 0.028 0.037
(1.06) (1.07)
Food aid received (1 if yes) -0.071 0.097 0.018
(0.30) (0.73)
School feeding programme (1 if yes) 0.158 0.096 0.005
(0.86) (0.58)
Decrease in food availability (1 if yes) -0.073 0.014 0.006
(0.27) (0.11)
Crops failed (1 if yes) 0.983 0.653 0.211
(3.21)*** (4.39)***
Food aid and decrease in food availability (Interaction) 0.243
(0.78)
Food aid and crop failure (Interaction) 0.042
(0.14)
Child ill in last two weeks (1 if yes) -0.079 -0.066 -0.009
(0.57) (0.48)
Child got enough food to eat (1 if yes) -0.115 -0.113 -0.068
(0.92) (0.90)
Child's health compared with others (1 if worse) -0.131 -0.152 -0.017
(0.84) (0.97)
Cognitive social capital -0.059 -0.066 -0.181
(0.93) (1.05)
Membership of community association 0.168 0.170 0.023
(1.25) (1.25)
Membership of women's group -0.111 -0.120 -0.026
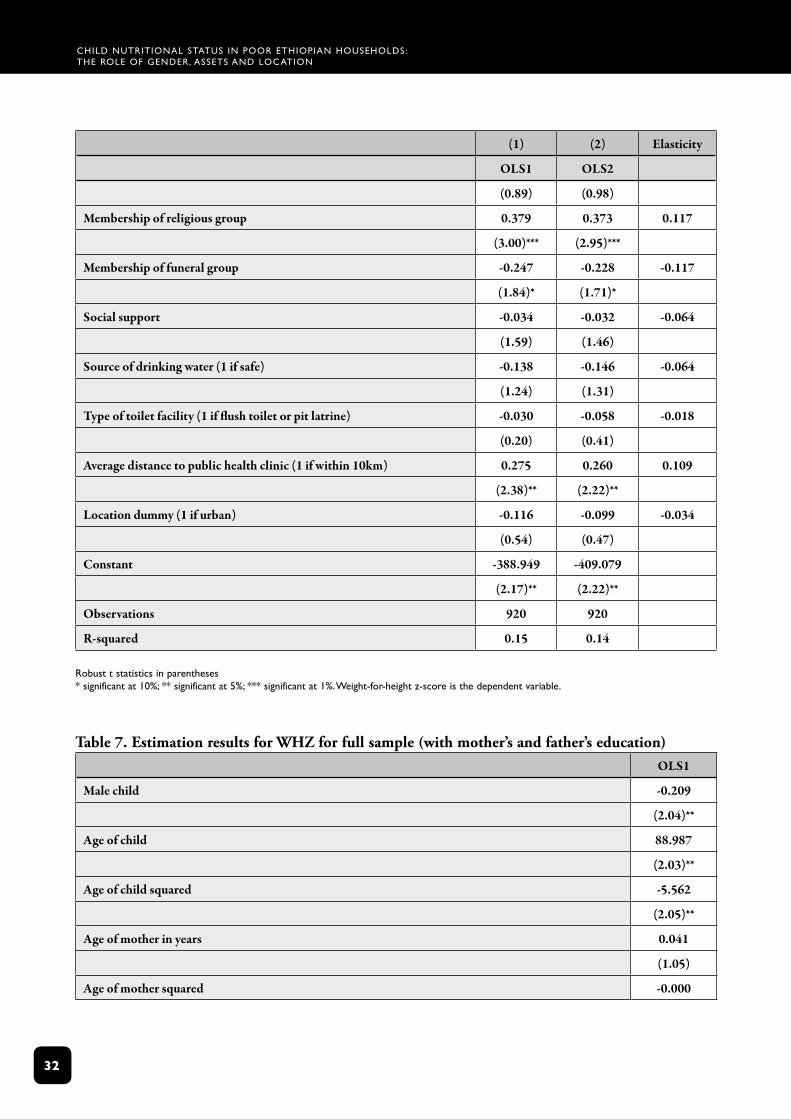
Child nutritional status in poor Ethiopian housEholds: thE rolE of gEndEr, assEts and loCation
32
(1) (2) Elasticity
OLS1 OLS2
(0.89) (0.98)
Membership of religious group 0.379 0.373 0.117
(3.00)*** (2.95)***
Membership of funeral group -0.247 -0.228 -0.117
(1.84)* (1.71)*
Social support -0.034 -0.032 -0.064
(1.59) (1.46)
Source of drinking water (1 if safe) -0.138 -0.146 -0.064
(1.24) (1.31)
Type of toilet facility (1 if flush toilet or pit latrine) -0.030 -0.058 -0.018
(0.20) (0.41)
Average distance to public health clinic (1 if within 10km) 0.275 0.260 0.109
(2.38)** (2.22)**
Location dummy (1 if urban) -0.116 -0.099 -0.034
(0.54) (0.47)
Constant -388.949 -409.079
(2.17)** (2.22)**
Observations 920 920
R-squared 0.15 0.14
robust t statistics in parentheses * significant at 10%; ** significant at 5%; *** significant at 1%. Weight‑for‑height z‑score is the dependent variable.
Table 7. Estimation results for WHZ for full sample (with mother’s and father’s education) OLS1
Male child -0.209
(2.04)**
Age of child 88.987
(2.03)**
Age of child squared -5.562
(2.05)**
Age of mother in years 0.041
(1.05)
Age of mother squared -0.000
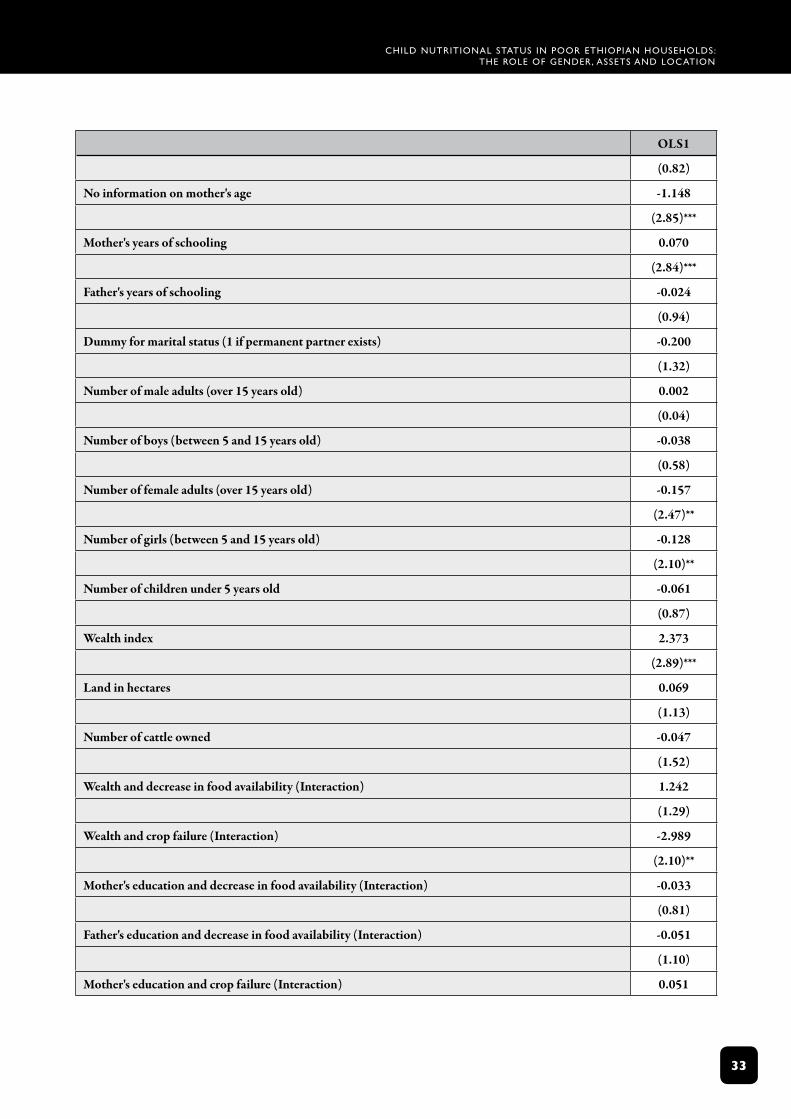
Child nutritional status in poor Ethiopian housEholds: thE rolE of gEndEr, assEts and loCation
33
OLS1
(0.82)
No information on mother's age -1.148
(2.85)***
Mother's years of schooling 0.070
(2.84)***
Father's years of schooling -0.024
(0.94)
Dummy for marital status (1 if permanent partner exists) -0.200
(1.32)
Number of male adults (over 15 years old) 0.002
(0.04)
Number of boys (between 5 and 15 years old) -0.038
(0.58)
Number of female adults (over 15 years old) -0.157
(2.47)**
Number of girls (between 5 and 15 years old) -0.128
(2.10)**
Number of children under 5 years old -0.061
(0.87)
Wealth index 2.373
(2.89)***
Land in hectares 0.069
(1.13)
Number of cattle owned -0.047
(1.52)
Wealth and decrease in food availability (Interaction) 1.242
(1.29)
Wealth and crop failure (Interaction) -2.989
(2.10)**
Mother's education and decrease in food availability (Interaction) -0.033
(0.81)
Father's education and decrease in food availability (Interaction) -0.051
(1.10)
Mother's education and crop failure (Interaction) 0.051
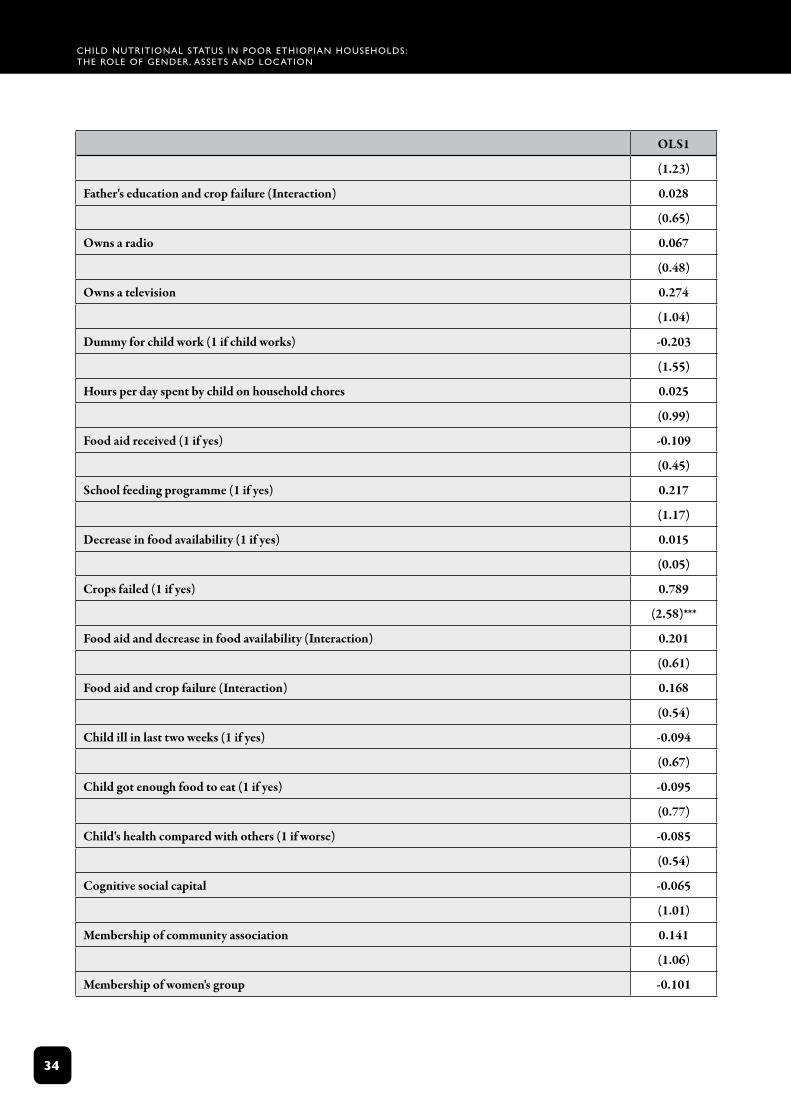
Child nutritional status in poor Ethiopian housEholds: thE rolE of gEndEr, assEts and loCation
34
OLS1
(1.23)
Father's education and crop failure (Interaction) 0.028
(0.65)
Owns a radio 0.067
(0.48)
Owns a television 0.274
(1.04)
Dummy for child work (1 if child works) -0.203
(1.55)
Hours per day spent by child on household chores 0.025
(0.99)
Food aid received (1 if yes) -0.109
(0.45)
School feeding programme (1 if yes) 0.217
(1.17)
Decrease in food availability (1 if yes) 0.015
(0.05)
Crops failed (1 if yes) 0.789
(2.58)***
Food aid and decrease in food availability (Interaction) 0.201
(0.61)
Food aid and crop failure (Interaction) 0.168
(0.54)
Child ill in last two weeks (1 if yes) -0.094
(0.67)
Child got enough food to eat (1 if yes) -0.095
(0.77)
Child's health compared with others (1 if worse) -0.085
(0.54)
Cognitive social capital -0.065
(1.01)
Membership of community association 0.141
(1.06)
Membership of women's group -0.101
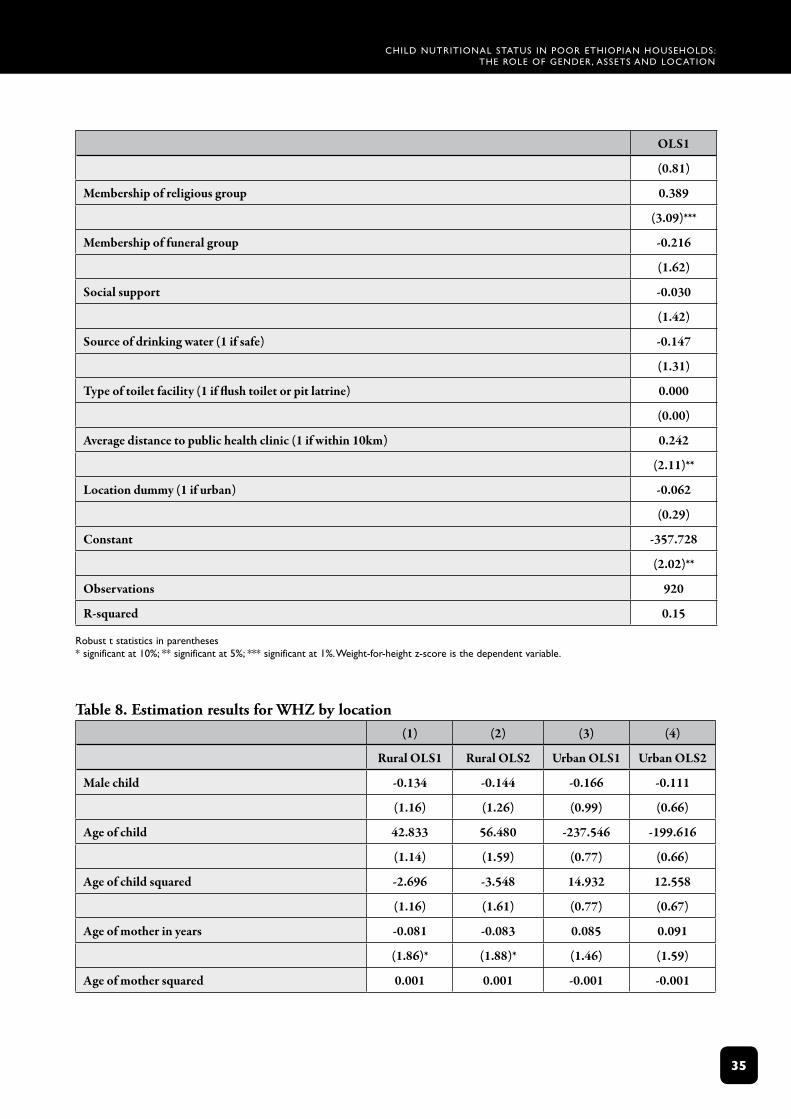
Child nutritional status in poor Ethiopian housEholds: thE rolE of gEndEr, assEts and loCation
35
OLS1
(0.81)
Membership of religious group 0.389
(3.09)***
Membership of funeral group -0.216
(1.62)
Social support -0.030
(1.42)
Source of drinking water (1 if safe) -0.147
(1.31)
Type of toilet facility (1 if flush toilet or pit latrine) 0.000
(0.00)
Average distance to public health clinic (1 if within 10km) 0.242
(2.11)**
Location dummy (1 if urban) -0.062
(0.29)
Constant -357.728
(2.02)**
Observations 920
R-squared 0.15
robust t statistics in parentheses * significant at 10%; ** significant at 5%; *** significant at 1%. Weight‑for‑height z‑score is the dependent variable.
Table 8. Estimation results for WHZ by location (1) (2) (3) (4)
Rural OLS1 Rural OLS2 Urban OLS1 Urban OLS2
Male child -0.134 -0.144 -0.166 -0.111
(1.16) (1.26) (0.99) (0.66)
Age of child 42.833 56.480 -237.546 -199.616
(1.14) (1.59) (0.77) (0.66)
Age of child squared -2.696 -3.548 14.932 12.558
(1.16) (1.61) (0.77) (0.67)
Age of mother in years -0.081 -0.083 0.085 0.091
(1.86)* (1.88)* (1.46) (1.59)
Age of mother squared 0.001 0.001 -0.001 -0.001
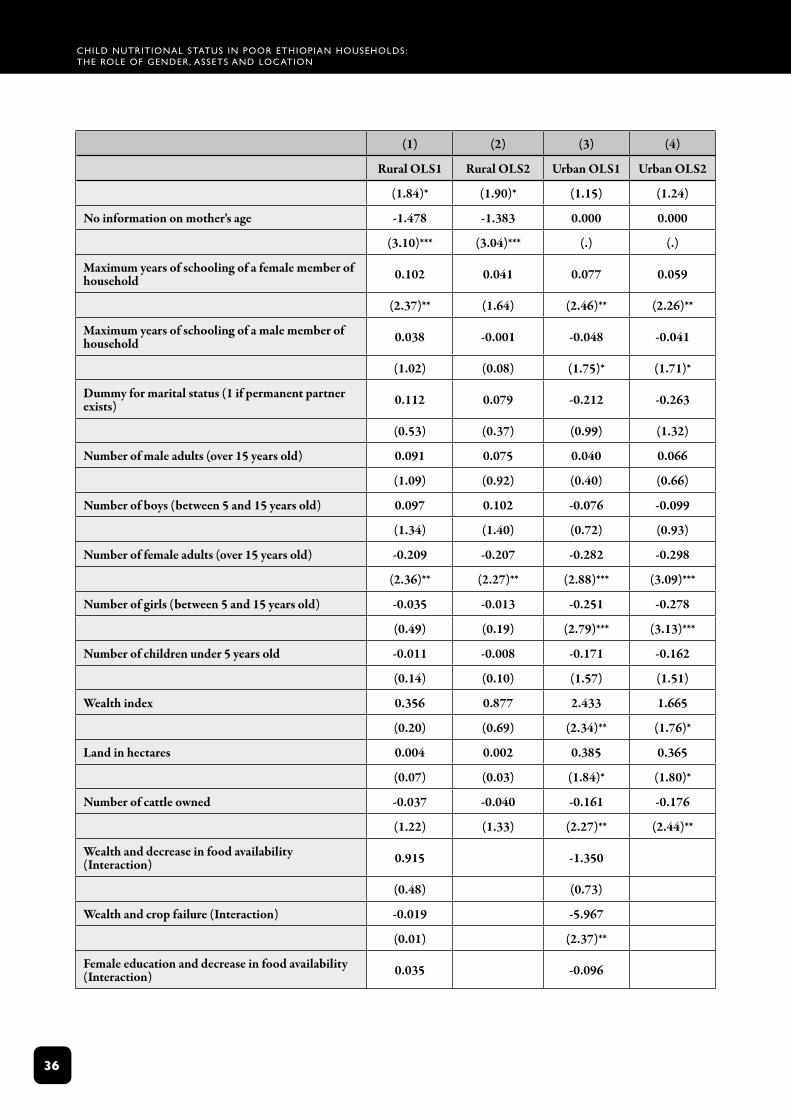
Child nutritional status in poor Ethiopian housEholds: thE rolE of gEndEr, assEts and loCation
36
(1) (2) (3) (4)
Rural OLS1 Rural OLS2 Urban OLS1 Urban OLS2
(1.84)* (1.90)* (1.15) (1.24)
No information on mother's age -1.478 -1.383 0.000 0.000
(3.10)*** (3.04)*** (.) (.)
Maximum years of schooling of a female member of household 0.102 0.041 0.077 0.059
(2.37)** (1.64) (2.46)** (2.26)**
Maximum years of schooling of a male member of household 0.038 -0.001 -0.048 -0.041
(1.02) (0.08) (1.75)* (1.71)*
Dummy for marital status (1 if permanent partner exists) 0.112 0.079 -0.212 -0.263
(0.53) (0.37) (0.99) (1.32)
Number of male adults (over 15 years old) 0.091 0.075 0.040 0.066
(1.09) (0.92) (0.40) (0.66)
Number of boys (between 5 and 15 years old) 0.097 0.102 -0.076 -0.099
(1.34) (1.40) (0.72) (0.93)
Number of female adults (over 15 years old) -0.209 -0.207 -0.282 -0.298
(2.36)** (2.27)** (2.88)*** (3.09)***
Number of girls (between 5 and 15 years old) -0.035 -0.013 -0.251 -0.278
(0.49) (0.19) (2.79)*** (3.13)***
Number of children under 5 years old -0.011 -0.008 -0.171 -0.162
(0.14) (0.10) (1.57) (1.51)
Wealth index 0.356 0.877 2.433 1.665
(0.20) (0.69) (2.34)** (1.76)*
Land in hectares 0.004 0.002 0.385 0.365
(0.07) (0.03) (1.84)* (1.80)*
Number of cattle owned -0.037 -0.040 -0.161 -0.176
(1.22) (1.33) (2.27)** (2.44)**
Wealth and decrease in food availability (Interaction) 0.915 -1.350
(0.48) (0.73)
Wealth and crop failure (Interaction) -0.019 -5.967
(0.01) (2.37)**
Female education and decrease in food availability (Interaction) 0.035 -0.096
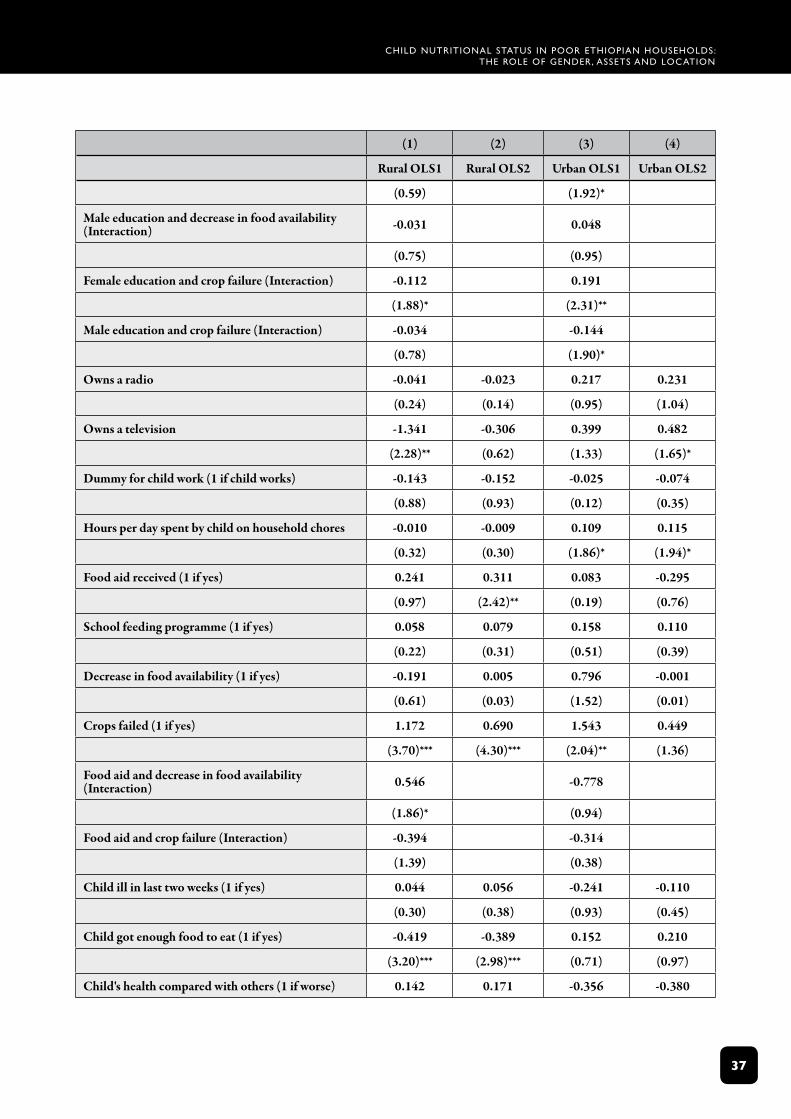
Child nutritional status in poor Ethiopian housEholds: thE rolE of gEndEr, assEts and loCation
3�
(1) (2) (3) (4)
Rural OLS1 Rural OLS2 Urban OLS1 Urban OLS2
(0.59) (1.92)*
Male education and decrease in food availability (Interaction) -0.031 0.048
(0.75) (0.95)
Female education and crop failure (Interaction) -0.112 0.191
(1.88)* (2.31)**
Male education and crop failure (Interaction) -0.034 -0.144
(0.78) (1.90)*
Owns a radio -0.041 -0.023 0.217 0.231
(0.24) (0.14) (0.95) (1.04)
Owns a television -1.341 -0.306 0.399 0.482
(2.28)** (0.62) (1.33) (1.65)*
Dummy for child work (1 if child works) -0.143 -0.152 -0.025 -0.074
(0.88) (0.93) (0.12) (0.35)
Hours per day spent by child on household chores -0.010 -0.009 0.109 0.115
(0.32) (0.30) (1.86)* (1.94)*
Food aid received (1 if yes) 0.241 0.311 0.083 -0.295
(0.97) (2.42)** (0.19) (0.76)
School feeding programme (1 if yes) 0.058 0.079 0.158 0.110
(0.22) (0.31) (0.51) (0.39)
Decrease in food availability (1 if yes) -0.191 0.005 0.796 -0.001
(0.61) (0.03) (1.52) (0.01)
Crops failed (1 if yes) 1.172 0.690 1.543 0.449
(3.70)*** (4.30)*** (2.04)** (1.36)
Food aid and decrease in food availability (Interaction) 0.546 -0.778
(1.86)* (0.94)
Food aid and crop failure (Interaction) -0.394 -0.314
(1.39) (0.38)
Child ill in last two weeks (1 if yes) 0.044 0.056 -0.241 -0.110
(0.30) (0.38) (0.93) (0.45)
Child got enough food to eat (1 if yes) -0.419 -0.389 0.152 0.210
(3.20)*** (2.98)*** (0.71) (0.97)
Child's health compared with others (1 if worse) 0.142 0.171 -0.356 -0.380
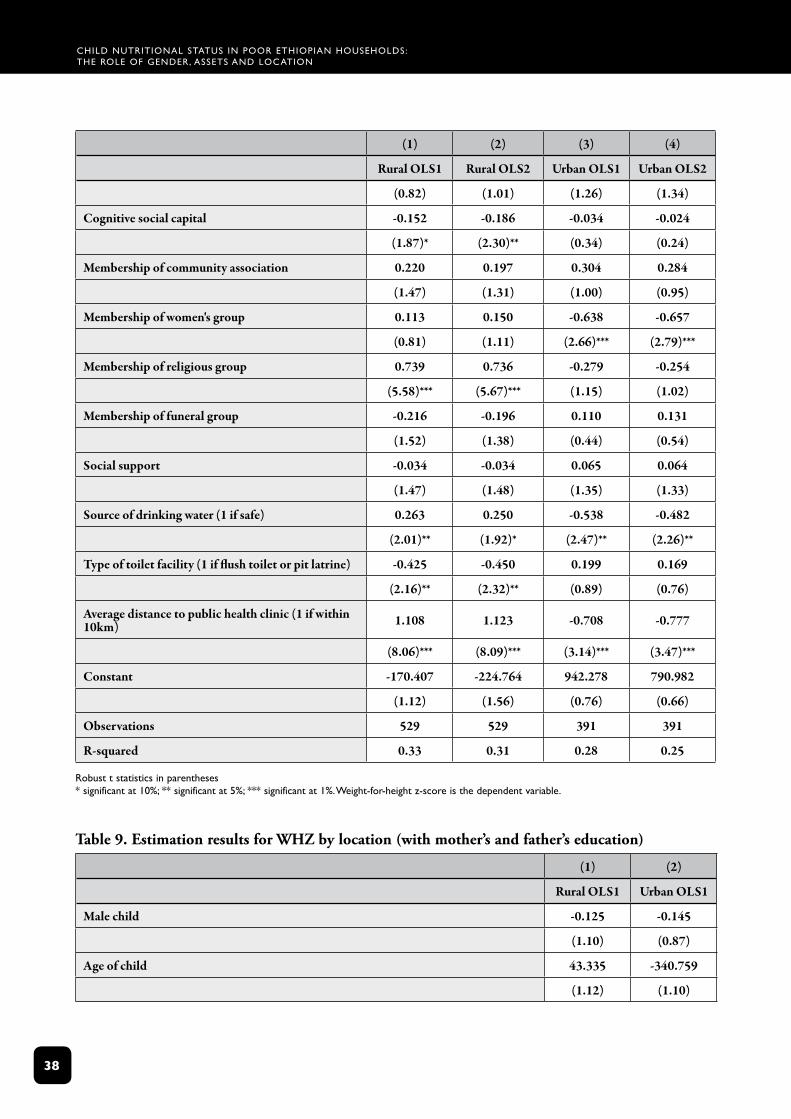
Child nutritional status in poor Ethiopian housEholds: thE rolE of gEndEr, assEts and loCation
3�
(1) (2) (3) (4)
Rural OLS1 Rural OLS2 Urban OLS1 Urban OLS2
(0.82) (1.01) (1.26) (1.34)
Cognitive social capital -0.152 -0.186 -0.034 -0.024
(1.87)* (2.30)** (0.34) (0.24)
Membership of community association 0.220 0.197 0.304 0.284
(1.47) (1.31) (1.00) (0.95)
Membership of women's group 0.113 0.150 -0.638 -0.657
(0.81) (1.11) (2.66)*** (2.79)***
Membership of religious group 0.739 0.736 -0.279 -0.254
(5.58)*** (5.67)*** (1.15) (1.02)
Membership of funeral group -0.216 -0.196 0.110 0.131
(1.52) (1.38) (0.44) (0.54)
Social support -0.034 -0.034 0.065 0.064
(1.47) (1.48) (1.35) (1.33)
Source of drinking water (1 if safe) 0.263 0.250 -0.538 -0.482
(2.01)** (1.92)* (2.47)** (2.26)**
Type of toilet facility (1 if flush toilet or pit latrine) -0.425 -0.450 0.199 0.169
(2.16)** (2.32)** (0.89) (0.76)
Average distance to public health clinic (1 if within 10km) 1.108 1.123 -0.708 -0.777
(8.06)*** (8.09)*** (3.14)*** (3.47)***
Constant -170.407 -224.764 942.278 790.982
(1.12) (1.56) (0.76) (0.66)
Observations 529 529 391 391
R-squared 0.33 0.31 0.28 0.25
robust t statistics in parentheses * significant at 10%; ** significant at 5%; *** significant at 1%. Weight‑for‑height z‑score is the dependent variable.
Table 9. Estimation results for WHZ by location (with mother’s and father’s education)
(1) (2)
Rural OLS1 Urban OLS1
Male child -0.125 -0.145
(1.10) (0.87)
Age of child 43.335 -340.759
(1.12) (1.10)
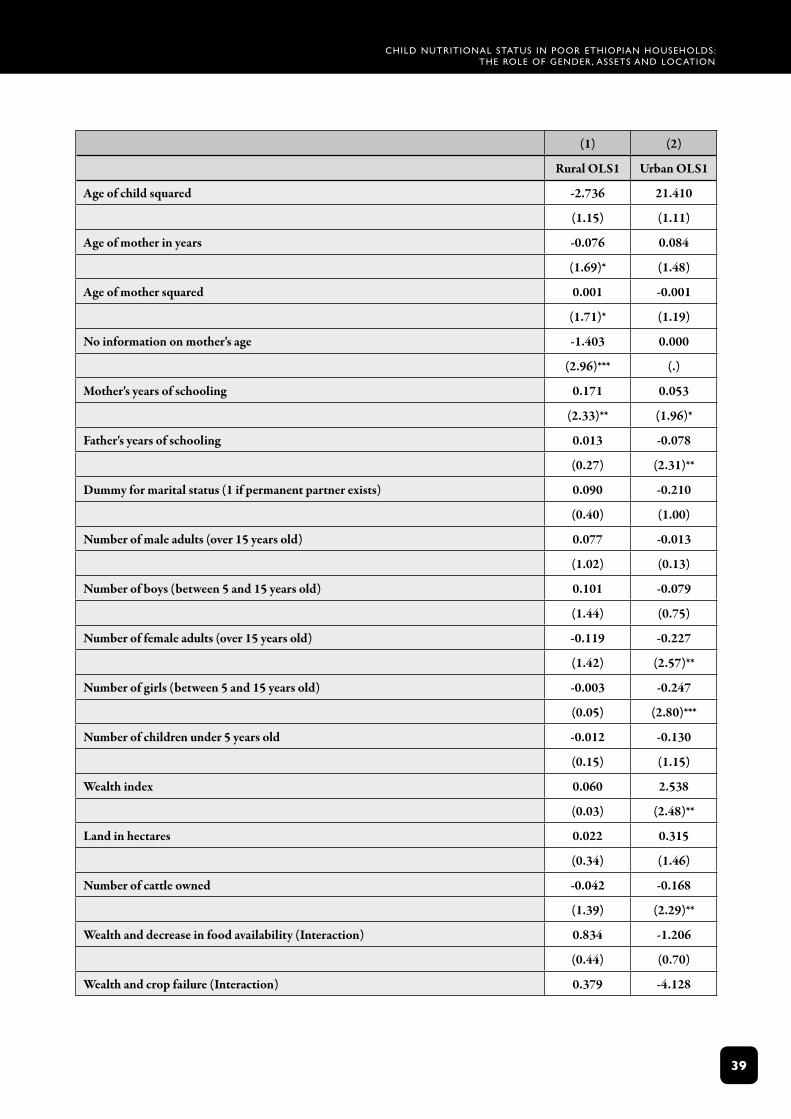
Child nutritional status in poor Ethiopian housEholds: thE rolE of gEndEr, assEts and loCation
3�
(1) (2)
Rural OLS1 Urban OLS1
Age of child squared -2.736 21.410
(1.15) (1.11)
Age of mother in years -0.076 0.084
(1.69)* (1.48)
Age of mother squared 0.001 -0.001
(1.71)* (1.19)
No information on mother's age -1.403 0.000
(2.96)*** (.)
Mother's years of schooling 0.171 0.053
(2.33)** (1.96)*
Father's years of schooling 0.013 -0.078
(0.27) (2.31)**
Dummy for marital status (1 if permanent partner exists) 0.090 -0.210
(0.40) (1.00)
Number of male adults (over 15 years old) 0.077 -0.013
(1.02) (0.13)
Number of boys (between 5 and 15 years old) 0.101 -0.079
(1.44) (0.75)
Number of female adults (over 15 years old) -0.119 -0.227
(1.42) (2.57)**
Number of girls (between 5 and 15 years old) -0.003 -0.247
(0.05) (2.80)***
Number of children under 5 years old -0.012 -0.130
(0.15) (1.15)
Wealth index 0.060 2.538
(0.03) (2.48)**
Land in hectares 0.022 0.315
(0.34) (1.46)
Number of cattle owned -0.042 -0.168
(1.39) (2.29)**
Wealth and decrease in food availability (Interaction) 0.834 -1.206
(0.44) (0.70)
Wealth and crop failure (Interaction) 0.379 -4.128
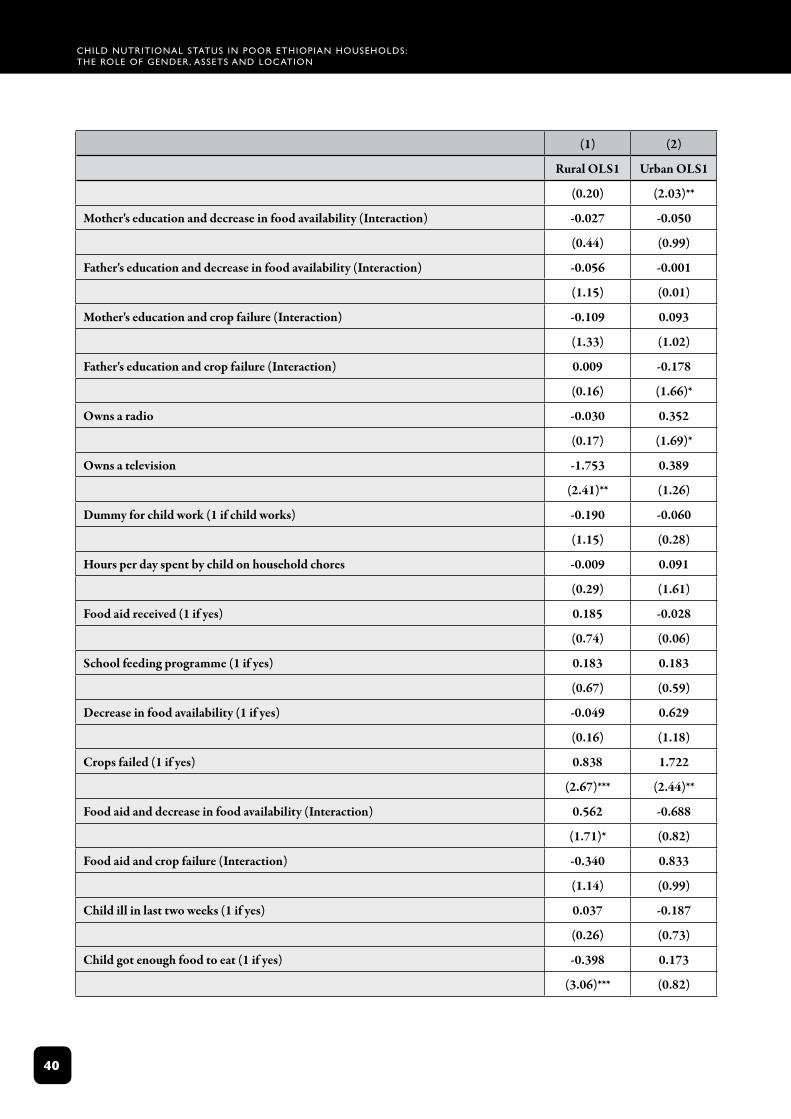
Child nutritional status in poor Ethiopian housEholds: thE rolE of gEndEr, assEts and loCation
40
(1) (2)
Rural OLS1 Urban OLS1
(0.20) (2.03)**
Mother's education and decrease in food availability (Interaction) -0.027 -0.050
(0.44) (0.99)
Father's education and decrease in food availability (Interaction) -0.056 -0.001
(1.15) (0.01)
Mother's education and crop failure (Interaction) -0.109 0.093
(1.33) (1.02)
Father's education and crop failure (Interaction) 0.009 -0.178
(0.16) (1.66)*
Owns a radio -0.030 0.352
(0.17) (1.69)*
Owns a television -1.753 0.389
(2.41)** (1.26)
Dummy for child work (1 if child works) -0.190 -0.060
(1.15) (0.28)
Hours per day spent by child on household chores -0.009 0.091
(0.29) (1.61)
Food aid received (1 if yes) 0.185 -0.028
(0.74) (0.06)
School feeding programme (1 if yes) 0.183 0.183
(0.67) (0.59)
Decrease in food availability (1 if yes) -0.049 0.629
(0.16) (1.18)
Crops failed (1 if yes) 0.838 1.722
(2.67)*** (2.44)**
Food aid and decrease in food availability (Interaction) 0.562 -0.688
(1.71)* (0.82)
Food aid and crop failure (Interaction) -0.340 0.833
(1.14) (0.99)
Child ill in last two weeks (1 if yes) 0.037 -0.187
(0.26) (0.73)
Child got enough food to eat (1 if yes) -0.398 0.173
(3.06)*** (0.82)
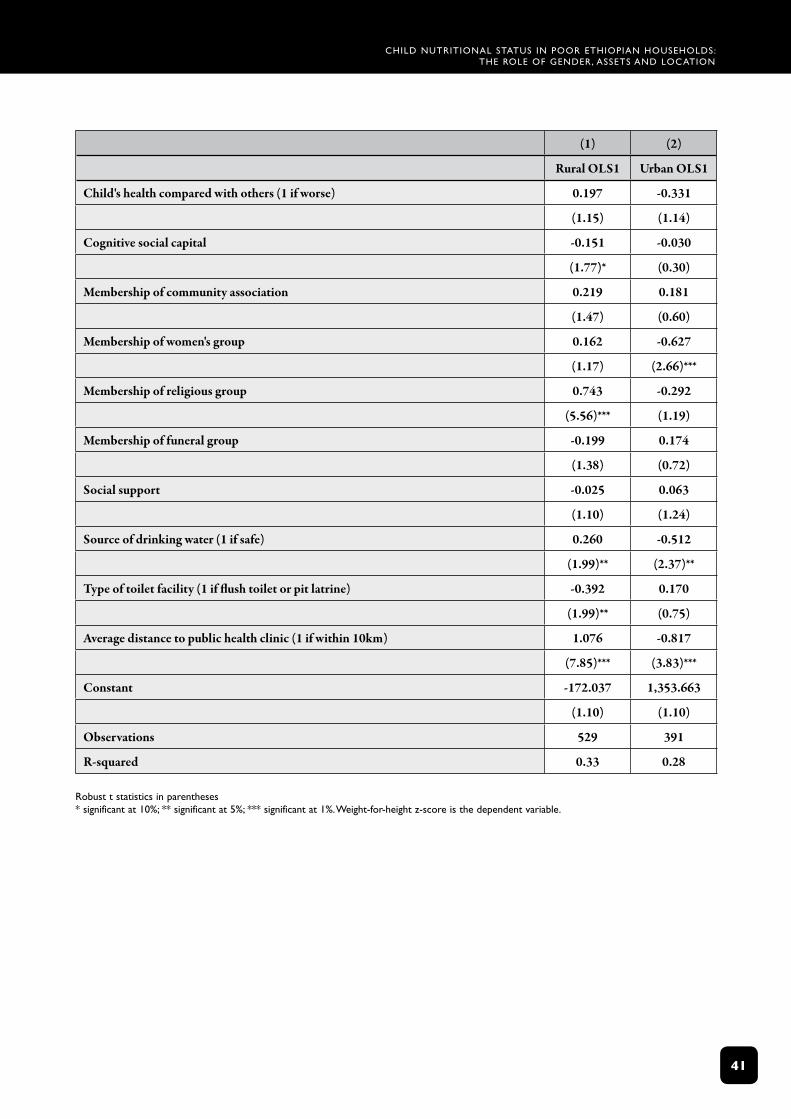
Child nutritional status in poor Ethiopian housEholds: thE rolE of gEndEr, assEts and loCation
4�
(1) (2)
Rural OLS1 Urban OLS1
Child's health compared with others (1 if worse) 0.197 -0.331
(1.15) (1.14)
Cognitive social capital -0.151 -0.030
(1.77)* (0.30)
Membership of community association 0.219 0.181
(1.47) (0.60)
Membership of women's group 0.162 -0.627
(1.17) (2.66)***
Membership of religious group 0.743 -0.292
(5.56)*** (1.19)
Membership of funeral group -0.199 0.174
(1.38) (0.72)
Social support -0.025 0.063
(1.10) (1.24)
Source of drinking water (1 if safe) 0.260 -0.512
(1.99)** (2.37)**
Type of toilet facility (1 if flush toilet or pit latrine) -0.392 0.170
(1.99)** (0.75)
Average distance to public health clinic (1 if within 10km) 1.076 -0.817
(7.85)*** (3.83)***
Constant -172.037 1,353.663
(1.10) (1.10)
Observations 529 391
R-squared 0.33 0.28
robust t statistics in parentheses * significant at 10%; ** significant at 5%; *** significant at 1%. Weight‑for‑height z‑score is the dependent variable.
Child nutritional status in poor Ethiopian housEholds: thE rolE of gEndEr, assEts and loCation
42
appendix: definition of wastingAchildiswastedifhis/herweight-heightratioislessthantwostandarddeviationsbelowthemeanweight-heightratioofthereferencepopulation.
Wasting = (Weight/Height)I < Mean (Weight/Height) - 2 Standard Deviation (Weight/Height)
Similarly,severe wasting isdefinedasfollows:
Severe Wasting = (Weight/Height)I < Mean (Weight/Height) - 3 Standard Deviation (Weight/Height)
Height-for-age(stunting)andweight-for-height(wasting)arethemostfrequentlyusedmeasuresofnutritionalstatus.Stuntingisalong term(cumulative)indicatorofslowgrowth(pastnutrition)duetorepeatedillnessand/orinsufficientdiet,whilewastingisshorttermandcanbereversedgivenfavourableconditions.Giventhatstuntingisfrequentlytheresultofnutritionchallengesduringinfancy,itwasnotconsideredasuitableindicatorforthecurrentdeterminantsofunder-nutritionineight-year-olds.Underweight,whichisnotconsideredinthispaper,couldbecausedbystunting,wastingorbothandhencedoesnotdistinguishbetweencumulative(long term)andcurrent(short term)malnutrition(seeSCUKEthiopia,2002;MoFED,2002a).
Child nutritional status in poor Ethiopian housEholds: thE rolE of gEndEr, assEts and loCation
43
referencesACC/SCN,1998,Reports on the World Nutrition Situation: Update on the First World Nutrition Situation Report 1987,Geneva:WorldHealthOrganization
Admasu,S.,2000,Post-Harvest Sector Challenges and Opportunities in Ethiopia,AddisAbaba:EthiopianAgriculturalResearchOrganisation
Alderman,H.,Behrman,J.,andHoddinott,J.,2004,‘Nutrition,malnutritionandeconomicgrowth’,inHealth and economic growth: findings and policy implications(forthcoming)(ed.)López-Casasnovas,G.,Rivera,B.andCurrais,L.,Cambridge,MA:MITPress
Alderman,H.,Hoddinott,J.andKinsey,B.,2002,Long term consequences of early childhood malnutrition,Mimeo,DepartmentofEconomics,DalhousieUniversity,Halifax,Canada
Alemu,T.,Asgedom,G.,Liebenberg,J.,Mekonnen,A.,Seager,J.,Tefera,B.,Woldehanna,T.,2003,Young lives preliminary country report: Ethiopia,London:YoungLives
Basu,K.,andFoster,J.,1998,‘Onmeasuringliteracy’,Economic Journal,108:1733-49
Behrman,J.R.,1993,‘Theeconomicrationaleforinvestinginnutritionindevelopingcountries’, World Development,Vol.21,no.11,1749-1771
Block,S.,2002, ‘Nutrition Knowledge Versus Schooling in the Demand for Child Micronutrient Status’, Nutrition Working Paper No.2, FletcherSchool,TuftsUniversity
Brown,J.E.,2002,Nutrition through the life cycle,Belmont,CA:WadsworthandThomsonLearning
Carter,M.R.andMallucio,J.A.,2003,‘Socialcapitalandcopingwitheconomicshocks:ananalysisofstuntingofSouthAfricanchildren’,World Development,Vol.31,no.7,pp.1147-1163
Charmarbagwala,R.,Ranger,M.,Waddington,H.andWhite,H.,2004,The determinants of child health and nutrition: a meta-analysis,OperationsEvaluationDepartment,Washington:WorldBank
Christiaensen,L.,andAlderman,H.,2004,‘ChildmalnutritioninEthiopia:canmaternalknowledgeaugmenttheroleofincome?’Economic Development and Cultural Change,52(2):287-312
CSA(CentralStatisticalAuthority),2000,Demographic and health survey,AddisAbaba:CSA
CSA(CentralStatisticsAuthority),2001,Welfare Monitoring Report Volume I,AddisAbaba:CSA
Degefe,B.,andNega,B.(eds.),2000,Annual report on the Ethiopian economy, vol. I,AddisAbaba:EthiopianEconomicAssociation
Deolalikar,A.,1996,‘ChildnutritionalstatusandchildgrowthinKenya:socioeconomicdeterminants’,Journal of International Development,55:273-308
Dercon,S.andHoddinott,J.,2003,‘Health,shocksandpovertypersistence’,WIDER Discussion Paper2003/08,Helsinki:UnitedNationsUniversity/WIDER
Desai,(1995)‘WhenAreChildrenfromLargeFamiliesDisadvantaged?EvidencefromCross-NationalAnalyses’, Population Studies49(2):195-210
Child nutritional status in poor Ethiopian housEholds: thE rolE of gEndEr, assEts and loCation
44
DFID(DepartmentforInternationalDevelopment),2001,Poverty: bridging the gap,Guidancenotes,London
Dibley,M.J.,Goldsby,J.B.,Staehling,N.W.andTrowbridge,F.L.,1987,‘Developmentofnormalizedcurvesfortheinternationalgrowthreference:historicalandtechnicalconsiderations’,American Journal of Clinical Nutrition,46:736-48
EthiopianPublicHealthAssociation(EPHA),1996,Symposium on Food and Policy Issues in Ethiopia,EthiopianPublicHealthAssociation7thAnnualConference,AddisAbaba
Ethio-SwedishPaediatricClinic(ESPC),1971,Nutrition Rehabilitation in Ethiopia: Suggestion for the Organisation and running of a Day Care Rehabilitation Care Centre,AddisAbaba:DepartmentofPaediatricsAddisAbabaUniversity
Esrey,S.,Habicht,J-P.andCasella,G.,1992,‘ThecomplementaryeffectoflatrinesandincreasedwaterusageonthegrowthofinfantsinruralLesotho’,American Journal of Clinical Nutrition,135(6):659-666
Esrey,S.,1996,‘Water,wasteandwell-being:amulti-countrystudy’, American Journal of Clinical Nutrition,143(6):608-623
FoodandAgricultureOrganization(FAO),1992,World Declaration and Plan of Action for Nutrition,InternationalConferenceonNutrition,FAO,Rome
Farrington,J.,Carney,D.,Ashley,C.andTurton,C.,1999,‘Sustainablelivelihoodsinpractice:earlyapplicationsofconceptsinruralareas’,ODI Natural Resource Perspectives Paper42,London:ODI
Foster,A.,1995,‘Prices,creditmarketsandchildgrowthinlow-incomeruralareas’,Economic Journal,105:551-570
Gibson,J.,2001,‘Literacyandintra-householdexternalities,World Development,29:155-166
Girma,W.andGenebo,T.,2002,Determinants of nutritional status of women and children in Ethiopia, Calverton,Maryland:ORCMacro
Glewwe,P.,1999,‘Whydoesmother’sschoolingraisechildhealthindevelopingcountries?EvidencefromMorocco’,Journal of Human Resources,34(1):124-159
Glewwe,P.,Koch,S.andNguyen,B.L.,2002,Child nutrition, economic growth and the provision of healthcare services in Vietnam in the 1990s,February,Washington:WorldBank
Grantham-McGregor,S.,Walker,C.,Chang,S.andPowellC.,1997,‘EffectsofearlychildhoodsupplementationwithandwithoutstimulationonlaterdevelopmentinstuntedJamaicanchildren’,American Journal of Clinical Nutrition,66:247-53
Haddad,L.,Alderman,H.,Appleton,S.,Song,L.andYohannes,Y.,2003,‘Reducingchildmalnutrition:howfardoesincomegrowthtakeus?’World Bank Economic Review,vol.17,no.1,107-131
Haider,J.,Shapiro,B.I.,Demissie,T.andG/Wold,A.,nodate,The nutritional and health status of women and children in households with and without crossbred cows in Holetta Wereda,Mimeo,Ethiopia
Child nutritional status in poor Ethiopian housEholds: thE rolE of gEndEr, assEts and loCation
45
Hoddinott,J.andKinsey,B.,2001,‘Childgrowthinthetimeofdrought’,Oxford Bulletin of Economics and Statistics,409-436
Johnson-Welch,C.,Alemu,B.,Msaki,TheresiaPeter,Sengendo,M.,Kigutha,H.andWolff,A.2000,Improving Household Food Security: Institutions, Gender and Integrated Approaches,Washington:InternationalCentreforResearchonGender,BASIS,http://www.wisc.edu/ltc/basis
Kabeer,N.,2003,Gender mainstreaming in poverty eradication and the millennium development goals: a handbook for policy-makers and other stakeholders,Ottawa:CommonwealthSecretariatandInternationalDevelopmentResearchCentre
Kabutha,C.,1999,Importance of gender in agricultural policies, Resource, Access and Human Nutrition,PaperpresentedataseminaronAgriculturePolicy,ResourceAccessandNutritionalOutcomes,AddisAbaba
Kurz,K.M.andJohnson-Welch,C.,2000,Enhancing Nutrition Results: The Case for Women’s Approach,Washington:InternationalCentreforResearchOnWomen
Levin,C.E.,Long,J.,Simler,K.L.,Johnson-Welch,C.,2003,Cultivating Nutrition: A Survey of Viewpoints on Integrating Agriculture and Nutrition,FoodConsumptionandNutritionDivision,Washington:InternationalFoodPolicyResearchInstitute
Macfarlane,S.B.,1996,‘TherelationshipbetweenanthropometricindicesderivedfromtheCDC/WHOinternationalreference’,Annals of Human Biology:23(6):421-30
Majale,M.,2002,Towards pro-poor regulatory guidelines for urban upgrading. A review of papers presented at the international workshop on regulatory guidelines for urban upgrading,RetrievedfromURLwww.itdg.org/html/shelter/docs/rguu_paper02.doc
Martorell,R.,1999,‘Thenatureofchildmalnutritionanditslong termimplications’,Food and Nutrition Bulletin,20:288-292
Martorell,R.,Khan,L.K.andSchroeder,D.G.,1994,‘Reversibilityofstunting:epidemiologicalfindingsinchildrenfromdevelopingcountries’,European Journal of Clinical Nutrition: 48Suppl.1:S45-57
Moen,A.A.,1993,The impact of child and maternal survival programmes on socio-economic development,CenterforEconomicResearchonAfrica,SchoolofBusiness,MontclairStateUniversity,UpperMontclair,NewJersey
MoFED(MinistryofFinanceandEconomicDevelopment),2002a,Development and poverty profile of Ethiopia,WelfareMonitoringUnit,March,AddisAbaba
MoFED(MinistryofFinanceandEconomicDevelopment),2002b,Ethiopia: sustainable development and poverty reduction programme,WelfareMonitoringUnit,July,AddisAbaba
MoH(MinistryofHealth),2002,Health Sector Development Phase II,AddisAbaba
___________,2004,National Strategy for Infant and Young Children,AddisAbaba
MoRD(MinistryofRuralDevelopment),2003,New Coalition for Food Security in Ethiopia,AddisAbaba
Child nutritional status in poor Ethiopian housEholds: thE rolE of gEndEr, assEts and loCation
46
Pal,S.,1999,‘AnanalysisofchildhoodmalnutritioninruralIndia:roleofgender,incomeandotherhouseholdcharacteristics’,World Development,27(7):1151-1171
Pelletier,D.L.,1994,‘Therelationshipbetweenchildanthropometryandmortalityindevelopingcountries:implicationsforpolicy,programmesandfutureresearch’,Journal of Nutrition,124:2047s-81s
Quisumbing,A.,2003,‘FoodaidandchildnutritioninruralEthiopia’,World Development,Vol.31,no.7,1309-1324
Riley,B.M.,2000,Food Security in Ethiopia: A case study comparing the Food Security Framework of the Ethiopian Government,TheEuropeanCommissionandtheUSAgencyforInternationalDevelopment,unpublished
Roberts,J.,2003,‘Povertyreductionoutcomesineducationandhealth:publicexpenditureandaid’,London:OverseasDevelopmentInstitute,Working Paper210
Sahn,D.E.andStifelD.C.,2002,‘Parentalpreferencesfornutritionofboysandgirls:evidencefromAfrica’,Journal of Development Studies,vol.39,no.1,21-45
SC(UK)Ethiopia,2002,Wealth, health and knowledge: determinants of malnutrition in North Wollo,AddisAbaba:SC(UK)Ethiopia
SC(UK),2003,Thin on the ground: questioning the evidence behind World Bank-funded community nutrition projects in Bangladesh, Ethiopia and Uganda,London:SavetheChildrenUK
Shanghvi,T.andMurray,J.,1997,Improving child health through nutrition: the nutrition Minimum Package,BasicSupportforInstitutionalizingChildSurvival(BASICS)ProjectfortheU.S.AgencyforInternationalDevelopment,Arlington.Va.
Skoufias,E.,1998,‘DeterminantsofchildhealthduringtheeconomictransitioninRomania’,World Development,26(11):2045-2056
Smith,L.C.andHaddad,L.,2000,‘Overcomingchildmalnutritionindevelopingcountries:pastachievementsandfuturechoices’,Discussion Paper30,Washington:InternationalFoodPolicyResearchInstitute
Svedberg,P.,1990,‘UndernutritioninSub-SaharanAfrica:isthereagenderbias?’Journal of Development Studies,26:469-486
Thomas,D.andStrauss,J.,1992,‘Prices,infrastructure,householdcharacteristicsandchildheight’,Journal of Development Economics,Vol.39,no.2,301-331
UNDP,1997,Sustainable livelihoods approach: concept paper,Mimeo
———,2002,Human Development Report,NewYork:OxfordUniversityPress
UNICEF,1990,Strategy for improved nutrition of children and women in developing countries,NewYork:UNICEF
———,1994,1994-1999 Country Programme of Co-operation between The Government of Ethiopia and UNICEF: Master Plan of Operation for Basic services for Children and Women,AddisAbaba:UNICEF
———,1998,The state of the world’s children, NewYork:UNICEF
Child nutritional status in poor Ethiopian housEholds: thE rolE of gEndEr, assEts and loCation
4�
USAID,2003,‘Ethiopia:Drought,BureauforDemocracy,ConflictandHumanitarianAssistance’,Fact Sheet #1,USAgencyforOfficeofUSForeignDisasterAssistance(OFDA),FiscalYear2003
Wagstaff,A.andWatanabe,N.,2000,Socioeconomic inequalities in child malnutrition in the developing world,Washington:WorldBank
Webb,P.andLapping,K.,2002,Are Determinants of Malnutrition the same as for Food Insecurity? Recent Findings for 6 Developing Countries on Interaction between Food and Nutrition,DiscussionPaperNo.6,FoodPolicyandAppliedNutritionProgramme,TheGeraldJ.andDorothyR.SchoolofNutritionScienceandPolicy,TuftsUniversity,USA
WHO,1985,‘Energyandproteinrequirements’,ReportofaJointFAO/WHO/UNUExpertConsultation,Technical Report Seriesno.724,Geneva:WorldHealthOrganization
WHO,1995,‘Physicalstatus:theuseandinterpretationofanthropometry’,Technical Report Seriesno.854,Geneva:WorldHealthOrganisation
Woldehanna,T,Mekonnen,A.,Seager,J.Alemu,T.,Asgedom,G.,Tefera,B.andJones,N.(2005)‘EducationChoicesinEthiopia:Whatdetermineswhetherpoorhouseholdssendtheirchildrentoschool?’Young Lives Working Paper 15,London:YoungLives
WorldBank,1993,World Development Report: investing in health.NewYork:OxfordUniversityPress
WorldBank,2004,World Development Report,NewYork:OxfordUniversityPress
Yamano,T.,Alderman,H.,andChristiaensen,L.,2003,Childgrowth,shocks,andfoodaidinruralEthiopia,World Bank Policy Research Working Paper WPS 3128
Yaqub,S.,2002,‘Poorchildrengrowintopooradults’:harmfulmechanismsorover-deterministictheory?’Journal of International Development,14:1081–1093

The Young Lives Partners Centre for Economic and Social Studies (CESS), India
Department of Economics, University of Addis Ababa, Ethiopia
Ethiopian Development Research Institute, Addis Ababa, Ethiopia
General Statistical Office, Government of Vietnam
Grupo de Análisis Para El Desarrollo (GRADE), Peru
Institute of Development Studies, University of Sussex, UK
Instituto de Investigación Nutricional (IIN), Peru
London School of Hygiene and Tropical Medicine, UK
Medical Research Council of South Africa
Queen Elizabeth House, University of Oxford
RAU University, Johannesburg, South Africa
Research and Training Centre for Community Development, Vietnam
Save the Children UK
South Bank University, UK
Statistical Services Centre, University of Reading, UK
W O R K I N G P A P E R N O . 2 6
ChIld NutRItIONAl stAtus IN POOR EthIOPIAN hOusEhOlds:
the role of gender, assets and locationAlemu MekonnenBekele teferatassew WoldehannaNicola JonesJohn seagertekie AlemuGetachew Asgedom
As one of the poorest countries in the world, Ethiopia’s rate of child malnutrition is one of the highest, even within sub‑Sahara Africa. The causes and relative importance of various determinants of malnutrition in Ethiopia are not well understood. This paper specifically explores some of the less obvious factors affecting children’s nutritional status in Ethiopia. It is based on information collected in 2002 from 1001 households with eight‑year‑old children mainly from food insecure communities in Tigray, Amhara, Oromia, SNNP and Addis Ababa Regional States. As part of the Young Lives Project, this study is particularly important because the determinants of the nutritional status of eight‑year‑old children is much less researched than that of younger children, not only in Ethiopia but in other developing countries.
The results from simple correlation analysis indicated that a number of variables were significantly related to weight‑for‑height z‑score (WHZ) (as an indicator of wasting). In addition to analysing WHZ for the whole sample, we have also separately analysed WHZ for urban and rural households, and found that the determinants differed.
The results show that weight‑for‑height z‑scores depend on the sex of the child and suggest that short‑term malnutrition is higher for male children than for female children. We conclude that variables such as physical and natural capital (wealth index, ownership of radio, television and land), human capital (education of members of the household), social capital (strength of a caregivers’ ties to social organizations and networks), age‑sex composition of households (the number of girls, the number of female adults) and location of residence (rural or urban) are important in influencing WHZ in eight‑year‑olds.
We conclude that addressing child malnutrition, especially WHZ, requires a multi‑dimensional approach that takes into account food security, public health and gendered intra‑household dynamics if it is to be effective. Moreover, a cross‑sectoral nutrition policy is needed to improve policy synergies.
Published by
Young lives save the Children uK 1 st John's lane london EC1M 4AR
tel: 44 (0) 20 7012 6796 Fax: 44 (0) 20 7012 6963 Web: www.younglives.org.uk
IsBN 1-904427-27-8 First Published: 2005
All rights reserved. this publication is copyright, but may be reproduced by any method without fee or prior permission for teaching purposes, though not for resale, providing the usual acknowledgement of source is recognised in terms of citation. For copying in other circumstances, prior written permission must be obtained from the publisher and a fee may be payable.
designed and typeset by Copyprint uK limited
Young Lives is an international longitudinal study of childhood poverty, taking place in Ethiopia, India, Peru and Vietnam, and funded by DFID. The project aims to improve our understanding of the causes and consequences of childhood poverty in the developing world by following the lives of a group of 8,000 children and their families over a 15-year period. Through the involvement of academic, government and NGO partners in the aforementioned countries, South Africa and the UK, the Young Lives project will highlight ways in which policy can be improved to more effectively tackle child poverty.