Embed Size (px)
Citation preview
11/15/2011
1
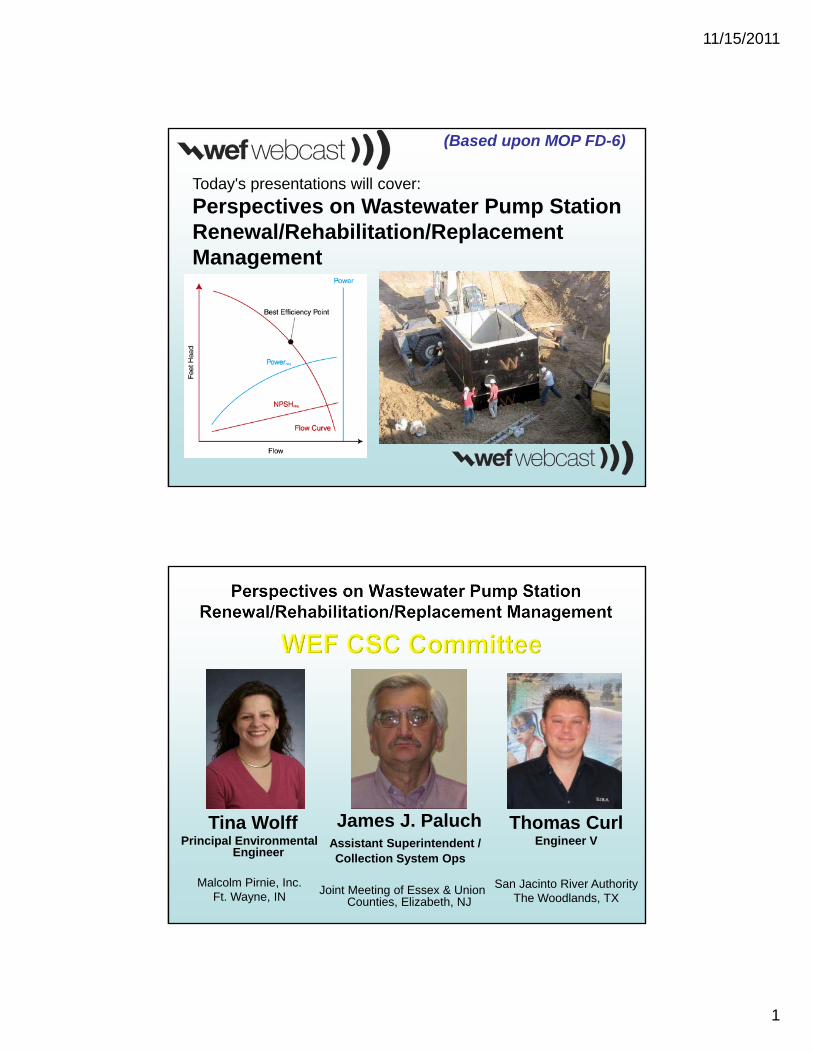
Today's presentations will cover:
Perspectives on Wastewater Pump Station Renewal/Rehabilitation/Replacement Management
(Based upon MOP FD-6)
James J. PaluchAssistant Superintendent /Collection System Ops
Joint Meeting of Essex & Union Counties, Elizabeth, NJ
Tina WolffPrincipal Environmental
Engineer
Malcolm Pirnie, Inc.Ft. Wayne, IN
Thomas CurlEngineer V
San Jacinto River AuthorityThe Woodlands, TX
11/15/2011
2
Perspectives on Wastewater Pump Station Renewal/Rehabilitation/Replacement Management
Webcast Sub-Committee Members
• Abraham Araya – Seattle, Washington• Samantha Bartow – Taylor, South Carolina• Thomas Curl – The Woodlands, Texas• Mattie A. Engels – Dallas, Texas• Wes Frye – Nashville, Tennessee• Chris Johnston – Burnaby, British Columbia• Stephen A. Lipinski – Duluth, Minnesota• John Nelson, Pewaukee, Wisconsin• James J. Paluch – Elizabeth, New Jersey• Tina Wolff – Fort Wayne, Indiana
Existing Sewer Evaluation and Rehabilitation
• WEF Manual of Practice FD-6
• ASCE Manuals and Reports on Engineering Practice No. 62
• 2009, Third Edition
11/15/2011
3
Chapter 6 –Selection of Sewer Rehabilitation
Methods and Materials
• OVERALL CONTENTS• Introduction & Overview
• Rehabilitation Types, Materials, Methods
• Pipeline Repair, Renewal, Replacement (RRR)
• Appurtenance RRR (Manholes, Service Laterals, Pump Stations)
• The Selection Process
• Quality Assurance / Quality Control
The A,B,C’s Series Continues
• November 2010: Perspectives on Pipeline Replacement
• February 2011: Manhole Repair, Renew, Replace
• June 2011: Service Connection / Sewer Lateral Repair, Renew, Replace
• November 2011:Perspectives on Wastewater Pump Station Renewal/Rehabilitation/Replacement Management – Series Webcast (4 of 4)
11/15/2011
4
• Rehabilitation – repair, renewal, replacement – is a constant part of sewer management
• Financial limitations are forcing us to “do more with less”
• The refining of traditional procedures and the development of new concepts are required
• Proper and efficient identification of lift station issues is key
• A systematic approach to lift station diagnosis increases likelihood for successes
• An asset maintenance program is needed to maximize lifespan and control cost
• There is a need to understand the reliability of an asset
• Replacement can be an opportunity to increase functionality

11/15/2011
5
• Joe Jacobs, PE
- Troubleshooting
- Systematic Approach
- The Next Step
• Dave Jurgens, C.M.R.P.
- Importance of Maintenance
- Understanding ‘Reliability’
- RTF – Run to Failure
11/15/2011
6
• Howard Smith, P.E.
- Alternative Rehab Concept
- Benefits & Considerations
- Lakeside Storage Facility
Troubleshootingfor
Wastewater Pumping Systems
Joe Jacobs, PEMalcolm Pirnie, The Water Division of ARCADIS
It’s broke, now what do I do?
November 16, 2011
T h e W a t e r D i v i s i o n o f A R C A D I S
11/15/2011
7
• There are many possible causes for pumping system problems and identifying the cause can be time consuming and often very frustrating!
• A systematic approach with field pumping tests is necessary to eliminate potential causes and to identify the most likely cause
• Understanding the original basis of design can be an important tool to aid with the identification of anomalies in the pumping system
• Most problems are Not problems with the pump, but with the pumping system itself
Pump Station Troubleshooting
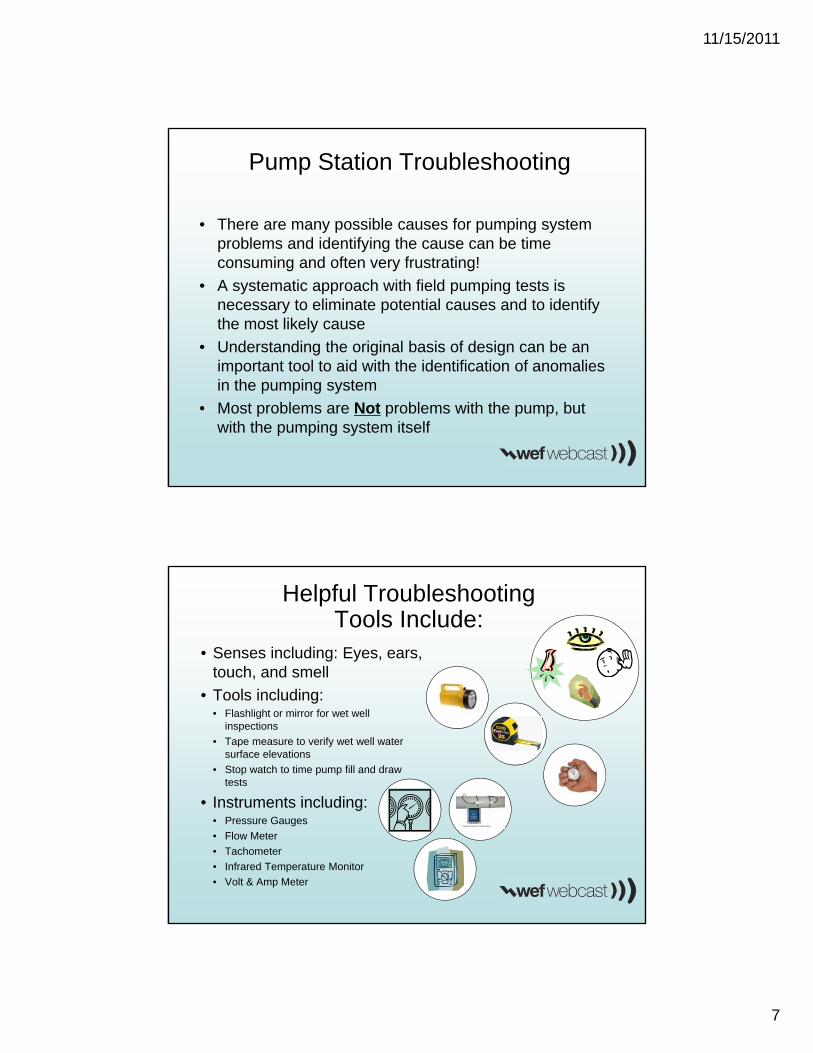
• Senses including: Eyes, ears, touch, and smell
• Tools including:• Flashlight or mirror for wet well
inspections
• Tape measure to verify wet well water surface elevations
• Stop watch to time pump fill and draw tests
• Instruments including:• Pressure Gauges
• Flow Meter
• Tachometer
• Infrared Temperature Monitor
• Volt & Amp Meter
Helpful Troubleshooting Tools Include:
11/15/2011
8
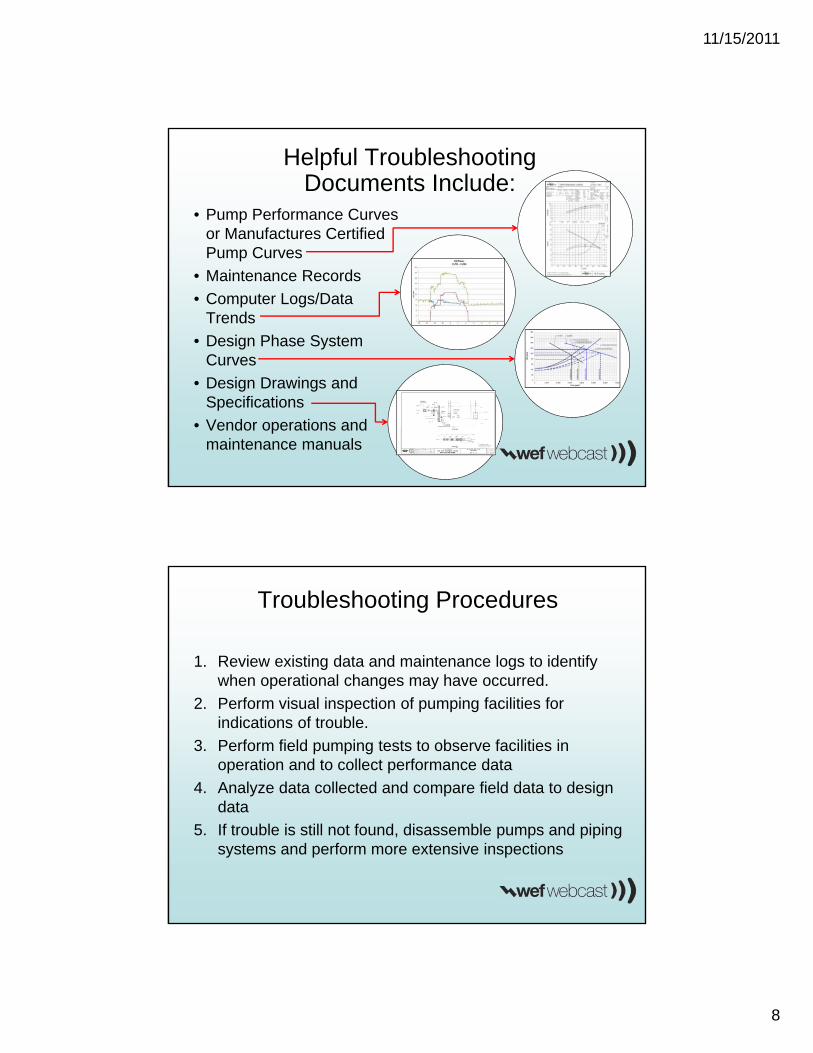
• Pump Performance Curves or Manufactures Certified Pump Curves
• Maintenance Records
• Computer Logs/Data Trends
• Design Phase System Curves
• Design Drawings and Specifications
• Vendor operations and maintenance manuals
Helpful Troubleshooting Documents Include:
Troubleshooting Procedures
1. Review existing data and maintenance logs to identify when operational changes may have occurred.
2. Perform visual inspection of pumping facilities for indications of trouble.
3. Perform field pumping tests to observe facilities in operation and to collect performance data
4. Analyze data collected and compare field data to design data
5. If trouble is still not found, disassemble pumps and piping systems and perform more extensive inspections
11/15/2011
9
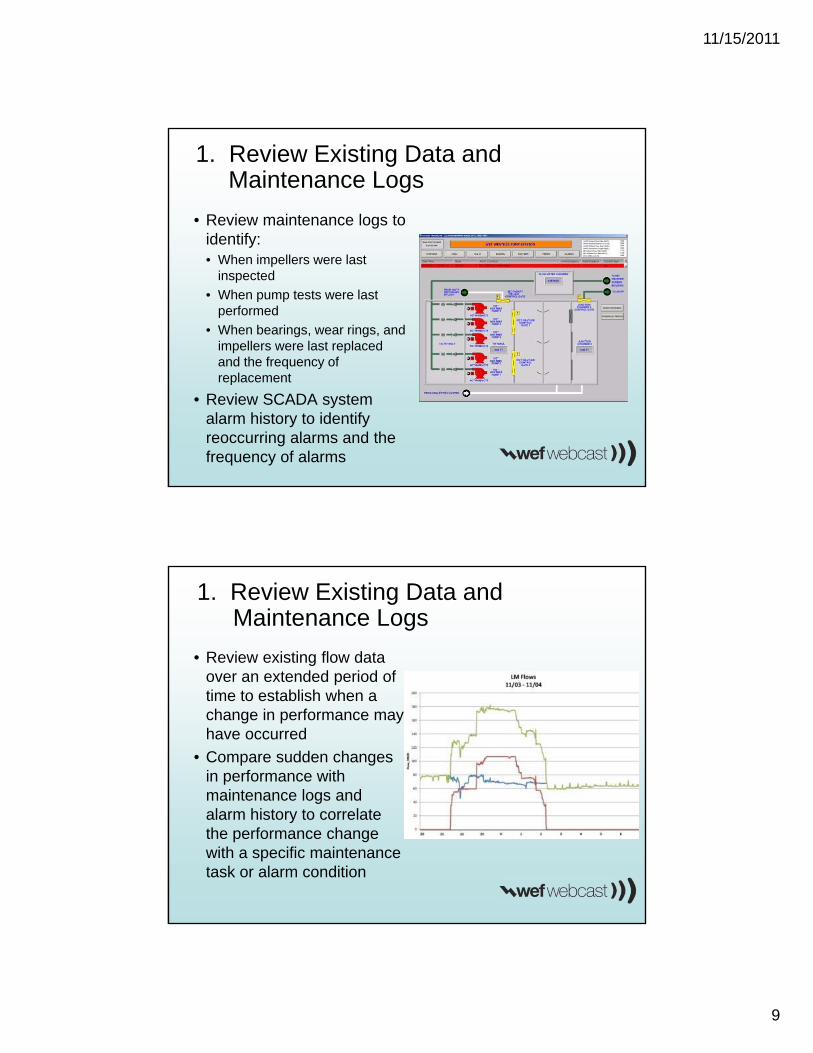
1. Review Existing Data and Maintenance Logs
• Review maintenance logs to identify:• When impellers were last
inspected
• When pump tests were last performed
• When bearings, wear rings, and impellers were last replaced and the frequency of replacement
• Review SCADA system alarm history to identify reoccurring alarms and the frequency of alarms
1. Review Existing Data and Maintenance Logs
• Review existing flow data over an extended period of time to establish when a change in performance may have occurred
• Compare sudden changes in performance with maintenance logs and alarm history to correlate the performance change with a specific maintenance task or alarm condition
11/15/2011
10
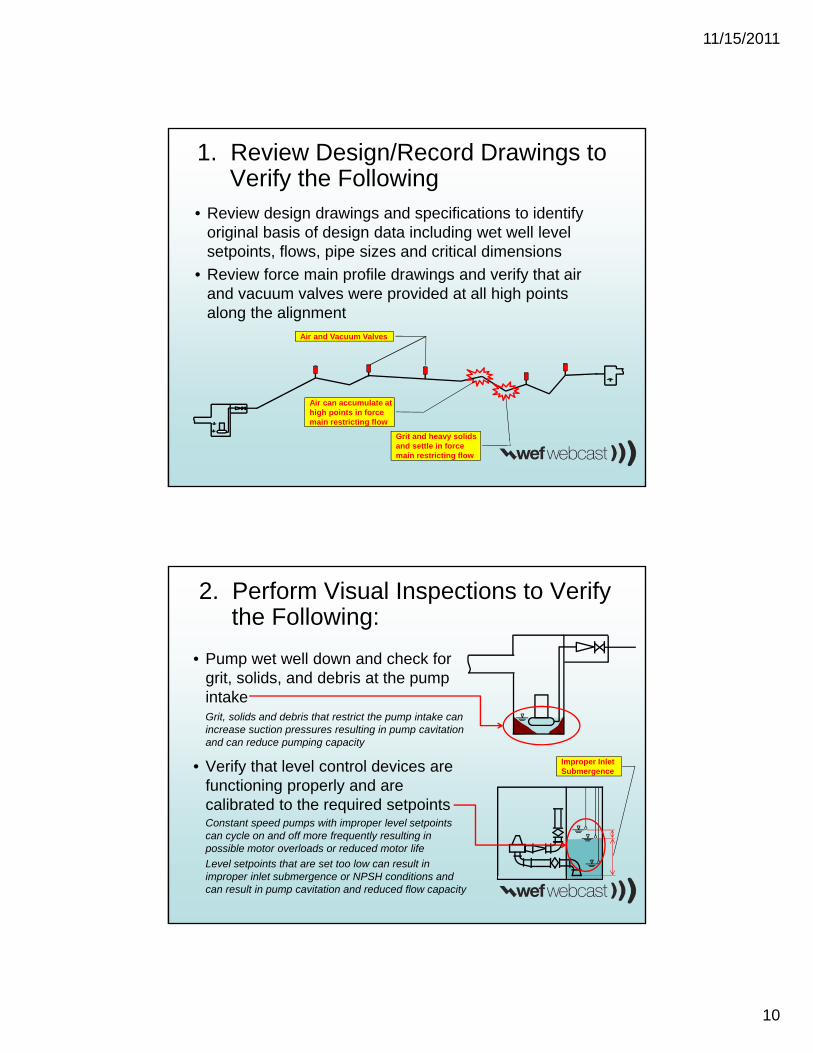
1. Review Design/Record Drawings to Verify the Following
• Review design drawings and specifications to identify original basis of design data including wet well level setpoints, flows, pipe sizes and critical dimensions
• Review force main profile drawings and verify that air and vacuum valves were provided at all high points along the alignment
Air can accumulate at high points in force main restricting flow
Grit and heavy solids and settle in force main restricting flow
Air and Vacuum Valves
2. Perform Visual Inspections to Verify the Following:
• Pump wet well down and check for grit, solids, and debris at the pump intakeGrit, solids and debris that restrict the pump intake can increase suction pressures resulting in pump cavitation and can reduce pumping capacity
• Verify that level control devices are functioning properly and are calibrated to the required setpointsConstant speed pumps with improper level setpoints can cycle on and off more frequently resulting in possible motor overloads or reduced motor life
Level setpoints that are set too low can result in improper inlet submergence or NPSH conditions and can result in pump cavitation and reduced flow capacity
Improper Inlet Submergence
11/15/2011
11
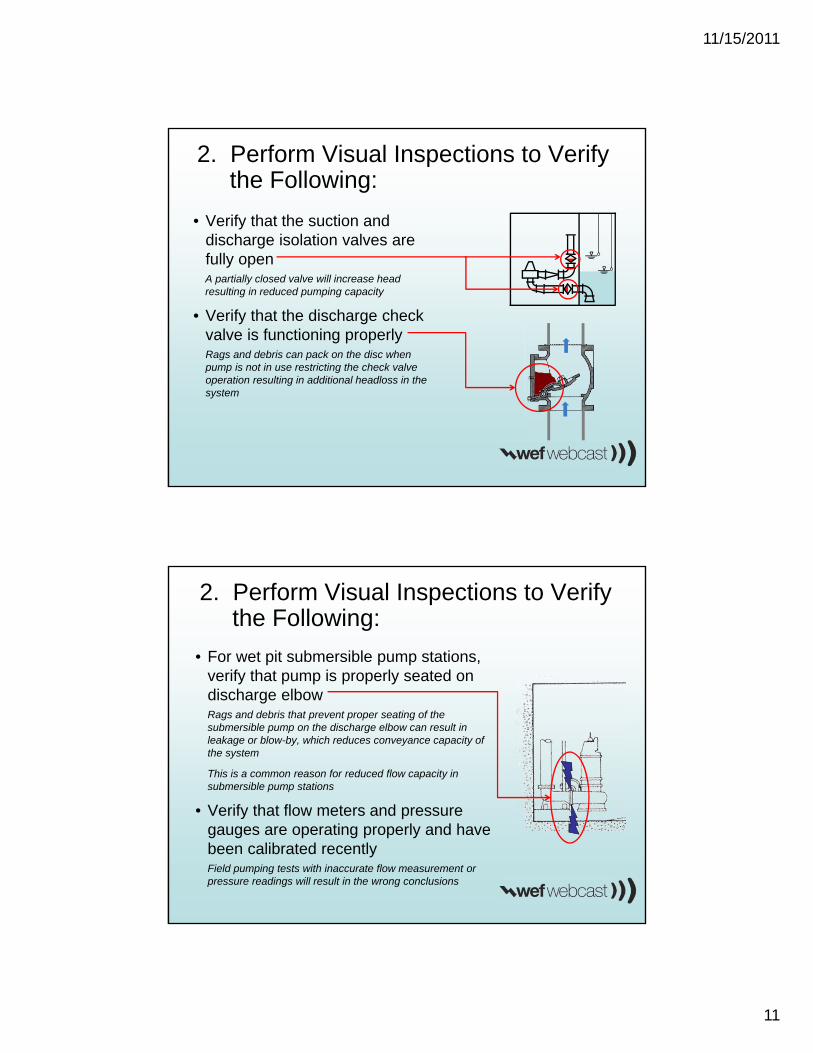
2. Perform Visual Inspections to Verify the Following:
• Verify that the suction and discharge isolation valves are fully openA partially closed valve will increase head resulting in reduced pumping capacity
• Verify that the discharge check valve is functioning properlyRags and debris can pack on the disc when pump is not in use restricting the check valve operation resulting in additional headloss in the system
• For wet pit submersible pump stations, verify that pump is properly seated on discharge elbowRags and debris that prevent proper seating of the submersible pump on the discharge elbow can result in leakage or blow-by, which reduces conveyance capacity of the system
This is a common reason for reduced flow capacity in submersible pump stations
• Verify that flow meters and pressure gauges are operating properly and have been calibrated recentlyField pumping tests with inaccurate flow measurement or pressure readings will result in the wrong conclusions
2. Perform Visual Inspections to Verify the Following:
11/15/2011
12
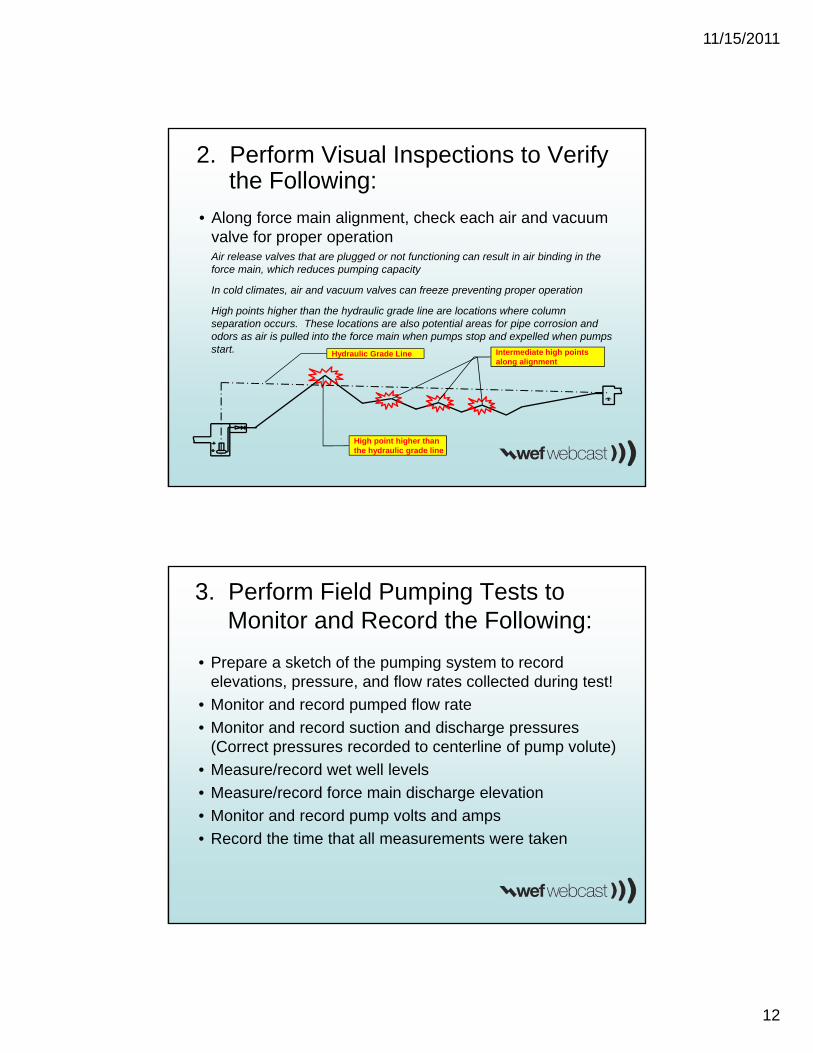
• Along force main alignment, check each air and vacuum valve for proper operationAir release valves that are plugged or not functioning can result in air binding in the force main, which reduces pumping capacity
In cold climates, air and vacuum valves can freeze preventing proper operation
High points higher than the hydraulic grade line are locations where column separation occurs. These locations are also potential areas for pipe corrosion and odors as air is pulled into the force main when pumps stop and expelled when pumps start.
High point higher than the hydraulic grade line
Intermediate high points along alignment
2. Perform Visual Inspections to Verify the Following:
Hydraulic Grade Line
• Prepare a sketch of the pumping system to record elevations, pressure, and flow rates collected during test!
• Monitor and record pumped flow rate
• Monitor and record suction and discharge pressures (Correct pressures recorded to centerline of pump volute)
• Measure/record wet well levels
• Measure/record force main discharge elevation
• Monitor and record pump volts and amps
• Record the time that all measurements were taken
3. Perform Field Pumping Tests to Monitor and Record the Following:
11/15/2011
13
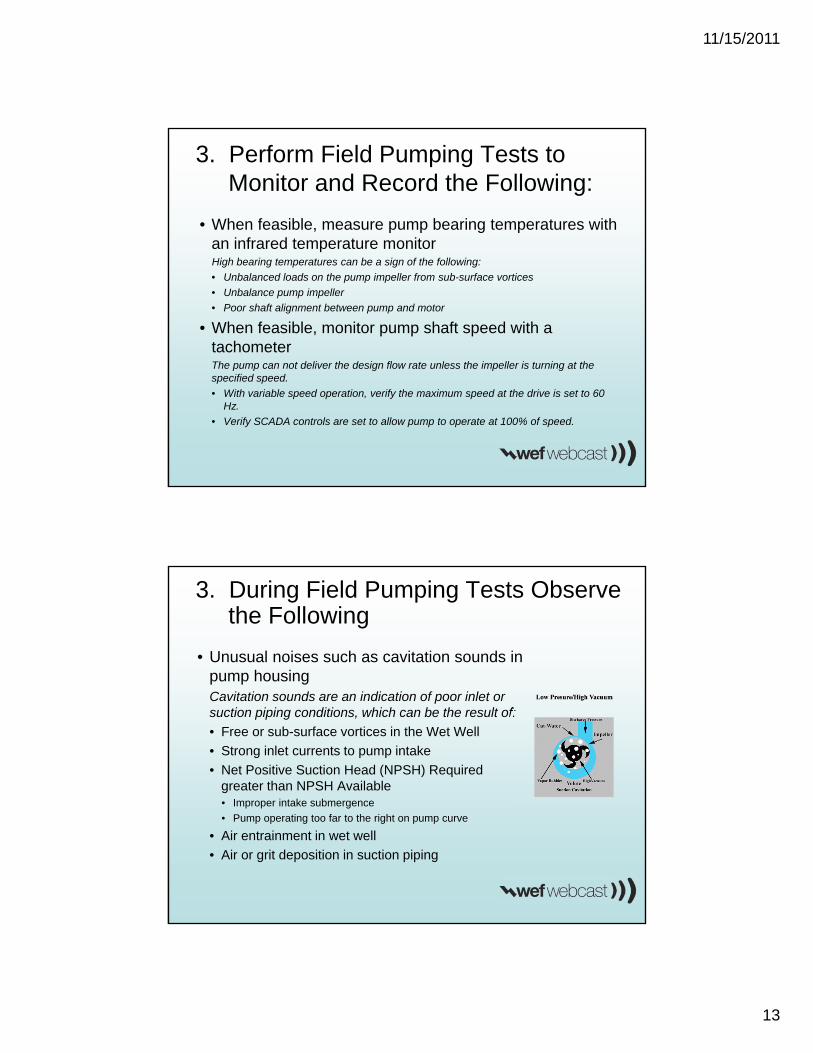
• When feasible, measure pump bearing temperatures with an infrared temperature monitorHigh bearing temperatures can be a sign of the following:
• Unbalanced loads on the pump impeller from sub-surface vortices
• Unbalance pump impeller
• Poor shaft alignment between pump and motor
• When feasible, monitor pump shaft speed with a tachometerThe pump can not deliver the design flow rate unless the impeller is turning at the specified speed.
• With variable speed operation, verify the maximum speed at the drive is set to 60 Hz.
• Verify SCADA controls are set to allow pump to operate at 100% of speed.
3. Perform Field Pumping Tests to Monitor and Record the Following:
3. During Field Pumping Tests Observe the Following
• Unusual noises such as cavitation sounds in pump housingCavitation sounds are an indication of poor inlet or suction piping conditions, which can be the result of:
• Free or sub-surface vortices in the Wet Well
• Strong inlet currents to pump intake
• Net Positive Suction Head (NPSH) Required greater than NPSH Available• Improper intake submergence
• Pump operating too far to the right on pump curve
• Air entrainment in wet well
• Air or grit deposition in suction piping
11/15/2011
14
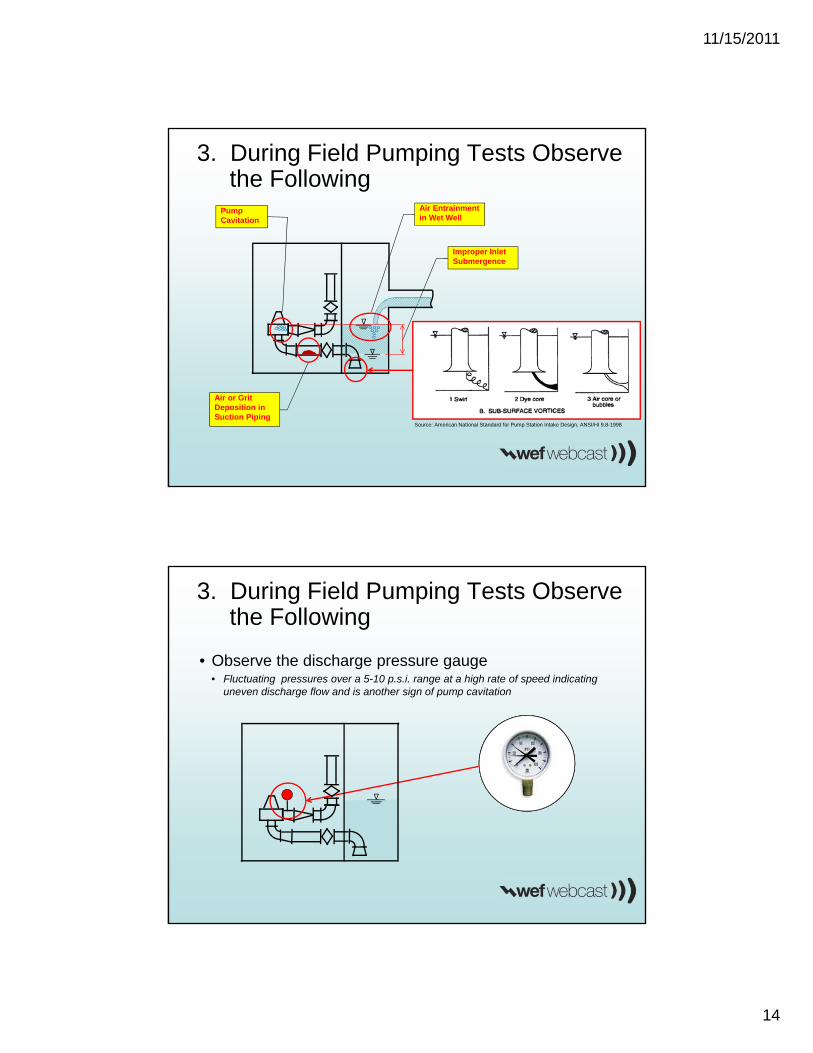
3. During Field Pumping Tests Observe the Following
Air Entrainment in Wet Well
Improper Inlet Submergence
Pump Cavitation
Air or Grit Deposition in Suction Piping
Source: American National Standard for Pump Station Intake Design, ANSI/HI 9.8-1998
• Observe the discharge pressure gauge• Fluctuating pressures over a 5-10 p.s.i. range at a high rate of speed indicating
uneven discharge flow and is another sign of pump cavitation
3. During Field Pumping Tests Observe the Following
11/15/2011
15
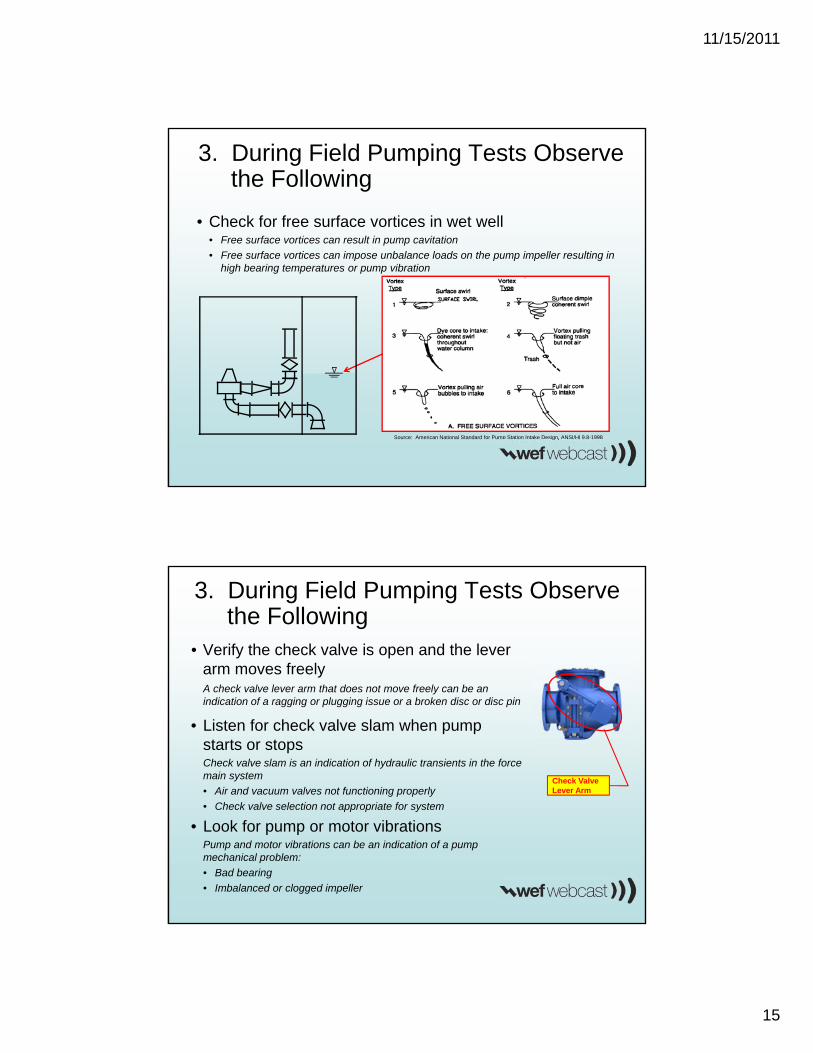
• Check for free surface vortices in wet well• Free surface vortices can result in pump cavitation
• Free surface vortices can impose unbalance loads on the pump impeller resulting in high bearing temperatures or pump vibration
3. During Field Pumping Tests Observe the Following
Source: American National Standard for Pump Station Intake Design, ANSI/HI 9.8-1998
• Verify the check valve is open and the lever arm moves freelyA check valve lever arm that does not move freely can be an indication of a ragging or plugging issue or a broken disc or disc pin
• Listen for check valve slam when pump starts or stopsCheck valve slam is an indication of hydraulic transients in the force main system
• Air and vacuum valves not functioning properly
• Check valve selection not appropriate for system
• Look for pump or motor vibrationsPump and motor vibrations can be an indication of a pump mechanical problem:
• Bad bearing
• Imbalanced or clogged impeller
Check Valve Lever Arm
3. During Field Pumping Tests Observe the Following
11/15/2011
16
Pump Station Troubleshooting
I can’t find anything wrong!Now what do I do?
4. Analyze Data Collected to Verify the Following
• Based on recorded flow rates and force main size, calculate operating force main velocities• Velocities should be greater than 2.0 ft/s to minimize solids and
grit deposition
• Velocities should exceed 3.0 to 4.0 ft/s daily to resuspend settled solids and grit
• Velocities greater than 7.0 ft/s result in excessive head/power requirements and can result in high surge pressures that cause check valve slam and hydraulic transients in the system
• Compare amp draw readings to nameplate data• High amp readings can be an indication of ragging or other
obstructions within the pump
11/15/2011
17
4. Analyze Data Collected to Verify the Following
• Calculate motor horsepower based on measured volts and amps and compare to expected horsepower from the manufacturers pump curve• Motor horsepower is true indication of work performed by pump
• Low motor horsepower indicates that pump is not doing work expected and could be due to several reasons including:• Submersible pump blow-by at discharge connection
• Worn pump impeller or wear rings
• Suction inlet problems and or cavitation
• Calculate the percent voltage imbalance between each motor lead or phase• A voltage imbalance (unequal voltages on a 3 phase power service) will cause the
motor to run hotter and could result in motor overloading and decreased motor life.
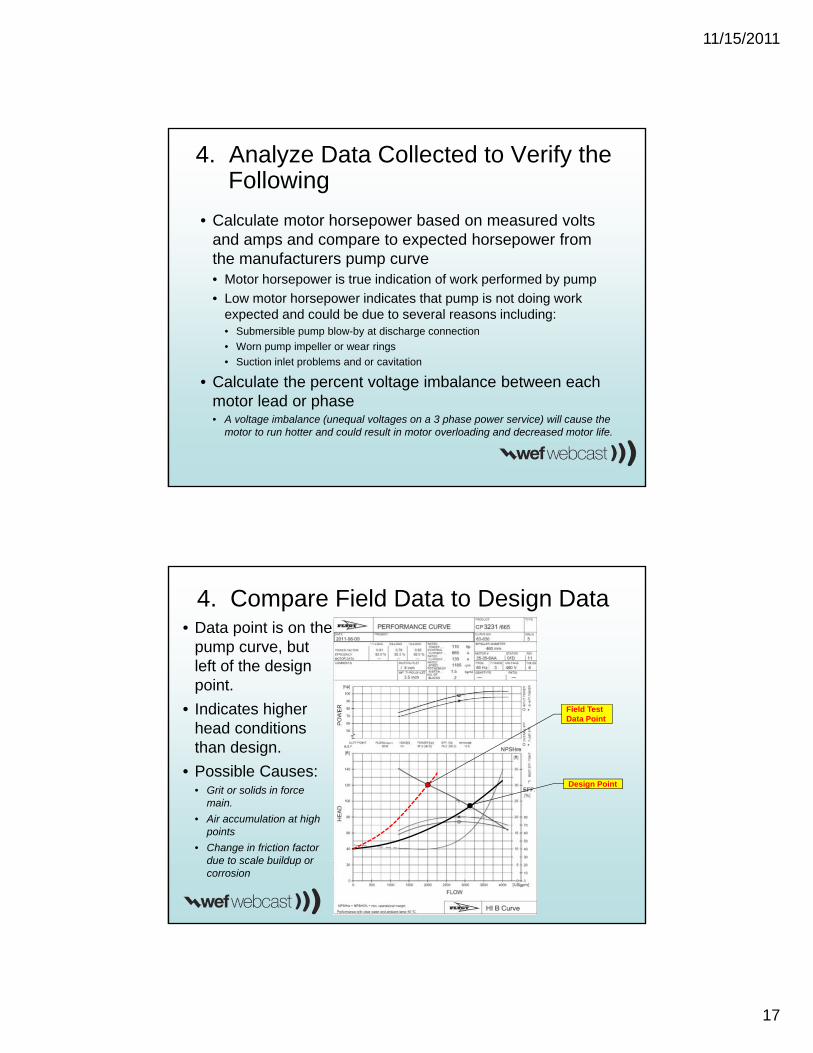
• Data point is on the pump curve, but left of the design point.
• Indicates higher head conditions than design.
• Possible Causes:• Grit or solids in force
main.
• Air accumulation at high points
• Change in friction factor due to scale buildup or corrosion
Design Point
Field Test Data Point
4. Compare Field Data to Design Data
11/15/2011
18
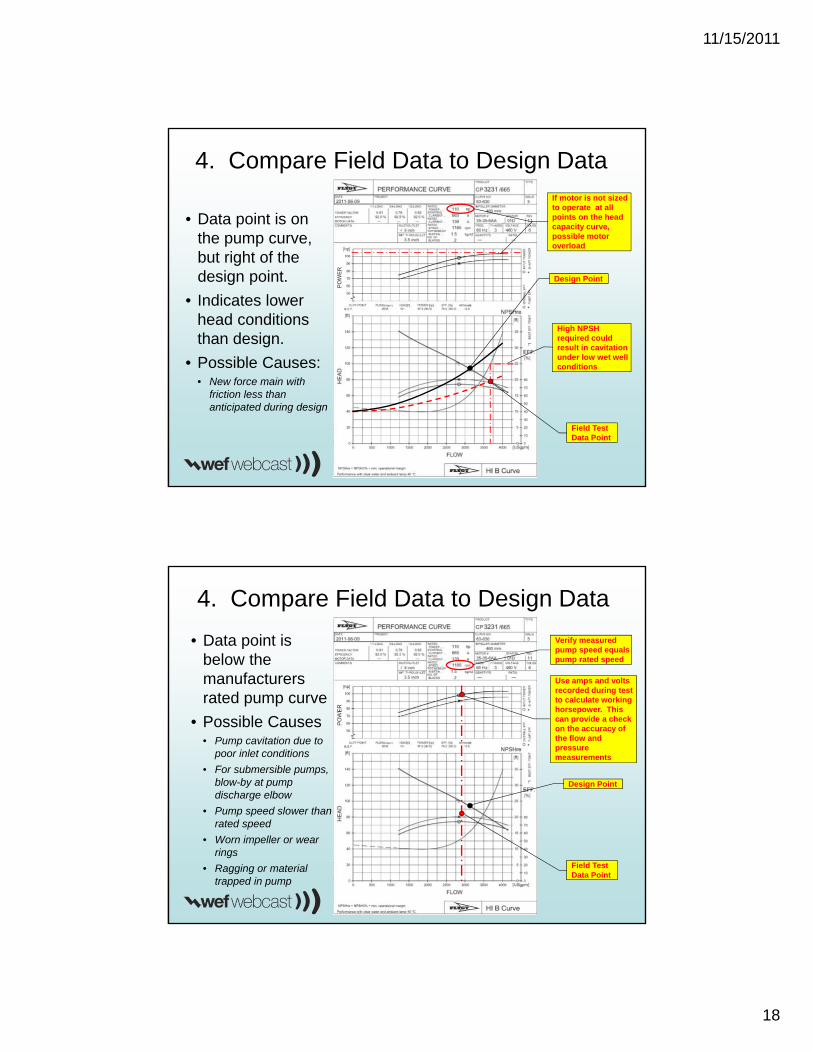
4. Compare Field Data to Design Data
• Data point is on the pump curve, but right of the design point.
• Indicates lower head conditions than design.
• Possible Causes:• New force main with
friction less than anticipated during design
Design Point
Field Test Data Point
If motor is not sized to operate at all points on the head capacity curve, possible motor overload
High NPSH required could result in cavitation under low wet well conditions
4. Compare Field Data to Design Data
• Data point is below the manufacturers rated pump curve
• Possible Causes• Pump cavitation due to
poor inlet conditions
• For submersible pumps, blow-by at pump discharge elbow
• Pump speed slower than rated speed
• Worn impeller or wear rings
• Ragging or material trapped in pump
Design Point
Field Test Data Point
Use amps and volts recorded during test to calculate working horsepower. This can provide a check on the accuracy of the flow and pressure measurements
Verify measured pump speed equals pump rated speed
11/15/2011
19
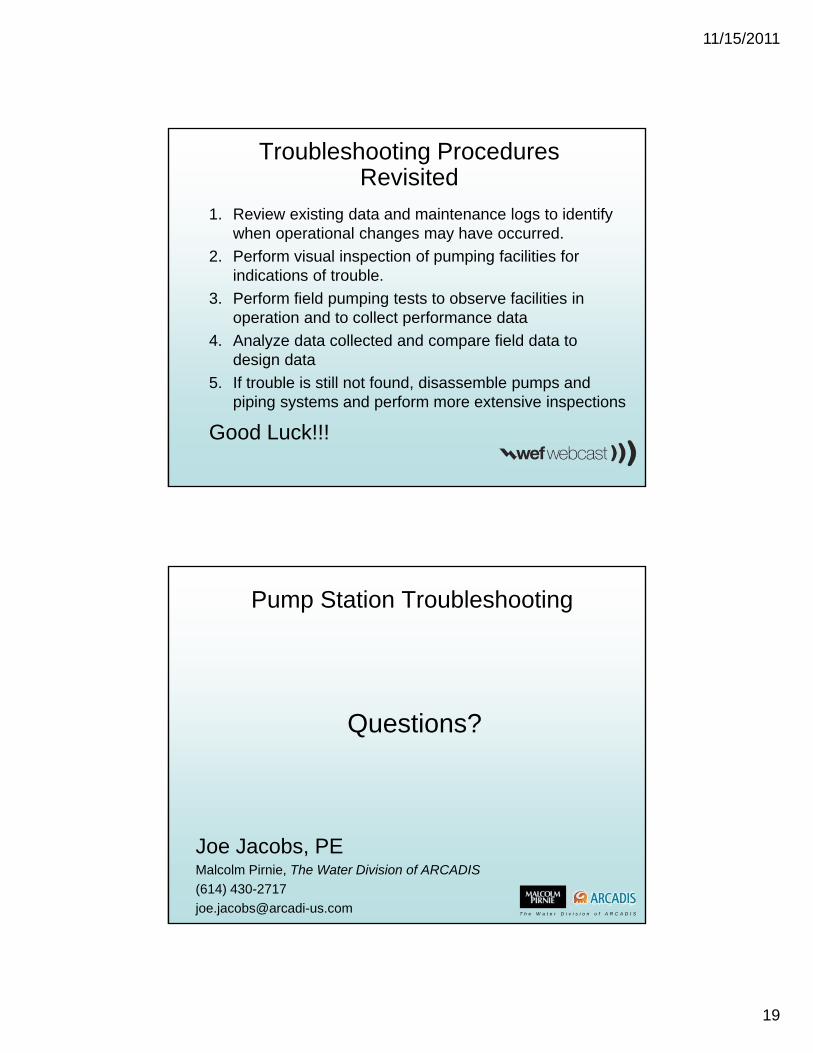
Troubleshooting Procedures Revisited
1. Review existing data and maintenance logs to identify when operational changes may have occurred.
2. Perform visual inspection of pumping facilities for indications of trouble.
3. Perform field pumping tests to observe facilities in operation and to collect performance data
4. Analyze data collected and compare field data to design data
5. If trouble is still not found, disassemble pumps and piping systems and perform more extensive inspections
Good Luck!!!
Questions?
Joe Jacobs, PEMalcolm Pirnie, The Water Division of ARCADIS
(614) 430-2717
Pump Station Troubleshooting
T h e W a t e r D i v i s i o n o f A R C A D I S
11/15/2011
20
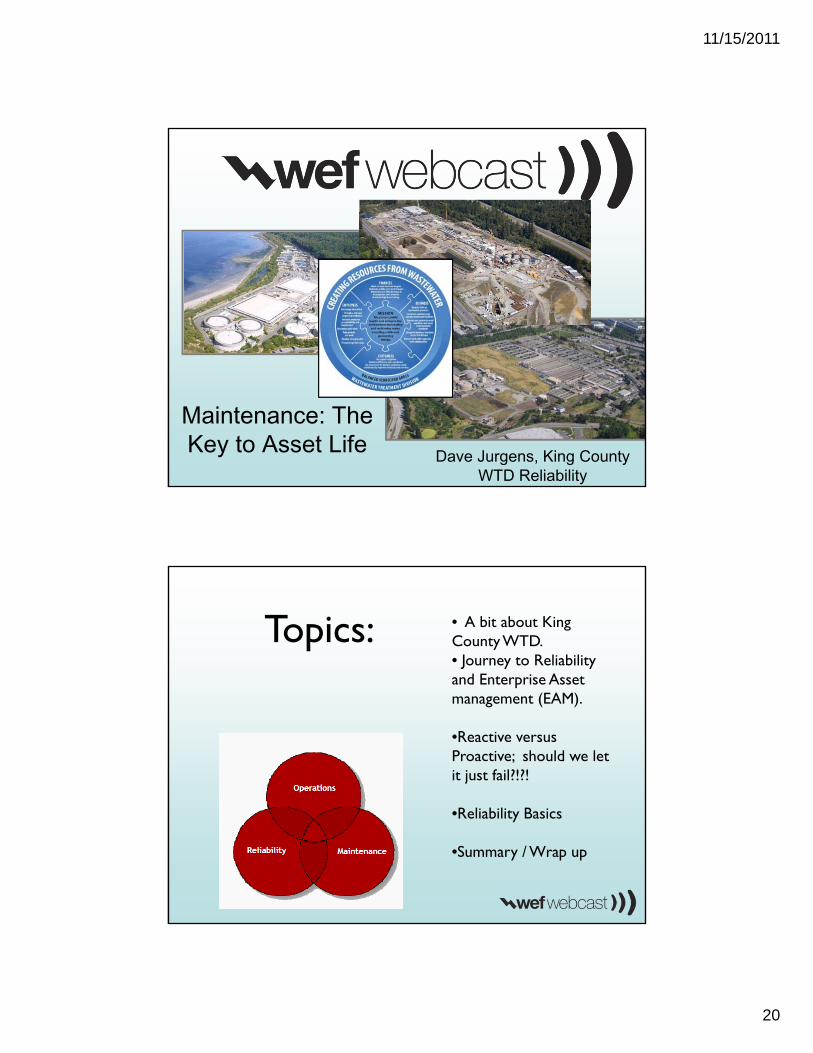
Maintenance: The Key to Asset Life
Presented by Dave Jurgens – KCWTP Reliability
Dave Jurgens, King County WTD Reliability
Topics: • A bit about King County WTD.• Journey to Reliability and Enterprise Asset management (EAM).
•Reactive versus Proactive; should we let it just fail?!?!
•Reliability Basics
•Summary / Wrap up
11/15/2011
21
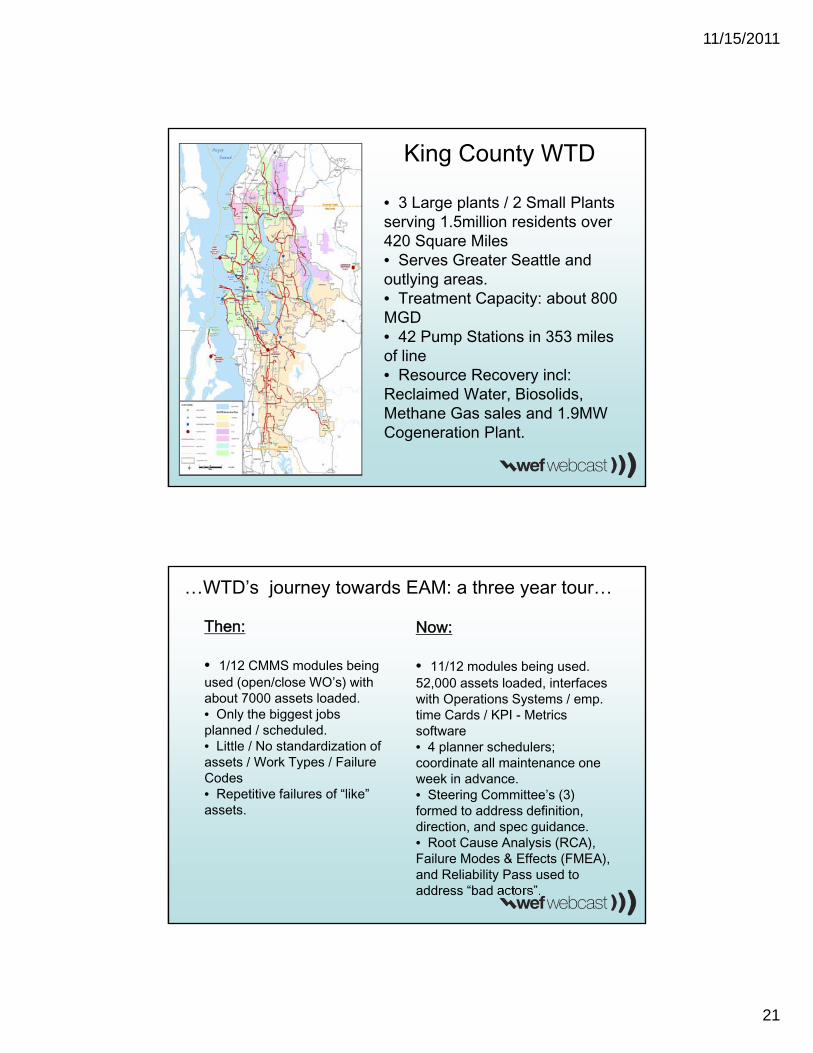
King County WTD
• 3 Large plants / 2 Small Plants serving 1.5million residents over 420 Square Miles• Serves Greater Seattle and outlying areas.• Treatment Capacity: about 800 MGD• 42 Pump Stations in 353 miles of line• Resource Recovery incl: Reclaimed Water, Biosolids, Methane Gas sales and 1.9MW Cogeneration Plant.
…WTD’s journey towards EAM: a three year tour…
Now:
• 11/12 modules being used. 52,000 assets loaded, interfaces with Operations Systems / emp. time Cards / KPI - Metrics software• 4 planner schedulers; coordinate all maintenance one week in advance.• Steering Committee’s (3) formed to address definition, direction, and spec guidance.• Root Cause Analysis (RCA), Failure Modes & Effects (FMEA), and Reliability Pass used to address “bad actors”.
Then:
• 1/12 CMMS modules being used (open/close WO’s) with about 7000 assets loaded.• Only the biggest jobs planned / scheduled.• Little / No standardization of assets / Work Types / Failure Codes• Repetitive failures of “like” assets.
11/15/2011
22
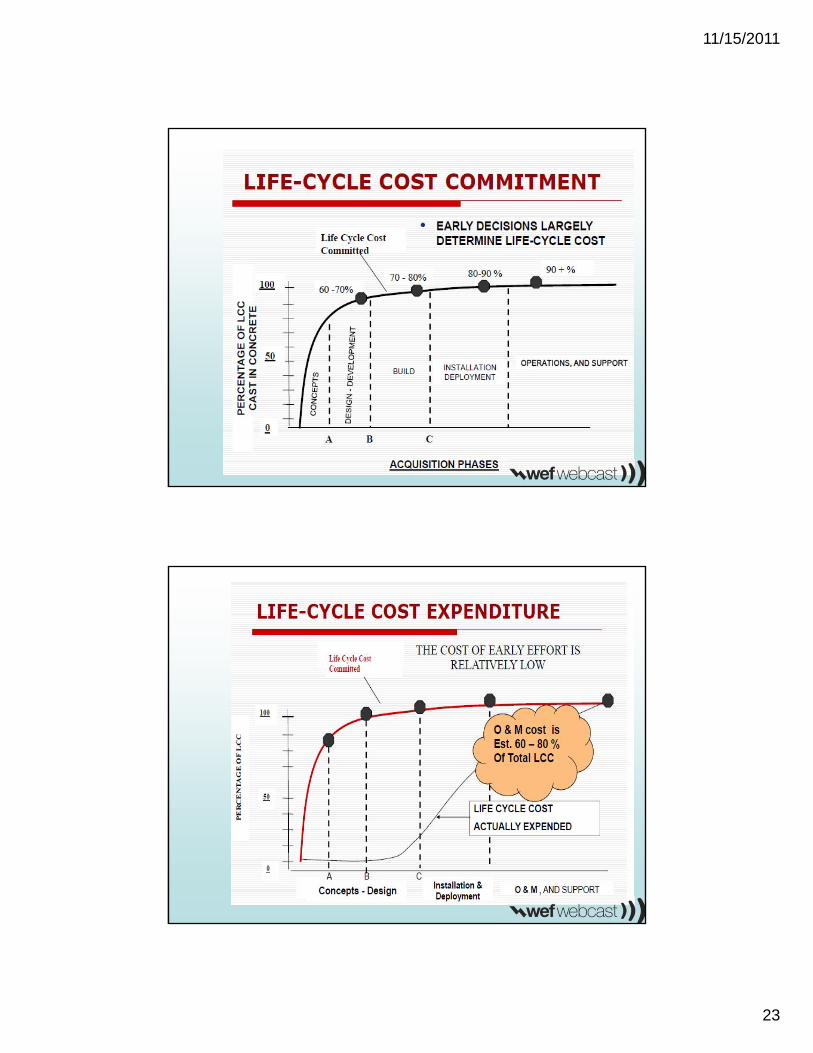
Reliability Basics
- 60-70% Reliability determined at the design level.
- 10% determined through as-built adherence.
- 10-20% determined through Install
- 10% determined through commissioning.
Generally, after commissioning Reliability cannot be
changed w/o redesign.
11/15/2011
23
11/15/2011
24
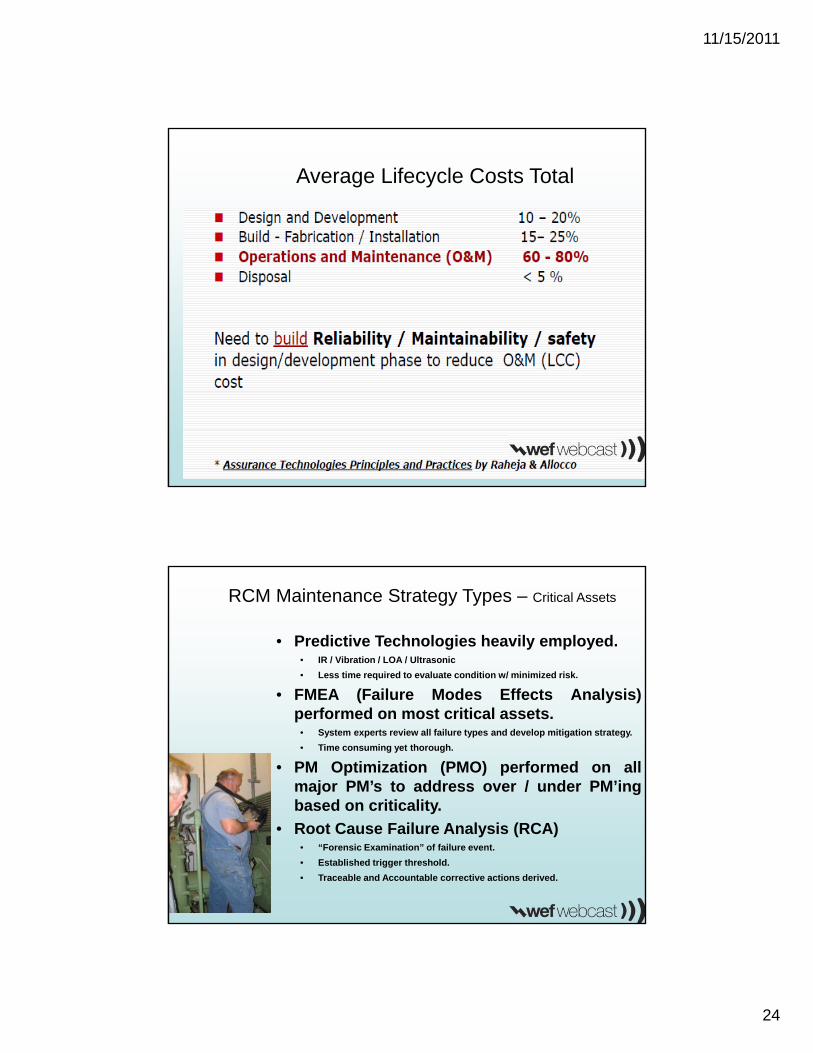
Average Lifecycle Costs Total
RCM Maintenance Strategy Types – Critical Assets
• Predictive Technologies heavily employed.• IR / Vibration / LOA / Ultrasonic
• Less time required to evaluate condition w/ minimized risk.
• FMEA (Failure Modes Effects Analysis)performed on most critical assets.
• System experts review all failure types and develop mitigation strategy.
• Time consuming yet thorough.
• PM Optimization (PMO) performed on allmajor PM’s to address over / under PM’ingbased on criticality.
• Root Cause Failure Analysis (RCA)• “Forensic Examination” of failure event.
• Established trigger threshold.
• Traceable and Accountable corrective actions derived.
11/15/2011
25
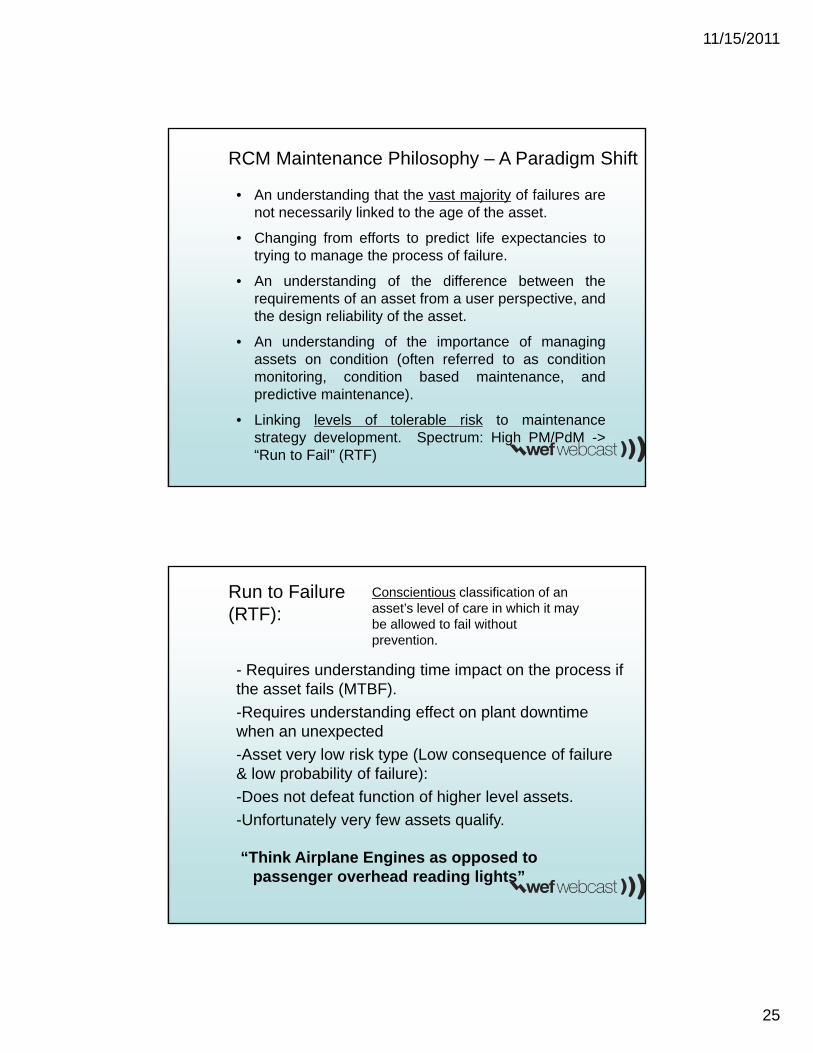
RCM Maintenance Philosophy – A Paradigm Shift
• An understanding that the vast majority of failures arenot necessarily linked to the age of the asset.
• Changing from efforts to predict life expectancies totrying to manage the process of failure.
• An understanding of the difference between therequirements of an asset from a user perspective, andthe design reliability of the asset.
• An understanding of the importance of managingassets on condition (often referred to as conditionmonitoring, condition based maintenance, andpredictive maintenance).
• Linking levels of tolerable risk to maintenancestrategy development. Spectrum: High PM/PdM ->“Run to Fail” (RTF)
Run to Failure (RTF):
- Requires understanding time impact on the process if the asset fails (MTBF).
-Requires understanding effect on plant downtime when an unexpected
-Asset very low risk type (Low consequence of failure & low probability of failure):
-Does not defeat function of higher level assets.
-Unfortunately very few assets qualify.
Conscientious classification of an asset’s level of care in which it may be allowed to fail without prevention.
“Think Airplane Engines as opposed to passenger overhead reading lights”
11/15/2011
26
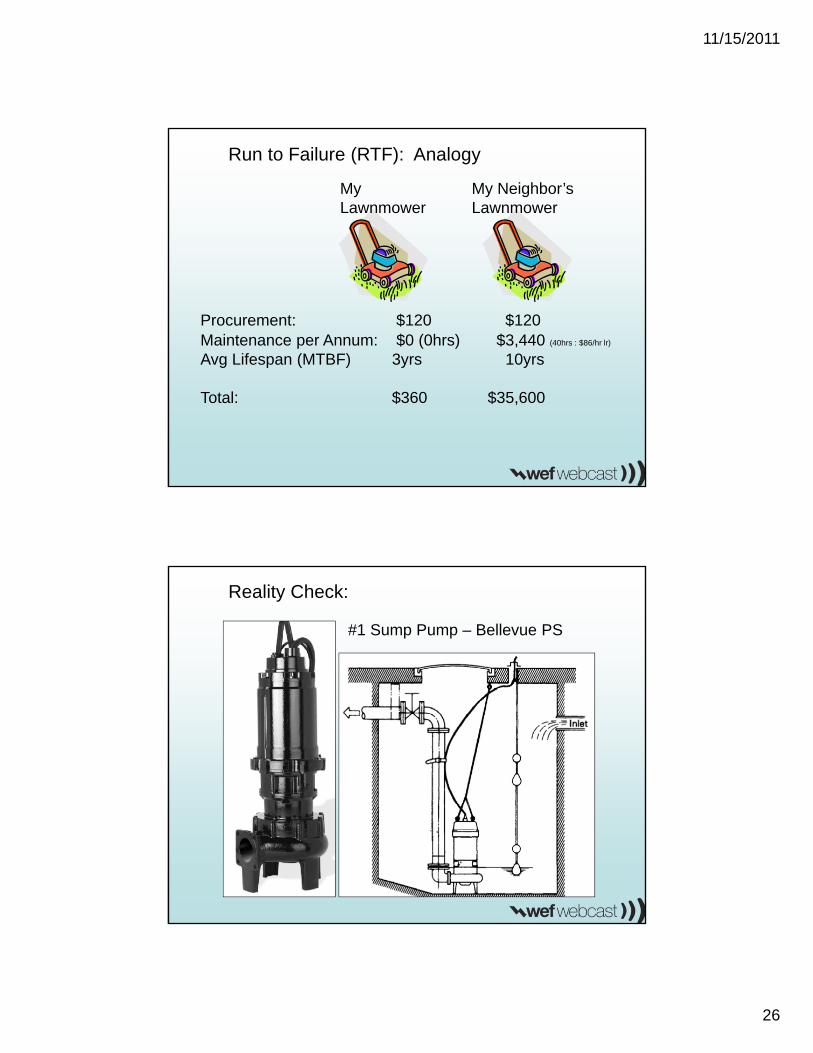
Run to Failure (RTF): Analogy
Procurement: $120 $120Maintenance per Annum: $0 (0hrs) $3,440 (40hrs : $86/hr lr)
Avg Lifespan (MTBF) 3yrs 10yrs
Total: $360 $35,600
My Lawnmower
My Neighbor’s Lawnmower
Reality Check:
#1 Sump Pump – Bellevue PS
11/15/2011
27
Reality Check:
#1 Sump Pump – Bellevue PS
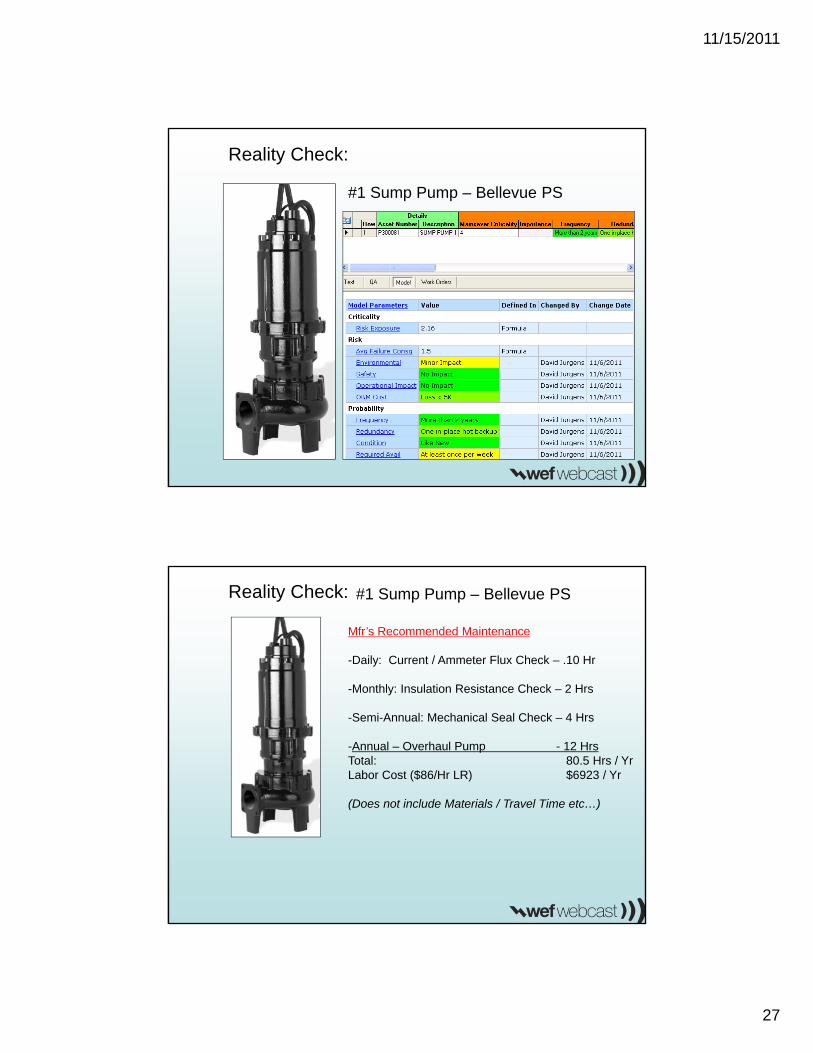
Reality Check: #1 Sump Pump – Bellevue PS
Mfr’s Recommended Maintenance
-Daily: Current / Ammeter Flux Check – .10 Hr
-Monthly: Insulation Resistance Check – 2 Hrs
-Semi-Annual: Mechanical Seal Check – 4 Hrs
-Annual – Overhaul Pump - 12 HrsTotal: 80.5 Hrs / YrLabor Cost ($86/Hr LR) $6923 / Yr
(Does not include Materials / Travel Time etc…)
11/15/2011
28
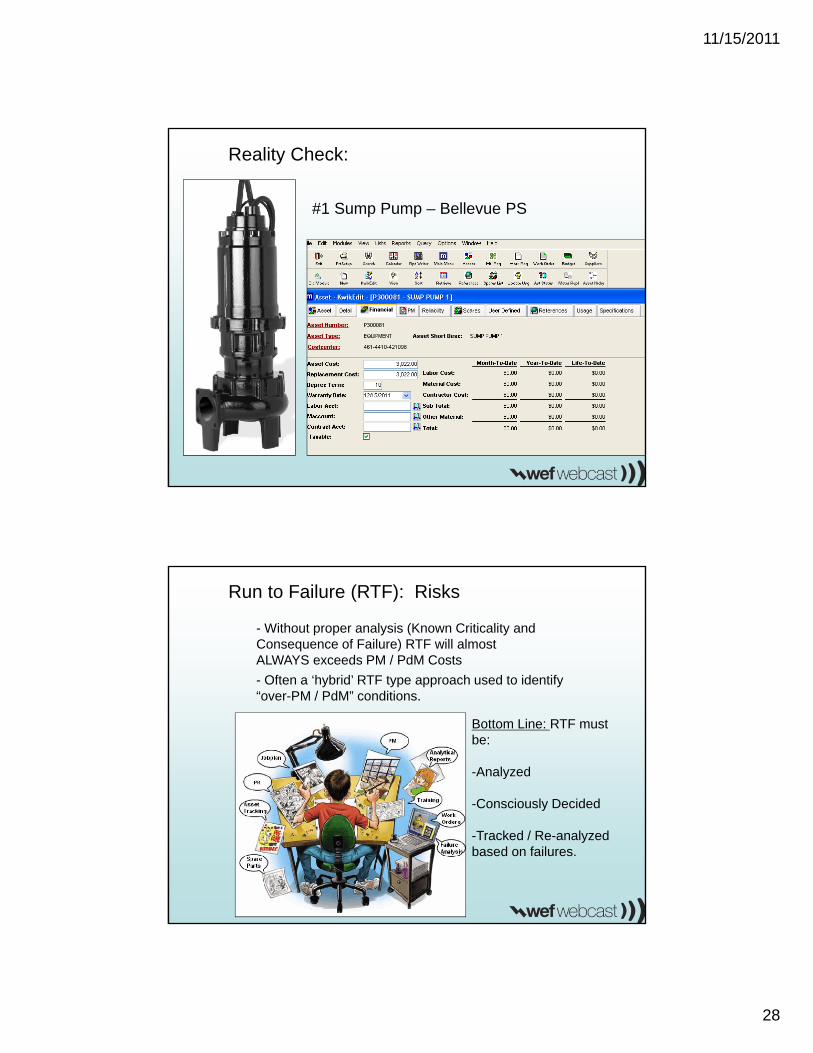
Reality Check:
#1 Sump Pump – Bellevue PS
Run to Failure (RTF): Risks
- Without proper analysis (Known Criticality and Consequence of Failure) RTF will almost ALWAYS exceeds PM / PdM Costs
- Often a ‘hybrid’ RTF type approach used to identify “over-PM / PdM” conditions.
Bottom Line: RTF must be:
-Analyzed
-Consciously Decided
-Tracked / Re-analyzed based on failures.
11/15/2011
29
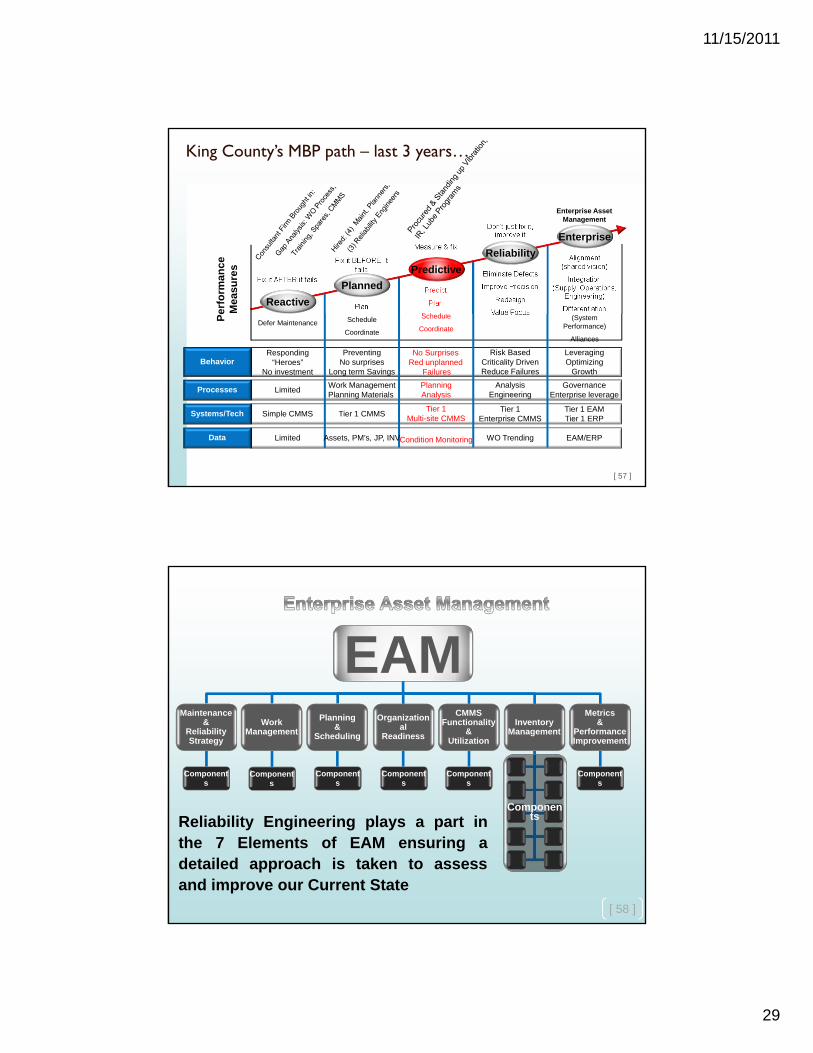
Fix it BEFORE it fails
Measure & fix
Don’t just fix it, improve it
Plan
Schedule
Coordinate
Eliminate Defects
Improve Precision
Redesign
Value Focus
Alignment(shared vision)
Integration(Supply, Operations,
Engineering)
Differentiation(System
Performance)
Alliances
Per
form
ance
M
easu
res
BehaviorResponding
“Heroes”No investment
Processes
PreventingNo surprises
Long term Savings
No SurprisesRed unplanned
Failures
Risk BasedCriticality DrivenReduce Failures
LeveragingOptimizing
Growth
LimitedWork ManagementPlanning Materials
PlanningAnalysis
AnalysisEngineering
GovernanceEnterprise leverage
Systems/Tech Simple CMMS Tier 1 CMMSTier 1
Multi-site CMMSTier 1
Enterprise CMMSTier 1 EAMTier 1 ERP
Fix it AFTER it fails
Data Limited Assets, PM’s, JP, INVCondition Monitoring WO Trending EAM/ERP
Predict
Plan
Schedule
CoordinateDefer Maintenance
Reactive
Planned
Predictive
Reliability
Enterprise
Enterprise Asset Management
[ 57 ]
King County’s MBP path – last 3 years…
[ 58 ]
Reliability Engineering plays a part inthe 7 Elements of EAM ensuring adetailed approach is taken to assessand improve our Current State
Components
CMMSFunctionality
&Utilization
Organizational
Readiness
WorkManagement
InventoryManagement
Planning&
Scheduling
Maintenance&
ReliabilityStrategy
Metrics&
PerformanceImprovement
Components
Components
Components
Components
Components
Components
EAM
11/15/2011
30
Maintenance: The Key to Asset Life
Presented by Dave Jurgens – KCWTP Reliability
Dave Jurgens, King County WTD Reliability
QUESTIONS
THINKING OUTSIDE THE WETWELL BOXPresenter:
Howard Smith, P.E., MSA Professional Services
November 16, 2011
11/15/2011
31
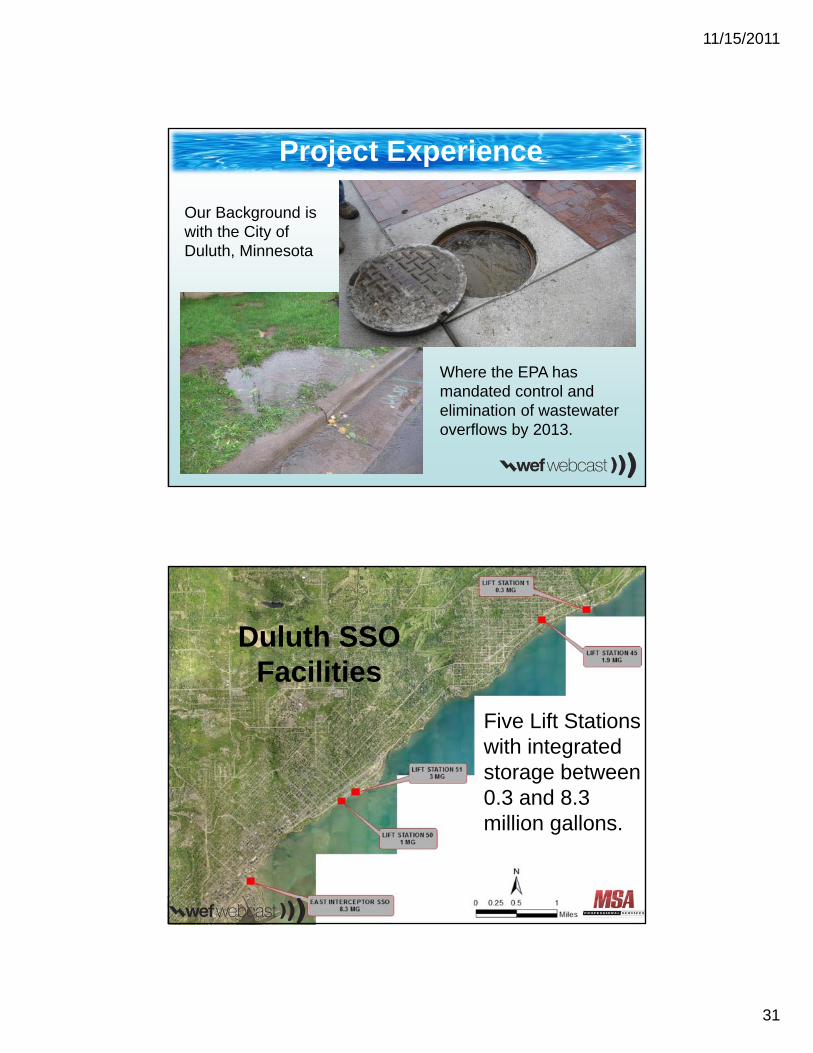
Our Background is with the City of Duluth, Minnesota
Project Experience
Where the EPA has mandated control and elimination of wastewater overflows by 2013.
Duluth SSO Facilities
Five Lift Stations with integrated storage between 0.3 and 8.3 million gallons.
11/15/2011
32
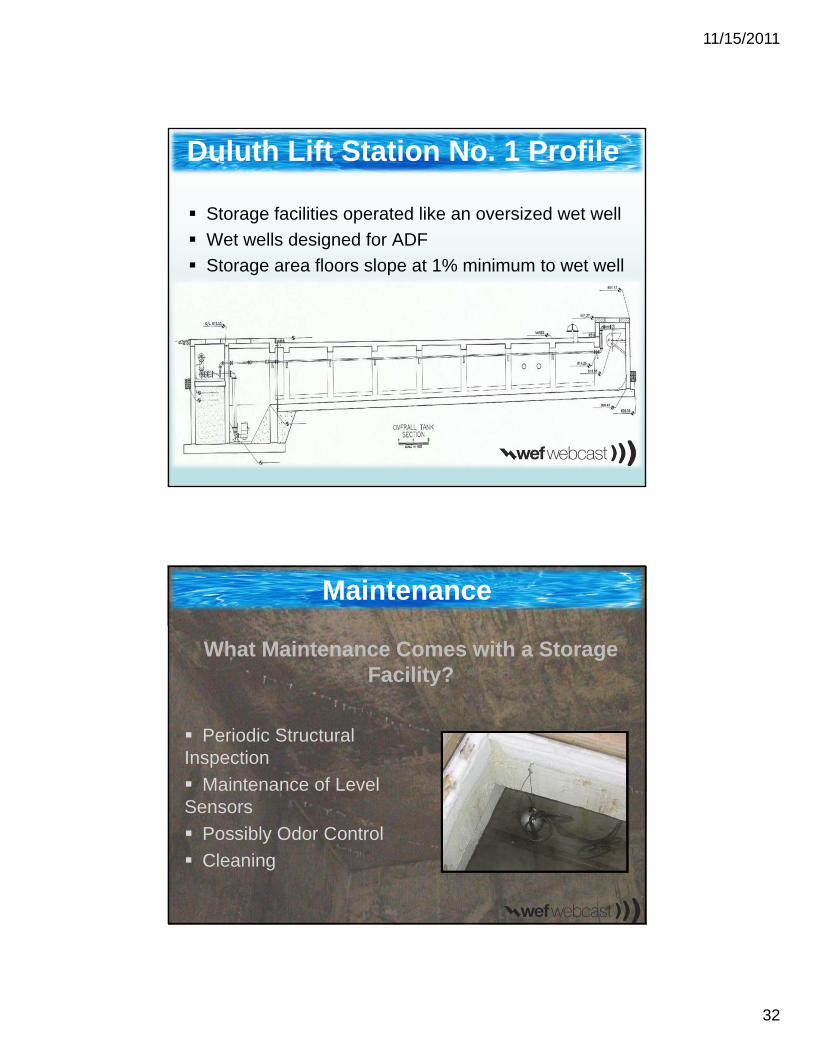
Storage facilities operated like an oversized wet well
Wet wells designed for ADF
Storage area floors slope at 1% minimum to wet well
Duluth Lift Station No. 1 Profile
Maintenance
Periodic Structural Inspection
Maintenance of Level Sensors
Possibly Odor Control
Cleaning
What Maintenance Comes with a Storage Facility?
11/15/2011
33
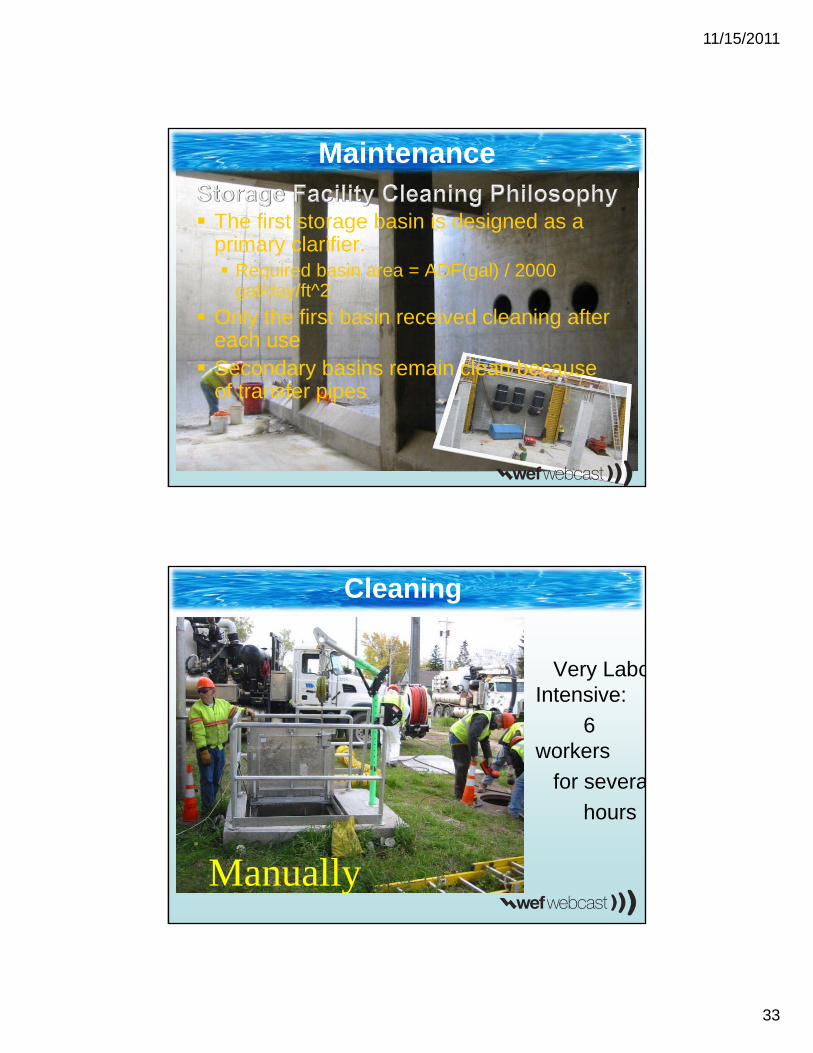
The first storage basin is designed as a primary clarifier. Required basin area = ADF(gal) / 2000
gal/day/ft^2
Only the first basin received cleaning after each use Secondary basins remain clean because
of transfer pipes
Maintenance
Manually
Cleaning
Very LaboIntensive:
6 workers
for severa
hours
11/15/2011
34
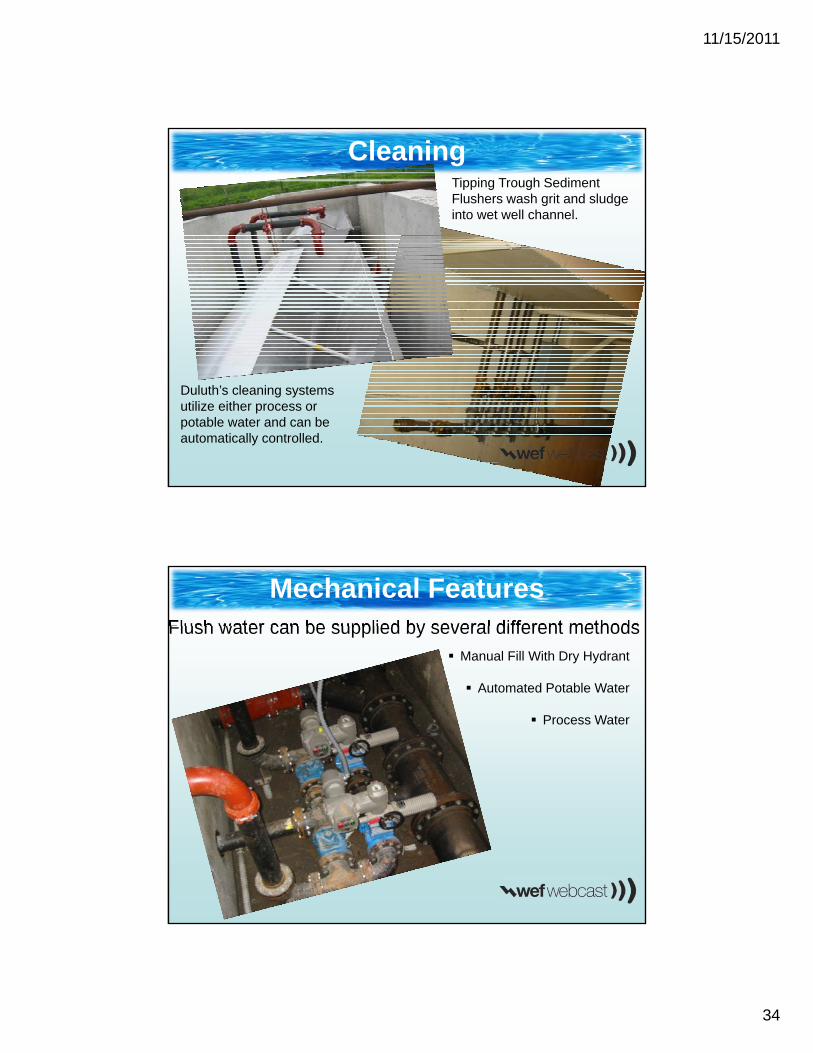
Cleaning
Duluth’s cleaning systems utilize either process or potable water and can be automatically controlled.
Tipping Trough Sediment Flushers wash grit and sludge into wet well channel.
Flush water can be supplied by several different methods
Manual Fill With Dry Hydrant
Automated Potable Water
Process Water
Mechanical Features
11/15/2011
35
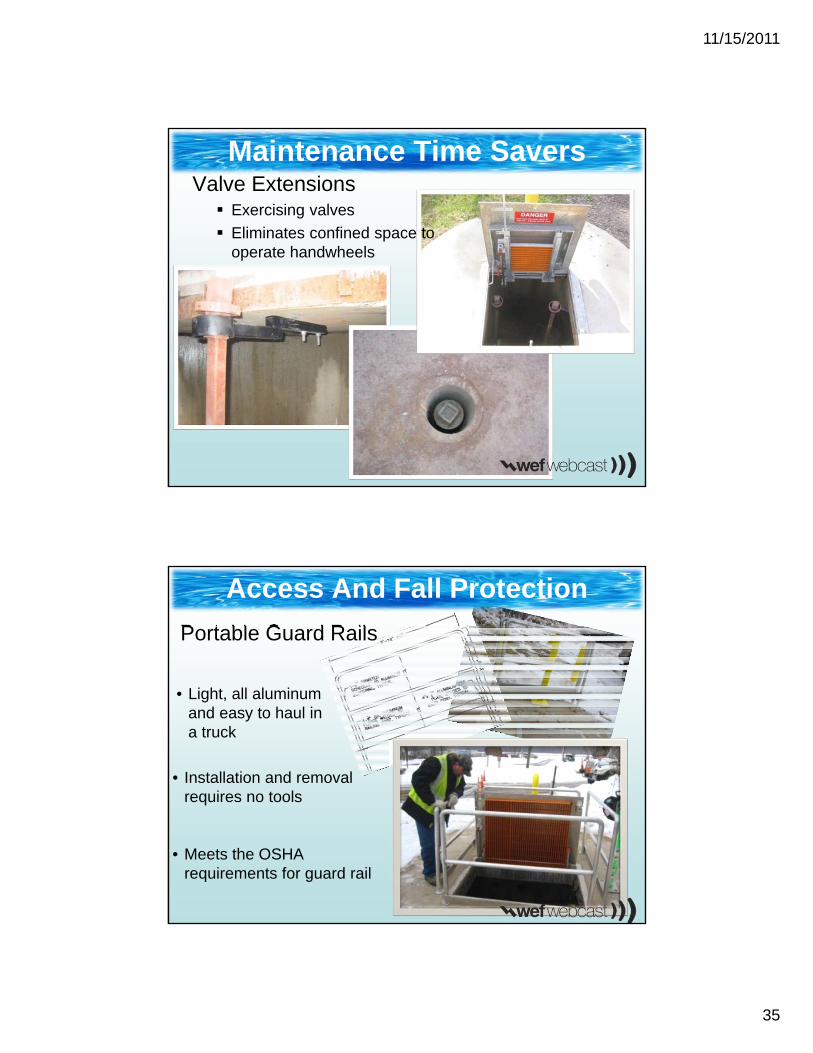
Maintenance Time SaversValve Extensions Exercising valves
Eliminates confined space to operate handwheels
Portable Guard Rails
Access And Fall Protection
• Installation and removal requires no tools
• Meets the OSHA requirements for guard rail
• Light, all aluminum and easy to haul in a truck
11/15/2011
36
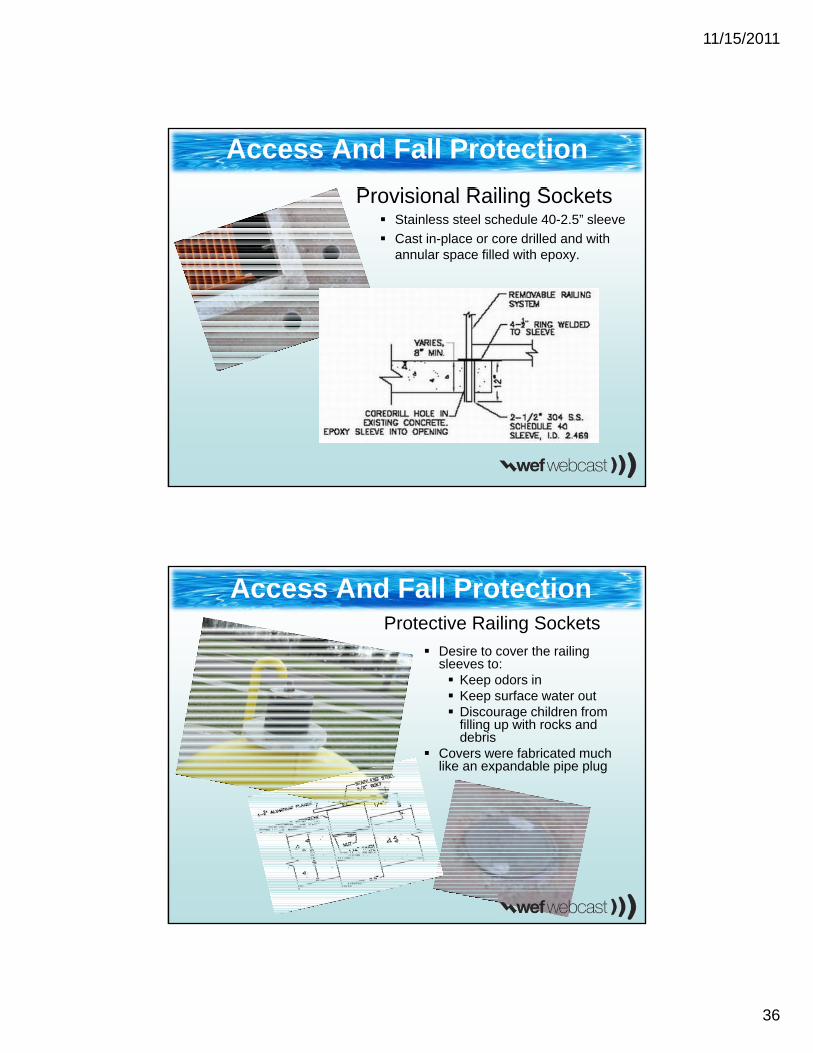
Provisional Railing Sockets Stainless steel schedule 40-2.5” sleeve
Cast in-place or core drilled and with annular space filled with epoxy.
Access And Fall Protection
Desire to cover the railing sleeves to: Keep odors in Keep surface water out Discourage children from
filling up with rocks and debris
Covers were fabricated much like an expandable pipe plug
Access And Fall ProtectionProtective Railing Sockets
11/15/2011
37
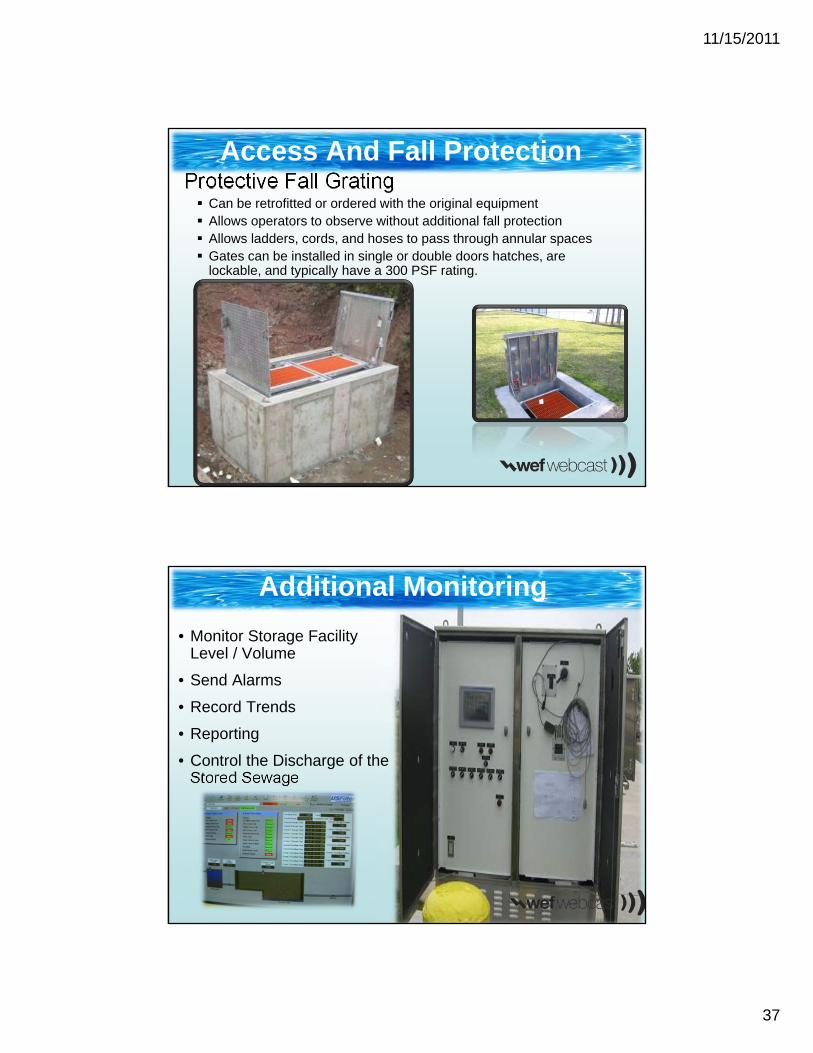
Protective Fall Grating Can be retrofitted or ordered with the original equipment Allows operators to observe without additional fall protection Allows ladders, cords, and hoses to pass through annular spaces Gates can be installed in single or double doors hatches, are
lockable, and typically have a 300 PSF rating.
Access And Fall Protection
• Monitor Storage Facility Level / Volume
• Send Alarms
• Record Trends
• Reporting
• Control the Discharge of the Stored Sewage
Additional Monitoring
11/15/2011
38
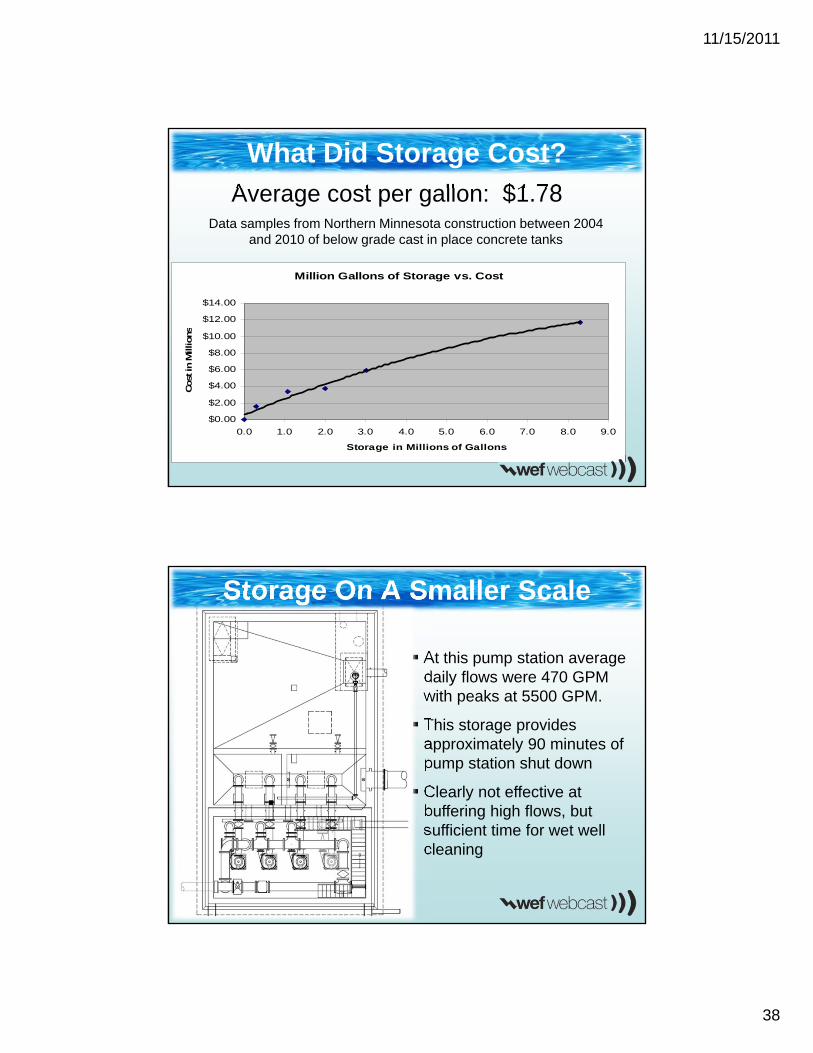
Million Gallons of Storage vs. Cost
$0.00
$2.00
$4.00
$6.00
$8.00
$10.00
$12.00
$14.00
0.0 1.0 2.0 3.0 4.0 5.0 6.0 7.0 8.0 9.0
Storage in Millions of Gallons
Cost
in M
illions
Average cost per gallon: $1.78Data samples from Northern Minnesota construction between 2004
and 2010 of below grade cast in place concrete tanks
What Did Storage Cost?
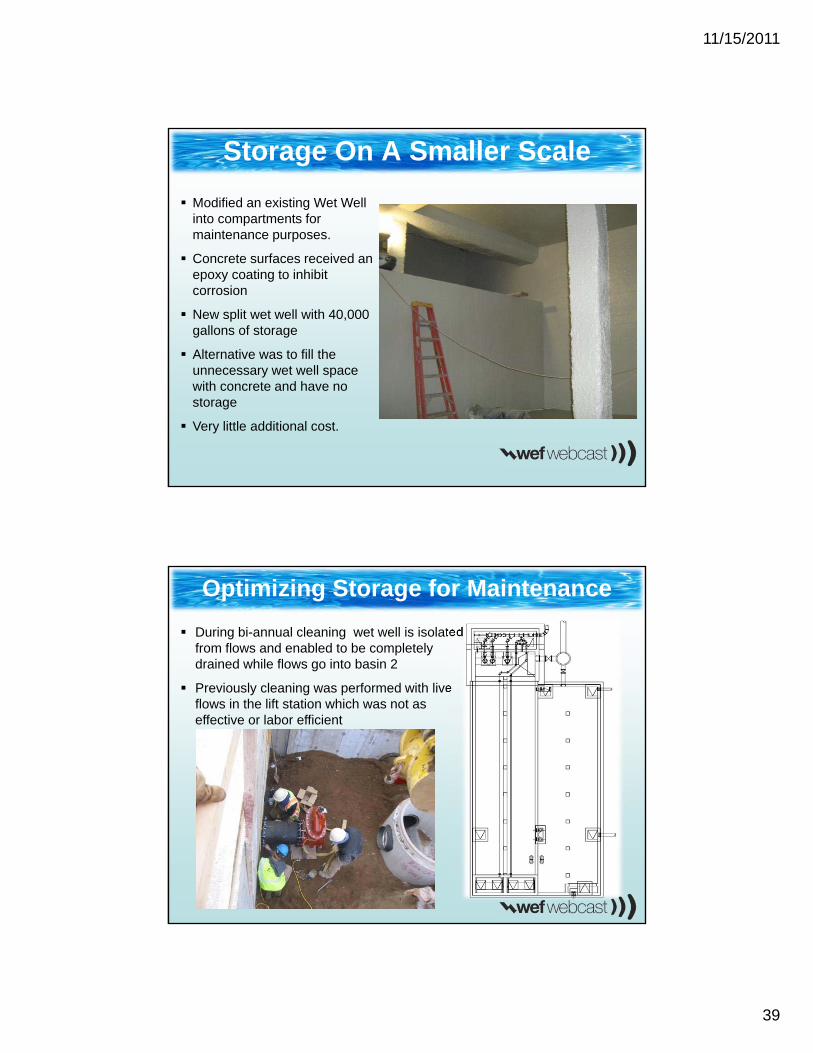
At this pump station average daily flows were 470 GPM with peaks at 5500 GPM.
This storage provides approximately 90 minutes of pump station shut down
Clearly not effective at buffering high flows, but sufficient time for wet well cleaning
Storage On A Smaller Scale
11/15/2011
39
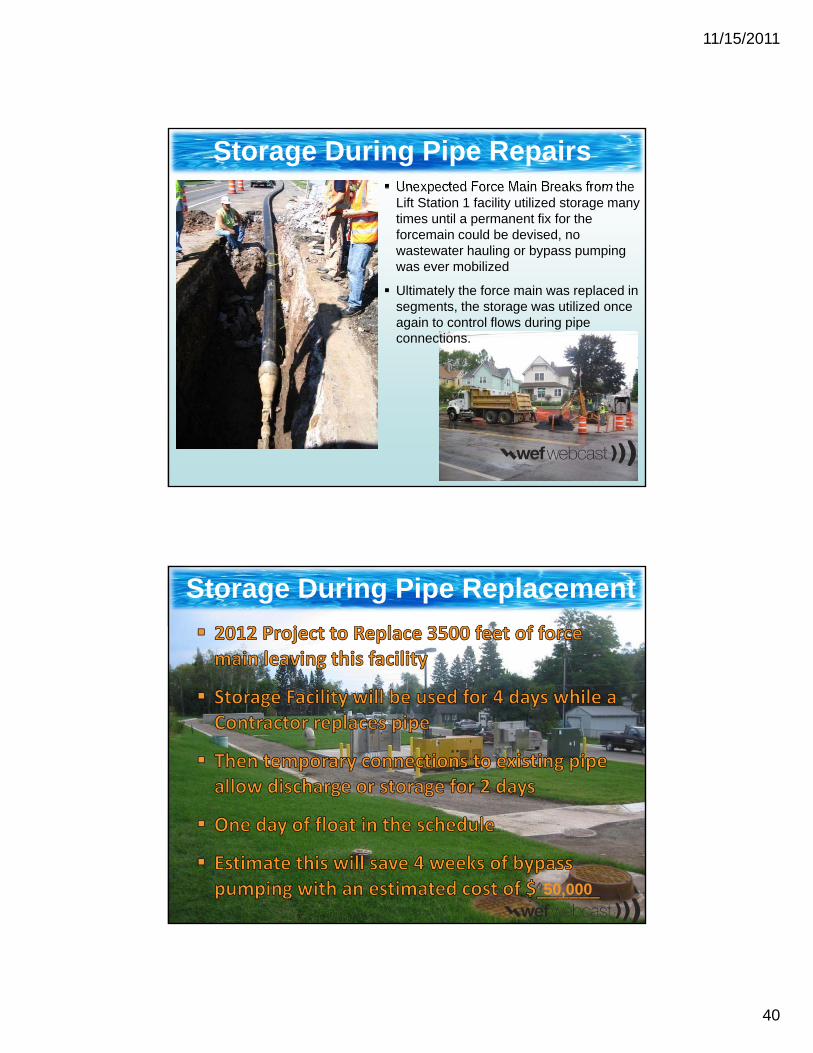
Modified an existing Wet Well into compartments for maintenance purposes.
Concrete surfaces received an epoxy coating to inhibit corrosion
New split wet well with 40,000 gallons of storage
Alternative was to fill the unnecessary wet well space with concrete and have no storage
Very little additional cost.
Storage On A Smaller Scale
During bi-annual cleaning wet well is isolated from flows and enabled to be completely drained while flows go into basin 2
Previously cleaning was performed with live flows in the lift station which was not as effective or labor efficient
Optimizing Storage for Maintenance
11/15/2011
40
Unexpected Force Main Breaks from the Lift Station 1 facility utilized storage many times until a permanent fix for the forcemain could be devised, no wastewater hauling or bypass pumping was ever mobilized
Ultimately the force main was replaced in segments, the storage was utilized once again to control flows during pipe connections.
Storage During Pipe Repairs
Storage During Pipe Replacement
50,000
11/15/2011
41
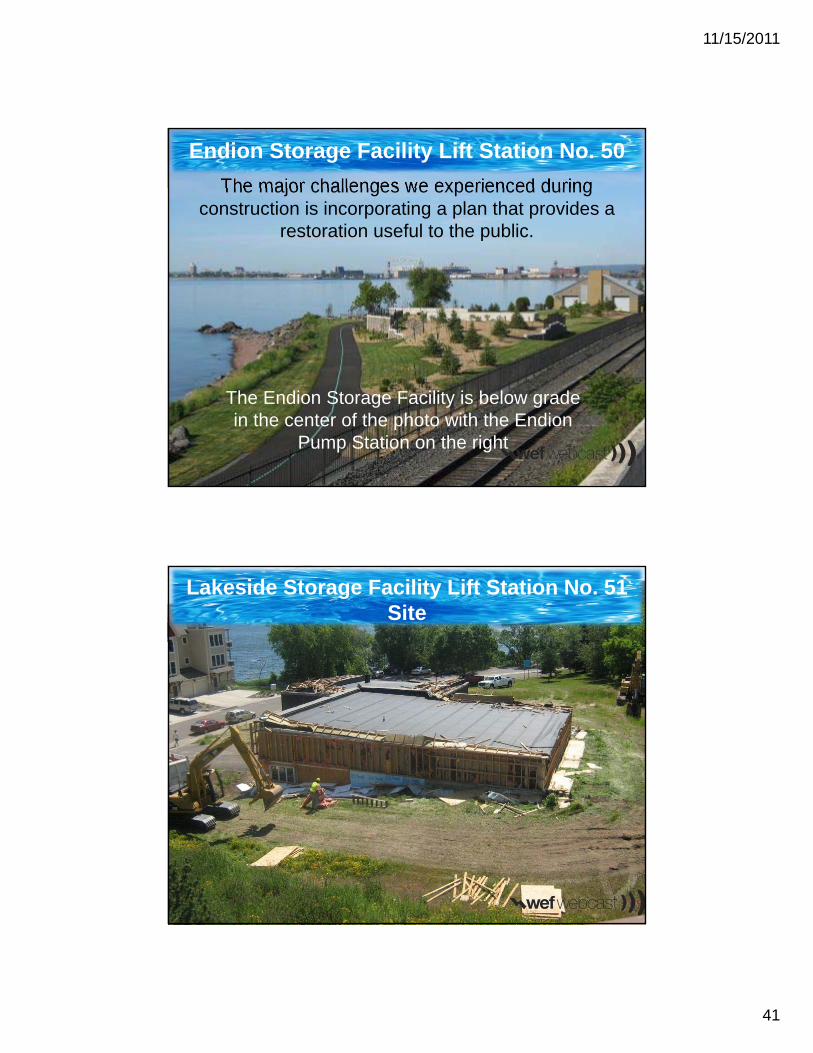
The Endion Storage Facility is below grade in the center of the photo with the Endion
Pump Station on the right
The major challenges we experienced during construction is incorporating a plan that provides a
restoration useful to the public.
Endion Storage Facility Lift Station No. 50
Lakeside Storage Facility Lift Station No. 51Site
11/15/2011
42
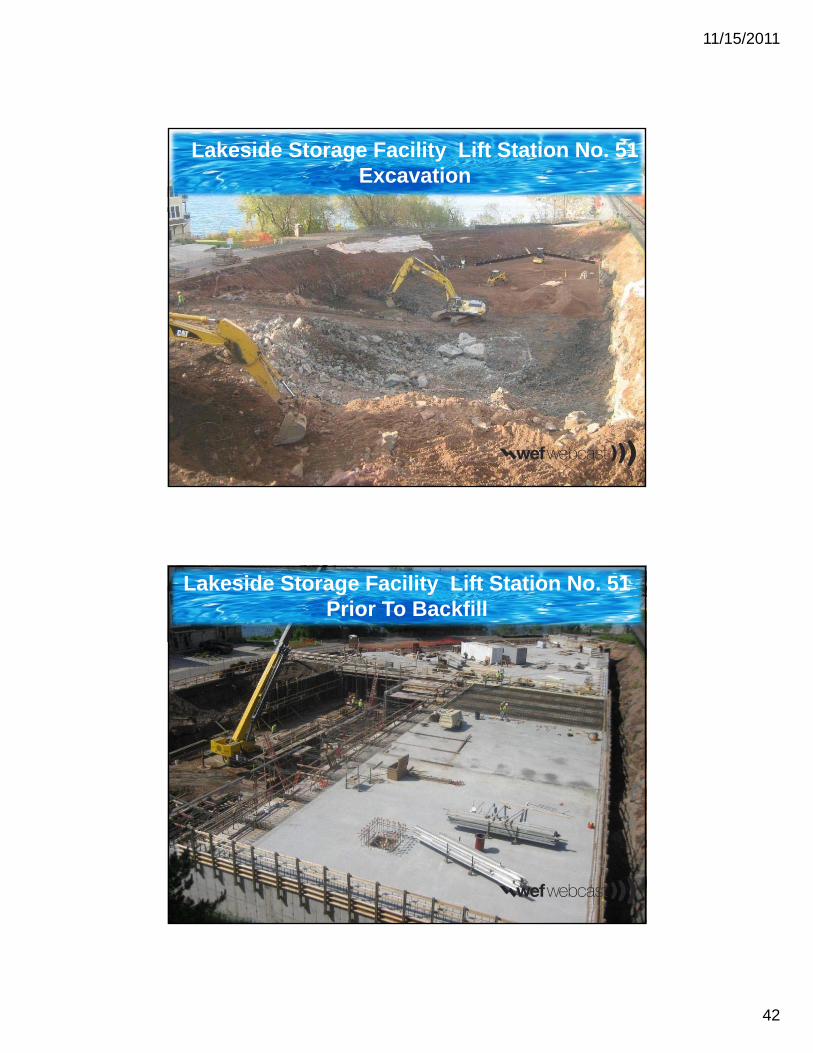
Lakeside Storage Facility Lift Station No. 51 Excavation
Lakeside Storage Facility Lift Station No. 51Prior To Backfill
11/15/2011
43
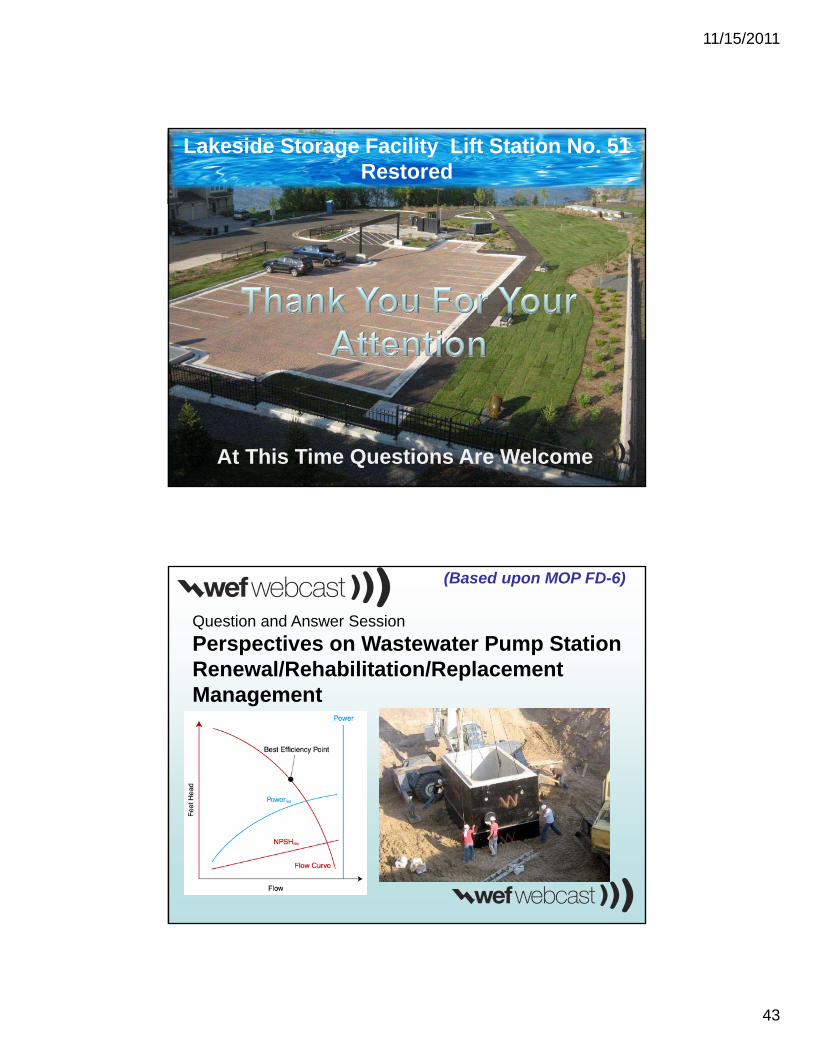
At This Time Questions Are Welcome
Lakeside Storage Facility Lift Station No. 51Restored
Question and Answer Session
Perspectives on Wastewater Pump Station Renewal/Rehabilitation/Replacement Management
(Based upon MOP FD-6)
11/15/2011
44
• Proper and efficient identification of lift station issues is key
• A systematic approach to lift station diagnosis increases likelihood for successes
• An asset maintenance program is needed to maximize lifespan and control cost
• There is a need to understand the reliability of an asset
• Replacement can be an opportunity to increase functionality
2012-13 Collection System Infrastructure Management Series
• February 2012: Planning and Implementing CMMS
• June 2012: Condition Assessment: Building out your CMMS
• November 2012: Asset Management: Translating your data to information
• February 2013: Business Case for Action
• June 2013: Optimized System Operations
• November 2013: Designing for Asset Management
SERIES BASED ON MOP 7 WASTEWATER COLLECTION SYSTEM MANAGEMENT
11/15/2011
45
Thank you for joining today’s presentation:
Perspectives on Wastewater Pump Station Renewal/Rehabilitation/Replacement Management
(Based upon MOP FD-6)