Embed Size (px)
Citation preview
Research | Training | Policy | Practice
Perspectives on Measuring
Poverty in the US
Bob Haveman and Tim Smeeding for
Teaching Poverty 101 June, 2013
Orientation
• Purpose of workshop • Your role as students and ours as course
organizers • Learning from each other • Course materials and the website • Formation into groups
What is Poverty? • Defined: a state of economic or material hardship • Poverty status is a social indicator––a ‘WHAT’ • The more difficult question is ‘WHY’ are people poor:
– Individual factors: • People of working age have few skills, hence low pay • Is there a lack of personal responsibility or effort?:
– Structural factors: • Entry barriers related to race and ethnicity and incarceration • Economic recession
– Cultural factors: • Norms and attitudes
– Policy-related factors: • Are government support policies too stingy?
Why poverty matters
• Negative effects on individuals and self efficacy • Moral/ethic arguments––justice • Economic and social costs:
– Negative impact of child poverty on society’s future (children as social investment)
– Negative consequences for communities (e.g., crime, blight, low property values)
– Costs to other social systems (e.g., income support, incarceration, child welfare)
• Others?
So, why do we measure poverty?
Despite limitations, economic poverty measures are a powerful tool: • To highlight economic disadvantage and make
comparisons over time, across place and vulnerable groups (children, elderly, immigrants, minorities)
• To help set eligibility and benefit standards for programs and public policies aimed at the disadvantaged
• To assess the effects of programs and policies to alleviate poverty and to increase economic well-being, and therefore to inform policymakers and the public about program anti-poverty effectiveness
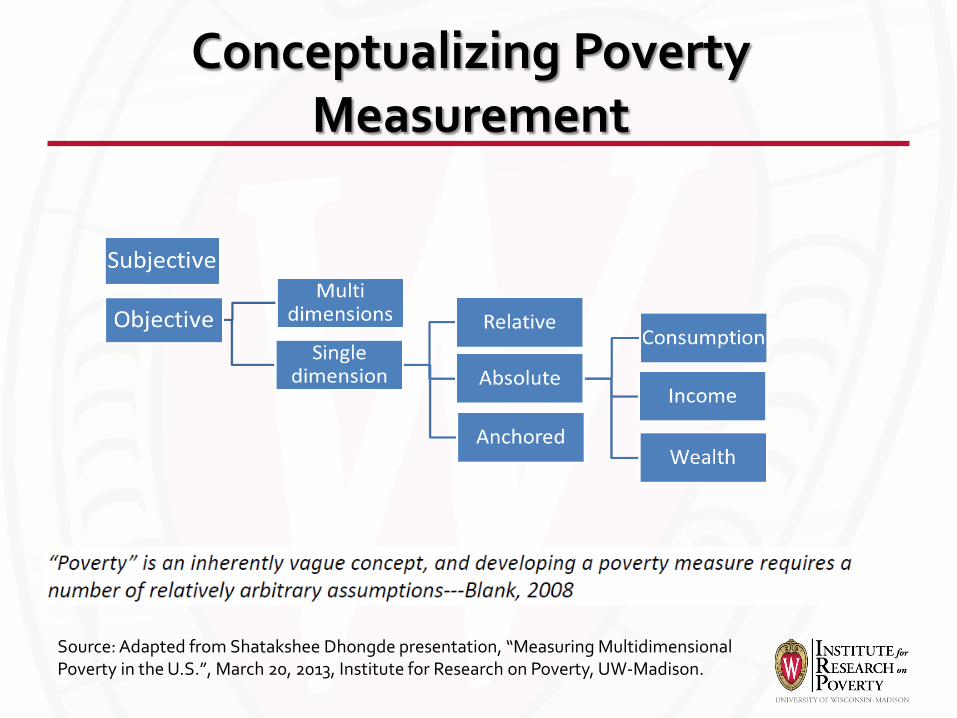
Conceptualizing Poverty Measurement
Source: Adapted from Shatakshee Dhongde presentation, “Measuring Multidimensional Poverty in the U.S.”, March 20, 2013, Institute for Research on Poverty, UW-Madison.
Inequality
• Relative poverty as link to lower end inequality, via this measure
• The near poor and the decline of the middle class—incomes 100-200 percent of poverty
• How about upper end inequality ? • Inequality of outcome vs. inequality of
opportunity
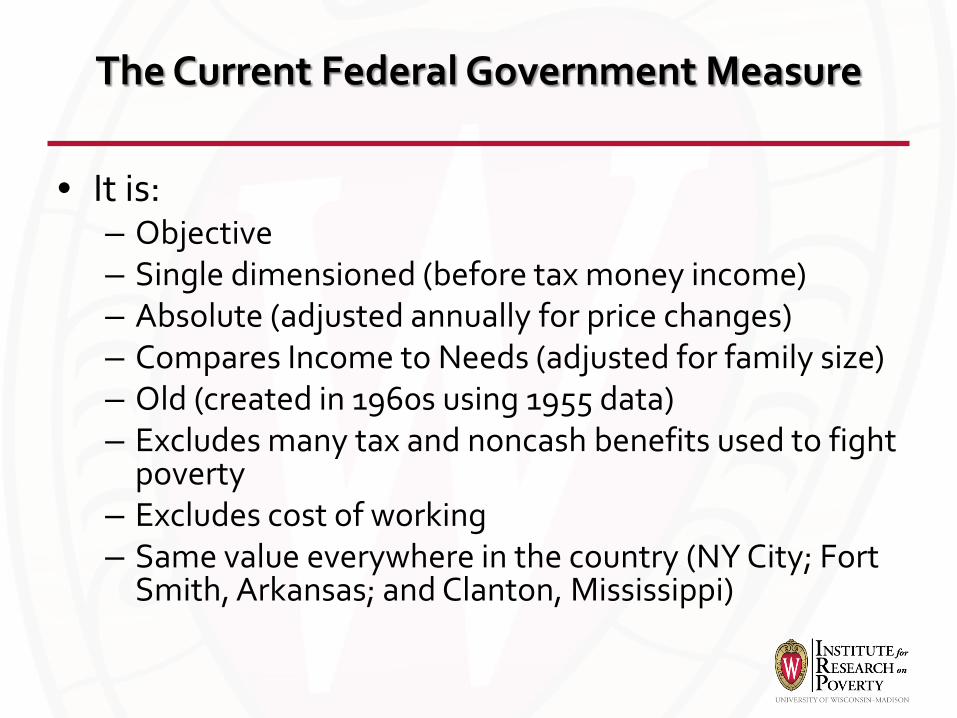
The Current Federal Government Measure
• It is: – Objective – Single dimensioned (before tax money income) – Absolute (adjusted annually for price changes) – Compares Income to Needs (adjusted for family size) – Old (created in 1960s using 1955 data) – Excludes many tax and noncash benefits used to fight
poverty – Excludes cost of working – Same value everywhere in the country (NY City; Fort
Smith, Arkansas; and Clanton, Mississippi)
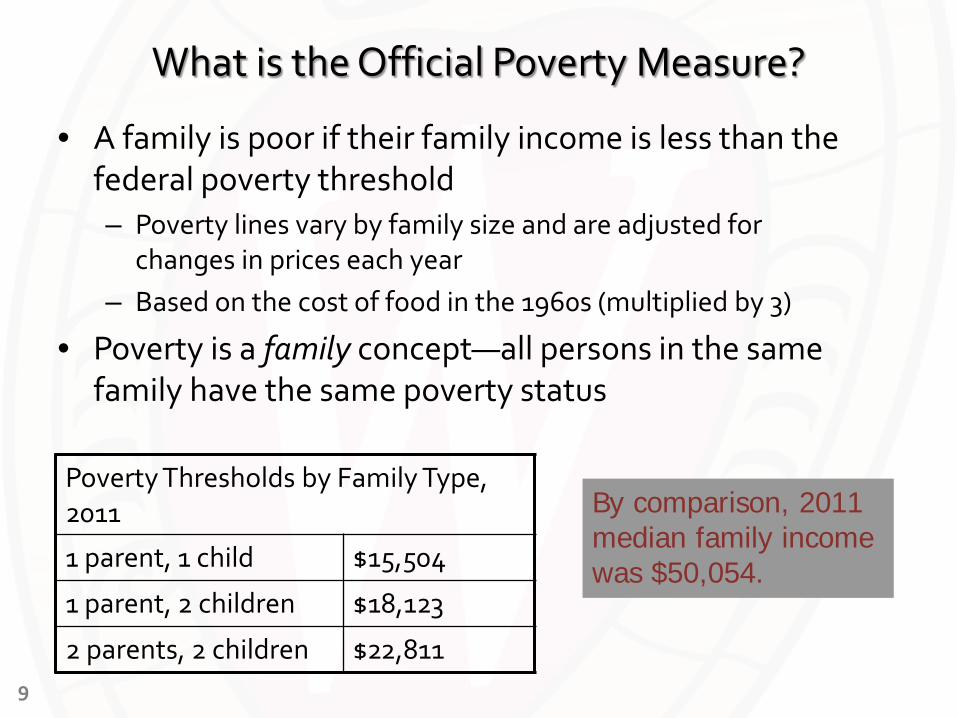
What is the Official Poverty Measure?
• A family is poor if their family income is less than the federal poverty threshold – Poverty lines vary by family size and are adjusted for
changes in prices each year – Based on the cost of food in the 1960s (multiplied by 3)
• Poverty is a family concept—all persons in the same family have the same poverty status
Poverty Thresholds by Family Type, 2011
1 parent, 1 child $15,504
1 parent, 2 children $18,123
2 parents, 2 children $22,811 9
By comparison, 2011 median family income was $50,054.
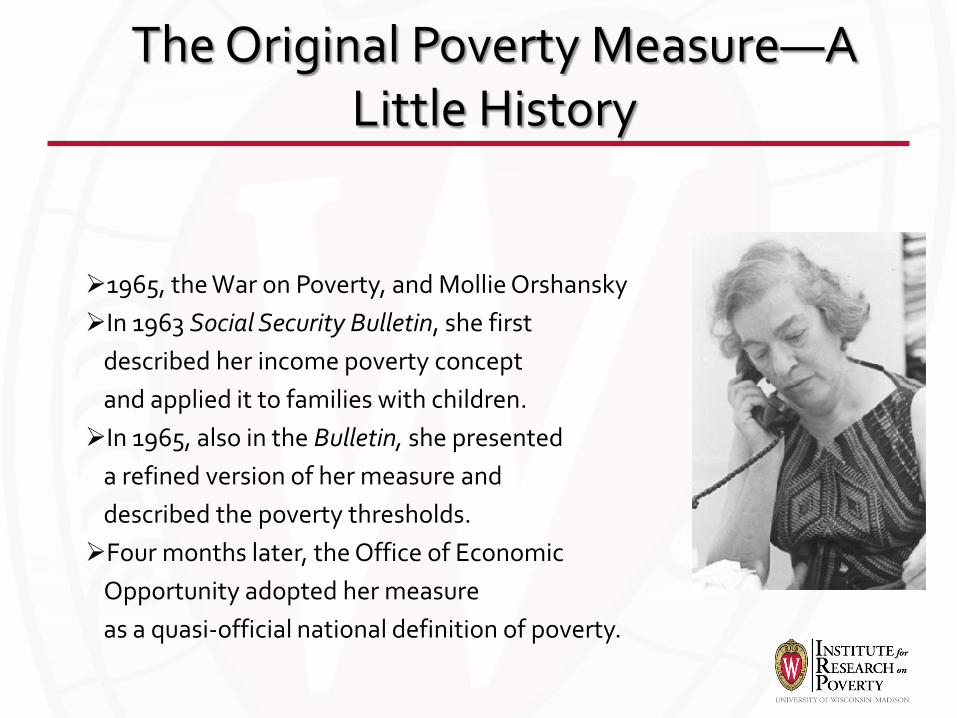
The Original Poverty Measure—A Little History
1965, the War on Poverty, and Mollie Orshansky In 1963 Social Security Bulletin, she first
described her income poverty concept and applied it to families with children. In 1965, also in the Bulletin, she presented
a refined version of her measure and described the poverty thresholds. Four months later, the Office of Economic
Opportunity adopted her measure as a quasi-official national definition of poverty.
The Official Poverty Measure—Assumptions
Needs-adjusted annual household pre-tax income is a good proxy for longer-term well-being (or access to resources).
Markets work, so that cash income can buy things––the absence of which makes people ‘deprived’.
Being poor means having cash income below a needs standard based on an arbitrary food consumption rule.
Income needs differ by family size in a very particular way.
THE MEASURE IS CONTROVERSIAL!!!
12
0
5
10
15
20
25
30
1960 1965 1970 1975 1980 1985 1990 1995 2000 2005 2010
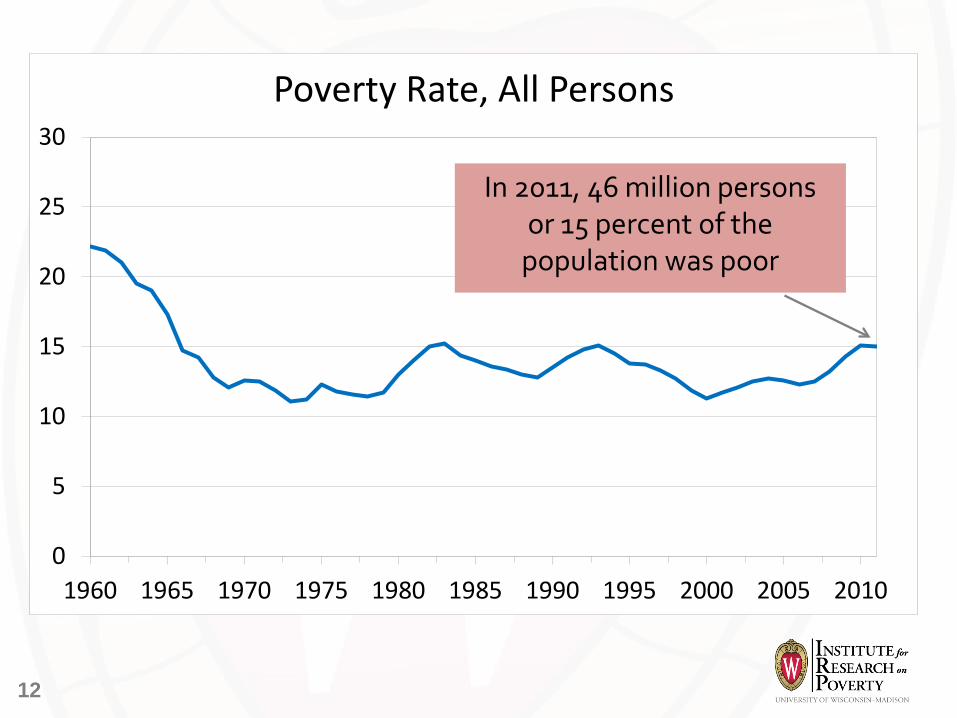
Poverty Rate, All Persons
In 2011, 46 million persons or 15 percent of the
population was poor
13
-10%
0%
10%
20%
30%
40%
50%
60%
Age < 18 Age 18-64 Age 65+
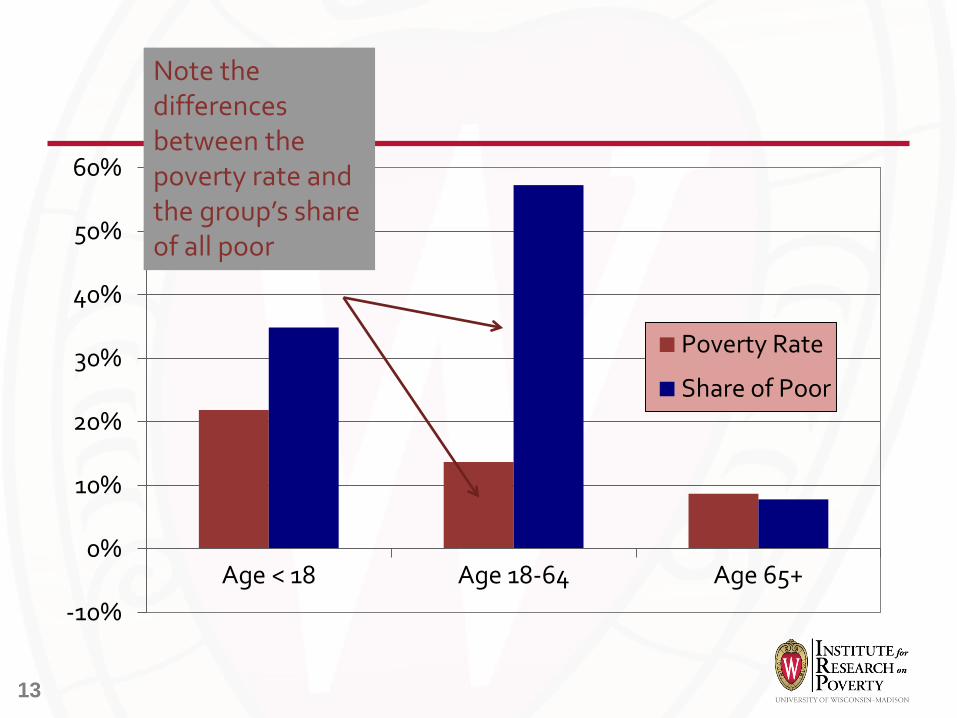
Poverty Rate
Share of Poor
Note the differences between the poverty rate and the group’s share of all poor
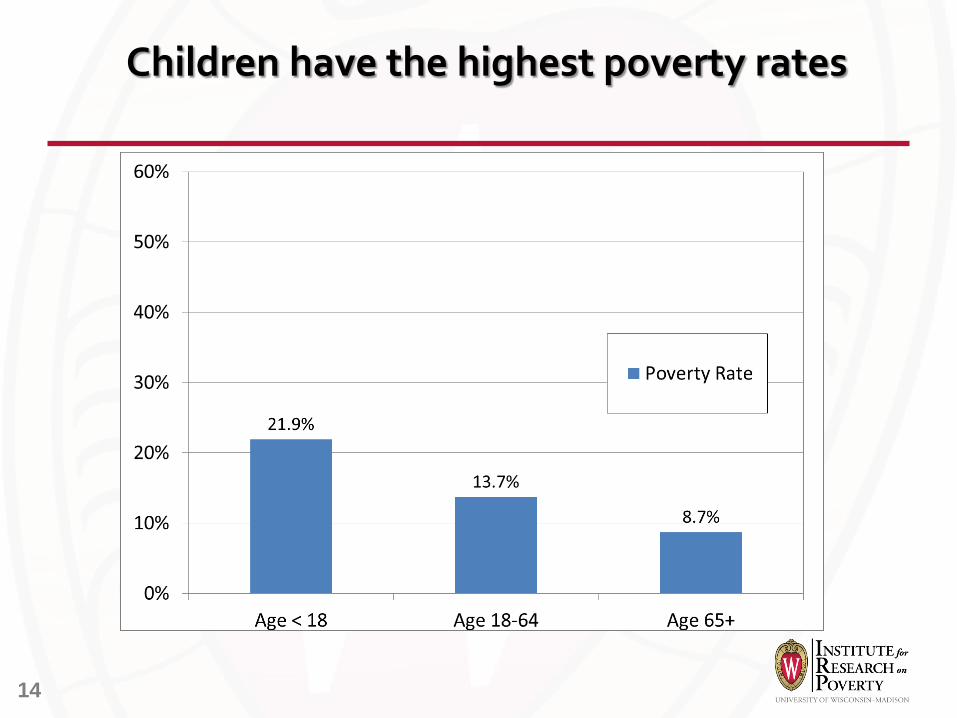
Children have the highest poverty rates
14
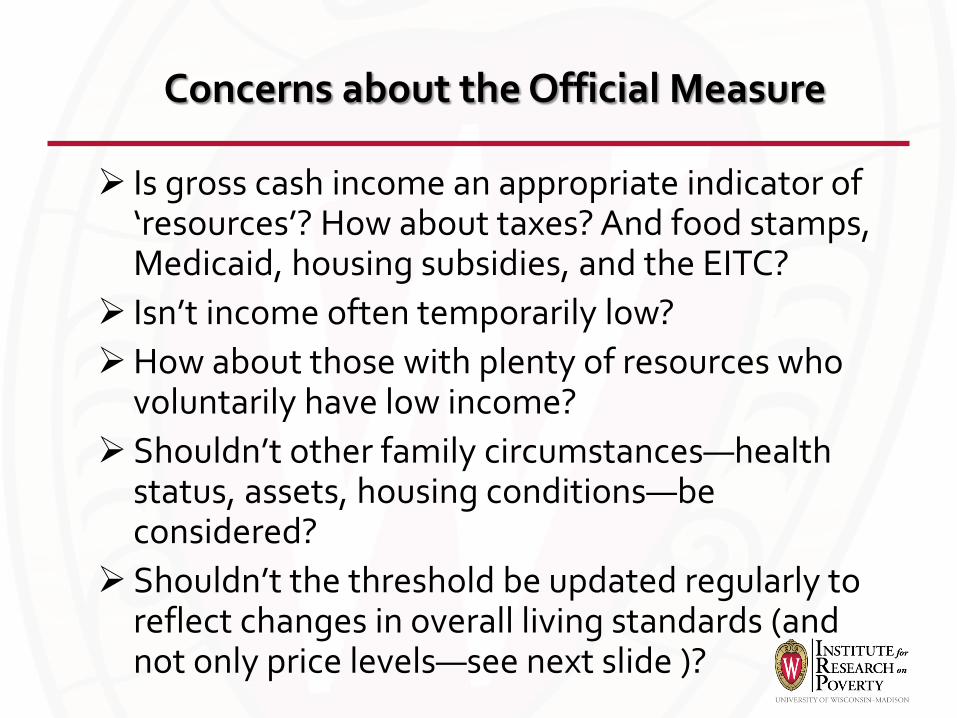
Concerns about the Official Measure
Is gross cash income an appropriate indicator of ‘resources’? How about taxes? And food stamps, Medicaid, housing subsidies, and the EITC?
Isn’t income often temporarily low? How about those with plenty of resources who
voluntarily have low income? Shouldn’t other family circumstances—health
status, assets, housing conditions—be considered?
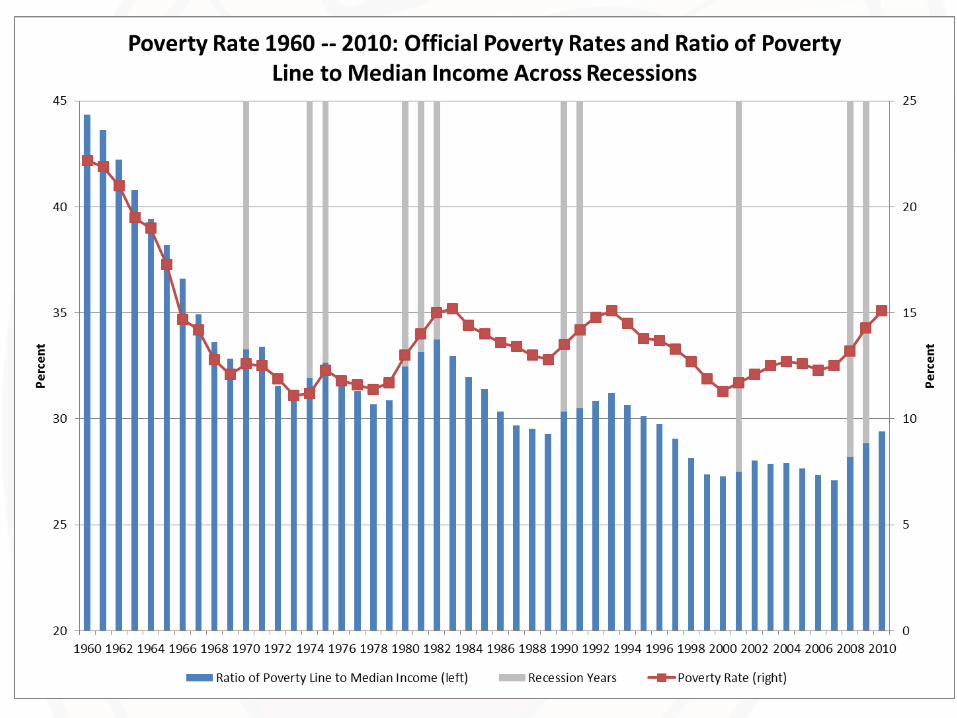
Shouldn’t the threshold be updated regularly to reflect changes in overall living standards (and not only price levels—see next slide )?
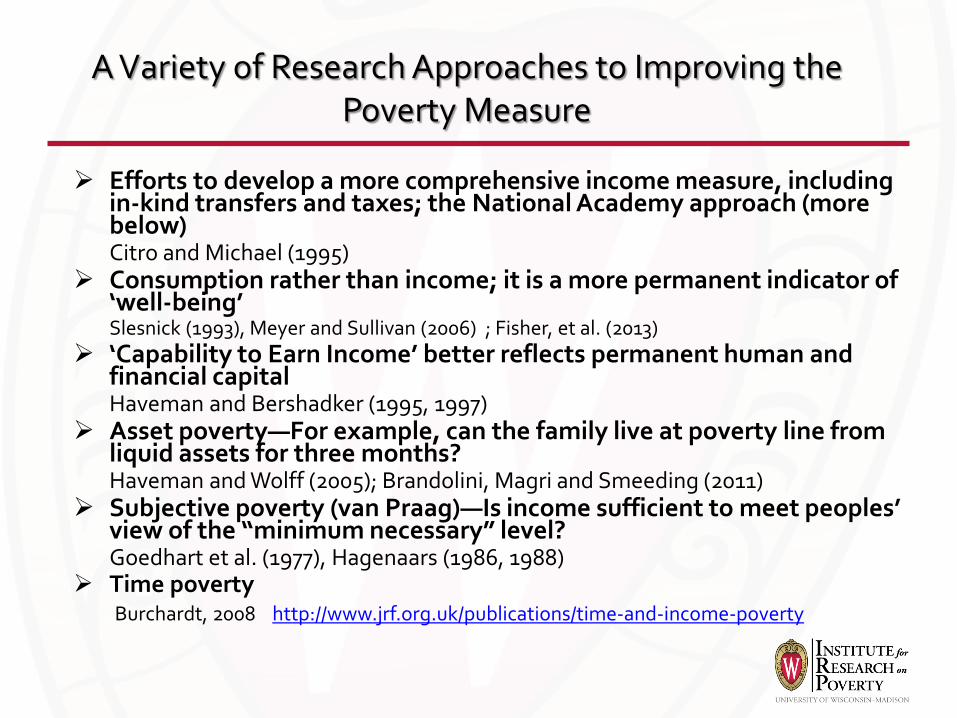
A Variety of Research Approaches to Improving the Poverty Measure
Efforts to develop a more comprehensive income measure, including in-kind transfers and taxes; the National Academy approach (more below)
Citro and Michael (1995) Consumption rather than income; it is a more permanent indicator of
‘well-being’ Slesnick (1993), Meyer and Sullivan (2006) ; Fisher, et al. (2013) ‘Capability to Earn Income’ better reflects permanent human and
financial capital
Haveman and Bershadker (1995, 1997) Asset poverty—For example, can the family live at poverty line from
liquid assets for three months? Haveman and Wolff (2005); Brandolini, Magri and Smeeding (2011) Subjective poverty (van Praag)—Is income sufficient to meet peoples’
view of the “minimum necessary” level? Goedhart et al. (1977), Hagenaars (1986, 1988) Time poverty Burchardt, 2008 http://www.jrf.org.uk/publications/time-and-income-poverty
And some video support: how is poverty measurement changing in the US?
• Poverty measurement video from Half in Ten, available at: http://www.youtube.com/watch?v=ChRKbT9ZLyo) • Poverty in America: http://www.npr.org/series/155932539/poverty-in-america • Should we change the poverty measure? The West Wing
political moment below: http://www.youtube.com/watch?v=VdeeF3-5CaE
Shouldn’t the Poverty Measure be a Relative Measure?
In the UK and the EU the basic income poverty measure is a relative measure.
In Europe, the threshold is taken to be 60 percent of median equivalent income.
Hence, the threshold moves up, or down as median income increases, or decreases over time.
The United States also has a supplemental poverty measure that is semi-relative––moving with the consumption of necessities by lower income families
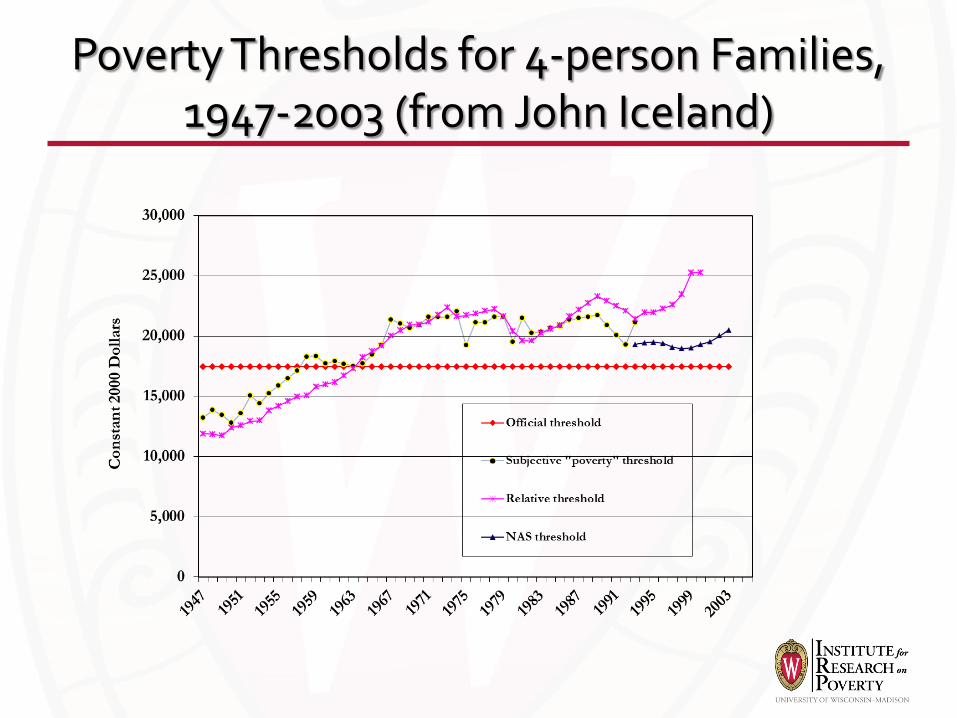
Poverty Thresholds for 4-person Families, 1947-2003 (from John Iceland)
How about both relative and positive measurers
together? The idea of anchored poverty • Relative (semi-relative) poverty (incomes less
than half the median) over, say, 10 years—answers the question ‘how do lower income families do relative to the average (median family)?’
• Anchored poverty—takes the relative (semi-relative) poverty line 10 years ago and prices it up year-to-year like an absolute poverty line––answers the question ‘is the standard of living of low-income people increasing or decreasing over time?’
Some Correlates of Living in Poverty
• Adults • Children • Elders • Neighborhoods
Why are Adults living in poverty?
• Un- or Underemployed • Low wages if working • Reliant on public income support • In poorer health (perhaps disabled?) • Poorly served by public services • Less involved in community and school
organizations • Discouraged and disheartened
Children who grow up poor are more likely to:
– Not attend preschool – Perform worse in school – Drop out of high school, have lower educational
attainment – (Girls) Have a teen birth – (Boys) Be incarcerated – Live in poverty as adults – Receive government assistance as adults – Have connection to the child welfare system – Have worse health and shorter life expectancy
24
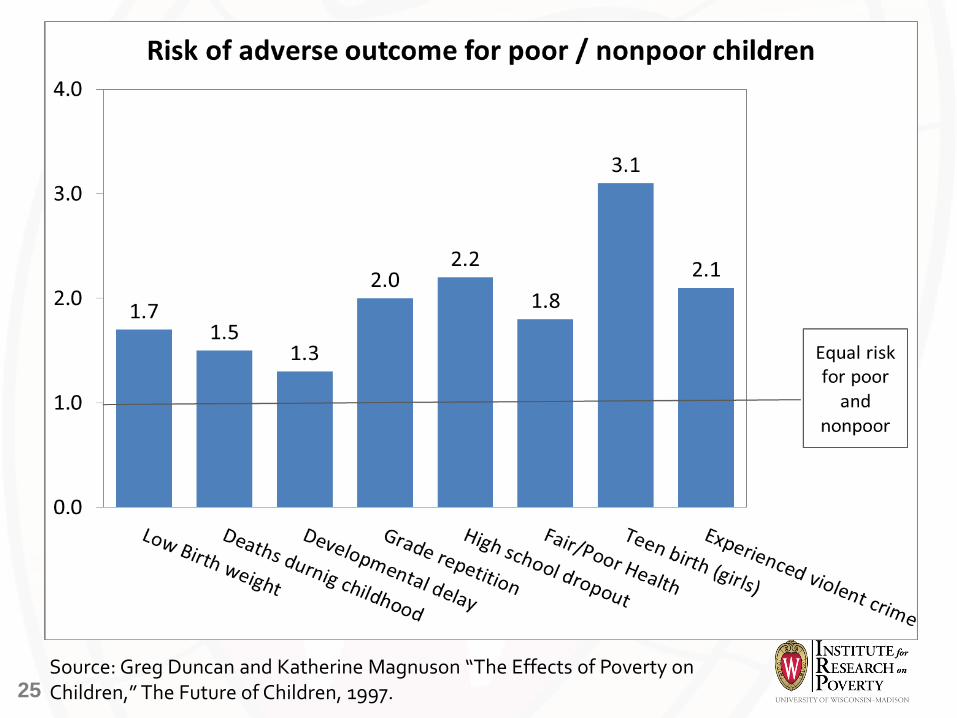
25 Source: Greg Duncan and Katherine Magnuson “The Effects of Poverty on Children,” The Future of Children, 1997.
Elders who are poor are --
• Older • Likely single people living alone • Exhausted assets • Poorer health • Incapable of doing all normal tasks of daily life
without the help of others (family, friends, paid caretakers)
• At risk of institutionalization (SNFs)
Neighborhoods with High Poverty Rates tend to be:
• More dangerous • Poorer schools • More run down • Poorer housing quality • Fewer community services and amenities • More discouraged people
More from class
• What have we missed?
Some References
• http://www.irp.wisc.edu/faqs.htm • Citro, Constance F., and Robert T. Michael, eds. 1995. Measuring Poverty: A New Approach. Washington,
DC: National Academy Press. • Haveman, Robert, and Andrew Bershadker. 2001. “The ‘Inability to be Self-Reliant’ as an Indicator of
Poverty: Trends for the U.S., 1975–1997.” Review of Income and Wealth 47(3): 335–360. • Slesnick, Daniel T. 1993. “Gaining Ground: Poverty in the Postwar United States.” Journal of Political
Economy 101(1): 1–38. • Haveman, Robert. 2009. “What Does it Mean to be Poor in a Rich Society?” In Maria Cancian and Sheldon
Danziger, eds. Changing Poverty, Changing Policies. New York: Russell Sage Foundation, 2009. • Meyer, Bruce & James X. Sullivan, 2009. "Five Decades of Consumption and Income Poverty," NBER
Working Papers 14827, National Bureau of Economic Research, Inc. • Brandolini, Andrea, Silvia Magri & Timothy M. Smeeding, 2010. "Asset-based measurement of
poverty," Journal of Policy Analysis and Management, John Wiley & Sons, Ltd., vol. 29(2), pages 267-284. • Haveman, Robert & Edward Wolff, 2005. "The concept and measurement of asset poverty: Levels, trends
and composition for the U.S., 1983–2001," Journal of Economic Inequality, Springer, vol. 2(2), pages 145-169, January.
• Burchardt, T., J. LeGrande, and D. Piachaud. 2002. “Degrees of Exclusion: Developing a Dynamic Multidimensional Measure.” In Understanding Social Exclusion, edited by J. Hills, J. Le Grand, and D. Pichaud. Oxford University Press.
Some more references
• DeParle, Jason. 1997. “Learning Poverty Firsthand.” New York Times Magazine (April 27): 33–35. • Edsall, T. 2013. “The hidden prosperity of the poor?” NY Times, January 30, at:
http://opinionator.blogs.nytimes.com/2013/01/30/the-hidden-prosperity-of-the-poor/ • Johnson, D., and T. Smeeding. 2012. A consumer's guide to interpreting various U.S. poverty
measures. IRP, Fast Focus No. 14-2012, August. http://www.irp.wisc.edu/publications/fastfocus/pdfs/FF14-2012.pdf
• Smeeding, Timothy. Winter 2008. “Poorer by Comparison: Poverty, Work, and Public Policy in Comparative Perspective.” Pathways. Stanford Center on Poverty and Inequality.
• “Middle Class in America.” 2010. Focus 27(1), Summer. University of Wisconsin–Madison, Institute for Research on Poverty. Available at http://www.irp.wisc.edu/publications/focus/pdfs/foc271a.pdf
• Kenworthy, Lane. 2012. “It’s Hard to Make It in America: How the United States Stopped Being the Land of Opportunity” Foreign Affairs. Volume 91 No. 6: 97-109