Embed Size (px)
Citation preview

Perspectives on Extreme Weather
December 14, 2012
Frank NutterPresident , Reinsurance Association of America
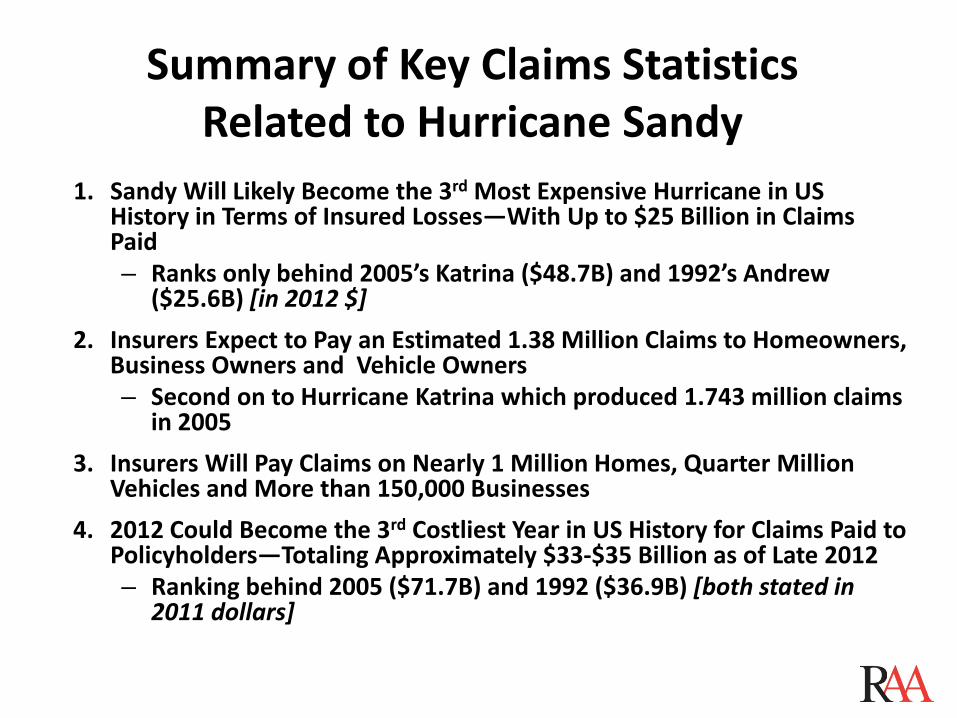
Summary of Key Claims StatisticsRelated to Hurricane Sandy
1. Sandy Will Likely Become the 3rd Most Expensive Hurricane in US History in Terms of Insured Losses—With Up to $25 Billion in Claims Paid– Ranks only behind 2005’s Katrina ($48.7B) and 1992’s Andrew
($25.6B) [in 2012 $]2. Insurers Expect to Pay an Estimated 1.38 Million Claims to Homeowners,
Business Owners and Vehicle Owners– Second on to Hurricane Katrina which produced 1.743 million claims
in 20053. Insurers Will Pay Claims on Nearly 1 Million Homes, Quarter Million
Vehicles and More than 150,000 Businesses 4. 2012 Could Become the 3rd Costliest Year in US History for Claims Paid to
Policyholders—Totaling Approximately $33‐$35 Billion as of Late 2012– Ranking behind 2005 ($71.7B) and 1992 ($36.9B) [both stated in
2011 dollars]
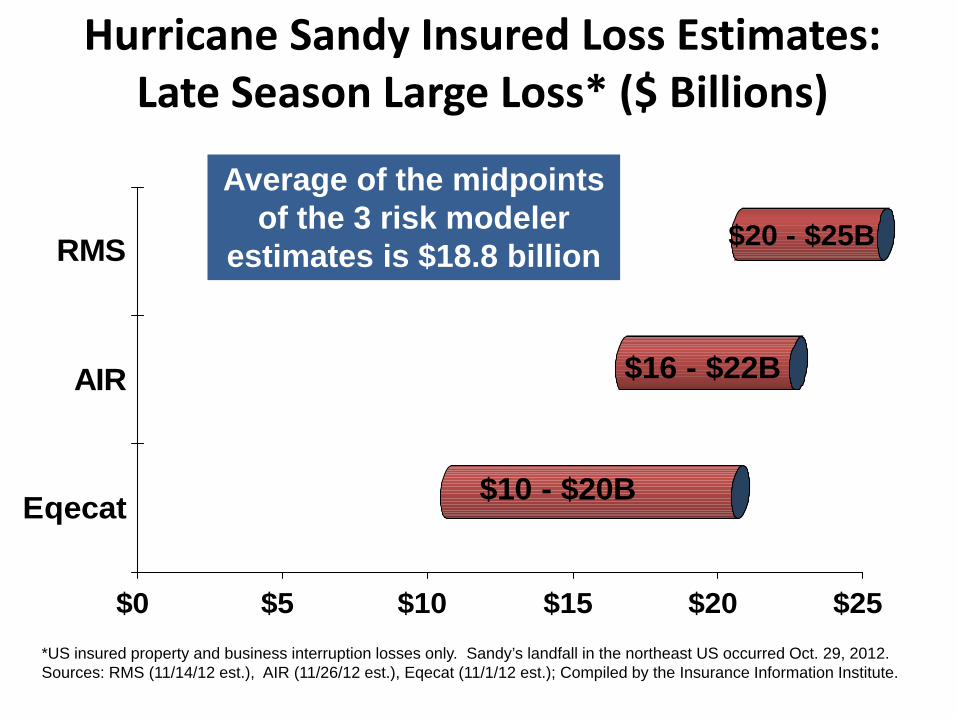
Hurricane Sandy Insured Loss Estimates:Late Season Large Loss* ($ Billions)
$10 - $20B
$16 - $22B
$20 - $25B
$0 $5 $10 $15 $20 $25
Eqecat
AIR
RMS
*US insured property and business interruption losses only. Sandy’s landfall in the northeast US occurred Oct. 29, 2012.Sources: RMS (11/14/12 est.), AIR (11/26/12 est.), Eqecat (11/1/12 est.); Compiled by the Insurance Information Institute.
Average of the midpoints of the 3 risk modeler
estimates is $18.8 billion
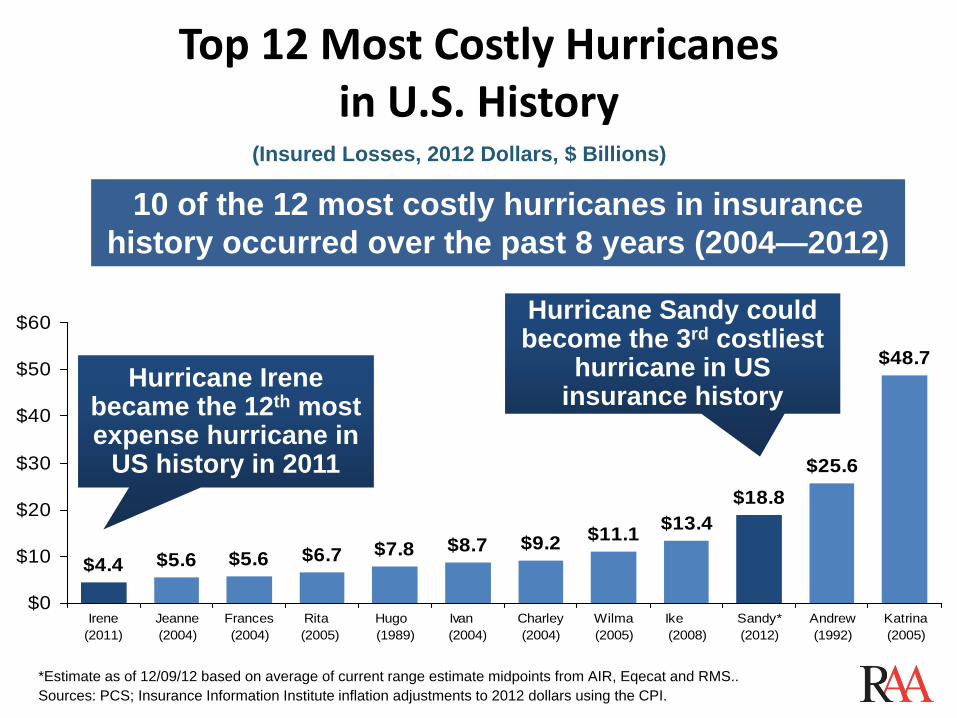
Top 12 Most Costly Hurricanesin U.S. History
(Insured Losses, 2012 Dollars, $ Billions)
*Estimate as of 12/09/12 based on average of current range estimate midpoints from AIR, Eqecat and RMS..Sources: PCS; Insurance Information Institute inflation adjustments to 2012 dollars using the CPI.
$9.2 $11.1 $13.4$18.8
$25.6
$48.7
$8.7$7.8$6.7$5.6$5.6$4.4
$0
$10
$20
$30
$40
$50
$60
Irene(2011)
Jeanne(2004)
Frances(2004)
Rita (2005)
Hugo (1989)
Ivan (2004)
Charley(2004)
Wilma(2005)
Ike (2008)
Sandy*(2012)
Andrew(1992)
Katrina(2005)
Hurricane Sandy could become the 3rd costliest
hurricane in US insurance historyHurricane Irene
became the 12th most expense hurricane in
US history in 2011
10 of the 12 most costly hurricanes in insurance history occurred over the past 8 years (2004—2012)
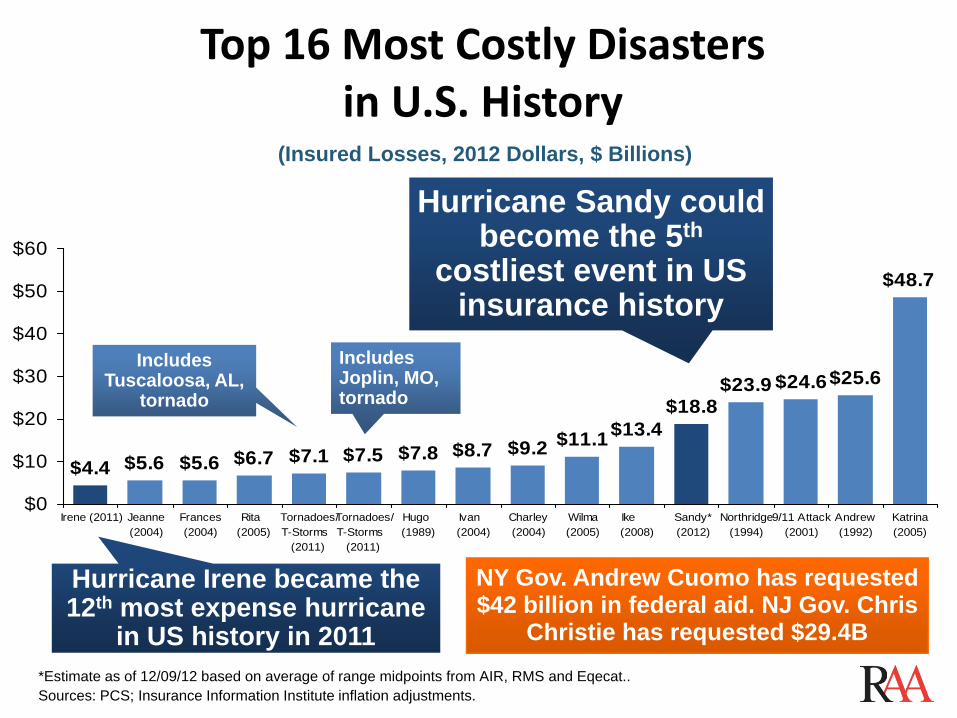
Top 16 Most Costly Disastersin U.S. History
(Insured Losses, 2012 Dollars, $ Billions)
*Estimate as of 12/09/12 based on average of range midpoints from AIR, RMS and Eqecat..Sources: PCS; Insurance Information Institute inflation adjustments.
$7.8 $8.7 $9.2 $11.1$13.4$18.8
$23.9 $24.6$25.6
$48.7
$7.5$7.1$6.7$5.6$5.6$4.4
$0
$10
$20
$30
$40
$50
$60
Irene (2011) Jeanne(2004)
Frances(2004)
Rita (2005)
Tornadoes/T-Storms
(2011)
Tornadoes/T-Storms
(2011)
Hugo (1989)
Ivan (2004)
Charley(2004)
Wilma(2005)
Ike (2008)
Sandy*(2012)
Northridge(1994)
9/11 Attack(2001)
Andrew(1992)
Katrina(2005)
Hurricane Sandy could become the 5th
costliest event in US insurance history
Hurricane Irene became the 12th most expense hurricane
in US history in 2011
Includes Tuscaloosa, AL,
tornado
Includes Joplin, MO, tornado
NY Gov. Andrew Cuomo has requested $42 billion in federal aid. NJ Gov. Chris
Christie has requested $29.4B
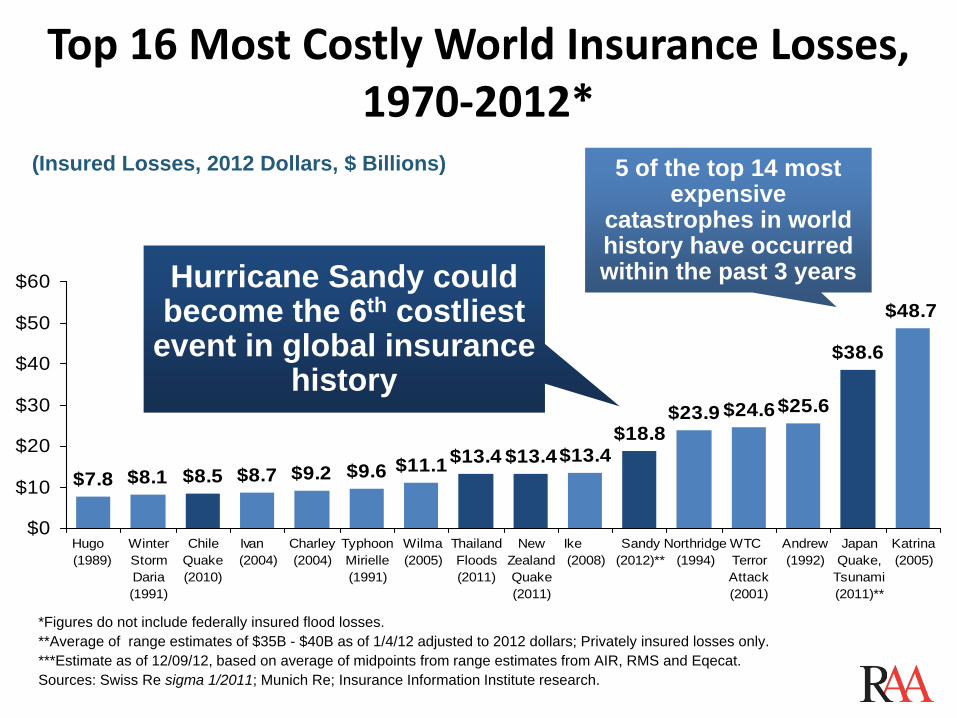
Top 16 Most Costly World Insurance Losses, 1970‐2012*
(Insured Losses, 2012 Dollars, $ Billions)
*Figures do not include federally insured flood losses.**Average of range estimates of $35B - $40B as of 1/4/12 adjusted to 2012 dollars; Privately insured losses only.***Estimate as of 12/09/12, based on average of midpoints from range estimates from AIR, RMS and Eqecat.Sources: Swiss Re sigma 1/2011; Munich Re; Insurance Information Institute research.
$11.1$13.4 $13.4$13.4$18.8
$23.9 $24.6$25.6
$38.6
$48.7
$7.8 $8.1 $8.5 $8.7 $9.2 $9.6
$0
$10
$20
$30
$40
$50
$60
Hugo (1989)
WinterStormDaria(1991)
ChileQuake(2010)
Ivan (2004)
Charley(2004)
TyphoonMirielle(1991)
Wilma(2005)
ThailandFloods(2011)
NewZealandQuake(2011)
Ike (2008)
Sandy(2012)**
Northridge(1994)
WTC TerrorAttack(2001)
Andrew(1992)
JapanQuake,
Tsunami(2011)**
Katrina(2005)
5 of the top 14 most expensive
catastrophes in world history have occurred within the past 3 yearsHurricane Sandy could
become the 6th costliest event in global insurance
history
$12.
3
$10.
7
$3.7
$14.
0
$11.
3
$6.0
$33.
9
$7.4 $1
5.9
$32.
9
$71.
7
$10.
3
$7.3
$28.
5
$11.
2
$14.
1
$32.
3
$34.
0
$13.
7
$4.7 $7
.8
$36.
9
$8.6
$25.
8
$0
$10
$20
$30
$40
$50
$60
$70
$80
89 90 91 92 93 94 95 96 97 98 99 00 01 02 03 04 05 06 07 08 09 10 11 12*
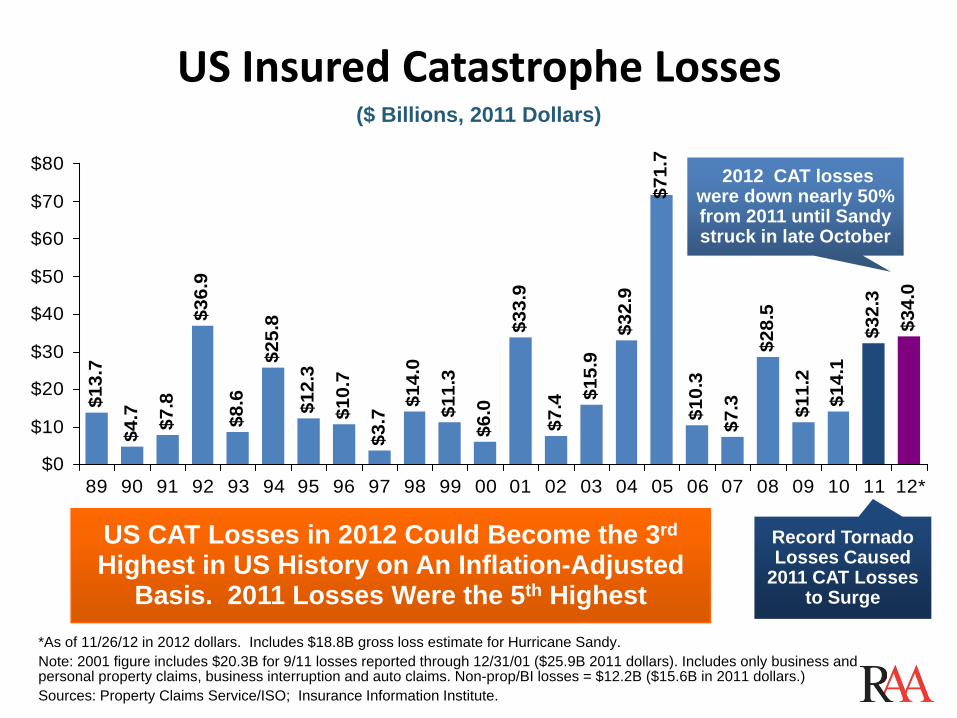
US Insured Catastrophe Losses
*As of 11/26/12 in 2012 dollars. Includes $18.8B gross loss estimate for Hurricane Sandy.Note: 2001 figure includes $20.3B for 9/11 losses reported through 12/31/01 ($25.9B 2011 dollars). Includes only business andpersonal property claims, business interruption and auto claims. Non-prop/BI losses = $12.2B ($15.6B in 2011 dollars.) Sources: Property Claims Service/ISO; Insurance Information Institute.
US CAT Losses in 2012 Could Become the 3rd
Highest in US History on An Inflation-Adjusted Basis. 2011 Losses Were the 5th Highest
2012 CAT losses were down nearly 50% from 2011 until Sandy struck in late October
Record Tornado Losses Caused
2011 CAT Losses to Surge
($ Billions, 2011 Dollars)
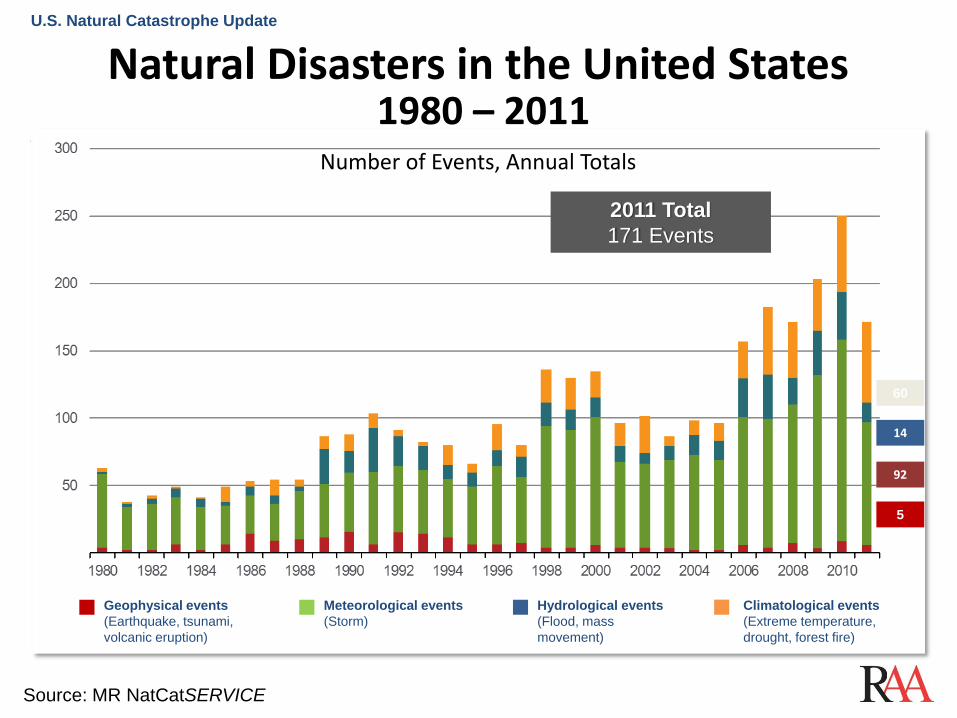
Natural Disasters in the United States1980 – 2011
Number of Events, Annual Totals
Meteorological events(Storm)
Hydrological events(Flood, mass movement)
Climatological events(Extreme temperature, drought, forest fire)
Geophysical events(Earthquake, tsunami, volcanic eruption)
2011 Total171 Events
5
92
14
60
U.S. Natural Catastrophe Update
Source: MR NatCatSERVICE
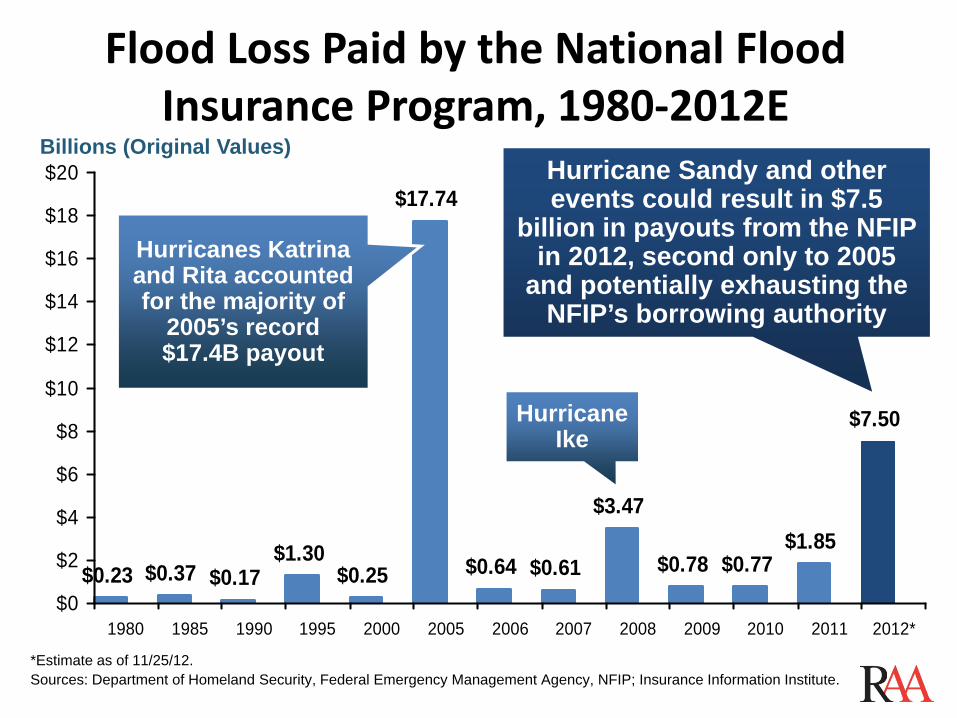
Flood Loss Paid by the National Flood Insurance Program, 1980‐2012E
*Estimate as of 11/25/12.Sources: Department of Homeland Security, Federal Emergency Management Agency, NFIP; Insurance Information Institute.
Billions (Original Values)
$0.23 $0.37 $0.17$1.30
$0.25
$17.74
$0.64 $0.61
$3.47
$0.78 $0.77$1.85
$7.50
$0
$2
$4
$6
$8
$10
$12
$14
$16
$18
$20
1980 1985 1990 1995 2000 2005 2006 2007 2008 2009 2010 2011 2012*
Hurricanes Katrina and Rita accounted for the majority of
2005’s record $17.4B payout
Hurricane Ike
Hurricane Sandy and other events could result in $7.5
billion in payouts from the NFIP in 2012, second only to 2005
and potentially exhausting the NFIP’s borrowing authority

Number of Federal Disaster Declarations, 1953‐2012*
1317 18 16 16
7 712 12
22 2025 25
11 1119
2917 17
48 46 4638
3022 25
4223
1524 21
3427 28
2311
3138
4532
3632
7544
6550
45 4549
5669
4852
6375
5981
994643
0
20
40
60
80
100
120
53 54 55 56 57 58 59 60 61 62 63 64 65 66 67 68 69 70 71 72 73 74 75 76 77 78 79 80 81 82 83 84 85 86 87 88 89 90 91 92 93 94 95 96 97 98 99 00 01 02 03 04 05 06 07 08 09 10 11 12
*Through Dec. 6, 2012.Source: Federal Emergency Management Administration; http://www.fema.gov/disasters; Insurance Information Institute.
The Number of Federal Disaster Declarations Is Rising and Set New Records in 2010 and 2011. Hurricane Sandy Produced 9 Declarations in 2012.
The number of federal disaster declarations set a
new record in 2011, with 99, shattering 2010’s record 81
declarations.
There have been 2,081 federal disaster
declarations since 1953. The average
number of declarations per year is 35 from
1953-2011, though that few haven’t been
recorded since 1995.
46 federal disasters were declared through
Dec. 6, 2012

Federal Aid Requests by States With Greatest Sandy Impact (as of 12/10/12)
*As of Dec. 10, 2012. Source: New York Times, Dec. 6, 2012; Insurance Information Institute.
Billions
$0
$10
$20
$30
$40
$50
$60
$70
New York New Jersey Connecticut Obama AdministrationProposal
Mitigation/PreventionRepair
States Are Requesting Enormous Sums in Sandy Aid in the Middle of a Massive Budget Struggle at the Edge of the “Fiscal Cliff”
$33.0
$7.4
$29.5
$42.0$9.0
$36.9
$33B to repair subways, hospitals and other
facilities; $9B to upgrade infrastructure against future storms
$3.2
$60.4*
$39.5B to repair schools roads, bridges,
businesses, homes and other facilities; $7.4B to
for mitigation and prevention against future
storms$3.2B to bury power
lines, upgrade transmission
systems, build sewage treatment plants and other
mitigation projects

Resiliency Strategies• Incorporate extreme weather risk in development, building codes,
insurance risk pricing and assessment.
• Eliminate subsidies associated with insurance.
• Risk‐based pricing of insurance• State sponsored program for low income consumers
• Insurance coverage flexibility for consumers• Insurers credit hazard mitigation.• Reform the NFIP.
– Reflect extreme weather risk– Risk‐based pricing
• Use nature to mitigate damage and protect lives and property.
• Provide tax credits for specified mitigation and resiliency.
Strategies, cont’d• Federal standards for state / local building codes
• Create revolving fund to offer loans to homeowners who want to strengthen their property.
• Limit the number of times coastal residents receive insurance reimbursement / disaster assistance.
• Purchase or relocate properties near coastal or river areas at repeat risk.
• Transfer development rights from coastal and river properties to areas inland. (Coastal Barrier Resource Act)
• Remote sensing is a critical asset that needs new funding.
• Role/utilization of the Army Corps and Congressional interests.
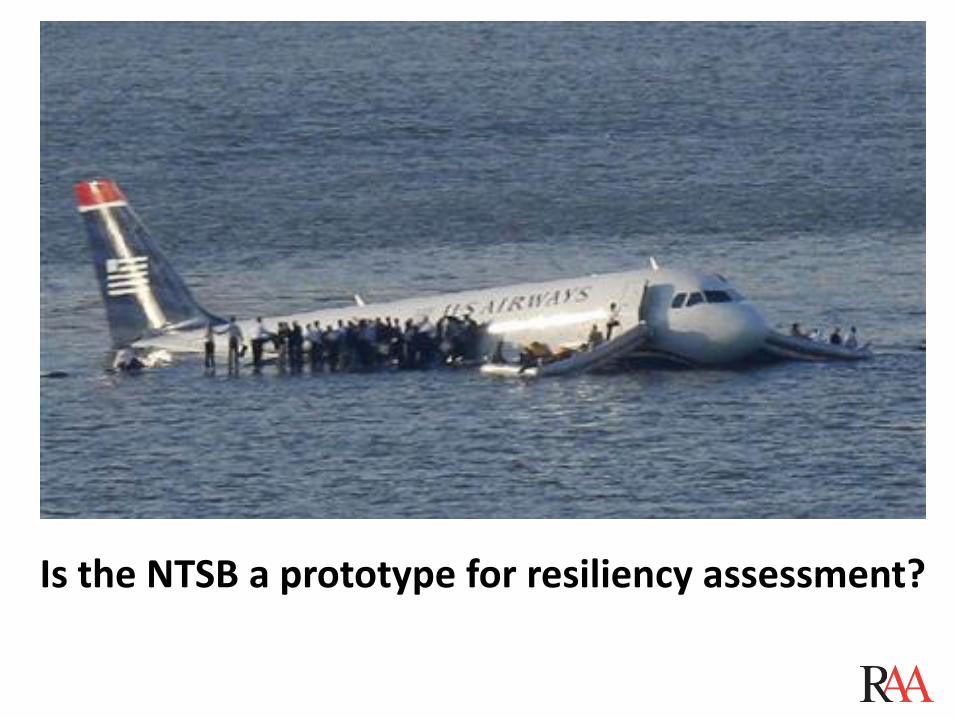
Is the NTSB a prototype for resiliency assessment?

www.reinsurance.org