Embed Size (px)
DESCRIPTION
Perspectives on Coastal User Needs, Products and Observing Systems. Paul M. DiGiacomo Chief, Satellite Oceanography & Climatology Division NOAA-NESDIS Center for Satellite Applications and Research (STAR) NOAA-NESDIS Cooperative Research Program - PowerPoint PPT Presentation
Citation preview
Perspectives on Coastal User Needs, Products and Observing Systems
Paul M. DiGiacomoChief, Satellite Oceanography
& Climatology Division
NOAA-NESDIS Center for Satellite Applications and Research (STAR)
NOAA-NESDIS Cooperative Research Program 10th Annual Science Symposium: “Satellites and Society”
NOAA-CREST Center, City College of New York9 September 2014
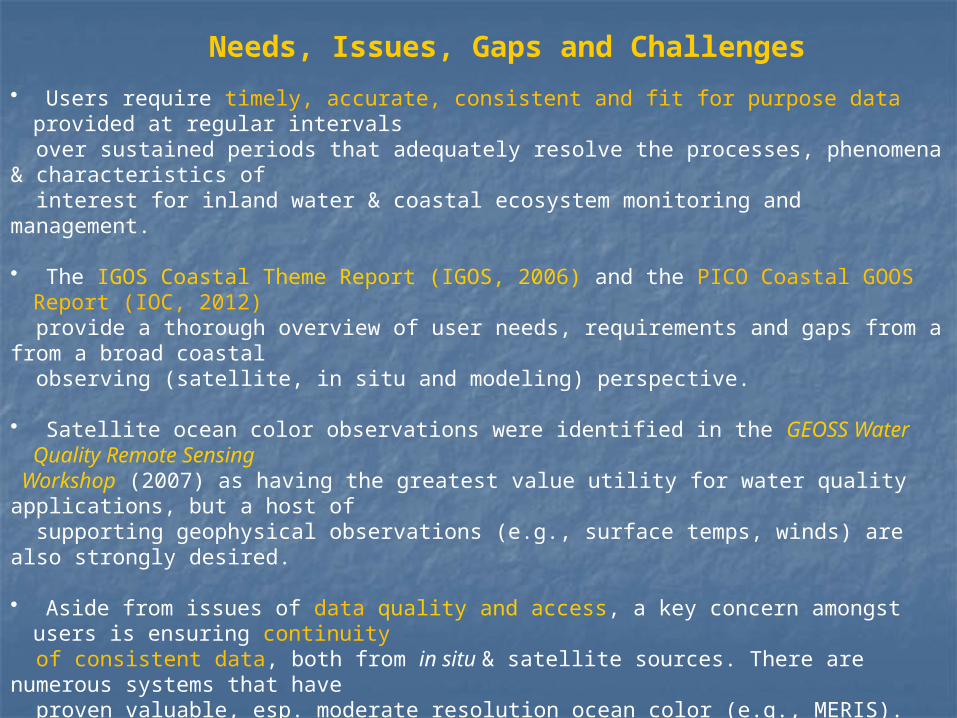
• Users require timely, accurate, consistent and fit for purpose data provided at regular intervals over sustained periods that adequately resolve the processes, phenomena & characteristics of interest for inland water & coastal ecosystem monitoring and management.
• The IGOS Coastal Theme Report (IGOS, 2006) and the PICO Coastal GOOS Report (IOC, 2012)
provide a thorough overview of user needs, requirements and gaps from a from a broad coastal observing (satellite, in situ and modeling) perspective. • Satellite ocean color observations were identified in the GEOSS Water Quality Remote Sensing Workshop (2007) as having the greatest value utility for water quality applications, but a host of supporting geophysical observations (e.g., surface temps, winds) are also strongly desired.
• Aside from issues of data quality and access, a key concern amongst users is ensuring continuity
of consistent data, both from in situ & satellite sources. There are numerous systems that have proven valuable, esp. moderate resolution ocean color (e.g., MERIS). Potential continuity is available (e.g., Sentinel-3/OLCI) but data needs to be made readily available to diverse users.
• That said, existing/planned satellite observing capabilities potentially provide inadequate spatial,
temporal and/or spectral resolution of important biological and geophysical parameters for inland water and coastal ecosystem applications, with some key measurements not made at all from space (e.g. estimates of river discharge).
• Further, additional efforts are required to support application development, bringing together data
providers and users in coordinated, integrated activities (especially across the land-sea interface).
Needs, Issues, Gaps and Challenges
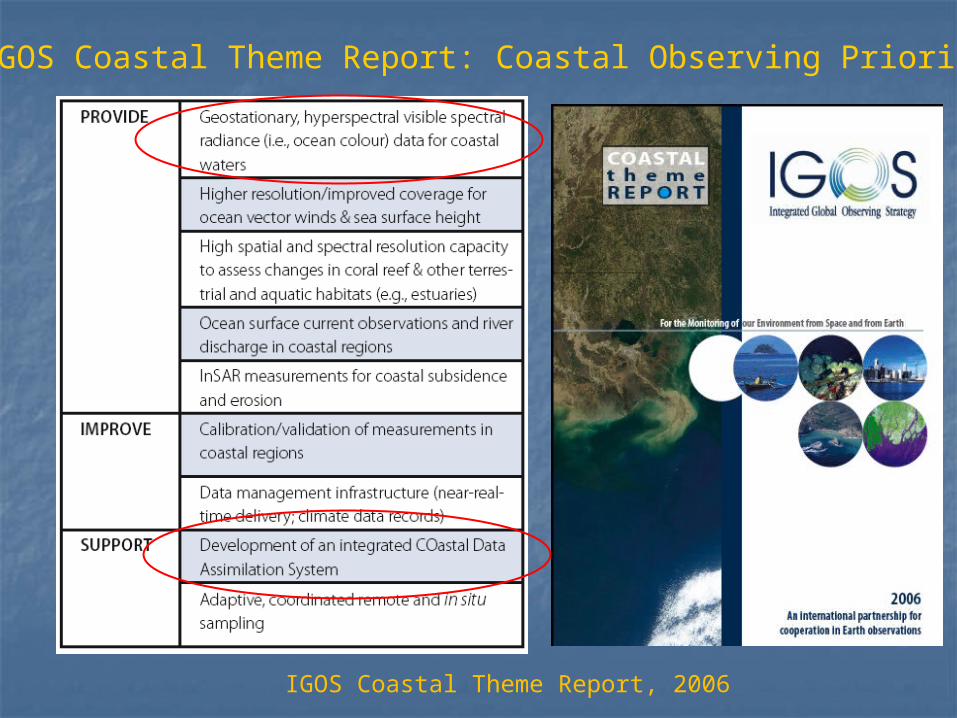
IGOS Coastal Theme Report: Coastal Observing Priorities
IGOS Coastal Theme Report, 2006
The “PICO” Coastal GOOS Plan, 2012Available at: http://www.ioc-goos.org
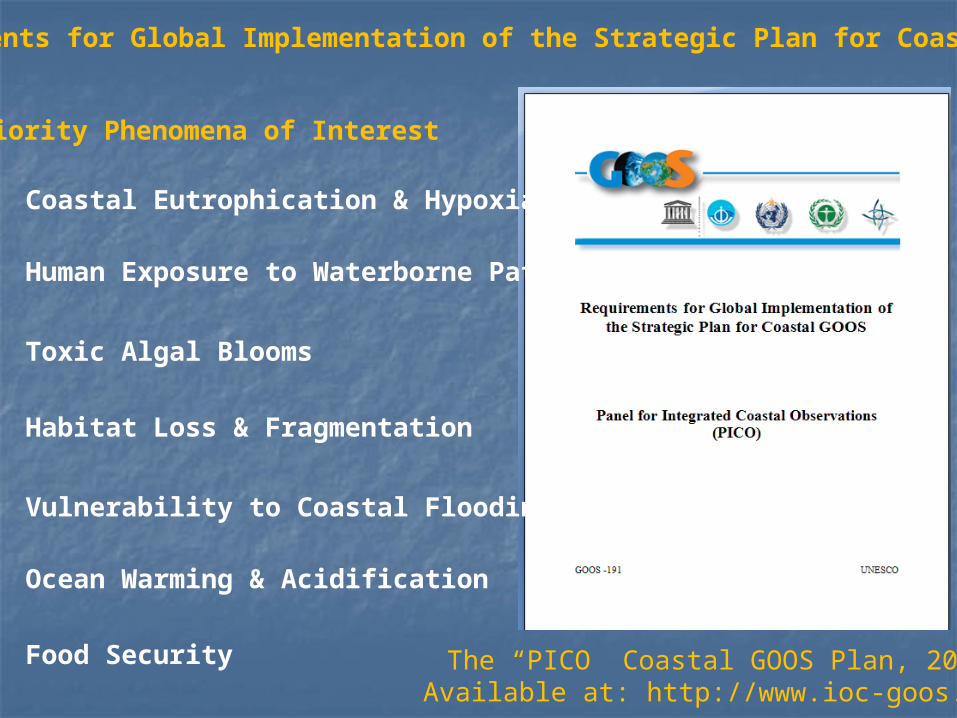
Priority Phenomena of Interest
Coastal Eutrophication & Hypoxia
Human Exposure to Waterborne Pathogens
Habitat Loss & Fragmentation
Ocean Warming & Acidification
Toxic Algal Blooms
Food Security
Vulnerability to Coastal Flooding
Requirements for Global Implementation of the Strategic Plan for Coastal GOOS
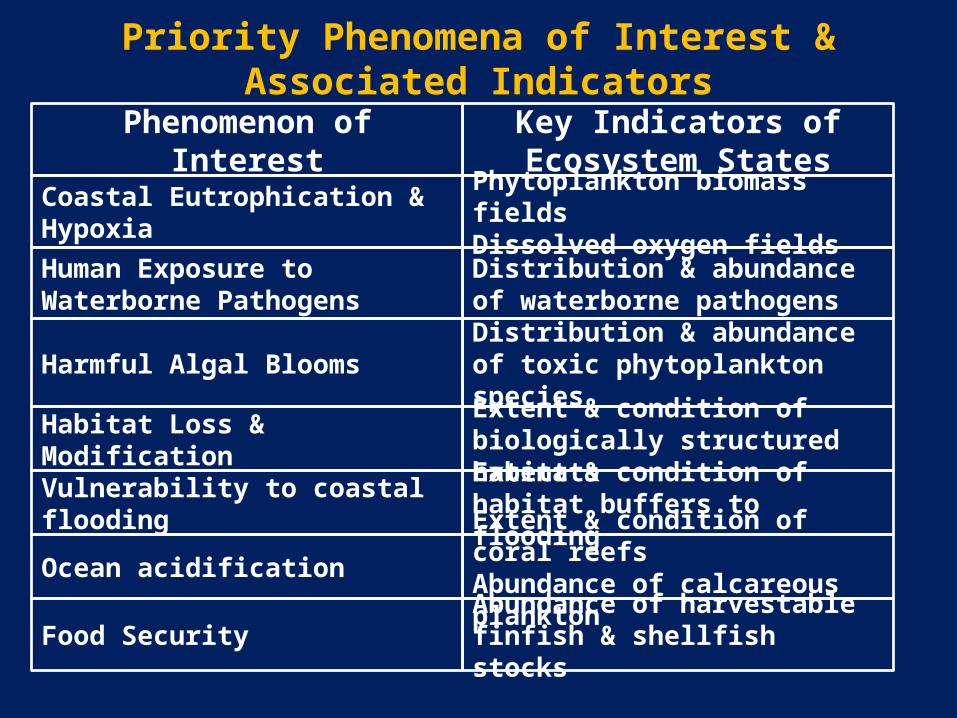
Priority Phenomena of Interest & Associated Indicators
Phenomenon of Interest
Coastal Eutrophication & Hypoxia
Human Exposure to Waterborne Pathogens
Habitat Loss & Modification
Ocean acidification
Harmful Algal Blooms
Food Security
Key Indicators of Ecosystem States
Phytoplankton biomass fieldsDissolved oxygen fieldsDistribution & abundance of waterborne pathogens
Distribution & abundance of toxic phytoplankton species
Extent & condition of biologically structured habitats
Extent & condition of coral reefsAbundance of calcareous planktonAbundance of harvestable finfish & shellfish stocks
Vulnerability to coastal flooding Extent & condition of habitat buffers to flooding
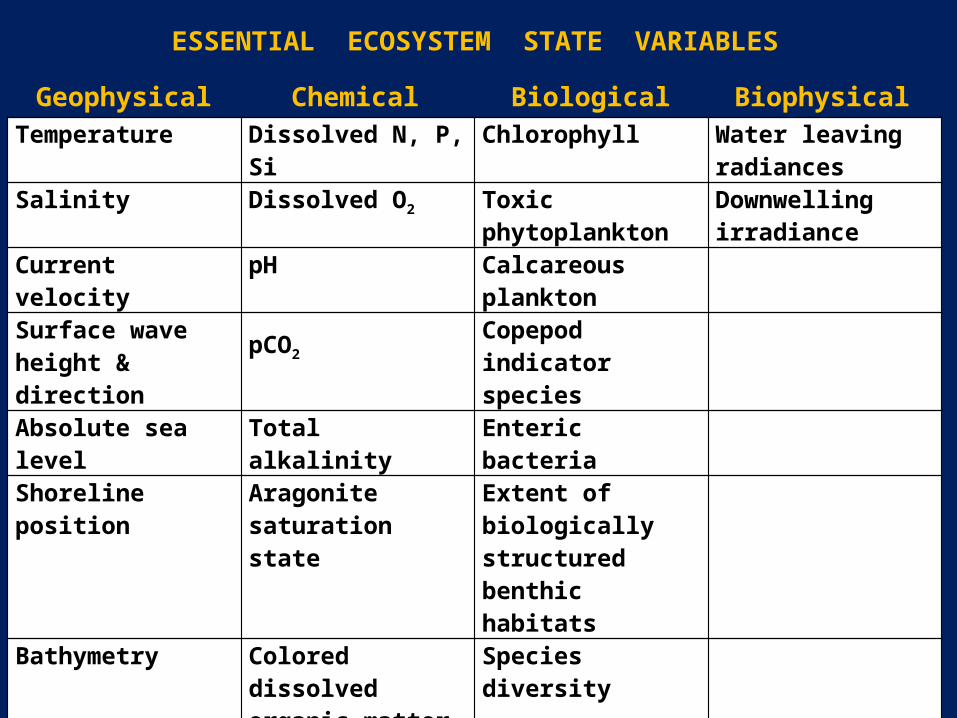
Temperature Dissolved N, P, Si Chlorophyll Water leaving radiances
Salinity Dissolved O2 Toxic phytoplankton Downwelling irradiance
Current velocity pH Calcareous planktonSurface wave height & direction
pCO2Copepod indicator species
Absolute sea level Total alkalinity Enteric bacteria
Shoreline position Aragonite saturation state
Extent of biologically structured benthic habitats
Bathymetry Colored dissolved organic matter
Species diversity
Sea surface roughness
Exploitable fish stocks
Total suspended matter
Bycatch
Large pelagic predators
ESSENTIAL ECOSYSTEM STATE VARIABLES
Geophysical Chemical Biological Biophysical
NOAA Ocean and Coastal Ecosystem Interests & Observing Needs
• NOAA helps to manage society’s use of ocean and coastal ecosystems, sustain natural resources and ecosystem health and services, and protect public health under several legislative & executive mandates, e.g.,
The Coastal Zone Management ActCoral Reef Protection Executive Order/Coral Reef Conservation Act The Clean Water Act The Harmful Algal Bloom and Hypoxia Research & Control ActThe Magnuson-Stevens Fishery Conservation and Management
Reauthorization Act The Marine Mammal Protection Act The National Coastal Monitoring Act The National Marine Sanctuaries Act
• Satellite data (e.g., ocean color and SST) and derived products are invaluable sources of information to help address these mandates and other important coastal management as well as research and other needs.
• Many challenges as well as opportunities exist in terms of bringing together data/ information providers and users in this context.
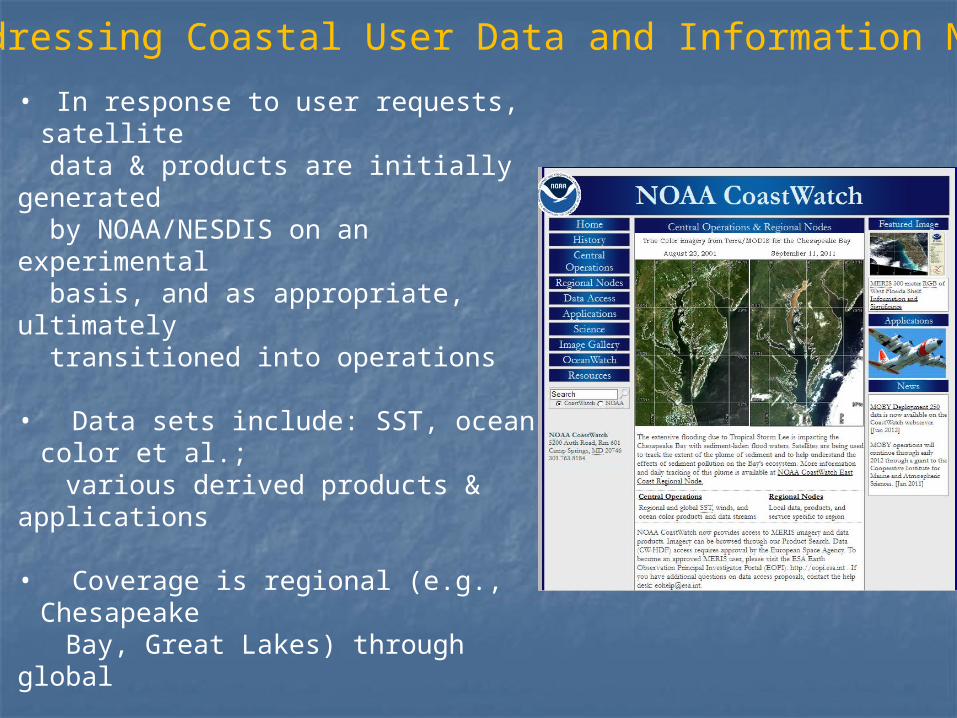
Addressing Coastal User Data and Information Needs
• In response to user requests, satellite data & products are initially generated by NOAA/NESDIS on an experimental basis, and as appropriate, ultimately transitioned into operations
• Data sets include: SST, ocean color et al.;
various derived products & applications
• Coverage is regional (e.g., Chesapeake Bay, Great Lakes) through global
• Distribution mechanisms include:
• NOAA CoastWatch http://coastwatch.noaa.gov/
• NOAA Coral Reef Watch http://coralreefwatch.noaa.gov/
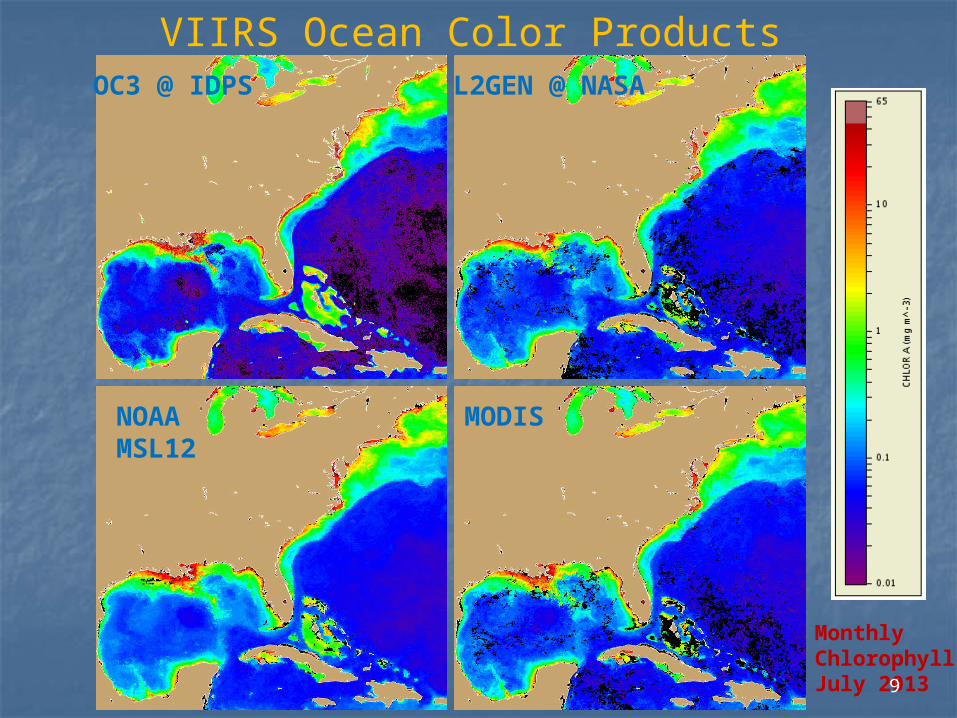
L2GEN @ NASA
MODISNOAAMSL12
OC3 @ IDPS
Monthly ChlorophyllJuly 20139
VIIRS Ocean Color Products
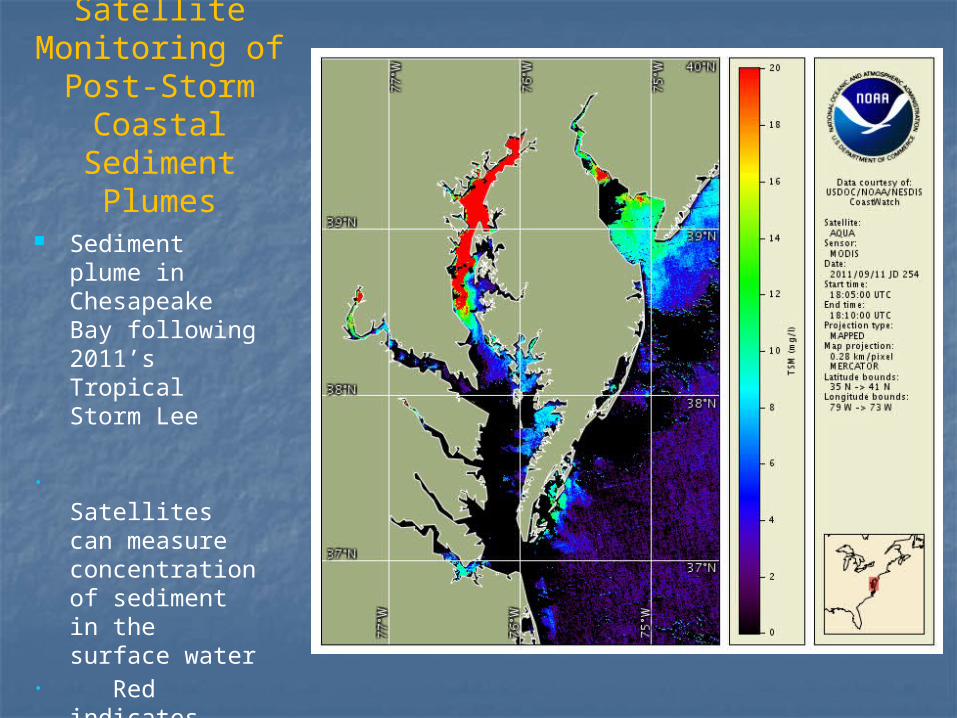
Satellite Monitoring of Post-Storm
Coastal Sediment Plumes
Sediment plume in Chesapeake Bay following 2011’s Tropical Storm Lee
• Satellites can measure concentration of sediment in the surface water
• Red indicates high sediment concentration as a result of storm runoff from land
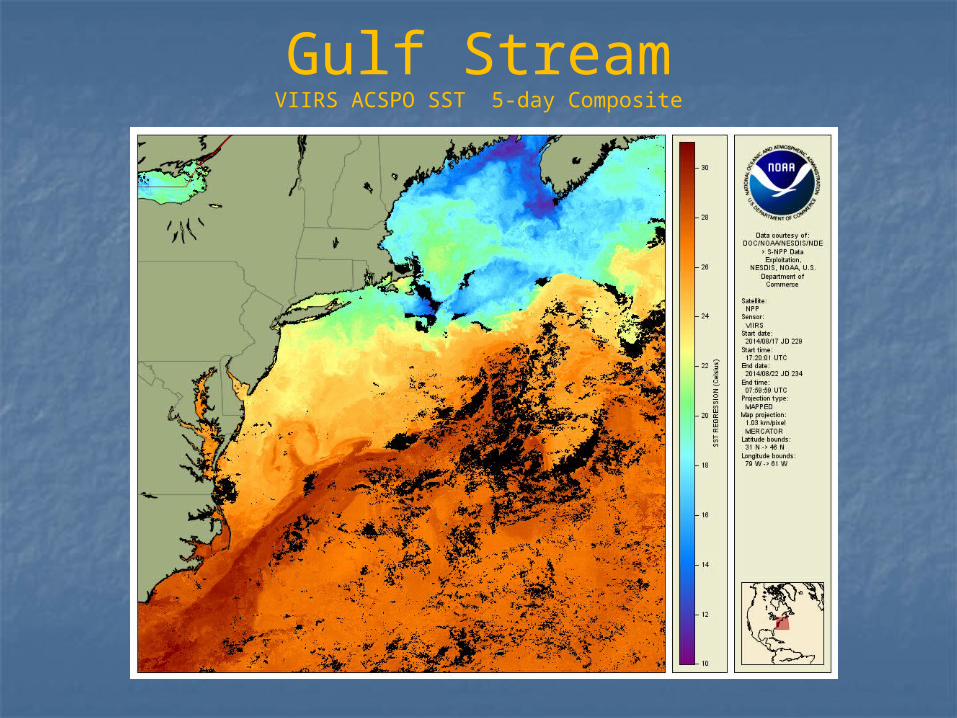
Gulf StreamVIIRS ACSPO SST 5-day Composite
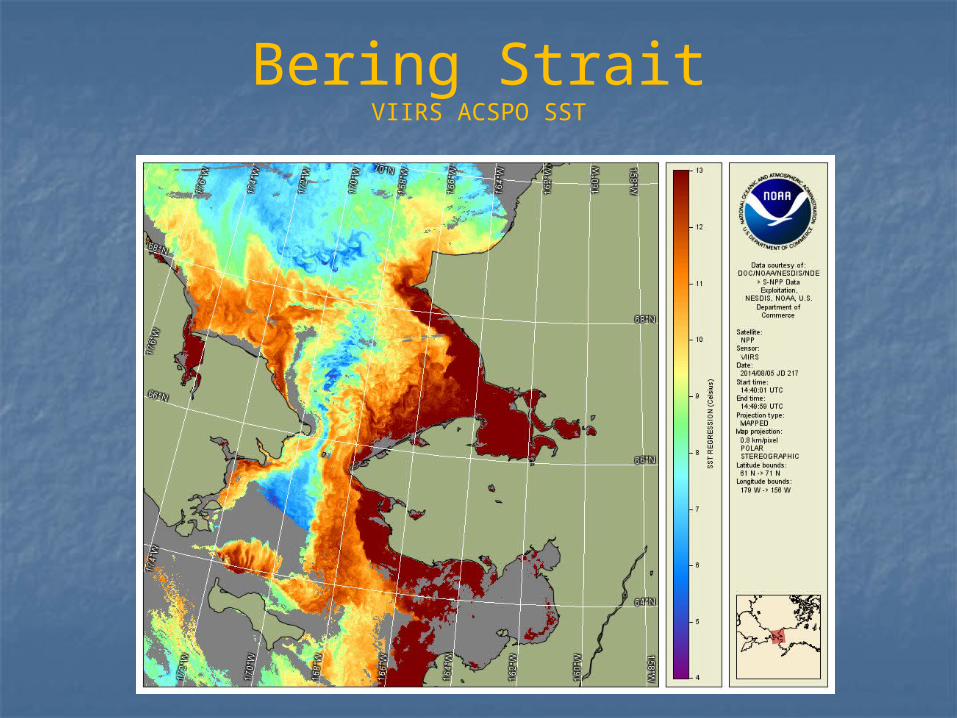
Bering StraitVIIRS ACSPO SST
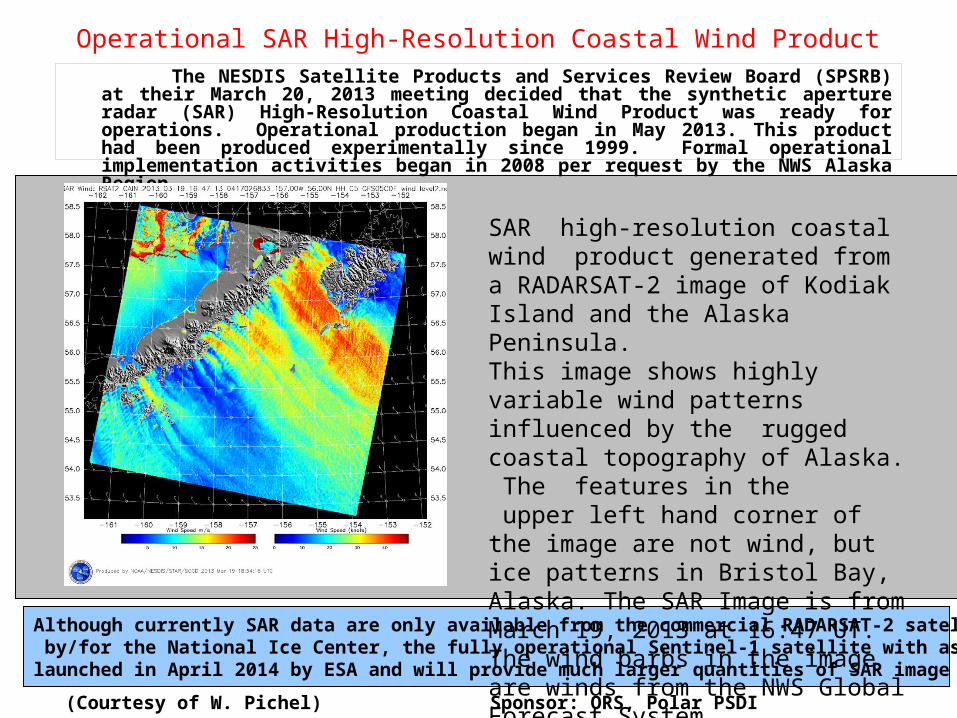
Operational SAR High-Resolution Coastal Wind Product The NESDIS Satellite Products and Services Review Board (SPSRB) at their March 20, 2013 meeting
decided that the synthetic aperture radar (SAR) High-Resolution Coastal Wind Product was ready for operations. Operational production began in May 2013. This product had been produced experimentally since 1999. Formal operational implementation activities began in 2008 per request by the NWS Alaska Region.
Although currently SAR data are only available from the commercial RADARSAT-2 satellite through data purchased by/for the National Ice Center, the fully operational Sentinel-1 satellite with assumed full/free/open data policy was launched in April 2014 by ESA and will provide much larger quantities of SAR image data for this operational product.
(Courtesy of W. Pichel) Sponsor: ORS, Polar PSDI
SAR high-resolution coastal wind product generated from a RADARSAT-2 image of Kodiak Island and the Alaska Peninsula.This image shows highly variable wind patterns influenced by the rugged coastal topography of Alaska. The features in the upper left hand corner of the image are not wind, but ice patterns in Bristol Bay, Alaska. The SAR Image is from March 19, 2013 at 16:47 UT. The wind barbs in the image are winds from the NWS Global Forecast System.
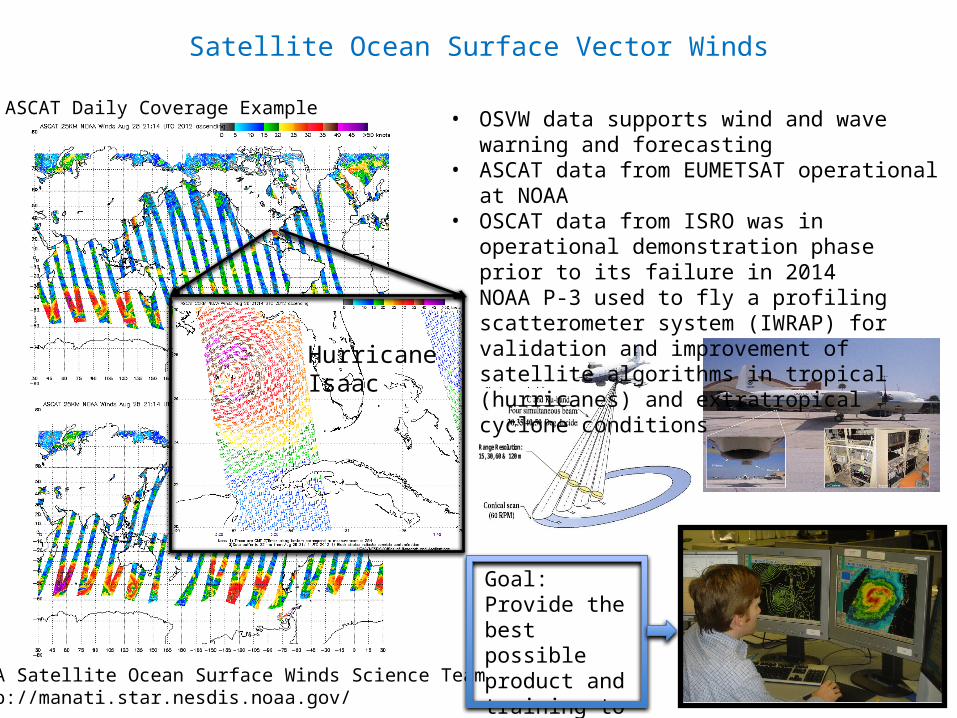
Satellite Ocean Surface Vector Winds
Range Resolution: 15, 30, 60 & 120 m
Conical Scan(60 RPM)
Range Resolution: 15, 30, 60 & 120 m
Conical Scan(60 RPM)
Range Resolution: 15, 30, 60 & 120 m
• OSVW data supports wind and wave warning and forecasting
• ASCAT data from EUMETSAT operational at NOAA• OSCAT data from ISRO was in operational
demonstration phase prior to its failure in 2014• NOAA P-3 used to fly a profiling scatterometer system
(IWRAP) for validation and improvement of satellite algorithms in tropical (hurricanes) and extratropical cyclone conditions
NOAA Satellite Ocean Surface Winds Science Teamhttp://manati.star.nesdis.noaa.gov/
Goal: Provide the best possible product and training to end users
ASCAT Daily Coverage Example
Hurricane Isaac
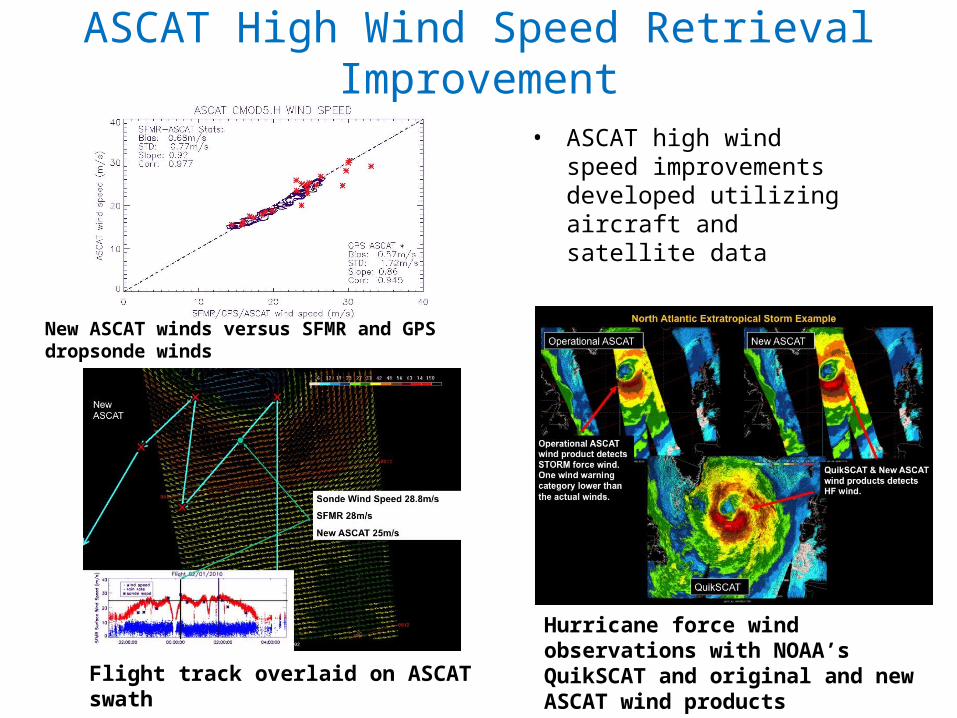
ASCAT High Wind Speed Retrieval Improvement
• ASCAT high wind speed improvements developed utilizing aircraft and satellite data
Hurricane force wind observations with NOAA’s QuikSCAT and original and new ASCAT wind productsFlight track overlaid on ASCAT swath
New ASCAT winds versus SFMR and GPS dropsonde winds
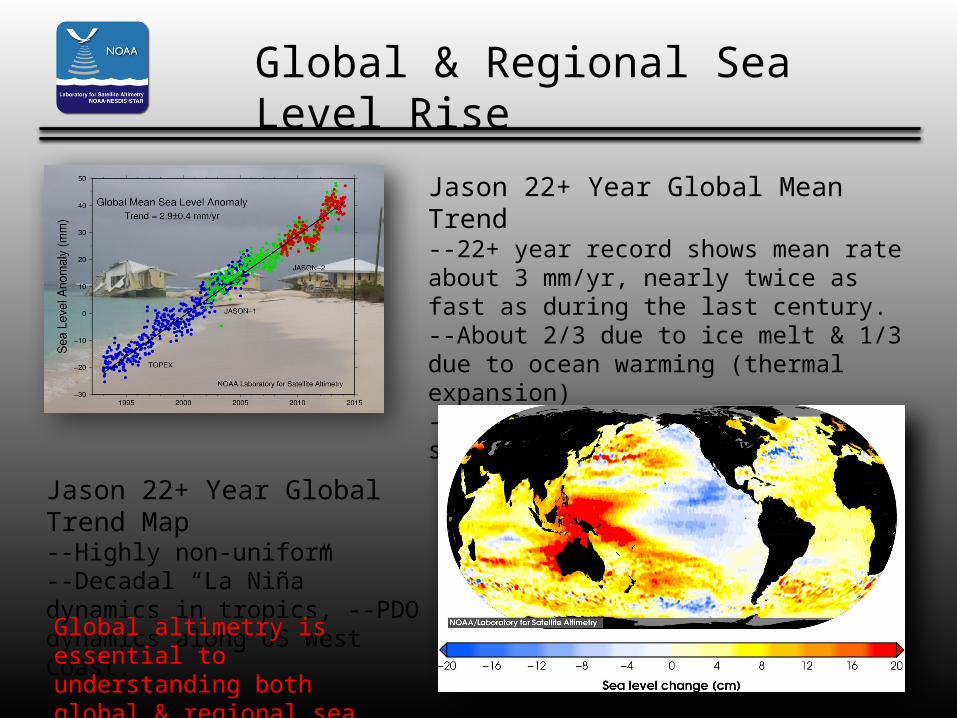
Global & Regional Sea Level Rise
Jason 22+ Year Global Mean Trend--22+ year record shows mean rate about 3 mm/yr, nearly twice as fast as during the last century.--About 2/3 due to ice melt & 1/3 due to ocean warming (thermal expansion) -- Used to validate IPCC model simulations and projections
Jason 22+ Year Global Trend Map --Highly non-uniform--Decadal “La Niña” dynamics in tropics, --PDO dynamics along US West Coast.
Global altimetry is essential to understanding both global & regional sea level rise
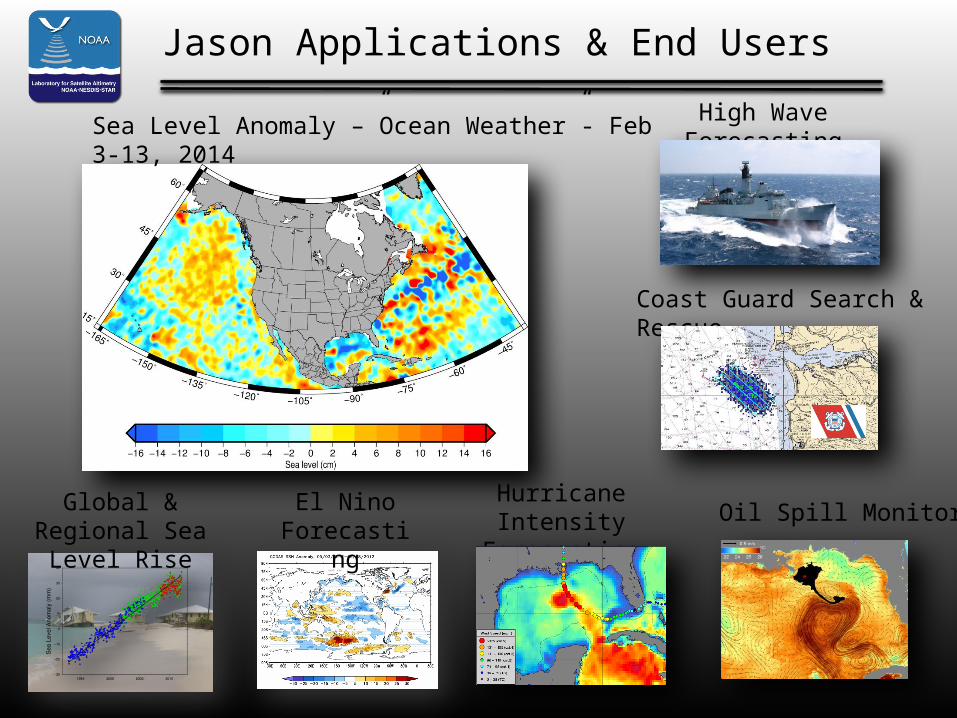
Jason Applications & End Users
Hurricane Intensity Forecasting
Global & Regional Sea Level Rise
Coast Guard Search & Rescue
Oil Spill Monitoring
High Wave Forecasting
El Nino Forecasting
Sea Level Anomaly –”Ocean Weather”- Feb 3-13, 2014
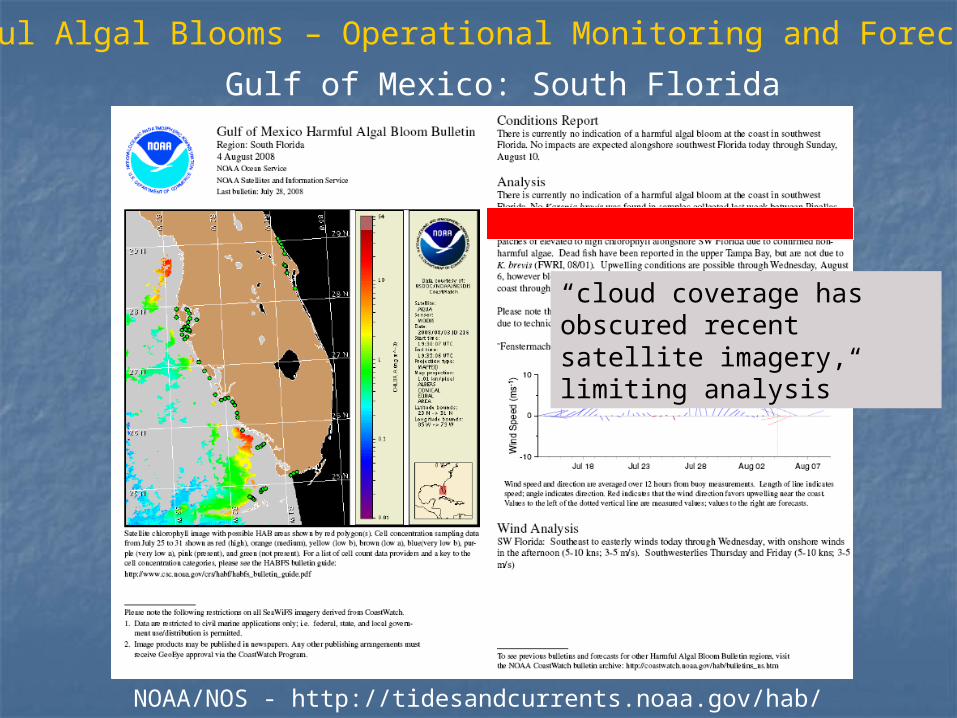
NOAA/NOS - http://tidesandcurrents.noaa.gov/hab/
Harmful Algal Blooms – Operational Monitoring and Forecasting
Gulf of Mexico: South Florida
“cloud coverage has obscured recent satellite imagery, limiting analysis”
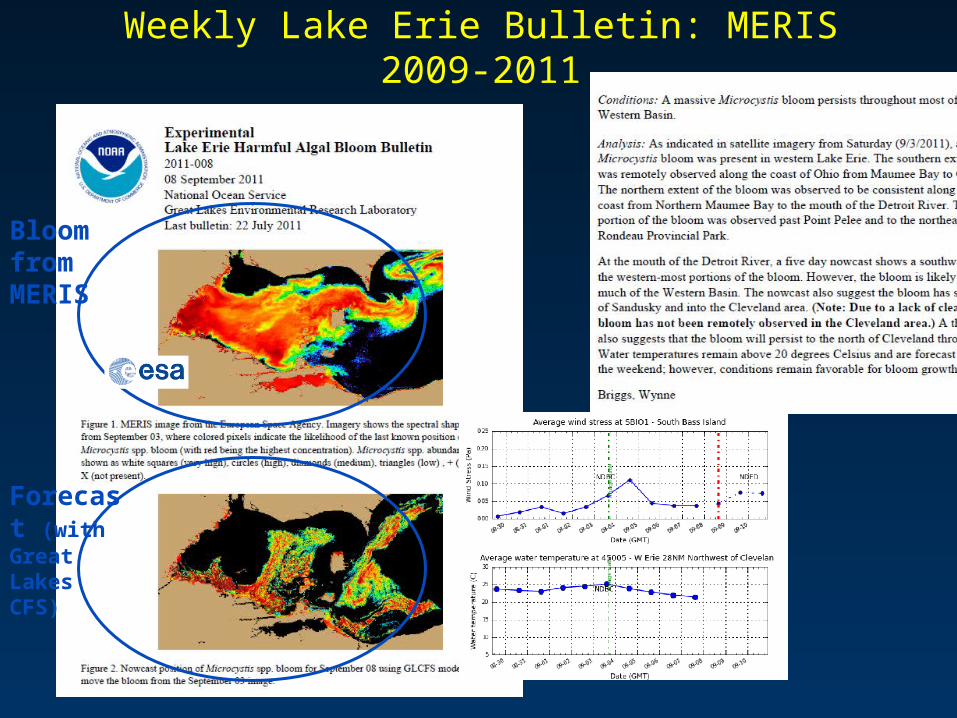
Weekly Lake Erie Bulletin: MERIS 2009-2011
Bloom from MERIS
Forecast (with Great Lakes CFS)
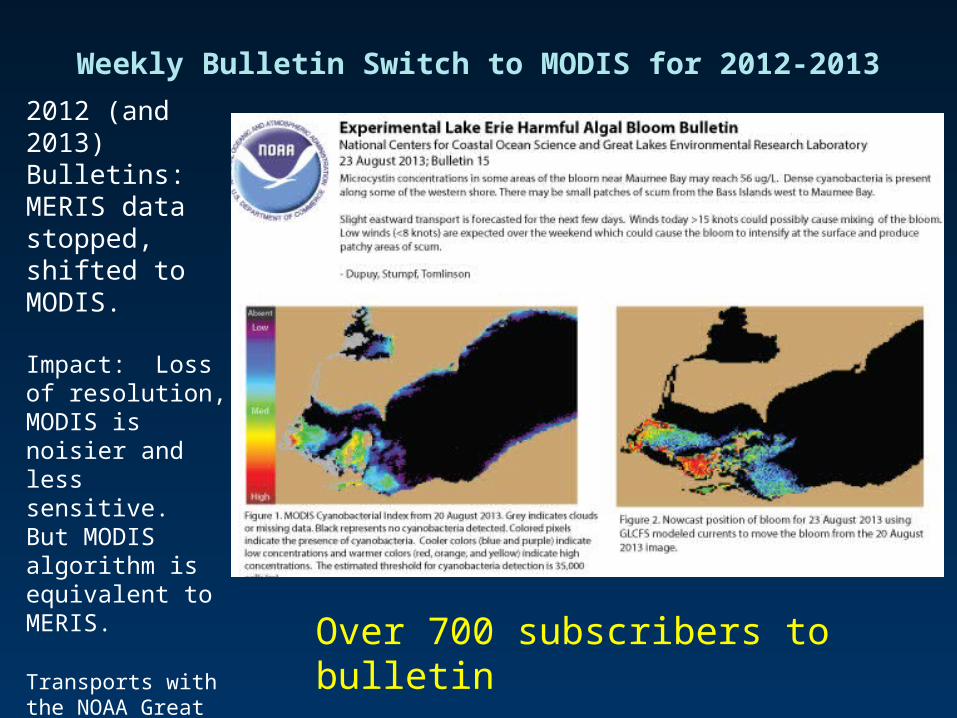
Weekly Bulletin Switch to MODIS for 2012-20132012 (and 2013) Bulletins: MERIS data stopped, shifted to MODIS.
Impact: Loss of resolution, MODIS is noisier and less sensitive. But MODIS algorithm is equivalent to MERIS.
Transports with the NOAA Great Lakes Coastal Forecast System
Over 700 subscribers to bulletin
21
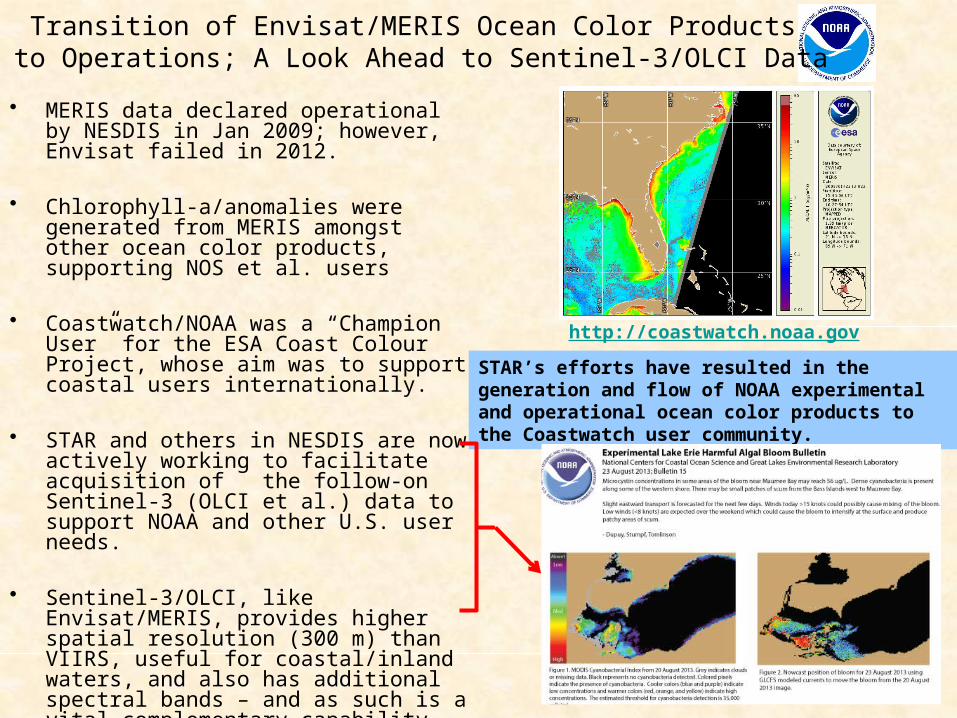
Transition of Envisat/MERIS Ocean Color Products to Operations; A Look Ahead to Sentinel-3/OLCI Data
• MERIS data declared operational by NESDIS in Jan 2009; however, Envisat failed in 2012.
• Chlorophyll-a/anomalies were generated from MERIS amongst other ocean color products, supporting NOS et al. users
• Coastwatch/NOAA was a “Champion User” for the ESA Coast Colour Project, whose aim was to support coastal users internationally.
• STAR and others in NESDIS are now actively working to facilitate acquisition of the follow-on Sentinel-3 (OLCI et al.) data to support NOAA and other U.S. user needs.
• Sentinel-3/OLCI, like Envisat/MERIS, provides higher spatial resolution (300 m) than VIIRS, useful for coastal/inland waters, and also has additional spectral bands – and as such is a vital complementary capability.
• STAR is supporting ESA/EUMETSAT as part of the Sentinel-3 Validation Team (3 projects)
STAR’s efforts have resulted in the generation and flow of NOAA experimental and operational ocean color products to the Coastwatch user community.
http://coastwatch.noaa.gov
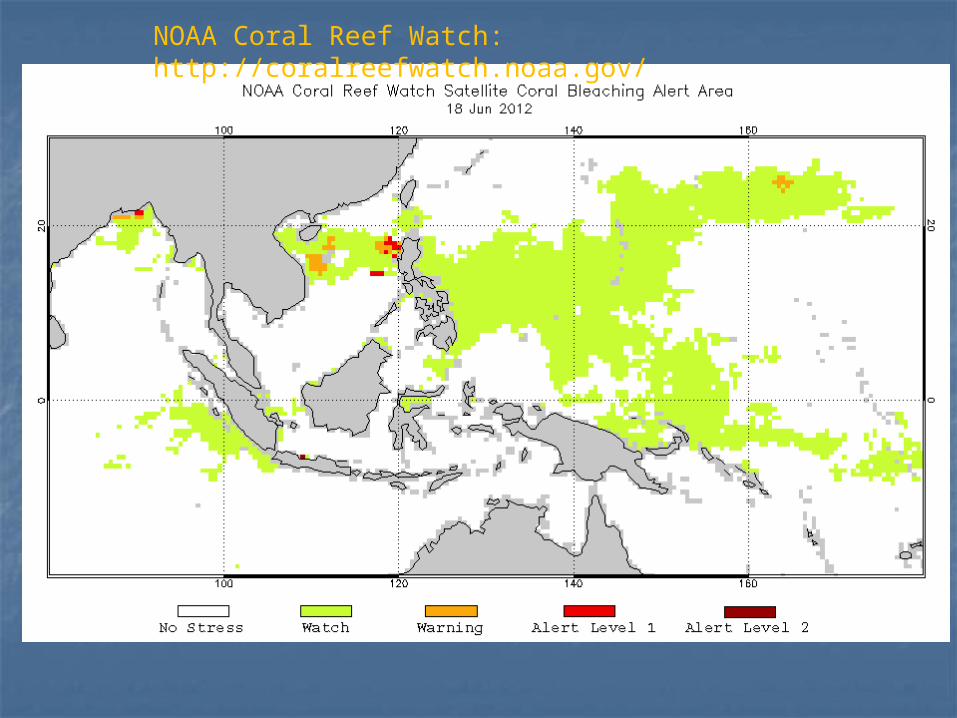
NOAA Coral Reef Watch: http://coralreefwatch.noaa.gov/
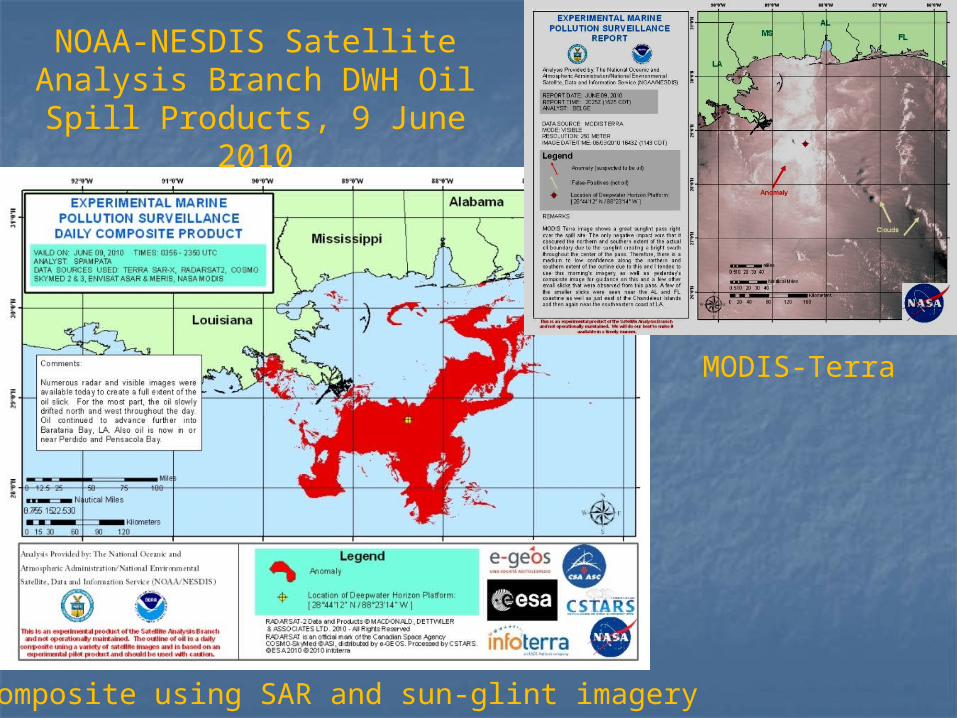
NOAA-NESDIS Satellite Analysis Branch DWH Oil Spill
Products, 9 June 2010
MODIS-Terra
Composite using SAR and sun-glint imagery
“Operational”What does it mean?
1. relating to, or based on operations
2. ready for, or in a condition to undertake, a destined function - Merriam-Webster’s Dictionary
Strict definition is vague at best…
• In the world of satellite data, “operational” is often assumed to mean a near-real time (NRT) 24/7 application.
• For fisheries and marine resource managers, seasonal, interannual and decadal timescales are more relevant than NRT 24/7.
• In the R2O context “operational” is often interpreted as “anything not research”.
Also rather ambiguous…
Courtesy, Cara Wilson
Perspectives on addressing user needs (courtesy of a NOAA line office user):
Perspectives on addressing user needs (courtesy of a NOAA line office user):
1. Users know what they need, but not what RS products they need.
Perspectives on addressing user needs (courtesy of a NOAA line office user):
1. Users know what they need, but not what RS products they need. 2. Remote sensors know what they can produce, but they don't usually know what users need.
Perspectives on addressing user needs (courtesy of a NOAA line office user):
1. Users know what they need, but not what RS products they need. 2. Remote sensors know what they can produce, but they don't usually know what users need. 3. It's easier to make an algorithm that doesn't solve a user problem than one that does.
Perspectives on addressing user needs (courtesy of a NOAA line office user):
1. Users know what they need, but not what RS products they need. 2. Remote sensors know what they can produce, but they don't usually know what users need. 3. It's easier to make an algorithm that doesn't solve a user problem than one that does. 4. The best way to answer what users need is to work with them. Users are friendly (usually ;)
Perspectives on addressing user needs (courtesy of a NOAA line office user):
1. Users know what they need, but not what RS products they need. 2. Remote sensors know what they can produce, but they don't usually know what users need. 3. It's easier to make an algorithm that doesn't solve a user problem than one that does. 4. The best way to answer what users need is to work with them. Users are friendly (usually ;) 5. Most users are really polite when they are not going to use your product. Don't confuse this with interest.

Perspectives on addressing user needs (courtesy of a NOAA line office user):
1. Users know what they need, but not what RS products they need. 2. Remote sensors know what they can produce, but they don't usually know what users need. 3. It's easier to make an algorithm that doesn't solve a user problem than one that does. 4. The best way to answer what users need is to work with them. Users are friendly (usually ;) 5. Most users are really polite when they are not going to use your product. Don't confuse this with interest. 6. When they keep asking you for the product, or when they offer to commit their own time or find money to help with it, THEN you've created something useful.
Perspectives on addressing user needs (courtesy of a NOAA line office user):
1. Users know what they need, but not what RS products they need. 2. Remote sensors know what they can produce, but they don't usually know what users need. 3. It's easier to make an algorithm that doesn't solve a user problem than one that does. 4. The best way to answer what users need is to work with them. Users are friendly (usually ;) 5. Most users are really polite when they are not going to use your product. Don't confuse this with interest. 6. When they keep asking you for the product, or when they offer to commit their own time or find money to help with it, THEN you've created something useful. 7. When managers find the products useful for solving tough problems, researchers have the opportunity to do some really interesting science.
Coastal Zone Community of Practice (CZCP)
• The Coastal Zone Community of Practice (CZCP) supports GEO in its goal to provide timely observations providing services and informing decisions concerning the coastal zone.
• High priorities for GEOSS coastal users currently include:
=> Improved forecasts of sea-level rise and associated increase in frequency and extent of coastal inundation
=> Tracking changes in water quality and ecosystem health and productivity and ability to provide important goods and services.
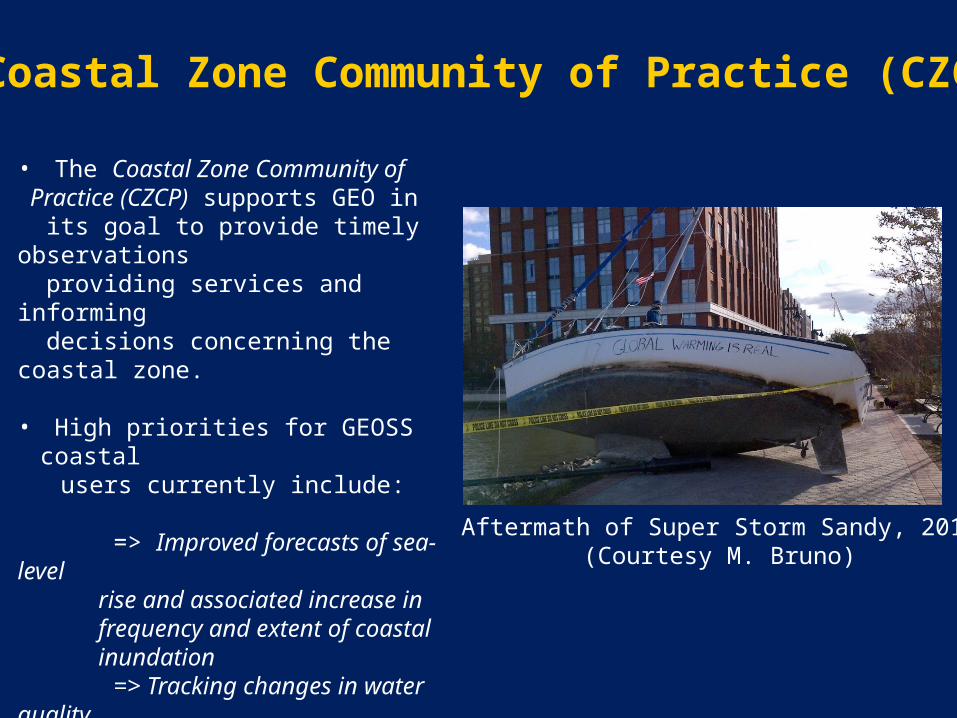
Aftermath of Super Storm Sandy, 2012(Courtesy M. Bruno)
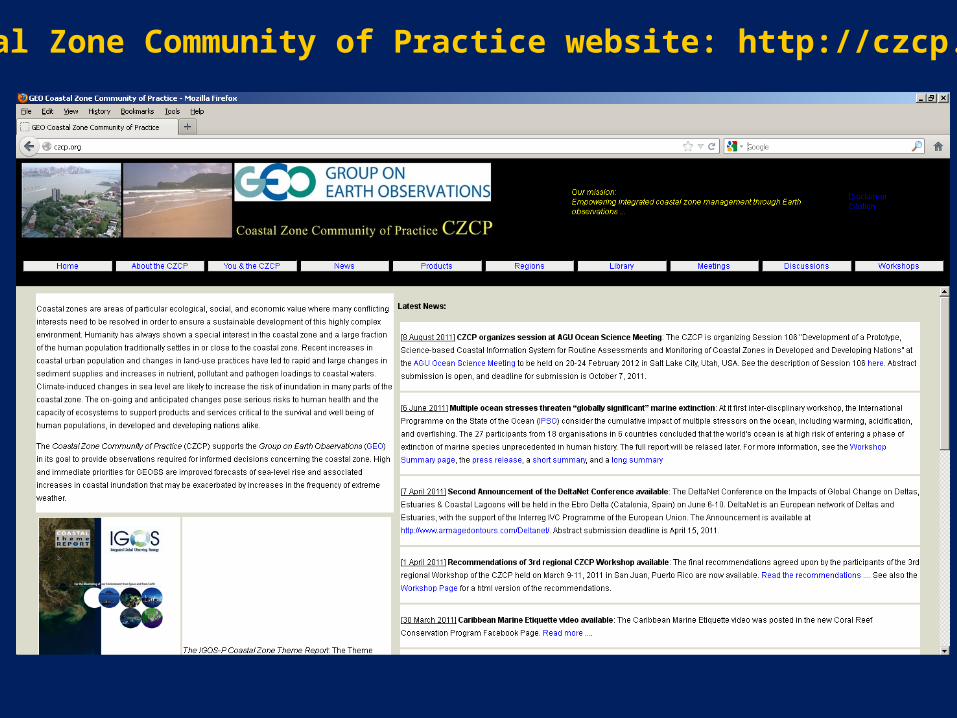
Coastal Zone Community of Practice website: http://czcp.org/
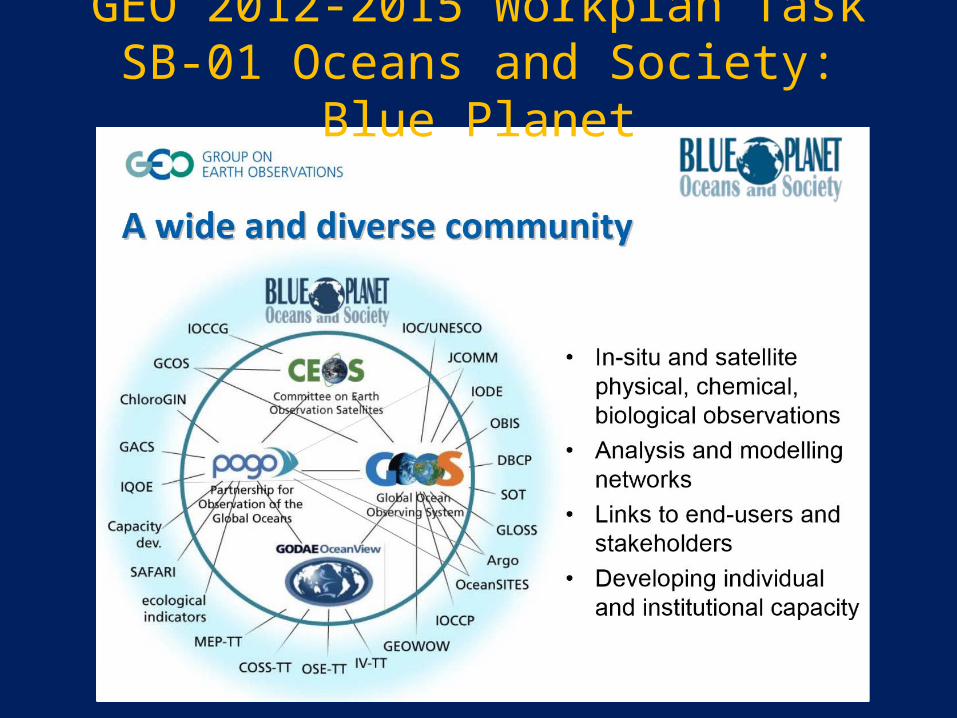
GEO 2012-2015 Workplan Task SB-01 Oceans and Society: Blue Planet
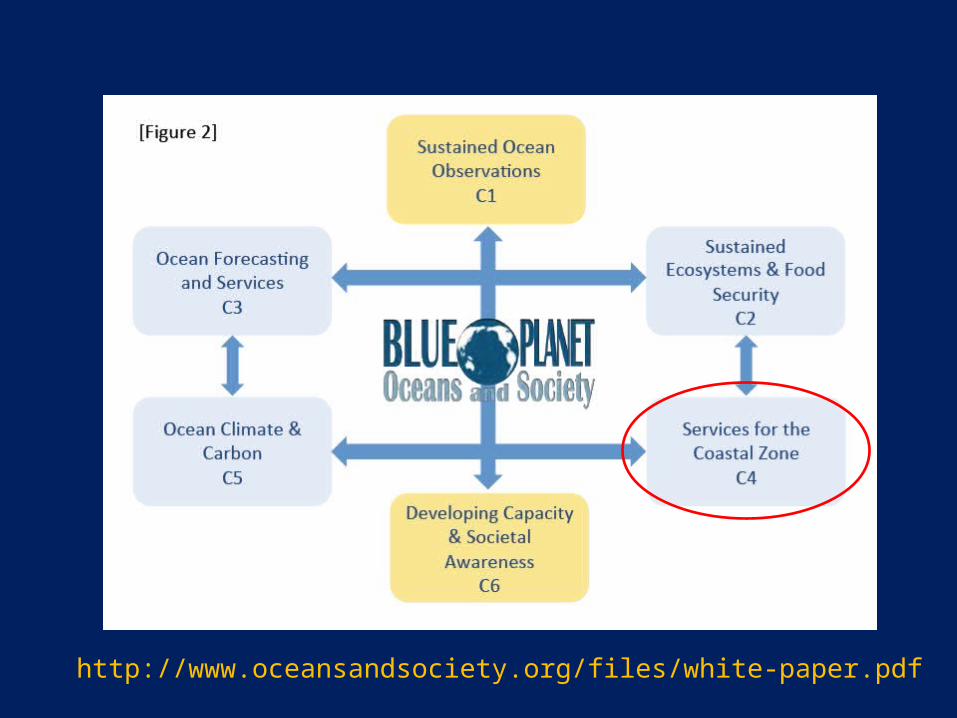
http://www.oceansandsociety.org/files/white-paper.pdf
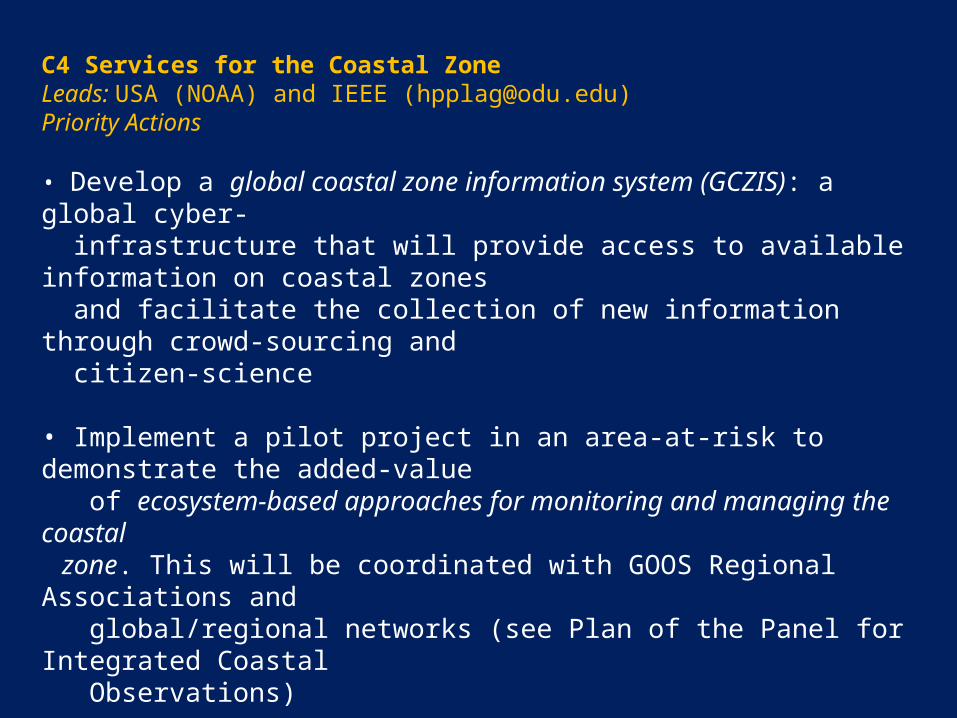
C4 Services for the Coastal ZoneLeads: USA (NOAA) and IEEE ([email protected])Priority Actions
• Develop a global coastal zone information system (GCZIS): a global cyber- infrastructure that will provide access to available information on coastal zones and facilitate the collection of new information through crowd-sourcing and citizen-science
• Implement a pilot project in an area-at-risk to demonstrate the added-value of ecosystem-based approaches for monitoring and managing the coastal zone. This will be coordinated with GOOS Regional Associations and global/regional networks (see Plan of the Panel for Integrated Coastal Observations)
• Assess user needs and observational requirements for coastal water quality (using the GEOSS User Requirements Registry); identify indicators and best practices for coastal water quality, and implement a monitoring service pilot for coastal water quality (with WA-01 and HE-01); disseminate information particularly to under-served communities (with IN-04)
International Ocean Colour Coordinating Group (IOCCG) Working Group: Earth Observations in Support of Global Water Quality Monitoring
Working group participants at the NOAA/National Center for Weather and Climate Prediction, College Park, MD, USA

International Ocean Colour Coordinating Group (IOCCG) Working Group: Earth Observations in Support of Global Water Quality Monitoring
Working group participants at the NOAA/National Center for Weather and Climate Prediction, College Park, MD, USA
Now working to develop broader Water Quality Community of Practice (WQ-CoP) under the auspices of GEOSS and CEOS