Embed Size (px)
Citation preview
Perspectives of electric vehicles in a supply
system with a high share of renewable energy
sources
Thomas Pregger, Diego Luca de Tena,
Carsten Hoyer-Klick
www.DLR.de • slide 2
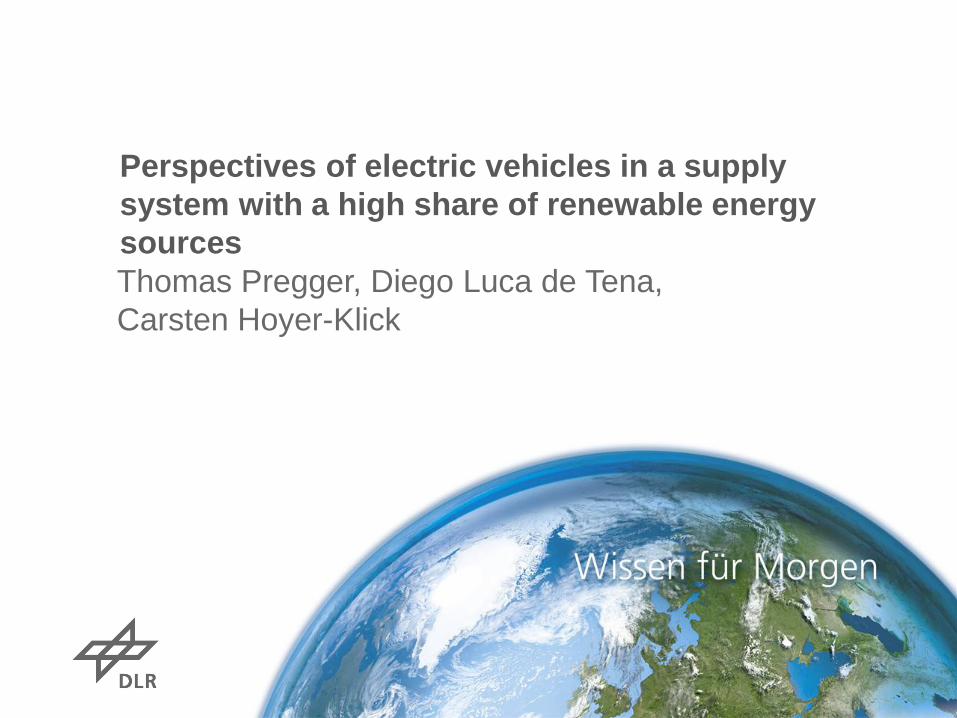
Vehicle technologies,
market development,
electricity demand
Perspectives of
electric/hybrid vehicles
in a supply system
with a high share of
renewable energy sources
Grid integration,
effects and measures
Optimised renewable
power generation
incl. electric vehicles
Political and financial
framework conditions
03/2009 to 07/2012
funded by the German Federal Ministry of Economics and Technology (BMWi)
Institute of
Technical Thermodynamics
Institute of
Vehicle Concepts
source: Kempton et al. 2006
Project “Perspectives of electric vehicles in a supply system
with a high share of renewable energy sources”
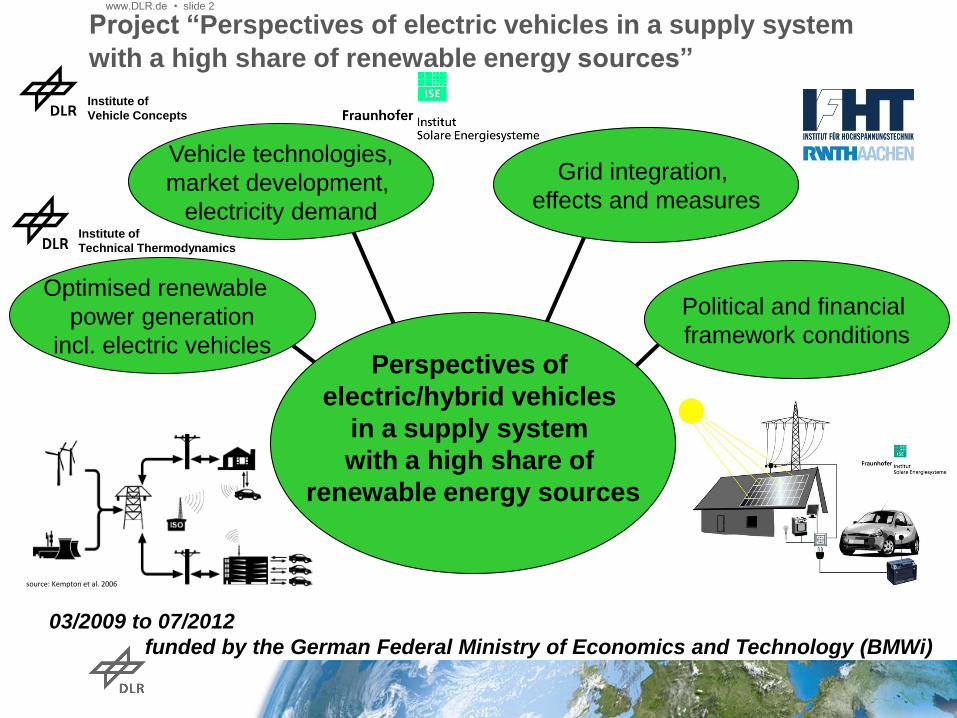
Energy-economical perspective: role of electromobility in the
energy system: new demand & option for load balancing/storage
Mo. 30.10 Di. 31.10 Mi. 1.11 Do. 2.11 Fr. 3.11 Sa. 4.11 So. 5.11
Electricity demand
Conventional
power plants:
nuclear, coal
natural gas
Electricity
storage:
Pumped-storage
Compressed air
Hydrogen
Demand side
management
Industry & households
Increase in energy
efficiency
Electric vehicles (EV)
Heat demand (CHP)
High voltage DC:
Interregional long-distance
electricity transport
Main grid:
based on todays AC-Grid
(Europe)
x
BEV/hybrids: charging
strategy, hourly battery
capacity of the fleet on
the grid.
FCEV: flexible on-site
H2 generation
Flexible management:
- heat storage
- peak burner/el.-heater
Renewable
potentials/
installed capacities
for electricity
generation Scenario analysis with REMix model Cost minimising, temporally & spatially resolved
Model
Result: production- & storage strategies
GHI
DNI
wind speed
run-off river
….
www.DLR.de • slide 3
www.DLR.de • slide 4
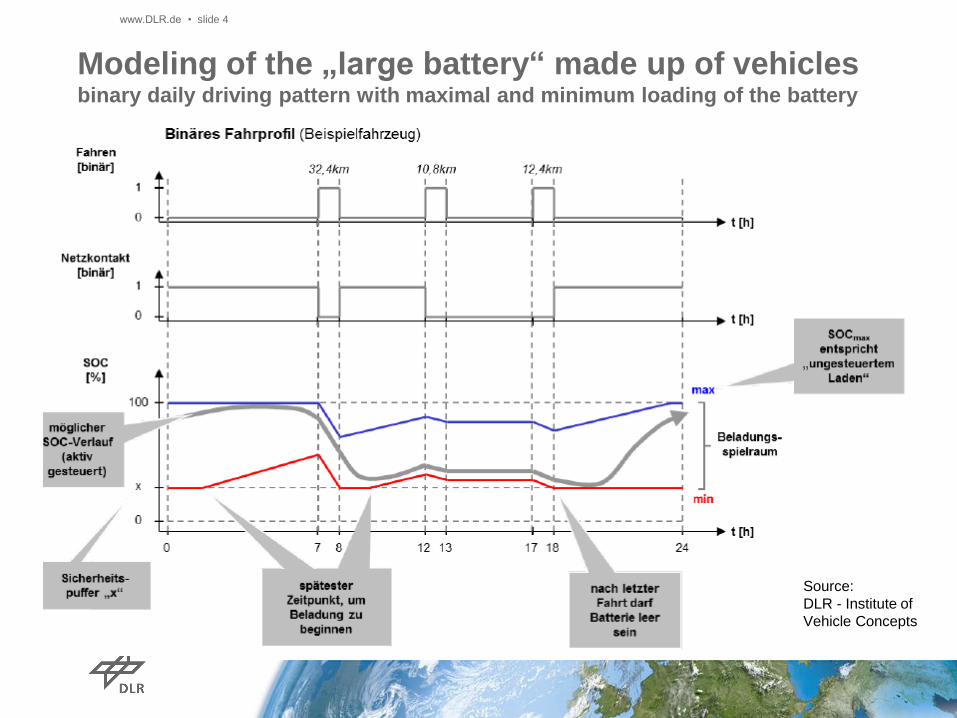
Modeling of the „large battery“ made up of vehicles
binary daily driving pattern with maximal and minimum loading of the battery
Source:
DLR - Institute of
Vehicle Concepts

www.DLR.de • slide 5
Statistical evaluation of 17‘868 empirical measured real world
driving patterns (MiD 2008) ► hourly battery “capacity” of the fleet on the grid
Maximum SOC
determined by capacity
and grid connection
Minimum SOC determined by
costs/ degradation and minimum
energy for mobility required by
the user at any time
Minimum SOC curve determined
by daily energy demand for
driving , Confidence Interval and
minimum loading during the day
Maximum SOC curve determined
by daily energy demand for
driving, Confidence Interval and
maximum loading during the day
Capacity available for load
management temporally resolved

www.DLR.de • slide 6
2020 2010 2030 2040 2050
50%
100%
0%
CNGHyb
2020 2010 2030 2040 2050
50%
100%
0%
BEV
EREV
G GHyb
CNG
D
Scenario for EV success in Germany – new PC and PC fleet
development – fleet modelling based on the total costs of ownership approach
CNGHyb
BEV
EREV
G GHyb
CNG
D
DHyb
DHyb
Conventional vehicles will be substituted by their
hybrid variants
If reduced tax for CNG cars will be phased-out in
2018, CNG will be squeezed out of the market
Due to the assumed learning rates alternative
vehicles will be implemented in the vehicle market
Fuel cells are not successfull in this scenario
depending on cost assumptions
The change of the total fleet takes place with time
delay
In 2050 still conventional vehicles are existing in
the fleet
The share of vehicles with electric drive train (BEV
& EREV) reach more than 50% in 2050. The
sceanrios reaches about 1 million EV in 2020 and
about 5 millions in 2030.
New cars
Total fleet in Germany
Vehicle categories:G: gasoline, D: diesel, CNG: natural gas, Hyb: hybrids w/o plug-
in, EREV: plug-in range-extender, BEV: battery electric vehicle, FCV: fuel cell
vehicle, source: DLR-FK with VECTOR21 model
www.DLR.de • slide 7
Mo. 30.10 Di. 31.10 Mi. 1.11 Do. 2.11 Fr. 3.11 Sa. 4.11 So. 5.11
P [GW]
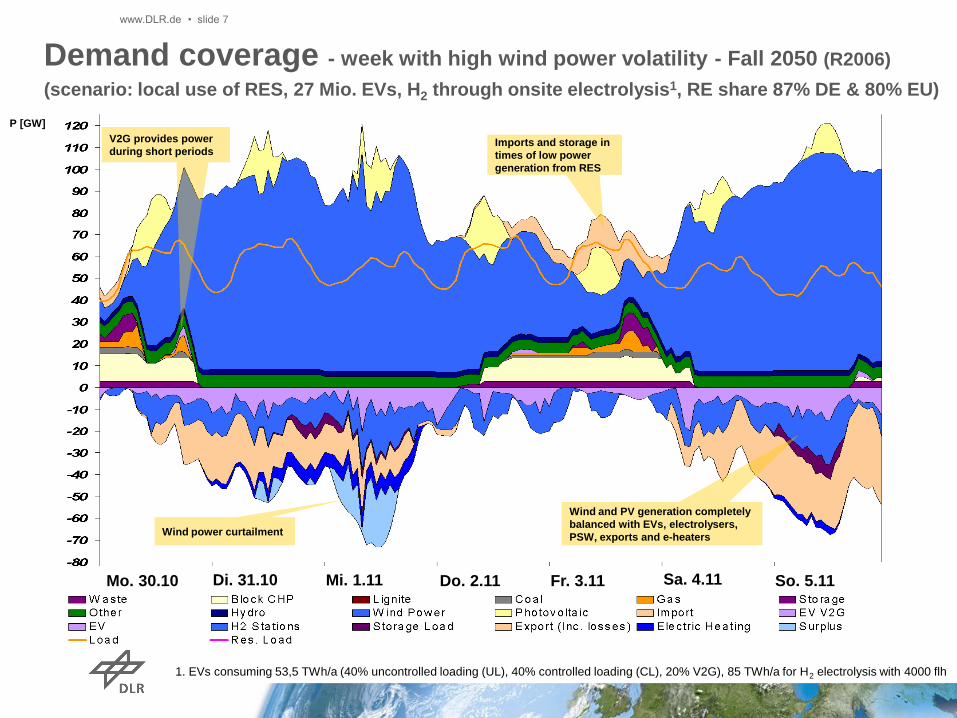
Wind and PV generation completely
balanced with EVs, electrolysers,
PSW, exports and e-heaters Wind power curtailment
Imports and storage in
times of low power
generation from RES
V2G provides power
during short periods
Demand coverage - week with high wind power volatility - Fall 2050 (R2006)
(scenario: local use of RES, 27 Mio. EVs, H2 through onsite electrolysis1, RE share 87% DE & 80% EU)
1. EVs consuming 53,5 TWh/a (40% uncontrolled loading (UL), 40% controlled loading (CL), 20% V2G), 85 TWh/a for H2 electrolysis with 4000 flh

Annual R
E-e
lectr
icity s
urp
lus [T
Wh
/a]
Re
sid
ua
l p
ea
k d
em
an
d [G
W]
1 average of 5% hours of the
year with the highest loads
2 refer to electricity generated
by
additional RE capacities to
cover the demand of EVs
3 >15% of demand in Germany
source: Prospects for electric/
hybrid vehicles in a power
supply system dominated by
decentralized, renewable energy
sources. Final report by DLR
Stuttgart/FhG ISE Freiburg/IfHT
RWTH Aachen, FGH Aachen.
July 2012
Remaining unused
surplus about 2 %
of power demand
100% controlled charging
lowers peak demand >3 GW
& lowers the surplus by 4
TWh compared to 100% UL2
Strong influence of solar
electricity imports3 on
residual peak demand,
no surplus electricity
100% uncontrolled
charging increases
residual peak demand
and surplus
gefördert durch:
Results for power supply system in 2050: „Basis“scenario: 27
Mio. EV (53,5 TWh/a) (40% controlled charging, 20% V2G); 87%/80% RE share
electricity in D/EU; 57 TWh H2 generation for Transport in D; no electricity imports
www.DLR.de • slide 8
Main Results: prospects of electric vehicles in a supply system with high
shares of renewable energy (Germany 87% in 2050, high fluctuating share)
The simulation of economically optimised operation/use of
- controllable/flexible generation capacities, storage capacities (pumped storage),
- power transfer capacities in the (expanded) European transmission grid and
- the controlled loading of vehicle batteries in Germany in 2050
shows a significant potential for peak shaving and use of „excess“ power
Electric vehicles in a „successful“ fleet scenario and entirely with controlled
loading are able to reduce the residual peak load by ~3 GW and use ~4 TWh
excess electricity compared to uncontrolled loading. The total excess power that was
used by vehicle batteries in some hours of the year were up to 20 GW.
I.e. electro-mobility using renewable energy (total annual demand generated by
additional RE capacities) could be realised in Germany by controlled loading without
negative impacts on the power supply system (in terms of residual peak load, excess
electricity and CO2 emissions)
However, load balancing potentials of flexible cogeneration plants (with heat storage
& electric heater), power transfer between generation & demand centres in Europe
and solar power import appeared to be much higher than the EV potential
www.DLR.de • slide 9
www.DLR.de • slide 10
Main Results: cost effects of electric vehicles in a supply system with high
shares of renewable energy (Germany 87% in 2050, high fluctuating share)
Scenario without EV vs. scenario with 27 Mio. EV + 60% controlled loading
- 53,5 TWh/a more consumption, ~20 GW more installed RE in 2050
but significant lower final energy demand and CO2 emission in transportation
- total power generation costs increase by 8%
Scenario with 27 Mio. EV and uncontrolled vs. 100% controlled loading
- ~3 GW less back-up PP and ~4 TWh less power generation required
- total power generation costs decrease by 3%

www.DLR.de • slide 11
optimised EV loading
uncontrolled EV loading
Results single house with EV + PV: Electrical load and power
generation for a summer day in Germany, single house with PV (7 kWp) with optimised
operation (left) resp. uncontrolled loading (right); maximal loading capacity EV 3.7 kW
Source: FhG ISE Freiburg
Optimised loading of EV increases own used share of electricity from PV and
reduces electricity demand from the grid
However, due to limited battery capacity PV feed-in starts at noontime, therefore PV
generation peaks can not be avoided
www.DLR.de • slide 12
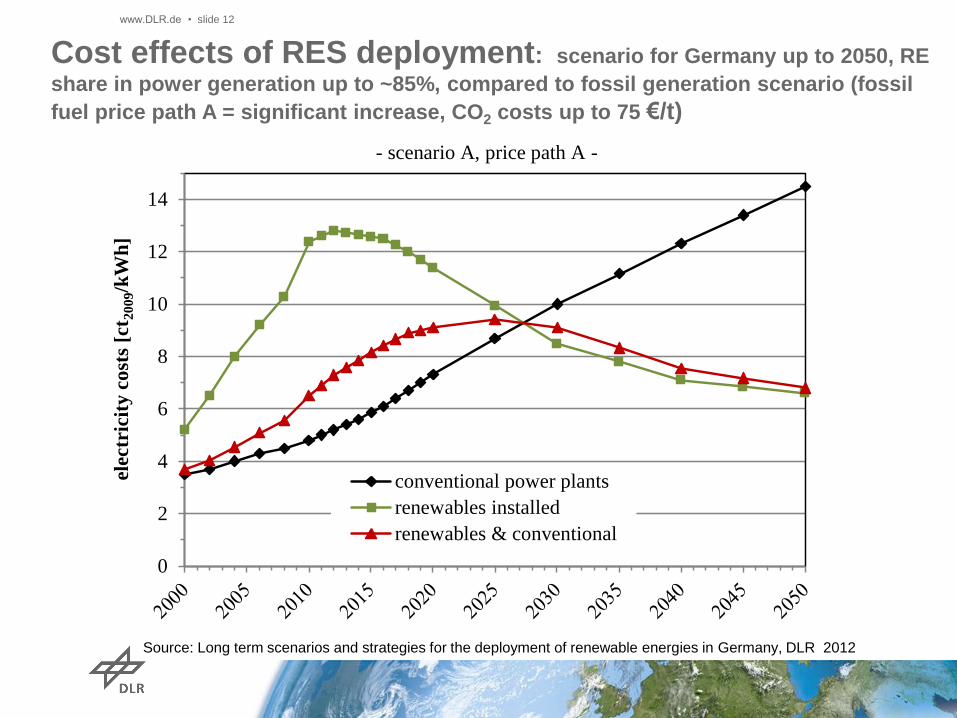
Cost effects of RES deployment: scenario for Germany up to 2050, RE
share in power generation up to ~85%, compared to fossil generation scenario (fossil
fuel price path A = significant increase, CO2 costs up to 75 €/t)
0
2
4
6
8
10
12
14
elec
tric
ity
co
sts
[ct 2
009/k
Wh
]
conventional power plants
renewables installed
renewables & conventional
- scenario A, price path A -
Source: Long term scenarios and strategies for the deployment of renewable energies in Germany, DLR 2012

www.DLR.de • slide 13
0
2
4
6
8
10
12
14
16
18
fuel
pri
ces
at
po
wer
sta
tio
n [
EU
R2009/G
J]
A: substantial B: moderate C: very low
gas
hard coal
- without CO2 surcharge -
Price paths assumed: 3 scenarios up to 2050
Source: Long term scenarios and strategies for the deployment of renewable energies in Germany, DLR 2012

www.DLR.de • slide 14
Development paths RE technologies assumed:
scenario based on (own and external) expert judges up to 2050
0,02
0,04
0,06
0,08
0,10
0,12
0,14
0,16
0,18
0,20
elec
tric
ity
gen
era
tio
n c
ost
s[E
UR
20
09/k
Wh
]
hydro
wind
onshorewind
offshorephoto-
voltaicsgeo-
thermalpower
importssolid
biomassbiogas,
landfill gasaverage
renewablesaverage
without PV
- renewable energies - new plants -
Source: Long term scenarios and strategies for the deployment of renewable energies in Germany, DLR 2012

www.DLR.de • slide 15
0
100
200
300
400
500
600
700g
ross
ele
ctr
icit
y p
rod
uct
ion
[T
Wh
/yr]
hydrogen
(CHP, GT)import from
REphotovoltaics
wind power
geothermal
biomass, biog.
Wastehydropower
CHP gas, coal
condensing
gas, oilcondensing
lignitecondensing
hard coalnuclear power
614631 621
586564 558 548
562 575
Transformation of the electricity supply system: scenario for
Germany up to 2050, RE share in power generation up to ~85%
Source: Long term scenarios and strategies for the deployment of renewable energies in Germany, DLR 2012