Embed Size (px)
Citation preview
The Quantity Surveying International Convention 2011
Penang, Malaysia, 11th -12th October
1
PERSPECTIVE OF QUANTITY SURVEYORS TOWARDS THE ACCURACY OF PRELIMINARY COST ESTIMATES IN PUBLIC PROJECTS OF MALAYSIA
First and corresponding author: Mohd Azrai Azman1
Second author: Sr Dr. Zulkiflee Abdul Samad2
1 Postgraduate student - Master of Science (Building)
2 Senior Lecturer
Department of Quantity Surveying, Faculty of Built Environment, University of Malaya
E-mail (corresponding author): [email protected]
ABSTRACT
Preliminary Cost Estimate is prepared at early stage of development to decide the cost limit for projects.
Sometimes, public agency uses approved preliminary cost estimate to select a suitable bidder. A Quantity
Surveyor prepares an estimate before the completion of tender document. Therefore, he has to make
assumptions to incorporate the important variables. Factors affecting the accuracy of Preliminary Cost Estimate
and methods to improve the accuracy are indentified through literatures. 157 questionnaires were received from
the respondents. Findings of this study show almost all variables are important. Design scope, cost data, location
and experience are the most important factors affecting the accuracy. Meanwhile, the quality of information
supplied to Quantity Surveyors the main concern to improve the current practice. Investing in human resource,
sharing cost data and introduction of standardized rules for estimating are important in order to improve the
accuracy in the near future.
KEYWORDS
Accuracy, Preliminary Cost Estimate, Quantity Surveyor, Public Works Department, Peninsular Malaysia
Introduction
This paper reports the initial research by the authors about the accuracy of the preliminary estimates prepared by
both Public and Private Quantity Surveyors for Public Works Department (PWD) projects in Peninsular
Malaysia. Quantity Surveyors in this respect are QS officers working in PWD and private Quantity Surveyors
hired by PWD. The comments and suggestions will be incorporated in the main study.
The government often considers preliminary cost estimates as the cost limit of the projects. The estimates are
provided from the size of buildings and functional unit using cost indicators of similar projects (Morton &
Jaggar, 1995). It depends on information gathered at early design stages. It ensures the projects is built
according to desired quality, in the allowed time and within budget (Karlsen & Lereim, 2005).
Chappell, Marshall, Power-Smith, & Cavender (2001, p. 149) describes the general term of early estimates as:
“Colloquially and in the industry generally it means „probable cost‟ and is then a judged amount,
approximate rather than precise”
Seeley (1996, p.154) describes the QS consultants’ standpoint on preliminary cost estimates:
“The primary role of estimated or preliminary estimating is to produce a forecast of probable cost of a
future project, before the building has been designed in detail and contract particulars prepared. In this
way the building client is made aware of his likely financial commitments before extensive design is
undertaken”
The difference between QS consultants’ estimates and Contractors’ bidding (Skitmore, 1988, p.2):
“Estimating is the process of working out likely costs and bidding is the process of converting an
estimate into a tender price”.
2
The estimates are prepared based on standard and cost guideline to ensure value for money. This standard states
the general requirements and features for planning i.e. space per pupil as the standard for school buildings
(Morton & Jaggar, 1995). This ensures the user’s needs are established unlike in private the needs are defined
by profit (Kirkham, 2007).
Normally, the Public Works Department supervised the public projects in Malaysia. The PWD is the largest
construction management organisation in Malaysia (Abdul-Rashid Abdul-Aziz & Normah Ali, 2004). This
department may appoint private consultants to provide drawings and cost estimates. The design and planning
must use Standard and Cost Guideline prepared by Standard and Cost Sub-committee of Economic Planning
Unit (EPU) under the Prime Minister Department. This guideline provides the standard of practice for land use,
schedule of accommodation and standard general spaces (Prime Minister Department, 2005). However, not all
projects are required to use this guideline. Projects exceed RM 5.0 million for alteration of buildings and
buildings for rental exceed 465m2GFA are not required to follow the guideline. The purpose of this guideline is
to appreciate cost saving from planning, design and implementation of the projects. It provides maximum
benefits within reasonable cost (Prime Minister Department, 2005).
Preliminary Cost Estimates are prepared according to initial design forwarded by the Ministries or other
government agencies. The estimates are prepared to ensure the project’s budget is sufficient. Currently, there are
two (2) types of estimating methods used by PWD. These methods are Single Rate Method and Estimated
Quantities The estimates will be prepared using Preliminary Detailed Abstract Form PWD142 (Ministry of
Finance, 1958; Public Works Department, 2010).
Cost estimates are not an exact science, but it needs construction knowledge and common sense to have accurate
estimates (Peurifoy & Oberlender, 2006). Different method of procurement and lack of basic information can
also influence the accuracy of estimates (Hughes, Hillebrandt, Greenwood, & Kwawu, 2006).
In summary, the function of preliminary cost estimates is essential to government procurement activity.
Therefore, an acceptable level of accuracy in the estimates is important. Estimates can influence the selection of
contractors because of government budget constraint. The factors influence the accuracy of estimates will be
studied. In addition, this study will look into the ways to improve the accuracy of estimates.
Problems related to inaccurate Preliminary Cost Estimate
The early cost advice of public funded projects is essential because budget constraint will limit the capacity of
government to spend (Morton & Jaggar, 1995). In addition, estimates will provide the basis for budgeting and
cost control for construction projects. If the estimates are too low, the project design could be abandoned, and it
may lead to a lawsuit (Ashworth, 2010). Overestimation will lead lesser funds available for other projects and
underestimation will result in unviable figures during tender award stage (Odusami & Onukwube, 2008). To
overcome these problems, Public Works Department could take two (2) possible solutions, which are design
amendment, or additional budget will be requested (Public Works Department, 2010). Nevertheless, clients are
more tolerated to overestimation of preliminary cost estimates (Cheung, Wong, & Skitmore, 2008).
Even so, these recommendations will not resolve the problems of inaccurate estimation. Preliminary cost
estimates must be prepared using reliable estimating methods and procedures. Budget must be ready before
project implementation. Thus, inaccurate estimates could result in resource mismanagement
Estimates provided to PWD could be from internal and external sources. PWD may engage private consultants
QS to provide the department with estimates (Ministry of Finance, 1958). The main reason for outsourcing is the
restriction to employ more staff while public expenditure is growing (Abdul-Rashid Abdul-Aziz & Normah Ali,
2004). Cost estimates could be influenced by different management and firms’ competencies (Morrison, 1999).
The use of different sources of estimates could provide the PWD with a different quality of estimates. The PWD
on client behalf could hire consultants to provide preliminary cost estimates. Nevertheless, only 57.8 % of QS
consultants met the expectation to complete this task (Abdul-Rashid Abdul-Aziz & Normah Ali, 2004).
A study made in Australia shows the accuracy of QS’ estimates has not improved over time (Aibinu & Pasco,
2008). According to Jackson (2002) quoted by Fortune (2006), most clients are not satisfied with the service
provided by QS for budget cost estimates. Therefore, the objectives of this study are:
a) To investigate the accuracy of Preliminary Cost Estimates in Public Works Department
3
b) To indentify the factors affecting the Quantity Surveyors in preparing accurate estimates.
a) To indentify the ways that can enhance the accuracy of the estimates.
Definition of accuracy
The meaning of accuracy is a lack of error. Lack of error results more accurate estimate. Accuracy is measured
according to bias and consistency (Skitmore, 1991). Bias concerns with the average differences between
estimates and tender bids and consistency is the degree of variation around the average. The greater the mean
differences, the greater the estimates said to be biased. Lesser error estimate is associated with more accurate
forecast. The lesser the degree of variation gained the greater the consistency of the forecast. It explains the
efficiency of a quantity surveyor performance over the number of estimates. The accuracy of estimates can be
measured using the percentage differences of estimates and tender bids (Gunner & Skitmore, 1999a; Skitmore,
1991; Skitmore, Stradling, Tuohy, & Mkwezalamba, 1990). These are as follows:
a) Estimate and lowest bid
b) Estimate and accepted bid
c) Estimate and mean of the bids
Factors affecting the Preliminary Cost Estimates
The estimates are influenced by a number of variables (Ashworth, 2010; Morton & Jaggar, 1995). These
variables are inter-correlated by other factors (Gunner & Skitmore, 1999b). Limited time to prepare estimates
and incomplete design scopes could result in inaccurate estimates (Aibinu & Pasco, 2008; Akintoye, 2000).
Nature of target, information, forecasting methods, feedback mechanism and the person who prepared the
forecast will decide the accuracy of early estimates (Skitmore, 1991). Serpell (2004) says scope, information,
uncertainty level, estimator and estimating procedure will influence the accuracy of estimates. The factors on
early cost estimate defined by these two authors are similar. The contractors’ estimates are for profit based
business while QS consultants are towards budget certainty (Skitmore, 1988). Sinclair et al. (2002) says 100%
estimating accuracy will not be achievable since it involves assessment of probabilities and risks.
Gunner and Skitmore (1999b) describes building type, type of contract, project value, price intensity,
construction period, number of bidders, economy condition, procurement basis, sector and location will
contribute to accuracy of estimates. Accuracy is also depending on progress of design works (Ashworth, 2010;
Chappell, et al., 2001; Park & Jackson, 1984; Potts, 2008). Estimating method used could also influence the
accuracy (Boussabaine, 2007; Skitmore & Patchell, 1999). By combining the literatures from numerous authors
the factors affecting the accuracy are defined as follows:
Table 1: The factors affecting accuracy of estimates
Scope quality Design scope (Plan shape, size m2, height, specification and
performance)
Design team experience (architect, engineers and etc)
Unclear documentation (project brief / drawings)
Location of project (site and soil conditions and extent of services)
Type and condition of contract
Basis of selection (open, selective and direct negotiation)
Commitment of client to project
Information
quality Cost data (historical and current information)
Uncertainty
level Project technology and complexity level
Market conditions and sentiments
Estimator
performance QS’ experience
Ability of QS to cope with stress (work pressure)
Communication barrier
Familiarity of QS with the type of projects
Perception of estimating importance
4
Quality of
estimating
procedure
Expected level of error in estimates
Limited time to prepare estimate due to dateline
Estimating method use in the preparation of estimates
Application of alternative methods by organisation
Organization’s estimating procedure
The accuracy of Preliminary Cost Estimates
Chappell et al. (2001) has decided the accuracy in term of error should be around +/-15% in early estimate and
5% in final estimate. Park and Jackson (1984) indicate the accuracy will improve from early design at +/-15%,
semi-detailed design at +/-10% and detailed design +/- 5%. Ashworth (2010) suggests the accuracy of estimates
on average is about +13% from contract sums. Morrison and Steven (1999) conclude the general consistency
should be around 15% to 20% for early design and 13% to 18% to detailed design stage. Refer Table 2.
Table 2: Summary of accuracy for early cost estimates (abstracted from Aibinu & Pasco, 2008;
Skitmore & Ng, 2003; Skitmore & Picken, 2000)
Rank Organization Location Period N Mean
Bias (%)
Coefficient
of variation
1 Hanscomb USA 1973-75 62 7.71
2 Hanscomb USA 1980-92 217 +5.19 7.82
3 Levett and Bailey Singapore 1980-91 86 +3.47 8.46
4 QS Office UK pre1984 55 +3.72 9.37
5 PW QS Office Australia 1970s 153 +5.85 9.73
6 QS Firm Australia 1999-2007 56 +4.29 10.17
7 QS Office UK pre1984 62 +2.89 10.88
8 County Council UK 1980s 61 +12.77 11.00
9 QS Office UK pre1984 89 -0.33 11.29
10 QS Office UK pre1984 222 +2.61 11.50
11 QS Office UK pre1984 62 -5.76 11.68
12 QS Office UK pre1984 115 +4.38 12.22
13 County Council8 UK 1971-77 63 c12.50
14 QS Firm Hong
Kong
1995-97 89 -1.78 12.95
15 PW Dept Belgium 1971-74 132 -5.17 13.13
16 QS Office Singapore 1980s 88 -0.18 14.13
17 County Council UK 1975-78 103 +11.50 c15.00
18 QS Office UK 1978 310 +5.86 15.52
19 City Council UK 1983-87 33 -4.91 18.11
20 PW Dept Belgium 1971-74 168 -1.45 18.37
21 Govt Agency USA 1975-84 292 +9.22 23.99
22 Levett and Bailey Singapore 1980-91 181 +10.32 28.30
*positive value of mean bias shows overestimated
The ways to improve the accuracy of Preliminary Cost Estimates
The preliminary cost estimates are needed to progress as the construction industry becomes more complicated. It
happens because the introduction of new technology and procurement options into the industry. The PWD and
QS consultants hired under them need to take action, so that they can enhance their estimating policies and
procedures. This ensures the estimates are in tolerable quality, more accurate and acceptable to clients. Some
researchers say the current estimating process should be improved and introduction of approaches should take
place in QS practices for sustainable approaches.
5
Improvement methods to current estimating practice
A number of authors have discussed about their concerns on estimates’ accuracy. There are a number of
researches on the factors which influence the estimating accuracy and the steps to improve it. However, these
researches are based on the procurement scenario and working systems of their respective countries. Ling and
Boo (2001) and Aibinu and Pasco (2008) analyzed the current estimating processes to prepare cost estimates as
the method to improve the accuracy which is practised in Singapore and Australia. Lin and Boo (2001) found
that a proper design documentation and information management are the most accepted method to improve the
current estimating process. QS should also check all assumptions and provide a realistic estimating period.
However, Aibinu and Pasco (2008) stressed that, sufficient information, all assumptions checked and use of cost
control and cost planning are the priority. As this research is done in Malaysia and focused on Public Works
Departments, the outcome of the research might be different from previous studies by Aibinu and Pasco (2008)
and Ling and Boo (2001). The methods used by them are as follows:
a) Proper design documentation and information management.
b) Effective communication and coordination between designers.
c) Sufficient design information from the designers.
d) Ascertained assumptions from designers and client.
e) Establish formal feedback for design and estimating activities.
f) Realistic time for estimating activity.
g) Use more rigorous estimating method.
h) Incorporate market sentiments and economic conditions into estimates.
i) Tender documents used as estimates.
j) Quantification of design and construction risks.
k) Cost planning and cost control during design stage.
l) Subdivided the large item into small items to reduce pricing errors.
m) Improve methods of selection, adjustments and application of cost data.
n) Update cost data with new cost and create feedback system for improving estimating accuracy.
Introduction of approaches to estimating procedures and policies
The Building Research Board (BRB) had been asked by Federal Construction Council of United States (NRC)
to review the current estimating practices for federal projects. The committee found that the use of faulty
estimating methods and procedures are not the primary reasons for budgets related problems. They have
suggested a number of steps should be taken by both government and private practices (BRB & NRC, 1990). In
addition, Royal Institution of Chartered Surveyors has introduced standardized guideline to reduce the practices
inconsistencies (Lee & Smith, 2010). These are as follows:
a) Invest and collaborating in cost estimate research between PWD and consultants.
b) Sharing of Cost Data among consultants and PWD.
c) Introduction of scientific based estimating methods i.e. Mathematical, Knowledge based, Value-related
and Neural models as alternative tools for decision making.
d) Introduction of value engineering.
e) Investing in estimating training for QS officers / consultants’ executives.
f) Introduction of standardize rules of measurement for estimating and cost planning in detail.
Research methodology
The quantitative method was employed to address the objective of this study. Questionnaires are designed for
data collection. In addition, project estimates and tender bids from Public Works Department (PWD) were used
to examine the accuracy of PCE. Questionnaires were sent to PWD QS officers and Private QS Consultants in
Peninsular Malaysia. This could give a different level of agreement. All QS in private consultants are hired by
PWD to provide cost advices. Questionnaires are intended to be answered by experience QS who are working
for 5 years or more. Information regarding respondents is provided by Cawangan Kontrak dan Ukur Bahan
(CKUB), PWD. 344 questionnaires were sent for this survey. Elhag et al. (2005) suggests the ideal return
responses is about 30% out of total questionnaires sent. Therefore, the sample collection should be at least 103
from both PWD QS officers and QS private practices combined. Accuracy of PCE is analyzed from samples of
6
completed projects. These samples are from Preliminary Detailed Abstract (PDA) and As Tendered Detailed
Abstract (ATDA).
Data Analysis
The questionnaire is designed to examine QS observation on factors affecting the QS in preparing accurate
estimates. In addition, questions are designed to identify the ways to improve the accuracy of preliminary cost
estimates. Data from projects are collected to investigate the accuracy of estimates. These are as follows:
a) Questionnaire survey analysis
b) Project data analysis (comparison between estimates and tender bids) for estimates’ accuracy
Questionnaire survey analysis
The following are the quantitative data analyses used for questionnaire survey analysis:
a) Cronbach’s Alpha (Reliability test)
b) The relative importance index
c) Mann-Whitney test
d) Kendall’s Coefficient of Concordance
Cronbach’s Alpha (reliability of the question)
This is for instrument reliability. It means the questionnaire should be consistent to reflect the construct that is
being measured. It measures the reliability of a scale. It is based on the idea that individual items or set of items
should produce consistent results with overall questionnaires (Field, 2009).
Alpha value varies from 0 to 1. The closer the Alpha values to 1, the greater the internal consistency of items for
the instrument being assumed. The acceptable value is 0.60 (Moss, et al., 1998). If more than 0.70 it is
considered as excellent in social sciences research (Nunnally & Bernstein, 1994). The formula for the
standardized Cronbach’s alpha:
α = k r
1 + (k-r)
k is number of items
r is average inter-item covariance among items
The relative importance index
Likert’s scale is used to measure levels of agreement. Each scale represents the following:
1 = not important
2 = little important
3 = somewhat important
4 = important
5 = very important
Then, relative importance index is used to rank the variables. This test was used by several researchers i.e.
Akintoye (2000) Elhag et al. (2005) and Odusami and Onukwube (2008). The relative importance index is as
follows:
∑ W = 5n5 + 4n4 + 3n3 + 2n2 + 1n1
AN 5N
W is the weighting given to each factor by the respondent, from 1 to 5
A is the highest weight (5 in the study)
N is the total number of samples
n1 to n5 is the number respondents answered each likert‟s scale
7
One-sample t-test
One sample t-test examines the mean score of a hypothesis value. The value of the mean for 5-point Likert’s
scale is 3. It was assumed that the mean score of 3 is the mean usefulness. The score below 3 is not considered
important. This test determines the difference between the expected and the actual score.
Mann-Whitney test
Mann-Whitney test is a nonparametric statistic used to look for differences in the ranks between two
independent samples. It tests whether the populations from two samples are drawn from the same distribution
(Field, 2009). This test is equivalent to parametric independent t-test. Mann-Whitney test is used to determine
whether there is a significant difference between the two (2) groups of respondents that is the PWD officers and
QS consultants. The following is the formula for Mann-Whitney test:
Ux = n1n2 + n1 (n1 + 1) - Tx
2
Uy = n1n2 + n1 (n1 + 1) - Ty
2
U = min (Ux,Uy), Tx and Ty : Rank sum of x and y
n1 is the sample size for example 1, n2 is the sample size for sample 2
Kendall’s coefficient of concordance
Kendall coefficient of concordance (W) is a nonparametric statistic used to evaluate the strength of agreement
between QS officers in PWD and QS in Private Sector regarding their opinions on each ranking for related
factors. It measures the extent of agreement between respondents. In social sciences, the variables are often
people assessing different subjects or situations (Legendre, 2010). Kendall’s (W) ranges 0 ≤ W ≤ 1. One (1) is in
perfect concordance (agreement). If the test statistic (W) is one (1), it means all respondents unanimously agree,
if W is zero, no agreement among respondents (Elhag, et al., 2005). Refer Table 3 for the interpretation of
Kendall’s W score.
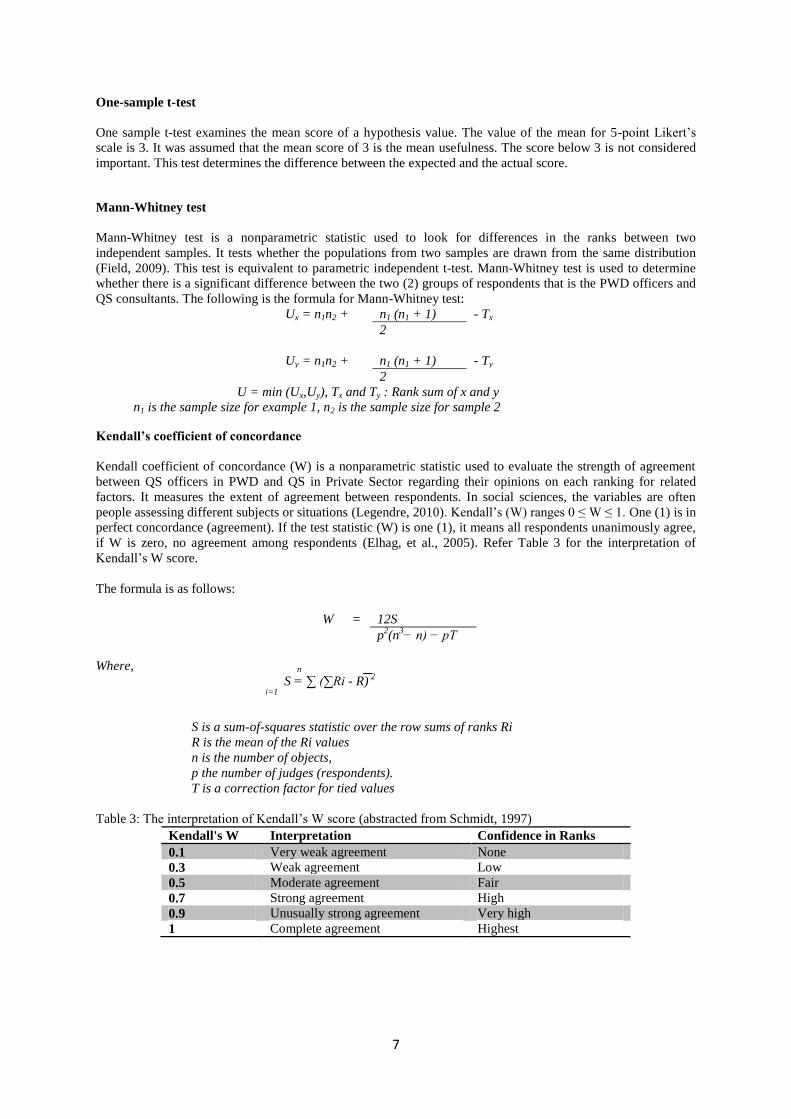
The formula is as follows:
W = 12S
p2(n
3− n) − pT
Where, n
S = ∑ (∑Ri - R) 2
i=1
S is a sum-of-squares statistic over the row sums of ranks Ri
R is the mean of the Ri values
n is the number of objects,
p the number of judges (respondents).
T is a correction factor for tied values
Table 3: The interpretation of Kendall’s W score (abstracted from Schmidt, 1997)
Kendall's W Interpretation Confidence in Ranks
0.1 Very weak agreement None
0.3 Weak agreement Low
0.5 Moderate agreement Fair
0.7 Strong agreement High
0.9 Unusually strong agreement Very high
1 Complete agreement Highest
8
Project data analysis
The following calculation is used to examine the accuracy of the PCE. It examines the mean bias and the
consistency of the PCE.
The following formula calculates the accuracy of an estimate:
Bias (%) = Forecast - Accepted bid x 100%
Accepted bid
Therefore, the mean bias of ( ) =
x = estimate bias; n= number of projects
Standard Deviation (s) of the estimates is as the following:
- ) 2/n
x = estimate bias; = mean estimate bias; n= number of project
Then, coefficient of variation measures the consistency of the estimates
CV =
Results
Questionnaires were sent to senior executives and senior officers of PWD and private consultants. All
respondents from PWD have at least 5 years experience. Respondents from private consultants which have at
least 5 years experience are 75.5%. Overall 92% of the respondents (PWD + private consultants) have at least 5
years experience. Out of this, 40.1% of the respondents have more than 15 years experience. So, questionnaire
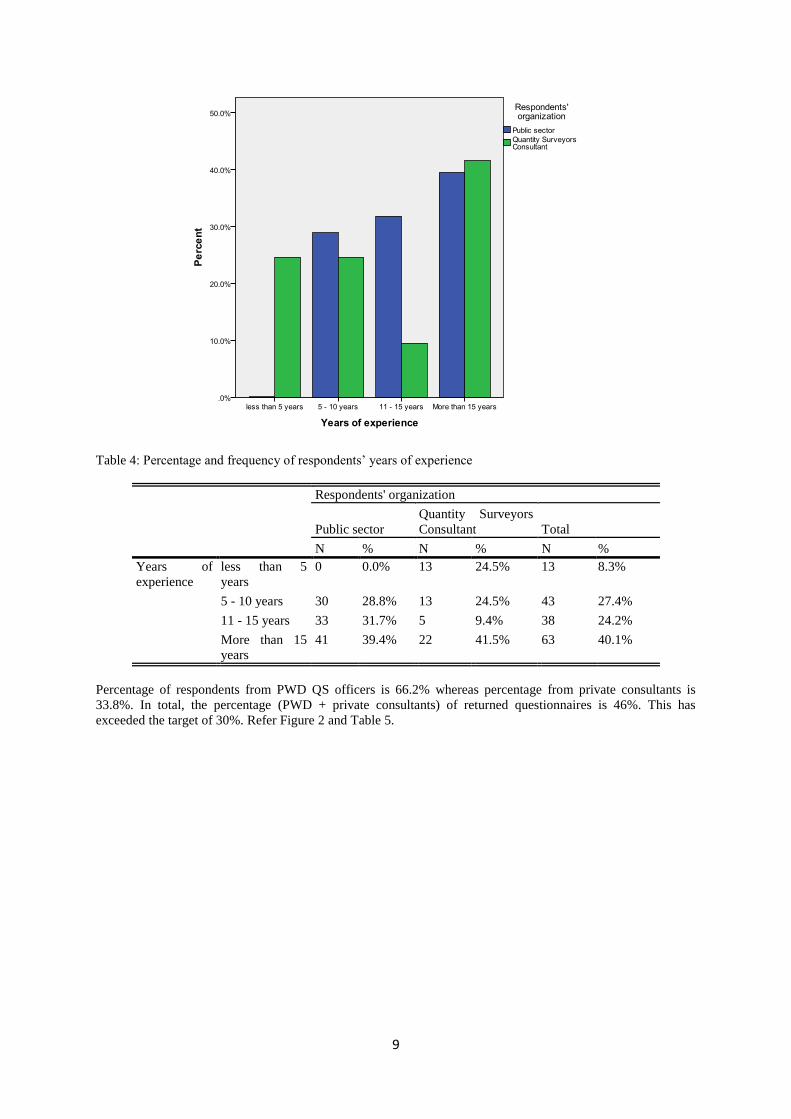
survey has achieved its target to have experience respondents. Refer Figure 1 and Table 2.
Figure 1: Percentage of respondents’ years of experience
∑x
N
Standard deviation of ratio forecast / tender bid x 100%
Mean estimate ratio forecast / tender bid
9
Table 4: Percentage and frequency of respondents’ years of experience
Respondents' organization
Public sector
Quantity Surveyors
Consultant Total
N % N % N %
Years of
experience
less than 5
years
0 0.0% 13 24.5% 13 8.3%
5 - 10 years 30 28.8% 13 24.5% 43 27.4%
11 - 15 years 33 31.7% 5 9.4% 38 24.2%
More than 15
years
41 39.4% 22 41.5% 63 40.1%
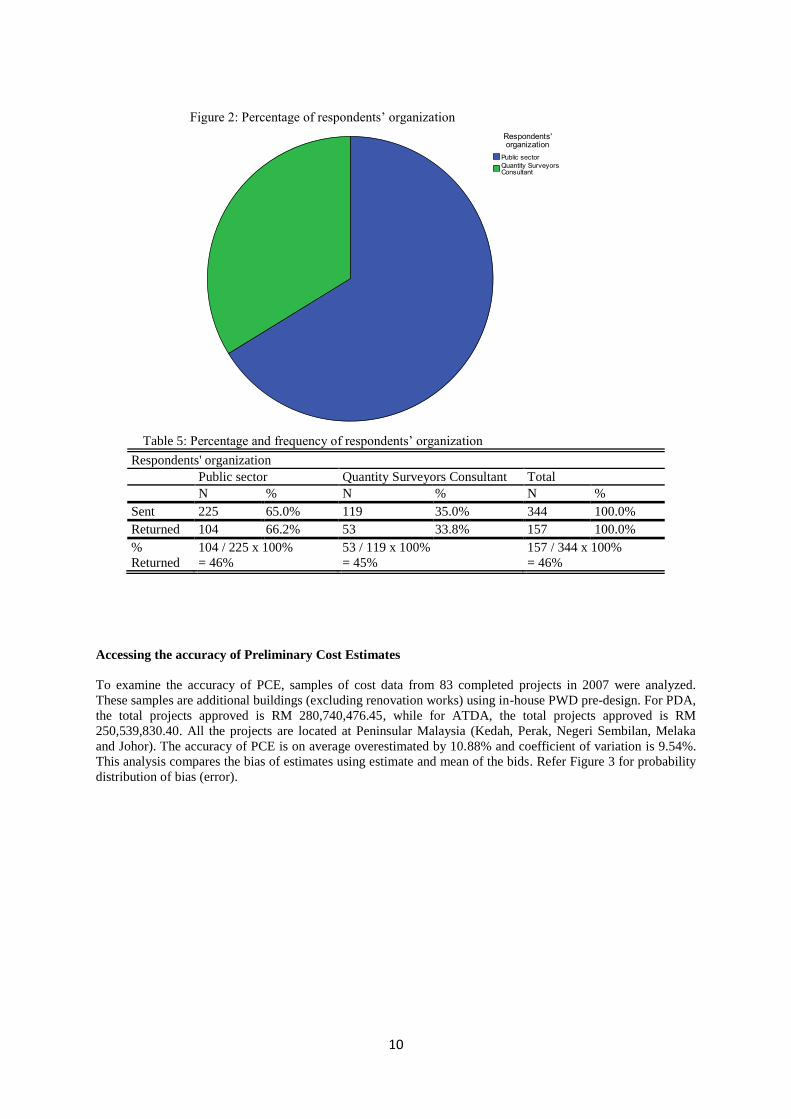
Percentage of respondents from PWD QS officers is 66.2% whereas percentage from private consultants is
33.8%. In total, the percentage (PWD + private consultants) of returned questionnaires is 46%. This has
exceeded the target of 30%. Refer Figure 2 and Table 5.
10
Figure 2: Percentage of respondents’ organization
Table 5: Percentage and frequency of respondents’ organization
Respondents' organization
Public sector Quantity Surveyors Consultant Total
N % N % N %
Sent 225 65.0% 119 35.0% 344 100.0%
Returned 104 66.2% 53 33.8% 157 100.0%
%
Returned
104 / 225 x 100%
= 46%
53 / 119 x 100%
= 45%
157 / 344 x 100%
= 46%
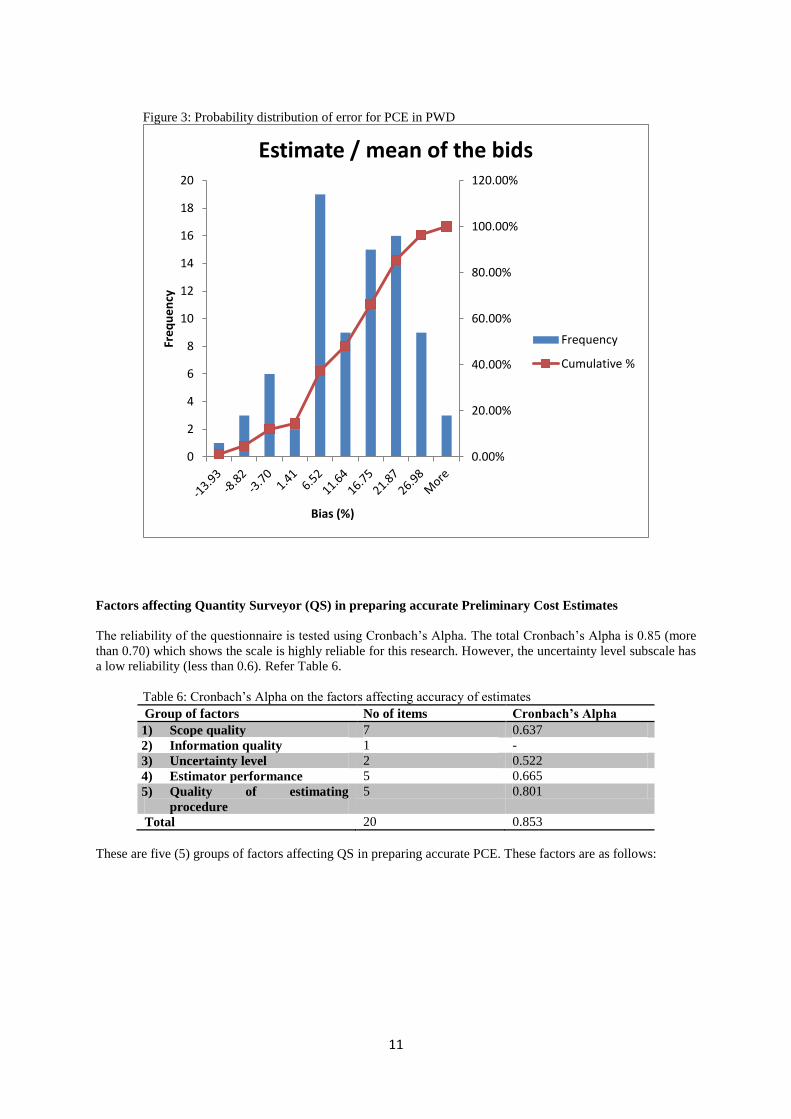
Accessing the accuracy of Preliminary Cost Estimates
To examine the accuracy of PCE, samples of cost data from 83 completed projects in 2007 were analyzed.
These samples are additional buildings (excluding renovation works) using in-house PWD pre-design. For PDA,
the total projects approved is RM 280,740,476.45, while for ATDA, the total projects approved is RM
250,539,830.40. All the projects are located at Peninsular Malaysia (Kedah, Perak, Negeri Sembilan, Melaka
and Johor). The accuracy of PCE is on average overestimated by 10.88% and coefficient of variation is 9.54%.
This analysis compares the bias of estimates using estimate and mean of the bids. Refer Figure 3 for probability
distribution of bias (error).
11
Figure 3: Probability distribution of error for PCE in PWD
Factors affecting Quantity Surveyor (QS) in preparing accurate Preliminary Cost Estimates
The reliability of the questionnaire is tested using Cronbach’s Alpha. The total Cronbach’s Alpha is 0.85 (more
than 0.70) which shows the scale is highly reliable for this research. However, the uncertainty level subscale has
a low reliability (less than 0.6). Refer Table 6.
Table 6: Cronbach’s Alpha on the factors affecting accuracy of estimates
Group of factors No of items Cronbach’s Alpha
1) Scope quality 7 0.637
2) Information quality 1 -
3) Uncertainty level 2 0.522
4) Estimator performance 5 0.665
5) Quality of estimating
procedure
5 0.801
Total 20 0.853
These are five (5) groups of factors affecting QS in preparing accurate PCE. These factors are as follows:
0.00%
20.00%
40.00%
60.00%
80.00%
100.00%
120.00%
0
2
4
6
8
10
12
14
16
18
20 Fr
eq
ue
ncy
Bias (%)
Estimate / mean of the bids
Frequency
Cumulative %
12
Scope quality
Table 7 shows Relative Importance Index (RII) of respondents’ perspective. There are different factors of scope
quality contributing to accuracy of PCE. The results show design scopes, design team experience, location of the
project and unclear documentation are the most significant effect on accuracy of estimates. Contract type,
selection basis and client’s commitment is the least noticed by respondents. Design scopes and location of the
project is one (1) three and (3) respectively out of the total of 20 factors. Mann-Whitney test (P<0.05) shows
significant differences of agreement between groups of respondents. Private consultants do not agree to location
of project as important contrary to that of the QS in PWD. QS in private consultants also believe the basis of
selection contribute the least to the accuracy of PCE. The Kendall's W is 0.235 (P<0.05). There is a significant
but weak degree of agreement among the PWD officers and consultants in this group. One-sample t-test shows
these factors have a midpoint of 3 in Likert’s scale score (p<0.05). Thus, these factors are considered important.
Table 7: Relative Importance Index for scope quality
Factor PWD QS Private QS Group Rank Total
RII
Rank RII
Score
RII
Rank
RII
Score
RII
Rank
RII
Score
RII
Rank
1) Design scope (Size of
project, height, shapes
and specification)
0.939 1 0.932 1 0.937 1 1
2) Design team experience 0.833 8 0.867 4 0.845 2 5
3) Unclear documentation 0.828 9 0.800 7 0.819 4 9
4) Location of project 0.895 2 0.811 6 0.867 3 3
5) Type and condition of
contract
0.740
13
0.694
15
0.724
5
14
6) Basis of Selection 0.773 11 0.683 16 0.742 6 12
7) Commitment of a client
to project
0.717
15
0.683
17
0.705
7
16
Information Quality
Table 8 shows cost data is ranked no.2 of the total 20 factors. The cost data include both historical and current
cost. Cost data is the second most important factor affecting the accuracy. One-sample t-test shows this factor
has a midpoint of 3 (p<0.05) in Likert’s scale score (p<0.05). Thus, this factor is considered important.
Table 8: Relative Importance Index for information quality
Factor
PWD QS Private QS Group Rank Total
RII
Rank RII
Score
RII
Rank
RII
Score
RII
Rank
RII
Score
RII
Rank
Cost data 0.876 3 0.890 2 0.881 - 2
Uncertainty level
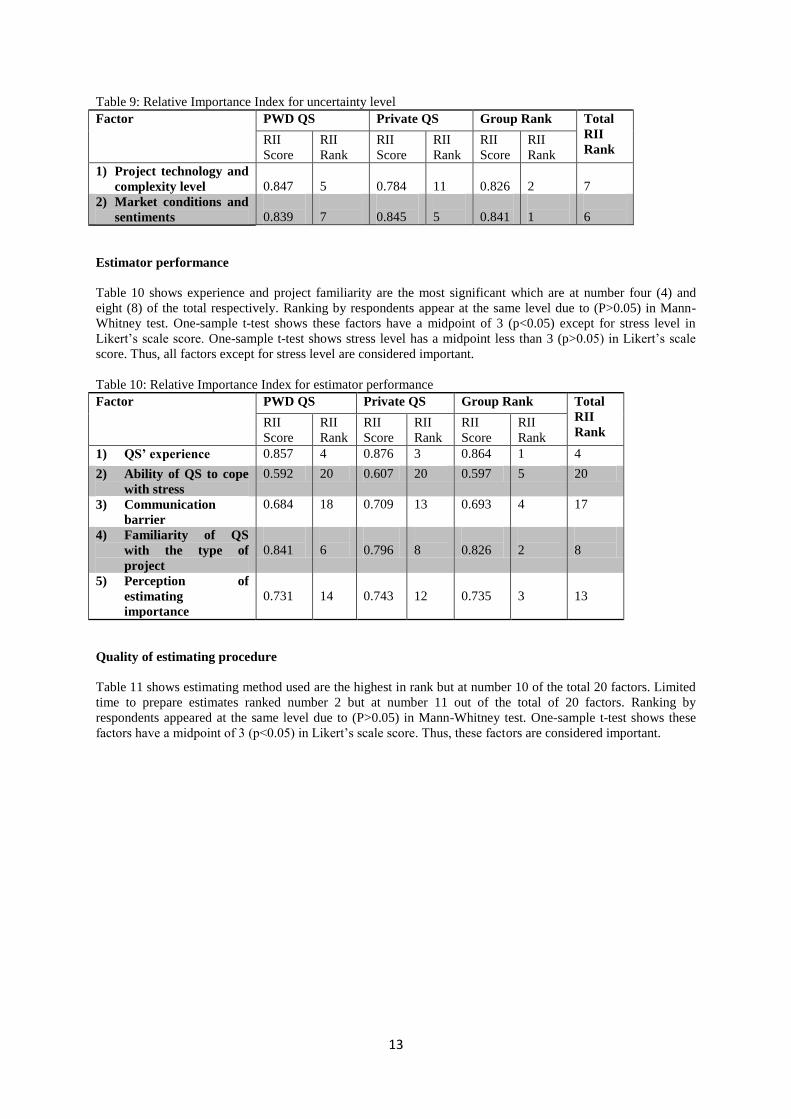
Table 9 shows market conditions and uncertainty level are ranked at number six (6) and seven (7) respectively.
The difference in opinions is observed for project technology and complexity level. Mann-Whitney test
(P<0.05) shows there are significant differences of agreement between the groups of respondents. Technology
and complexity level is more significant to QS in PWD. The Kendall's W is 0.482 (P<0.05). There is a
significant but moderate degree of agreement among the PWD officers and consultants in this group. One-
sample t-test shows these factors have a midpoint of 3 (p<0.05) in Likert’s scale score. Thus, these factors are
considered important.
13
Table 9: Relative Importance Index for uncertainty level
Factor PWD QS Private QS Group Rank Total
RII
Rank RII
Score
RII
Rank
RII
Score
RII
Rank
RII
Score
RII
Rank
1) Project technology and
complexity level
0.847
5
0.784
11
0.826
2
7
2) Market conditions and
sentiments
0.839
7
0.845
5
0.841
1
6
Estimator performance
Table 10 shows experience and project familiarity are the most significant which are at number four (4) and
eight (8) of the total respectively. Ranking by respondents appear at the same level due to (P>0.05) in Mann-
Whitney test. One-sample t-test shows these factors have a midpoint of 3 (p<0.05) except for stress level in
Likert’s scale score. One-sample t-test shows stress level has a midpoint less than 3 (p>0.05) in Likert’s scale
score. Thus, all factors except for stress level are considered important.
Table 10: Relative Importance Index for estimator performance
Factor PWD QS Private QS Group Rank Total
RII
Rank RII
Score
RII
Rank
RII
Score
RII
Rank
RII
Score
RII
Rank
1) QS’ experience 0.857 4 0.876 3 0.864 1 4
2) Ability of QS to cope
with stress
0.592 20 0.607 20 0.597 5 20
3) Communication
barrier
0.684 18 0.709 13 0.693 4 17
4) Familiarity of QS
with the type of
project
0.841
6
0.796
8
0.826
2
8
5) Perception of
estimating
importance
0.731
14
0.743
12
0.735
3
13
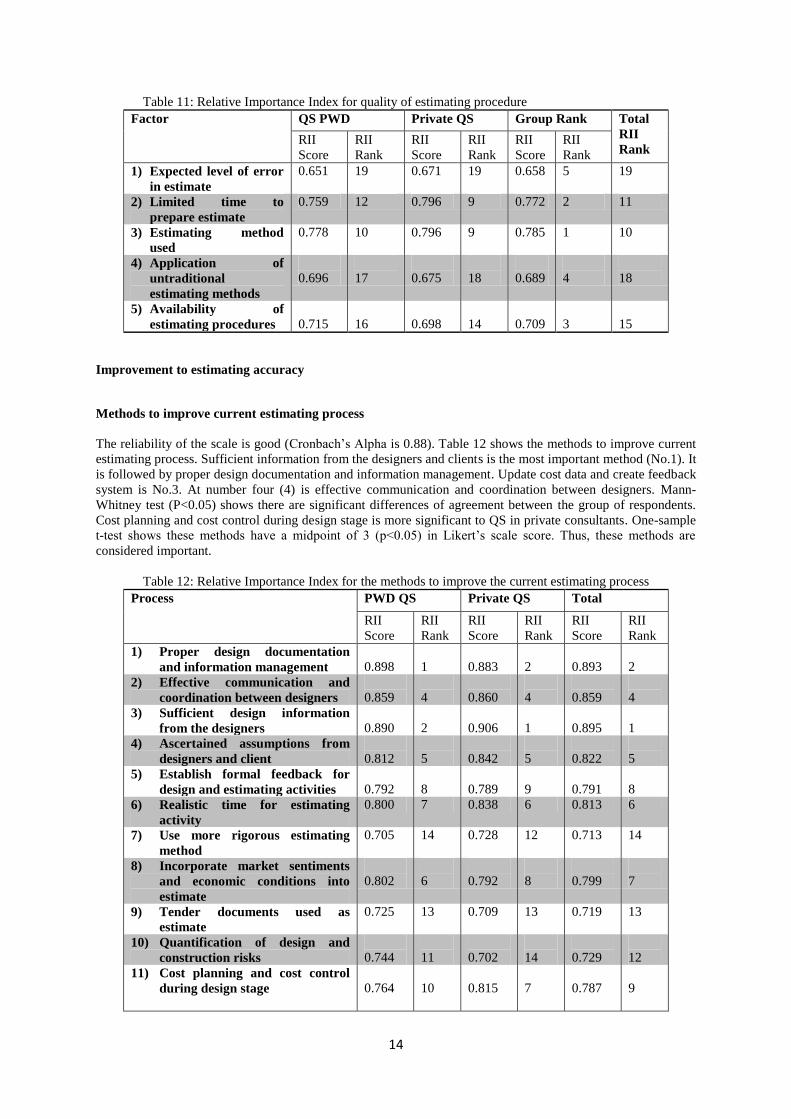
Quality of estimating procedure
Table 11 shows estimating method used are the highest in rank but at number 10 of the total 20 factors. Limited
time to prepare estimates ranked number 2 but at number 11 out of the total of 20 factors. Ranking by
respondents appeared at the same level due to (P>0.05) in Mann-Whitney test. One-sample t-test shows these
factors have a midpoint of 3 (p<0.05) in Likert’s scale score. Thus, these factors are considered important.
14
Table 11: Relative Importance Index for quality of estimating procedure
Factor QS PWD Private QS Group Rank Total
RII
Rank RII
Score
RII
Rank
RII
Score
RII
Rank
RII
Score
RII
Rank
1) Expected level of error
in estimate
0.651 19 0.671 19 0.658 5 19
2) Limited time to
prepare estimate
0.759 12 0.796 9 0.772 2 11
3) Estimating method
used
0.778 10 0.796 9 0.785 1 10
4) Application of
untraditional
estimating methods
0.696
17
0.675
18
0.689
4
18
5) Availability of
estimating procedures
0.715
16
0.698
14
0.709
3
15
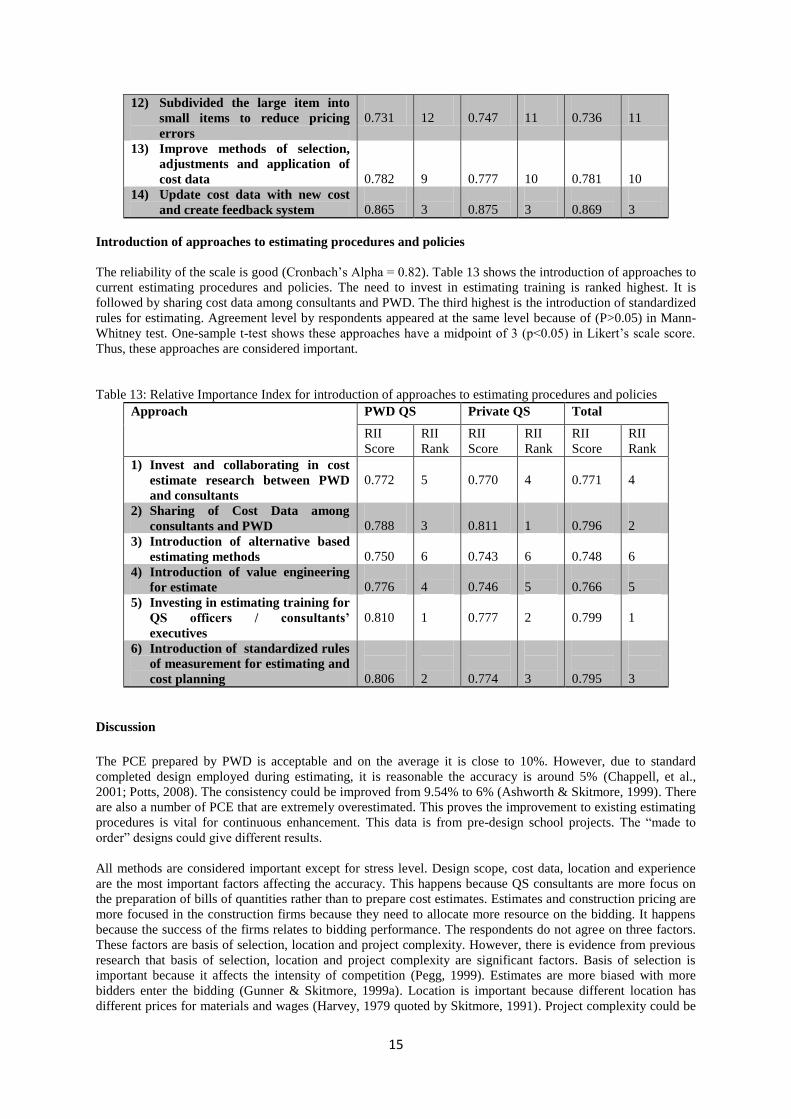
Improvement to estimating accuracy
Methods to improve current estimating process
The reliability of the scale is good (Cronbach’s Alpha is 0.88). Table 12 shows the methods to improve current
estimating process. Sufficient information from the designers and clients is the most important method (No.1). It
is followed by proper design documentation and information management. Update cost data and create feedback
system is No.3. At number four (4) is effective communication and coordination between designers. Mann-
Whitney test (P<0.05) shows there are significant differences of agreement between the group of respondents.
Cost planning and cost control during design stage is more significant to QS in private consultants. One-sample
t-test shows these methods have a midpoint of 3 (p<0.05) in Likert’s scale score. Thus, these methods are
considered important.
Table 12: Relative Importance Index for the methods to improve the current estimating process
Process PWD QS Private QS Total
RII
Score
RII
Rank
RII
Score
RII
Rank
RII
Score
RII
Rank
1) Proper design documentation
and information management
0.898
1
0.883
2
0.893
2
2) Effective communication and
coordination between designers
0.859
4
0.860
4
0.859
4
3) Sufficient design information
from the designers
0.890
2
0.906
1
0.895
1
4) Ascertained assumptions from
designers and client
0.812
5
0.842
5
0.822
5
5) Establish formal feedback for
design and estimating activities
0.792
8
0.789
9
0.791
8
6) Realistic time for estimating
activity
0.800 7 0.838 6 0.813 6
7) Use more rigorous estimating
method
0.705 14 0.728 12 0.713 14
8) Incorporate market sentiments
and economic conditions into
estimate
0.802
6
0.792
8
0.799
7
9) Tender documents used as
estimate
0.725 13 0.709 13 0.719 13
10) Quantification of design and
construction risks
0.744
11
0.702
14
0.729
12
11) Cost planning and cost control
during design stage
0.764
10
0.815
7
0.787
9
15
12) Subdivided the large item into
small items to reduce pricing
errors
0.731
12
0.747
11
0.736
11
13) Improve methods of selection,
adjustments and application of
cost data
0.782
9
0.777
10
0.781
10
14) Update cost data with new cost
and create feedback system
0.865
3
0.875
3
0.869
3
Introduction of approaches to estimating procedures and policies
The reliability of the scale is good (Cronbach’s Alpha = 0.82). Table 13 shows the introduction of approaches to
current estimating procedures and policies. The need to invest in estimating training is ranked highest. It is
followed by sharing cost data among consultants and PWD. The third highest is the introduction of standardized
rules for estimating. Agreement level by respondents appeared at the same level because of (P>0.05) in Mann-
Whitney test. One-sample t-test shows these approaches have a midpoint of 3 (p<0.05) in Likert’s scale score.
Thus, these approaches are considered important.
Table 13: Relative Importance Index for introduction of approaches to estimating procedures and policies
Approach PWD QS Private QS Total
RII
Score
RII
Rank
RII
Score
RII
Rank
RII
Score
RII
Rank
1) Invest and collaborating in cost
estimate research between PWD
and consultants
0.772
5
0.770
4
0.771
4
2) Sharing of Cost Data among
consultants and PWD
0.788
3
0.811
1
0.796
2
3) Introduction of alternative based
estimating methods
0.750
6
0.743
6
0.748
6
4) Introduction of value engineering
for estimate
0.776
4
0.746
5
0.766
5
5) Investing in estimating training for
QS officers / consultants’
executives
0.810
1
0.777
2
0.799
1
6) Introduction of standardized rules
of measurement for estimating and
cost planning
0.806
2
0.774
3
0.795
3
Discussion
The PCE prepared by PWD is acceptable and on the average it is close to 10%. However, due to standard
completed design employed during estimating, it is reasonable the accuracy is around 5% (Chappell, et al.,
2001; Potts, 2008). The consistency could be improved from 9.54% to 6% (Ashworth & Skitmore, 1999). There
are also a number of PCE that are extremely overestimated. This proves the improvement to existing estimating
procedures is vital for continuous enhancement. This data is from pre-design school projects. The “made to
order” designs could give different results.
All methods are considered important except for stress level. Design scope, cost data, location and experience
are the most important factors affecting the accuracy. This happens because QS consultants are more focus on
the preparation of bills of quantities rather than to prepare cost estimates. Estimates and construction pricing are
more focused in the construction firms because they need to allocate more resource on the bidding. It happens
because the success of the firms relates to bidding performance. The respondents do not agree on three factors.
These factors are basis of selection, location and project complexity. However, there is evidence from previous
research that basis of selection, location and project complexity are significant factors. Basis of selection is
important because it affects the intensity of competition (Pegg, 1999). Estimates are more biased with more
bidders enter the bidding (Gunner & Skitmore, 1999a). Location is important because different location has
different prices for materials and wages (Harvey, 1979 quoted by Skitmore, 1991). Project complexity could be
16
explained by the project value. Finding by Aibinu and Pasco (2008) shows project value is the significant factor
which explains the bias in the estimates. Only uncertainty level has a moderate degree of agreement. This
explains why QS experience is subjective rather than specific in general (Ashworth & Skitmore, 1999). This
shows data analysis on project data is the best to determine these factors in future research. It happens because
QS could not see the persistent error trend that developed during estimation (Morrison, 1999).
All methods are considered important. The most important methods suggested by most respondents are
sufficient design information, ensure proper documentation and cost data update. This indicates they are more
concerned with information supplied to QS from designers. These outcomes are slightly different when
compared to Ling and Boo (2001) and Aibinu and Pasco (Aibinu & Pasco, 2008). They suggest the need of QS
to be proactive in ensuring sufficient design information, the use of cost control and cost planning and sufficient
estimating time. The concern about information quality during estimation could be one of the reasons why the
estimates are overestimated (Soo & Oo, 2007). A QS provided with insufficient information will see his
estimate most likely to be overestimated due to bias as he fills the gap with inappropriate mark-ups and
construction items.
All approaches are considered important. However, the best approach to improve the estimating procedures and
policies are for QS in both public agencies and private consultants to invest more in estimating training. A
rigorous estimating syllabus could be used to enhance the knowledge of new recruits. It is because most
universities and colleges are more focused towards training the graduates with the knowledge to prepare bills of
quantities (Hackett & Hicks, 2007). QS in both public agencies and private consultants should share cost data
among themselves. There are many buildings that shared the same contextual requirements built by different
government departments. Then, there is a need to introduce standardized rules of measurement for estimating
and cost planning. This could be the ways to reduce the inconsistencies voiced by private consultants (Abdul-
Rashid Abdul-Aziz & Normah Ali, 2004). They found that the use of different terminologies affects private
consultants when they take-up government projects. This standard could define the level of information based
on the completeness of design. As for know, the estimates are prepared using limited information. However,
there must be acceptable level of information to be supplied by the designers to QS.
Conclusion and Recommendation
Preliminary Cost Estimate is one of the most important services offered by both Public and Private Quantity
Surveyors (PPQS). Therefore, continuous improvement can increase the quality of the estimates prepared for
public projects. PPQS has to be vigilant and take necessary action when preparing the estimates as there are a
number of factors that will affect the accuracy of estimates. These five (5) factors are design scopes, cost data,
location, PPQS experience and design team experience. PPQS should make necessary effort using various
scientific and good approaches while preparing PCE in order to recognize these important factors. Follow up
studies should be done on the factors. Thus, we can understand precisely on how it will affect the accuracy of
PCE as perception could lead to bias. Consequently the data analysis on project data could remove this
uncertainty. The current estimating process could also improve if problems related to insufficient information
are overcome. PPQS need to decide the acceptable level of information from designers.
Some introduction of good approaches into the policies and procedures could improve the accuracy of PCE. The
improvement in estimating might be done if PPQS are willing to invest in employees’ continuous training.
Knowledge for estimating are transferable as it can be learnt over time. There is a need to have a proper
estimating syllabus in their training. QS in both public agencies and private consultants could also share their
cost data as some projects do share similar contextual requirements. It is a good initiative if an information
sharing system among PWD and private consultants is available. The introduction of standardized rules for
estimating and cost planning could also be introduced. This could point out the acceptable level of information
needed by PPQS. The use of standard terminologies may reduce ambiguities and increase common
understanding among PPQS.
Finally, all these improvements could contribute to Public-Private Partnerships through the Government
Transformation Program (GTP). To remain sustainable in the challenging world today, continuous improvement
in estimating will equip PPQS with knowledge and skills for them to adapt in this dynamic world. This could
increase the efficiency of public project management and delivery.
17
Authors’ comment on this paper according to convention theme
Estimating is a dry subject, but it is one of the most important specializations to QS. Transformation is to adapt
to the new environments and challenges. Adaptation requires improvement on current ways of working and
introduction of new things to suit the need of the trends. The old ways of working may need to improve because
more countries have moved forward to benchmark themselves against world standard. To sustain in knowledge
based economy the improvement of QS core services like estimating is necessary for retooling.
REFERENCES
1. Abdul-Rashid Abdul-Aziz, & Normah Ali. (2004). Outsourcing and quality performance: Malaysia's
public works department. Structural Survey, 22(1), 53-60.
2. Aibinu, A. A., & Pasco, T. (2008). The accuracy of pre-tender building cost estimates in Australia.
Construction Management and Economics, 26(12), 1257 - 1269.
3. Akintoye, A. (2000). Analysis of factors influencing project cost estimating practice. Construction
Management and Economics, 18(1), 77 - 89.
4. Ashworth, A. (2010). Cost studies of buildings (5 ed.). Essex: Pearson Education Limited.
5. Ashworth, A., & Skitmore, M. (1999). Accuracy in estimating. In M. Skitmore & V. Marston (Eds.),
Cost modelling (pp. 412-437). London: E & FN Spon.
6. Boussabaine, A. (2007). Cost planning of PFI and PPP building projects. Oxford: Taylor & Francis.
7. BRB, & NRC. (1990). Improving the accuracy of early cost estimates for federal construction projects.
Washington DC: National Academic Press.
8. Chappell, D., Marshall, D., Powell-Smith, V., & Cavender, S. (2001). Building contract dictionary.
Oxford: Blackwell Science Ltd.
9. Cheung, F. K. T., Wong, M. W. L., & Skitmore, M. (2008). A study of clients' and estimators'
tolerance towards estimating errors. Construction Management and Economics, 26(4), 349 - 362.
10. Elhag, T. M. S., Boussabaine, A., & Ballal, T. M. A. (2005). Critical determinants of construction
tendering costs: Quantity surveyors' standpoint. International Journal of Project Management, 23(7),
538-545.
11. Field, A. (2009). Discovering statistics using SPSS (2nd ed.). London: Sage Publications Ltd.
12. Fortune, C. (2006). Process standardisation and the impact of professional judgement on the
formulation of building project budget price advice. Construction Management and Economics, 24(10),
1091 - 1098.
13. Gunner, J., & Skitmore, M. (1999a). Comparative analysis of pre-bid forecasting of building prices
based on Singapore data. Construction Management and Economics, 17(5), 635-646.
14. Gunner, J., & Skitmore, M. (1999b). Pre-bid building price forecasting accuracy: price intensity theory.
Engineering, Construction and Architectural Management, 6(3), 267 - 275.
15. Hackett, J. A., & Hicks, C. M. (2007). Estimating as a profession in UK construction. Engineering
Construction and Architectural Management, 14(1), 26-51.
16. Hughes, W., Hillebrandt, Greenwood, D., & Kwawu, W. (2006). Procurement in the construction
industry – the impact and cost of alternative market and suppy processes. London: Taylor & Francis.
17. Karlsen, J. T., & Lereim, J. (2005). Management of project contingency and allowance. Cost
Engineering, 47(9), 24-29.
18. Kirkham, R. (2007). Ferry and Brandon's cost planning of buildings (8th ed.). Oxford: Blackwell
Publishing.
19. Lee, S., & Smith, A. (2010). New rules of measurement – order of cost estimating and elemental cost
planning. London: The College of Estate Management, Royal Institute of Chartered Surveyors.
20. Legendre, P. (2010). Coefficient of concordance. In N. J. Salkind (Ed.), Encyclopedia of Research
Design. California: SAGE Publications, Inc.
21. Ling, Y. Y., & Boo, J. H. S. (2001). Improving the accuracy of approximate estimates of building
projects. Building Research & Information, 29(4), 312-318.
22. Ministry of Finance. (1958). Federal government building projects - Treasury circular no.3 year 1958.
Kuala Lumpur: Ministry of Finance.
23. Morrison, N. (1999). The accuracy of quantity surveyor's cost estimating. In M. Skitmore & V.
Marston (Eds.), Cost modelling (pp. 438-459). London: E & FN Spon.
24. Morton, R., & Jaggar, D. (1995). Design and the Economics of Building: Spon Press.
25. Moss, S., Prosser, H., Costello, H., Simpson, N., Patel, P., Rowe, S., et al. (1998). Reliability and
validity of the PAS-ADD Checklist for detecting psychiatric disorders in adults with intellectual
disability. Journal of Intellectual Disability Research, 42(2), 173-183.
18
26. Nunnally, J., & Bernstein, I. (1994). Pyschometric theory (3rd ed.). New York: McGraw-Hill.
27. Odusami, K. T., & Onukwube, H. N. (2008). Factors affecting the accuracy of pre-tender cost estimate
in nigeria. Paper presented at the The Construction and Building Research Conference of the Royal
Institution of Chartered Surveyors, Dublin Institute of Technology.
28. Park, W. R., & Jackson, D. E. (1984). Cost engineering analysis: A guide to economic evaluation of
Engineering projects. New York: John Wiley & Sons, Inc.
29. Pegg, I. (1999). The effect of location and other measureable parameters on tender levels. In M.
Skitmore & V. Marston (Eds.), Cost modelling (pp. 293-306). London: E & FN Spon.
30. Peurifoy, R., & Oberlender, G. (2006). Estimating construction costs (5th ed.). New York.: McGraw-
Hill Higher Education.
31. Potts, K. (2008). Construction cost management: learning from case studies. Oxford: Taylor & Francis
Group.
32. Prime Minister Department. (2005). General circular no.4. Putrajaya: Prime Minister Department.
33. Public Works Department. (2010). Guideline for public works' contract management (3rd ed.). Kuala
Lumpur: Public Works Department.
34. Schmidt, R. C. (1997). Managing Delphi Surveys Using Nonparametric Statistical Techniques.
Decision Sciences, 28(3), 763–774.
35. Seeley, I. H. (1996). Building economics: appraisal and control of building design cost and efficiency
36. (4th ed.). London: Macmillan Press.
37. Serpell, A. (2004). Towards a knowledge-based assesment of conceptual cost estimates. Building
Research & Information, 32(2), 157-164.
38. Sinclair, N., Artin, P., & Mulford, S. (2002). Construction cost data workbook. Paper presented at the
Conference on the International Comparison Program, Washington, D.C.
39. Skitmore, M. (1988). Fundamental research in bidding and estimating. Paper presented at the
British/Israeli Seminar on Building Economics: The International Council for Building Research
Studies and Documentation CIB W-55, Haifa, Israel.
40. Skitmore, M. (1991). Early stage construction price forecasting: A review of performance. London:
RICS.
41. Skitmore, M., & Ng, T. (2003). Forecast models for actual construction time and cost. Building and
Environment, 38(2003), 1075-1083.
42. Skitmore, M., & Patchell, B. R. T. (1999). Developments in contract price forcecasting and bidding
technique. In M. Skitmore & V. Marston (Eds.), Cost modelling (pp. 53-84). London: E & FN Spon.
43. Skitmore, M., & Picken, D. H. (2000). The accuracy of pre-tender building price forecasts: an analysis
of USA data. Australian Institute of Quantity Surveyors Refered Journal, 4(1), 33-39.
44. Skitmore, M., Stradling, S. G., Tuohy, A. P., & Mkwezalamba, H. (1990). The accuracy of
construction price forecasts A study of quantity surveyors' performance in early stage estimating:
Department of Surveying, University of Salford.
45. Soo, A., & Oo, B. L. (2007). The effect of information feedback in construction bidding. Australasian
Journal of Construction Economics and Building, 10(1/2), 65‐75.


![[Act 487] Quantity Surveyors Act 1967](https://img.pdfslide.us/doc/110x75/577cc9c41a28aba711a4900f/act-487-quantity-surveyors-act-1967.jpg)