Embed Size (px)
Citation preview
Personalizing the theme park:
Psychometric profiling and physiological monitoring
Stefan Rennick-Egglestone 1, Amanda Whitbrook
2, Caroline Leygue
3,
Julie Greensmith 1, Brendan Walker
4, Steve Benford
1, Holger Schnädelbach
1,
Stuart Reeves 3, Joe Marshall
1, David Kirk
1, Paul Tennent
1,
Ainoje Irune 1 and Duncan Rowland
5
1 School of Computer Science, University of Nottingham, Jubilee Campus,
Wollaton Road, Nottingham, NG8 1BB
{sre,jqg,sdb,hms,jqm,dsk,pxt,aai}@cs.nott.ac.uk 2 BAE Systems, Systems Engineering Innovation Centre, University of Loughborough,
Holywell Park, Loughborough, LE11 3TU
[email protected] 3 Horizon Digital Economy Research, Sir Colin Campbell Building,
University of Nottingham Innovation Park, Triumph Road, Nottingham, NG7 2TU 4 Aerial, 258 Globe Road, London, E2 0JD
[email protected] 5 School of Computer Science, University of Lincoln, Brayford Pool, Lincoln, LN6 7TS
Abstract. Theme parks are important and complex forms of entertainment, with
a broad user-base, and with a substantial economic impact. In this paper, we
present a case study of an existing theme park, and use this to motivate two
research challenges in relation to user-modeling and personalization in this
environment: developing recommender systems to support theme park visits,
and developing rides that are personalized to the users who take part in them.
We then provide an analysis, drawn from a real-world study on an existing ride,
which illustrates the efficacy of psychometric profiling and physiological
monitoring in relation to these challenges. We conclude by discussing further
research work that could be carried out within the theme park, but motivate this
research by considering the broader contribution to user-modeling issues that it
could make. As such, we present the theme park as a microcosm which is
amenable to research, but which is relevant in a much broader setting.
Keywords: Psychometrics, physiological monitoring, theme park.
1 Introduction
Leisure and entertainment is a topic of interest for researchers involved in user-
modeling and personalization. One application is e-commerce systems such as
Amazon or eBay. These provide personalized, collaborative recommendations for
leisure items such as books, DVDs and computer games, generated through an
analysis of on-line activities [1]. Other applications include the personalized
recommendation of leisure activities to partake in whilst on holiday [2], or the
recommendations of playlists of music [3]. Working within a framework of affective
computing [4], there have been attempts to model human emotions such as frustration
[5], based on data collected from sensors. Prototypes of games that detect and respond
to these emotions have then been built, using a variety of sensing devices and
prosthetics to gather data (for example, [6]).
Approaching the theme of leisure and entertainment from a novel direction, this
paper motivates the application of personalization technologies to theme parks, which
are highly complex entertainment spaces that contain a wide variety of different forms
of attraction. As a whole, the theme park industry caters for hundreds of millions of
visitors every year [7], and theme park operators have significant budgets to spend on
novel forms of entertainment. Although the theme park provides enormous scope for
computational interventions, there are few examples of published research in the
theme park. An exception is [8], and the authors have also developed a number of
publications around the theme park. So far, these have focused on issues such as
building novel interfaces for spectators [9], and the prototyping of new forms of ride
[10,11]. An initial investigation into the use of user-profiling technologies in the
theme park has also been published [12].
Building on this research program, this paper makes a contribution to research
through a detailed exploration of the personalization of theme park experiences for
visitors. It begins by providing a case-study of a typical theme park environment,
which is used to highlight the potential benefits to visitors and to park operators that
can be provided user-modeling and personalization technologies. This section is used
to introduce two themes of research which the authors are interested in – namely the
development of recommender systems for the theme park environment, and the
development of novel forms of ride that are capable of responding to those that ride
them. The section outlines a set of research challenges related to the themes of user-
modeling and personalization. It then provides an overview of research which the
authors have conducted in this space.
Following on from this section, this paper presents two analyses of a novel corpus
of data which was collected in the theme park, through a study involving 56
participants who took part in a single ride. This data contains a detailed profile of
these participants, which include assessments against two standard psychometric
personality tests – the Big Five and the Sensation Seeking Scale, which are introduced
later in this paper. It also includes a series of physiological measurements which were
captured through wearable computing technologies. Analysis presented in this paper
is then used to highlight the predictive power of psychometric profiles for experience
on the ride, suggesting the inclusion of psychometric measures in a profile of theme
park visitors which could be used by a recommender system. It is also used to
demonstrate the efficacy of using physiological data to measure experience on a ride,
suggesting the use of physiological measurements to personalize ride experiences.
Finally, after having presented these analyses, the paper concludes by discussing
further work required to make the personalization of theme park experiences a reality.
It also considers the broader contributions to knowledge that can be made through
research in the theme park, therefore emphasizing its wider applicability.
2 The theme park environment
Theme parks are a popular form of entertainment around the world, and their design
differs substantially. To provide a solid grounding for the remainder of this paper, this
section now provides a case-study of a particular theme park with which the authors
have interacted. Details presented in this case-study have been drawn from interviews
with park management and other staff. Having presented this case-study, we then
highlight the potential interest of the theme park environment to researchers interested
in user-modeling and personalization, by setting two research challenges. The
remainder of this paper is then structured around these research challenges.
2.1 An overview of Alton Towers
Alton Towers [13] is a theme park in the UK. It attracts more than 2 million
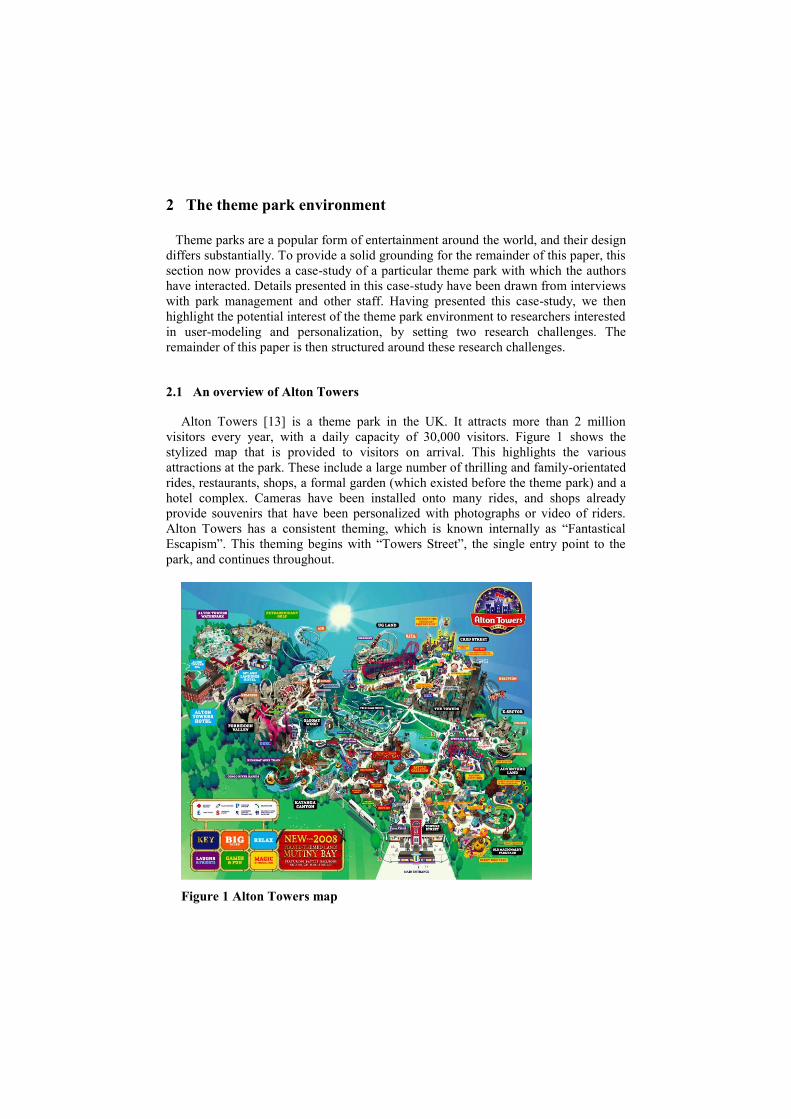
visitors every year, with a daily capacity of 30,000 visitors. Figure 1 shows the
stylized map that is provided to visitors on arrival. This highlights the various
attractions at the park. These include a large number of thrilling and family-orientated
rides, restaurants, shops, a formal garden (which existed before the theme park) and a
hotel complex. Cameras have been installed onto many rides, and shops already
provide souvenirs that have been personalized with photographs or video of riders.
Alton Towers has a consistent theming, which is known internally as ―Fantastical
Escapism‖. This theming begins with ―Towers Street‖, the single entry point to the
park, and continues throughout.
Figure 1 Alton Towers map
The rides at Alton Towers are the big draw for most visitors, and because of their
limited capacity, queues can be large (sometimes longer than an hour for new rides).
To reduce queuing, the most popular rides are distributed around the furthest edge of
the park, so that crowds have spread out by the time they get there. There are also
boards illustrating queuing times for these rides, which are updated manually once an
hour. Staff at the park believe that many visitors walk move in an anti-clockwise
direction around the park, causing queuing problems at particular locations. Queuing
is also worse at peak times, or at particularly new rides.
Additionally, for many visitors, their interaction with a particular park visit begins
on-line – through a ticket purchasing system that offers discounts in comparison to the
gate price. Visitors can also purchase extra tickets that allow them to jump to the front
of queues all day (most expensive option) or on individual rides (cheapest option).
On-line information provided by Alton Towers allows visitors to plan their day, and
additional information can be found on a variety of fan-sites (for example, [14]).
Alton Towers also maintains a presence on Facebook and Twitter.
2.2 Challenges for user-modeling and personalization in the theme park
Having provided a short case-study of a particular theme-park, we now outline two
research challenges which involve user-modeling and personalization. Section 3 of
this paper then presents initial studies that provide knowledge in relation to these.
Challenge one: The theme park recommendation system.
A day at a theme-park can be an expensive investment for a family, potentially
involving travel costs, park entry fees, food and accommodation. Once at the park,
there is an enormous selection of entertainment on offer. However, given the time
taken to traverse the park, and given the possibility of large queues that has been
outlined above, there is a significant potential for a frustrating experience. This
suggests the challenge of creating an information system that assists visitors, and
which recommends a personalized experience. Such a system might embed aspects of
collaborative recommendation [15]. It might also interface with future park systems
that monitored visitor movements, with on-line systems for booking tickets, or with
information collected during previous visits.
Challenge 2: Personalized experiences on rides
Many of the rides at Alton Towers are thrilling, but each provides essentially the
same experience to all visitors. However, developments in ride technology provide
the potential for personalized ride experiences - for example, some rides now embed
CAVE-like motion-platform and projection technologies [16], whilst others provide
for individual actuation of seat movements [17]. In addition, technologies such as
RFID that allow for the identification of visitors are already in operation at Alton
Towers, for the purposes of identifying video sequences that feature particular riders,
which are then used to produce souvenirs. This suggests the challenge of developing
rides that can be personalized to individual riders, or to groups of riders. Such rides
may draw on information collected by on-line systems, or during previous visits.
3 Results of studies constructed around these challenges
Having motivated two research challenges relating to the theme park, we now present
two analyses which contribute knowledge in relation to these. Both draw on data
collected during a single study by the authors in the theme park, which involved 56
participants. During this study, each had one ride on Oblivion, a major attraction at
Alton Towers. Before this ride, a personal profile was collected for each rider, and
during the ride, wearable equipment was used to record aspects of their physiological
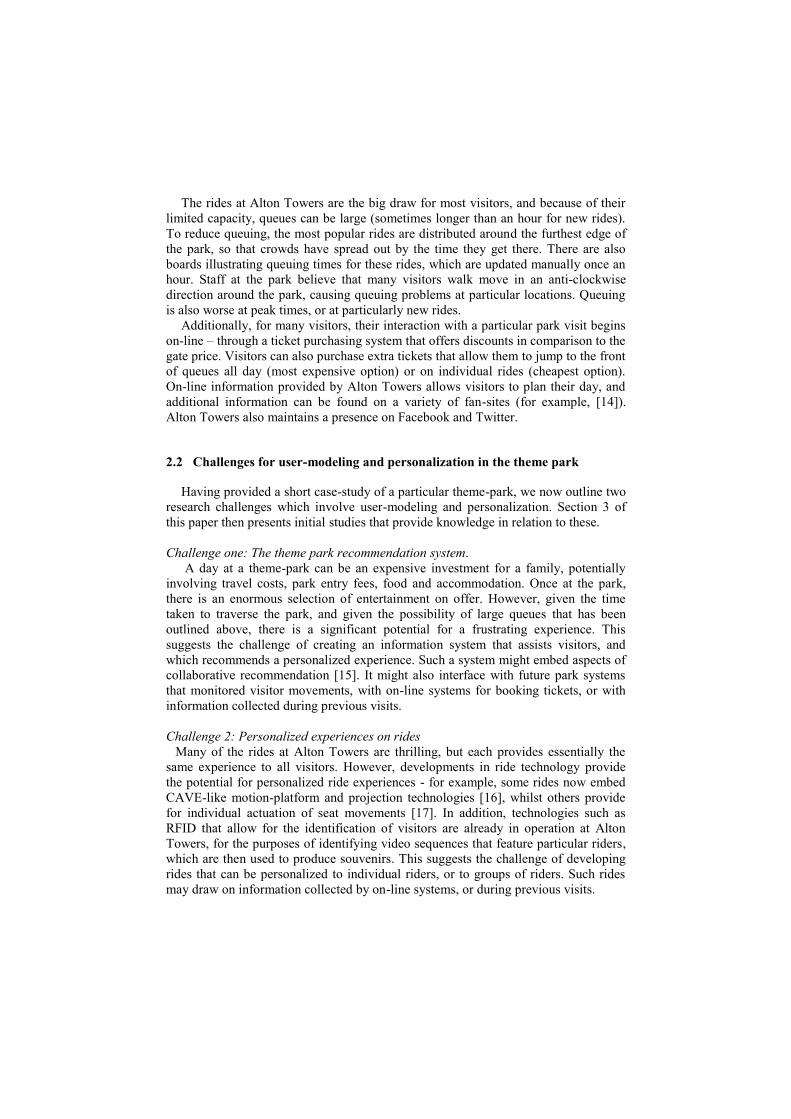
response. Oblivion is constructed around a vertical drop into a tunnel, and a
photograph of this drop is shown in figure 2. This figure also shows an abstract map
of the ride, which has been labeled with 10 key points. Immediately after the ride,
participants used paper forms to provide a numerical assessment of their emotional
state at each of these points against the circumplex model [18], which is defined by
two dimensions, arousal and valence. This model is commonly used in research
requiring the quantification of emotion, and seems particularly relevant to intense
experiences such as theme park rides. In the context of this study, arousal was defined
on a scale of 0 to 10 as being how much the rider felt ―alert, with your body pumped
up and buzzing, ready for action‖, whilst valence was defined on a scale of -5 to +5 as
being how much the rider felt ―positive or good‖ or ―negative or bad‖. Data collected
against this model has been used in both analyses presented below.
Figure 2 Beginning of vertical drop (left) and map of ride (right):
1: Loading bay 2-3: Lift hill 4-5: Drop 6-7: Tunnel 8: Curves 9-10: End of ride
3.1 Analysis one: relationships between personal profiles and ride experience
A key component of a system constructed in response to challenge one (the theme
park recommendation system) could be a module that uses a profile of a user to
recommend a series of rides that they will enjoy, and which assimilates geographic
information about the layout of rides and the size of queues. For users who have
visited parks before, such a profile may draw on records of previous visits. However,
an alternative approach is required for first-time visitors. For this group, we have been
investigating the efficacy of including demographic and psychometric personality
data in a visitor profile. Whilst the use of demographics in profiling is well-accepted,
the use of personality data in personal profiles for recommender systems is a current
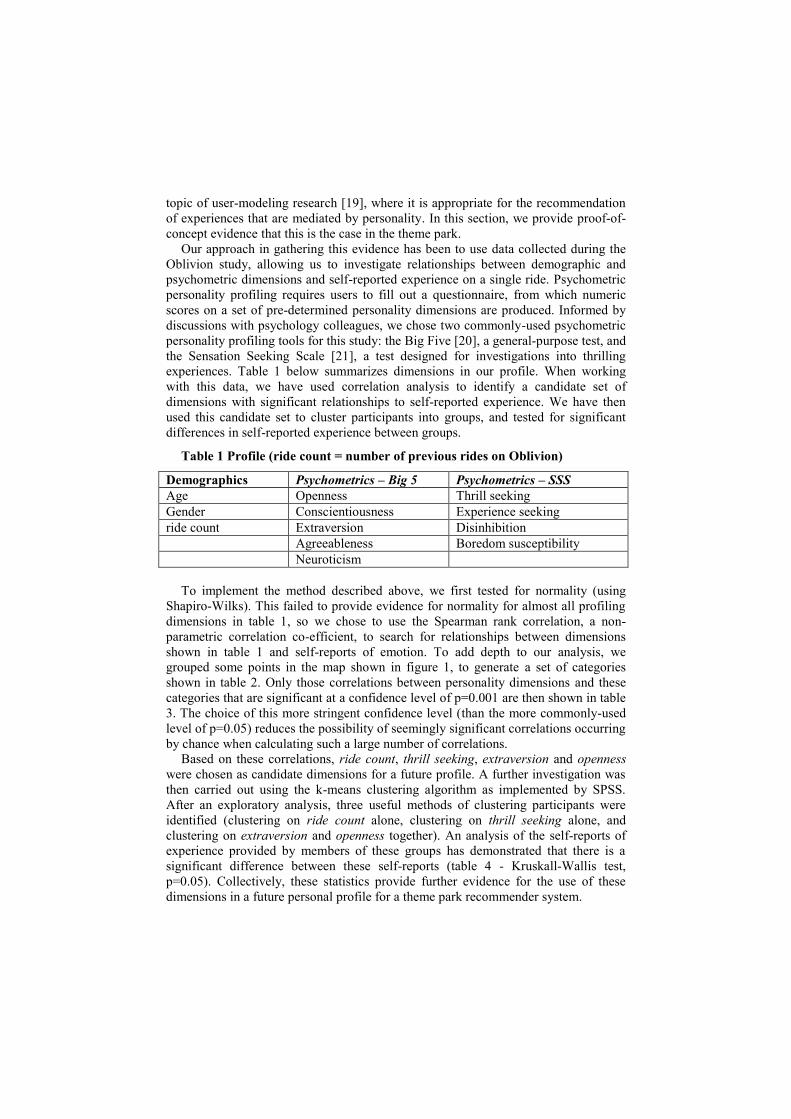
topic of user-modeling research [19], where it is appropriate for the recommendation
of experiences that are mediated by personality. In this section, we provide proof-of-
concept evidence that this is the case in the theme park.
Our approach in gathering this evidence has been to use data collected during the
Oblivion study, allowing us to investigate relationships between demographic and
psychometric dimensions and self-reported experience on a single ride. Psychometric
personality profiling requires users to fill out a questionnaire, from which numeric
scores on a set of pre-determined personality dimensions are produced. Informed by
discussions with psychology colleagues, we chose two commonly-used psychometric
personality profiling tools for this study: the Big Five [20], a general-purpose test, and
the Sensation Seeking Scale [21], a test designed for investigations into thrilling
experiences. Table 1 below summarizes dimensions in our profile. When working
with this data, we have used correlation analysis to identify a candidate set of
dimensions with significant relationships to self-reported experience. We have then
used this candidate set to cluster participants into groups, and tested for significant
differences in self-reported experience between groups.
Table 1 Profile (ride count = number of previous rides on Oblivion)
Demographics Psychometrics – Big 5 Psychometrics – SSS
Age Openness Thrill seeking
Gender Conscientiousness Experience seeking
ride count Extraversion Disinhibition
Agreeableness Boredom susceptibility
Neuroticism
To implement the method described above, we first tested for normality (using
Shapiro-Wilks). This failed to provide evidence for normality for almost all profiling
dimensions in table 1, so we chose to use the Spearman rank correlation, a non-
parametric correlation co-efficient, to search for relationships between dimensions
shown in table 1 and self-reports of emotion. To add depth to our analysis, we
grouped some points in the map shown in figure 1, to generate a set of categories
shown in table 2. Only those correlations between personality dimensions and these
categories that are significant at a confidence level of p=0.001 are then shown in table
3. The choice of this more stringent confidence level (than the more commonly-used
level of p=0.05) reduces the possibility of seemingly significant correlations occurring
by chance when calculating such a large number of correlations.
Based on these correlations, ride count, thrill seeking, extraversion and openness
were chosen as candidate dimensions for a future profile. A further investigation was
then carried out using the k-means clustering algorithm as implemented by SPSS.
After an exploratory analysis, three useful methods of clustering participants were
identified (clustering on ride count alone, clustering on thrill seeking alone, and
clustering on extraversion and openness together). An analysis of the self-reports of
experience provided by members of these groups has demonstrated that there is a
significant difference between these self-reports (table 4 - Kruskall-Wallis test,
p=0.05). Collectively, these statistics provide further evidence for the use of these
dimensions in a future personal profile for a theme park recommender system.
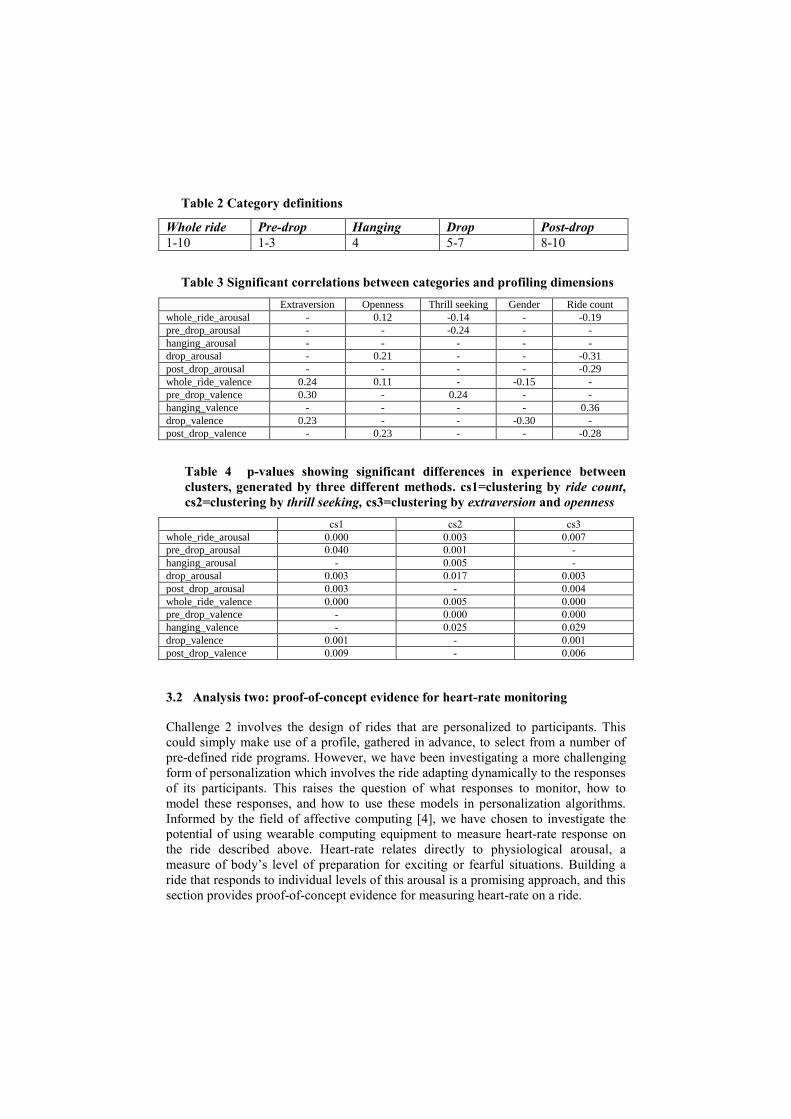
Table 2 Category definitions
Whole ride Pre-drop Hanging Drop Post-drop
1-10 1-3 4 5-7 8-10
Table 3 Significant correlations between categories and profiling dimensions
Extraversion Openness Thrill seeking Gender Ride count
whole_ride_arousal - 0.12 -0.14 - -0.19
pre_drop_arousal - - -0.24 - -
hanging_arousal - - - - -
drop_arousal - 0.21 - - -0.31
post_drop_arousal - - - - -0.29
whole_ride_valence 0.24 0.11 - -0.15 -
pre_drop_valence 0.30 - 0.24 - -
hanging_valence - - - - 0.36
drop_valence 0.23 - - -0.30 -
post_drop_valence - 0.23 - - -0.28
Table 4 p-values showing significant differences in experience between
clusters, generated by three different methods. cs1=clustering by ride count,
cs2=clustering by thrill seeking, cs3=clustering by extraversion and openness
cs1 cs2 cs3
whole_ride_arousal 0.000 0.003 0.007
pre_drop_arousal 0.040 0.001 -
hanging_arousal - 0.005 -
drop_arousal 0.003 0.017 0.003
post_drop_arousal 0.003 - 0.004
whole_ride_valence 0.000 0.005 0.000
pre_drop_valence - 0.000 0.000
hanging_valence - 0.025 0.029
drop_valence 0.001 - 0.001
post_drop_valence 0.009 - 0.006
3.2 Analysis two: proof-of-concept evidence for heart-rate monitoring
Challenge 2 involves the design of rides that are personalized to participants. This
could simply make use of a profile, gathered in advance, to select from a number of
pre-defined ride programs. However, we have been investigating a more challenging
form of personalization which involves the ride adapting dynamically to the responses
of its participants. This raises the question of what responses to monitor, how to
model these responses, and how to use these models in personalization algorithms.
Informed by the field of affective computing [4], we have chosen to investigate the
potential of using wearable computing equipment to measure heart-rate response on
the ride described above. Heart-rate relates directly to physiological arousal, a
measure of body’s level of preparation for exciting or fearful situations. Building a
ride that responds to individual levels of this arousal is a promising approach, and this
section provides proof-of-concept evidence for measuring heart-rate on a ride.

Given our choice of heart-rate, the collection of proof-of-concept evidence for its
use in a dynamically-adaptive ride involves a number of questions. Question 1: does
the ride actually affect heart-rate sufficiently for it to be a usable measure in this
context? Question 2: is there sufficient variability between riders for this measure to
be useful in personalization of experience? Question 3: are there any relationships
between heart-rate and emotional experience? In the remainder of this section, we
present evidence in relation to all three of these questions.
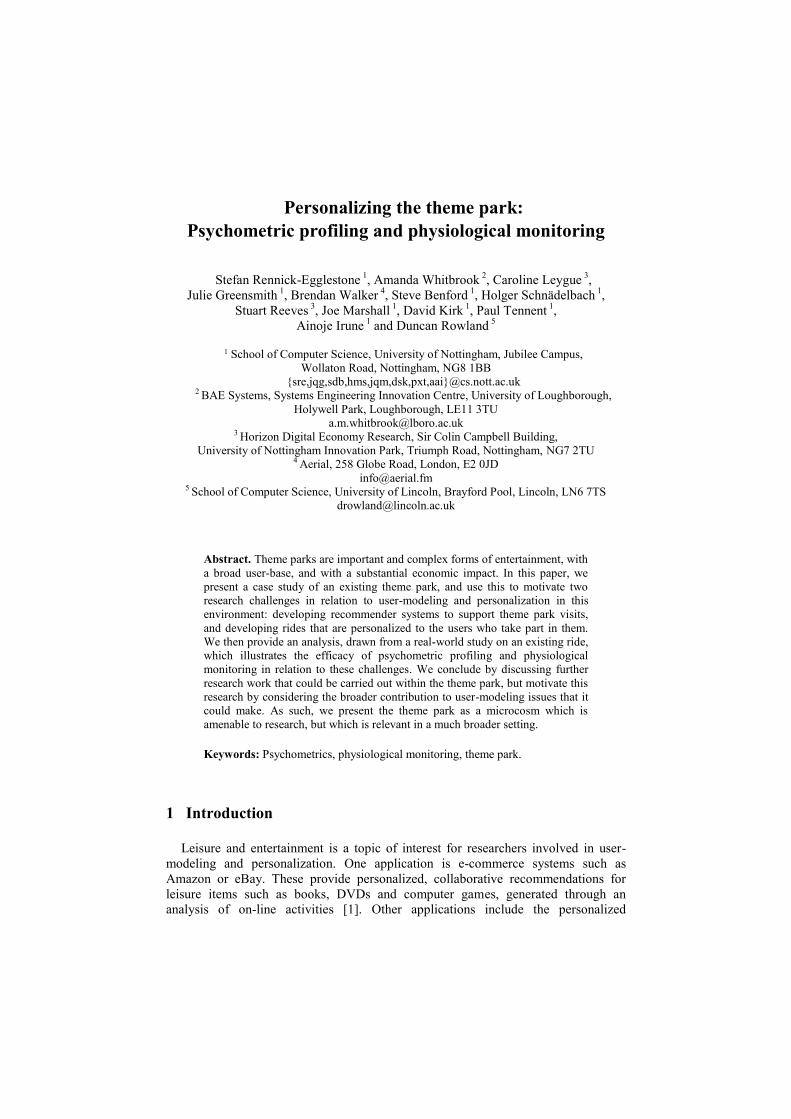
Figure 3 begins to address the first two, through a plot that shows the distribution
of all the individual heart-rates values that were recorded from participants, during six
phases of the experience of taking part in the ride. This plot shows an ascending
pattern for the sample median throughout most of this experience, with a local
maximum whilst waiting to board the ride. The Wilcoxan Rank Sum test was used (at
p=0.05) to compare the distribution of heart-rate between these boxes, and shows a
significant difference between all. In addition, the plot suggests a significant amount
of variation in heart-rate across the sample. Box 2, for example, contains some
outliers with heart-rates around 60 beats per minute (BPM), and some outliers with
heart-rates around 160 BPM, and also has a large inter-quartile range. A careful
analysis of heart-rate data traces has convinced us that these outliers represent true
heart-rates, rather than the results of equipment failures such as drop-outs.
Figure 3 Distribution of individual heart-rate values (BPM)
1: arrival at loading bay 2: waiting to board ride 3: waiting for ride to move
4: ascent of lift hill 5: progress around top 6: drop and remainder of ride
0 50 100 150 200
05
01
00
15
02
00
Median heart-rate during the lift-hill phase
Me
dia
n h
ea
rt-r
ate
du
rin
g th
e d
rop
an
d c
urv
es p
ha
se
0 50 100 150 200
05
01
00
15
02
00
Median heart-rate during the before phase
Me
dia
n h
ea
rt r
ate
du
rin
g th
e d
rop
an
d c
urv
es p
ha
se
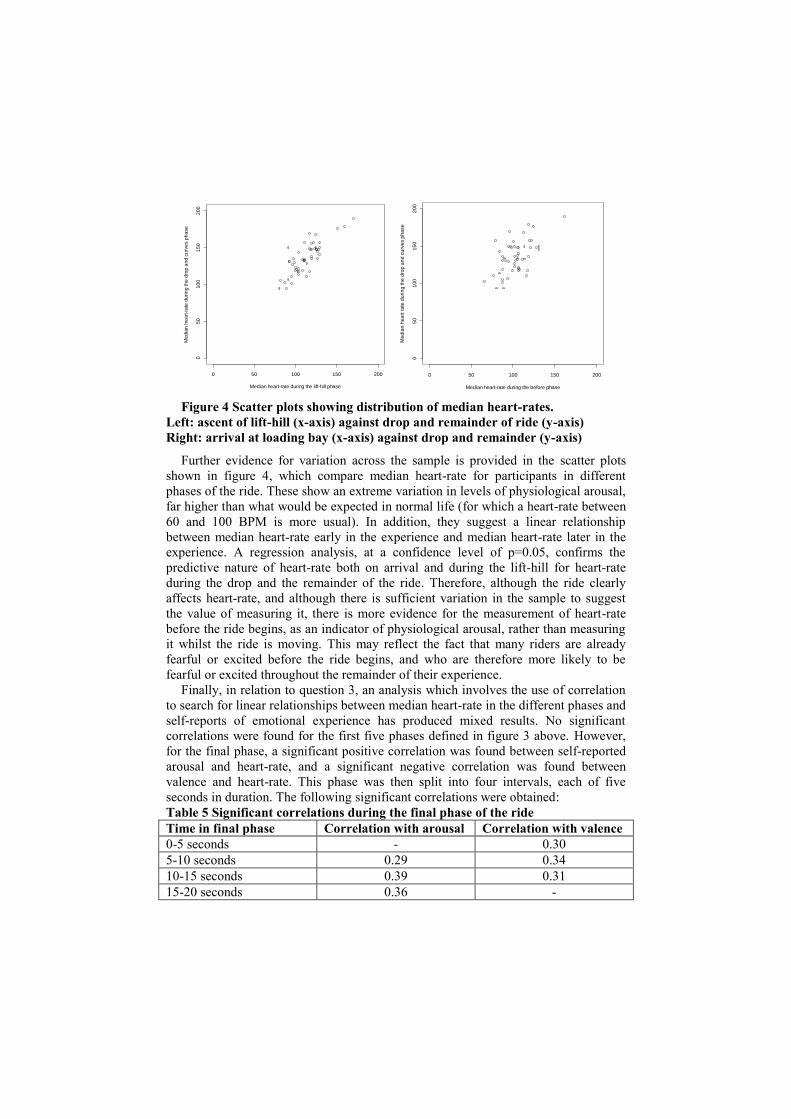
Figure 4 Scatter plots showing distribution of median heart-rates.
Left: ascent of lift-hill (x-axis) against drop and remainder of ride (y-axis)
Right: arrival at loading bay (x-axis) against drop and remainder (y-axis)
Further evidence for variation across the sample is provided in the scatter plots
shown in figure 4, which compare median heart-rate for participants in different
phases of the ride. These show an extreme variation in levels of physiological arousal,
far higher than what would be expected in normal life (for which a heart-rate between
60 and 100 BPM is more usual). In addition, they suggest a linear relationship
between median heart-rate early in the experience and median heart-rate later in the
experience. A regression analysis, at a confidence level of p=0.05, confirms the
predictive nature of heart-rate both on arrival and during the lift-hill for heart-rate
during the drop and the remainder of the ride. Therefore, although the ride clearly
affects heart-rate, and although there is sufficient variation in the sample to suggest
the value of measuring it, there is more evidence for the measurement of heart-rate
before the ride begins, as an indicator of physiological arousal, rather than measuring
it whilst the ride is moving. This may reflect the fact that many riders are already
fearful or excited before the ride begins, and who are therefore more likely to be
fearful or excited throughout the remainder of their experience.
Finally, in relation to question 3, an analysis which involves the use of correlation
to search for linear relationships between median heart-rate in the different phases and
self-reports of emotional experience has produced mixed results. No significant
correlations were found for the first five phases defined in figure 3 above. However,
for the final phase, a significant positive correlation was found between self-reported
arousal and heart-rate, and a significant negative correlation was found between
valence and heart-rate. This phase was then split into four intervals, each of five
seconds in duration. The following significant correlations were obtained:
Table 5 Significant correlations during the final phase of the ride
Time in final phase Correlation with arousal Correlation with valence
0-5 seconds - 0.30
5-10 seconds 0.29 0.34
10-15 seconds 0.39 0.31
15-20 seconds 0.36 -
4 Discussion
In this paper, we have presented analyses of data collected during a single study, and
related them to research challenges in the theme park environment. The first analysis
provides proof-of-concept evidence for the use of psychometric personality testing in
profiles designed for a theme park recommender system, based on its ability to predict
experience on a single ride. The second provides evidence for the use of heart-rate as
a profiling tool in the queue of a ride, with the potential to identify participants who
are relaxed or highly aroused. As an initial piece of research in this novel application
domain, these analyses have raised a significant number of research questions, whose
investigation could provide knowledge to support the implementation of real theme-
park systems in the future. In this final section, we present a selection of these
questions, and then conclude by discussing their relevance to user modeling research.
4.1 Extending the analysis to multiple rides
A limitation of the initial studies presented in this paper is that they only consider data
in relation to a single ride, and interesting research questions might be constructed
around their extension to multiple rides. For example, it would be interesting to know
whether particular dimensions in our chosen personality tests had particularly strong
relationships with experience on different rides, and whether there are other
personality tests that are useful in this context. Equally, it would be interesting to
know whether heart-rate in the queue is always a predictor for heart-rate later in other
rides, or whether variables such as fatigue are more important in some situations.
4.2 Considering groups in the design of future systems
Analyses presented in this paper have focused on treating participants individually.
However, it is clear from our interviews and observations that many people
experience theme park rides in groups (e.g. of family or friends). A recommender
system for a day at the park would need to consider the needs of a group rather than
just the needs of individuals that compose it; the design and evaluation of such a
system might contribute more generally to group-orientated recommender systems
research. Similarly, a system that personalizes a ride to its participants might need to
consider all the individuals in a particular carriage, rather than just being able to
consider participants on an individual basis. Future research might consider different
tactics for modeling groups, and selecting programs of operation for them.
4.3 Repeat visits
Analyses presented in this paper have considered a single ride on Oblivion. However,
interviews with park management suggest a high number of repeat visits, raising the
question of how to construct profiles that build over time, and which therefore
provide a stronger basis for recommendation or adaption. For example, a user-profile

might combine psychometric and demographic profiling with records of physiological
monitoring or self-report. Such a profile could use identification mechanisms such as
RFID, or even be integrated with on-line systems relating to ticket sales. These kinds
of profile are a current topic of research, especially given the ever-expanding digital
footprint that many people are generating. As such, research work in the theme park
might contribute more generally to research in this field, especially given the
significant number of visits to theme parks that are made by individuals.
4.4 Optimization of the use of psychometric personality profiling
Data in this paper relates to two specific personality tests: the Big Five and the
Sensation Seeking Scale. There are a number of interesting issues around the use of
these kinds of test that might be considered in future research. In particular, in
common with other personality tests, there are a number of different versions of the
Sensation Seeking Scale, each of which utilizes a different length questionnaire, and
each of which provides a different level of modeling of respondents’ personality.
There is clearly a trade-off here between the length of time taken to fill out a test and
the information that it provides, and such trade-offs may be interesting to investigate
in future research. An example of these trade-offs outside of the theme park is present
in a number of on-line dating services, such as Match Affinity [23]. Such sites often
use quite complex personality tests, and may therefore provide interesting research
data for the user-modeling community in relation to their success.
5 Conclusions
Most of this paper has focused on the theme park. Two research challenges have been
established, and a set of analyses, drawn from a single study, have presented initial
knowledge in relation to these. However, the theme park can be seen as a microcosm
in which research that is relevant to the wider world can be conducted, potentially
aided by theme park infrastructures that support visiting by guests, but which can also
provide data for research. Therefore, although research in the theme park is clearly
specialized, it has implications that can make a broader contribution, and it is
therefore a setting which should be of interest to other researchers.
6 Acknowledgments
This work was supported by the Horizon Digital Economy Hub (EP/G065802/1) and
by an EPSRC platform award to the Mixed Reality Laboratory (EP/F03038X/1).
Reference
1. Schafer, J.B., Konstan, J. and Riedi, J.: Recommender systems in e-commerce. In: 1st ACM
conference on electronic commerce. ACM, New York (1999).
2. Duchenaut, N., Partridge, K., Huang, Q., Price, B., Roberts, M., Chi, E.H., Bellotti, V. and
Begole, B.: Collaborative filtering is not enough? Experiments with a mixed-model
recommender for leisure activities. In: 17th International conference on user-modelling,
adaptation and personalization (2009).
3. Hansen, D. and Golbeck, J.: Mixing it up: recommending collections of items. In: 27th annual
SIGCHI conference on human factors in computer systems (2009).
4. Picard, R.: Affective Computing. MIT Press, 1997.
5. Klein, J., Moon, Y. and Picard, R.W.: This computer responds to user frustration: Theory,
design, and results. Interacting with Computers. 14:2 (2002).
6. Emotiv Epoch interface device, http://www.emotiv.com/
7. Attraction attendance report published by the Theme Entertainment Association,
http://www.connectingindustry.com/downloads/pwteaerasupp.pdf
8. Pausch, R., Snoddy, J., Taylor, R., Watson, S. and Haseltine, E.: Disney’s Aladdin: first
steps towards storytelling virtual reality. In: 23rd international conference on computer
graphics and interaction techniques (1996).
9. Schnädelbach, H., Rennick Egglestone, S., Reeves, S., Benford, S. and Walker, B.:
Performing Thrill: Designing telemetry systems and spectator interfaces for amusement
rides. In: 26th annual SIGCHI conference on human factors in computer systems (2008).
10.Rennick Egglestone, S., Marshall, J., Walker, B., Rowland, D., Benford, S. and Rodden, T.:
The Bronco: A proof-of-concept adaptive fairground ride. In: Annual conference on
Advances in Computer Entertainment Technology (2009).
11. Marshall, J., Rowland, D., Rennick Egglestone, S., Benford, S., Walker, B. and McAuley,
D.: Breath control of amusement rides. In: 29th annual SIGCHI conference on human factors
in computer systems (2011).
12.Rennick Egglestone, S., Whitbrook, A., Greensmith, J., Walker, B., Benford, S., Marshall,
J., Kirk, D., Schnadelbach, H., Irune, A. and Rowland, D.: Psychometric profiling in the
theme park. In: Annual conference on Advances in Computer Entertainment Technology
(2010).
13. AltonTowers corporate website, http://www.altontowers.com/
14. Towers Almanac fan-site, http://www.towersalmanac.com/
15. Adomavicius, G. and Tuzhilin, A.: Towards the next generation of recommender systems: a
survey of the state-of-the-art and possible extensions. IEEE Transactions on Knowledge and
Data Engineering. 17:6 (2005).
16. Charlie and the Chocolate ride at Alton Towers contains a motion platform with projectors,
http://www.towersalmanac.com/areas/rides.php?id=85
17. RoboCoaster ride systems, http://www.robocoaster.com
18. Larsen, R.J., Diener, E.: Promises and Problems with the Circumplex Model of Emotion.
Review of Personality and Social Psychology, No. 13. (1992).
19. Hu, R. and Pu, P.: A study on user perception of personality-based recommender systems.
In: 18th International Conference on user-modelling and personalization (2010).
20. John, O. P., Donahue, E. M., & Kentle, R. L.: The Big Five Inventory—Versions 4a and 54.
Institute of Personality and Social Research, University of California, Berkeley (1991).
21. Zuckerman, M.: Behavioural Expressions and Biosocial Bases of Sensation Seeking.
Cambridge University Press (1994).
22. Carlson, N.R.: Physiology of behavior (8th edition). Pearson.
23. Match Affinity dating website
http://www.matchaffinity.com/