Embed Size (px)
Citation preview

Tectonophysics, 225 (1993) 255-269
Elsevier Science Publishers B.V., Amsterdam
255
Reconciling deep seismic refraction and reflection data from theGrenvillian - Appalachian boundary in western New England
Stephen Hughes a,*, J.B. Luetgert a and N.r. Christensen b
a us Geological Survey, MS 977, 345 Middlefield Road, Menlo Park, CA 94025, USAb Department of Earth and Atmospheric Sciences, Purdue University, West Lafayette, IN 47907, USA
(Received August 25, 1992; revised version accepted April 15, 1993)
ABSTRACT
The Grenvillian-Appalachian boundary is characterized by pervasive mylonitic deformation and retrograde alteration ofa suite of imbricated allochthonous and parautochthonous gneisses that were thrust upon the Grenvillian continental marginduring the lower Paleozoic. Seismic reflection profiling across this structural boundary zone reveals prominent dippingreflectors interpreted as overthrust basement slices (parautochthons) of the Green Mountain Anticlinorium. In contrast, aseismic refraction study of the Grenvillian-Appalachian boundary reveals a sub-horizontally layered seismic velocity modelthat is difficult to reconcile with the pronounced sub-vertical structures observed in the Green mountains. A suite of rocksamples was collected from the Green Mountain Anticlinorium and measured at high pressures in the laboratory todetermine the seismic properties of these allochthonous and parautochthonous gneisses. The laboratory-measured seismicvelocities agree favorably with the modelled velocity structure across the Grenvillian-Appalachian boundary suggesting thatthe rock samples are reliable indicators of the rock mass as whole. Samples of the parautochthonous Grenvillian basementexposed in the Green Mountains have lower velocities, by about 0.5 krn/s, than lithologically equivalent units exposed in theeastern Adirondack Highlands. Velocity reduction in the Green Mountain parautochthons can be accounted for byretrograde metamorphic alteration (hydration) of the paragneisses. Seismic anisotropies, ranging from 2 to 12%, in themylonitized Green Mountain paragneisses may also contribute to the observation of lower seismic velocities, where thedirection of ray propagation is normal to the foliation. The velocity properties of the Green Mountain paragneisses are thusinsufficiently different from the mantling Appalachian allochthons to permit their resolution by the Ontario-NewYork-New England seismic refraction profile.
Introduction
In western New England the Grenvillian-Ap-palachian boundary is characterized by pervasivemylonitic deformation and retrograde alterationof a suite of imbricated allochthonous and pa-rautochthonous gneisses that were thrust uponthe Grenvillian continental margin during thelower Paleozoic (Fig. 1). Seismic studies of theGrenvillian-Appalachian boundary zone havesought to determine the deep structural relation-ships within the juxtaposed litho-tectonic units ofthe western New England Appalachians, and
* Present address: Bullard Laboratories, Department of EarthScience, University of Cambridge, Madingly Road, Cam-bridge, CB3 OEZ, England.
hence to infer the mechanisms of crustal accre-tion during the Taconian (Devonian) and Aca-dian (Ordovician) orogenies. Structural interpre-tations of seismic reflection data, constrained bysurface geology, suggest that the Grenvillian-Ap-palachian boundary zone is characterized by ananastomosing system of folds and thrusts thatencompass slices of Grenvillian basement inter-posed within the Appalachian allochthons (Andoet ai., 1984). In contrast, seismic refraction datathat were acquired to investigate the structuralrelationships across the Grenvillian-Appalachianboundary zone are difficult to reconcile with thesecomplex imbricated basement structures (Hughesand Luetgert, 1991). Specifically, the derivedmodel of a planar eastward-dipping velocity inter-face separating the Grenville province from theallochthonous and parautochthonous Appalachi-
0040-1951/93/$06.00 @ 1993 - Elsevier Science Publishers B.V. All rights reserved
Author's Personal Copy

256
an units appears to be inconsistent with the expo-sure of parautochthonous slices of Grenvillianbasement to the east of the velocity interface inthe Green Mountain Anticlinorium. In this study,we seek to reconcile the discrepancy between thelithologic juxtapositions observed in the Grenvil-lian-Appalachian boundary zone and the planarvelocity structure inferred from seismic refractiondata. Of particular importance to this objectiveare the seismic properties of the parautochthon-ous gneisses of the Green Mountain Anticlino-rium.
The ability of seismic techniques to resolvecomplex structural and lithologic discontinuitiesin the crust is a function of many intertwinedparameters, most importantly amongst these are:(1) the physical properties (velocity and density)
S. HUGHES ET AL.
of the juxtaposed lithologies; (2) the principalstructural grain (strike and dip) relative to theseismic profile; and (3) the spatial sampling of theseismic wavefield. Rock samples were collectedfrom the western New England Appalachians andtheir physical properties were measured at pres-sures up to 1000 MPa in the laboratory. Thesemeasurements are used, together with lithologicand structural information, to examine the seis-mic properties of the allochthonous and par-autochthonous gneisses. In this manner, we seekto determine the ability of in situ seismic refrac-tion velocity measurements to resolve structuraland lithologic discontinuities in the crust. Webegin with a description of the geology of thewestern New England Appalachians and adjacentAdirondack Highlands. This geologic information
74° Northern New York State
Geologic Map of the Western New England Appalachians and the Adirondack Highlands
73° Vermont 72°44° 15'
Adirondack Highlands
I
F;"'l;md Thrust B,lt
I
'i:: Limestones
~ and Shales
U ~ Dunham.~ ~ Dolomite..D
fJ~o 00 0 CheshireU a a .
'"
0 0 0 Quartzited::
D a
u'0
~Q Charnockitic, Syenitic
"0Wand Grarutic Gneisses
~~ Marcy Anorthosite::§ L:ijj
\ Champlain Thrust(Logan's Line)
o Rock sample locaions
10Distance (km)
I20
44° 00'
Green Mountain
I.§ ~ti~~::;::ee.~ ~ Formation
~ roo<:1 Underhillo ~ Formation
~ ~ Pinnacle]
~ Formation
8 [ill]] Hazens NotchFormation
3°45'
Connecticut Valley Synclinorium
~,~, KnoxMountain@ 22 Pluton
J [J ~~~a~~v:r
c::n Northfield.~ L.:.J Formation,g Missisquoi(j)
Formation
u 'I/\MNIIINVVVV\'0,N
~,.,.
II:-g 8 '-;'-;". Mount Ho y
::'S-5 '-;'-;'-Complex
~
.§ ~~~~ Albee
.~ -::,-::, Formation
~ ~ Stoweo liiJ Formation
Fig. 1. Geologic map across the western New England Appalachians and the adjacent Adirondack Highlands. The Ontario-New
York-New England seismic refraction/wide-angle reflection profile is shown by the bold line and shotpoints are indicated alongthe profile. The locations of rock samples collected from the western New England Appalachians are indicated by the letters a-i.Inset map shows location of seismic reflection profiles obtained by COCORP. The map has been simplified after the Vermont
State geologic map compiled by Doll et al. (1961), and the New York State geologic map of Isachsen and Fisher (1970).
Author's Personal Copy

DEEP SEISMIC REFRACTION AND REFLECTION DATA FROM THE GRENVILLIAN-APPALACHIAN BOUNDARY 257
forms an important component in the interpreta-tion of the rock sample measurements presentedin the following sections.
Geological framework of the Grenvillian-Appa-lachian boundary
The resolution of the Grenvillian-Appalachi-an boundary in western New England by seismicrefraction and reflection techniques provides aparticularly exacting challenge due its the struc-tural complexity and narrowness (Fig. 1). Fromwest to east across the boundary zone the follow-ing litho-tectonic units are recognized:
(1) the mid-Proterozoic gneisses of the au-
tochthonous Grenvillian basement exposed in theAdirondack Highlands (northern New YorkState);
(2) a Precambrian rift-clastic sequence which
lies unconformably upon the Grenvillian base-ment in the Champlain Lowlands;
(3) allochthonous Lower Cambrian to Lower
Ordovician carbonates and clastics of the Fore-land Thrust Belt (western Vermont);
(4) imbricated and metamorphosed mid-
Ordovician flysch deposits interposed with pa-rautochthonous slices of Grenvillian basement ex-posed in the core of the Green Mountain Anticli-norium (central Vermont); and
(5) Silurian-Devonian forearc sediments and
volcanics of the Connecticut Valley Synclinorium(eastern Vermont).Tectonic syntheses of western New England arepresented by Rowley and Kidd (1980), Bradley(1983) and Stanley and Ratcliffe (1985). Herein,we concentrate on the structural framework ofthe Grenvillian basement exposed in the Adiron-dack Highlands and Green Mountain Anticlino-rium.
In the Adirondack Highlands, a suite of mid-Proterozoic anorthosites, metagabbros, charnock-ites and syenites are exposed which typically at-tain hornblende-granulite facies metamorphism(Wiener et aI., 1984; McLelland and Isachsen,1986). Mantling these meta-igneous rocks to thesouth and east of the Adirondack Highlands, aseries of paragneisses and syn-tectonic granitoidsform an apron around the extremity of the
Adirondack massif (Fig. 1). Typically these parag-neisses are composed of hornblende-biotite-plagioclase-quartz assemblages (Chiarenzelli andMcLelland, 1990). Structural fabrics within thesemantling paragneisses are dominated by sub-horizontal layering related to large-scale recum-bent (sub-horizontal) nappe structures (Wiener etaI., 1984; McLelland and Isachsen, 1986).
The Green Mountain Anticlinorium forms anorth-south structural high which lies adjacent tothe eastern Adirondack Highlands (Fig. 1). In thecore of the Green Mountain Anticlinorium, slicesof mid-Proterozoic crystalline basement are thrustbetween allochthonous shelf-rise sediments (Fig.2). These parautochthonous Grenvillian base-ment slices are composed of well layered, gar-net -rich, biotite-plagioclase-quartz gneisses, horn-blende-biotite granitic gneisses and massivequartzites of the Mount Holly Complex (Doll etaI., 1961; Stanley and Ratcliffe, 1985). Field rela-tionships, isotopic age-dating and chemical analy-sis indicate that the Mount Holly Complex parag-neisses are one-to-one correlatives with theparagneisses and syn-tectonic granitoids exposedin the eastern Adirondack Highlands (Ratcliffe etaI., 1991). Palinspastic reconstructions suggestthat the Mount Holly complex was thrust east-wards from the edge of the Grenvillian continen-tal margin during the Taconic orogeny (Stanleyand Ratcliffe, 1985).
In central Vermont the core of the GreenMountain Anticlinorium is composed of two ar-cuate limbs which form the Lincoln massif (Fig.1). Prominent mylonitic shear surfaces dip steeplyeastward from 70° through to sub-vertical (Fig. 2).The western limb of the Lincoln massif is com-paratively massive and competent, with only mi-nor high-angle offset faulting of the recumbentanticlinal structure (DelIo Russo and Stanley,1986). The eastern limb of the Lincoln massif ischaracterized by pervasive mylonitic schistosityresulting from extensive imbrication along a se-ries of anastomosing thrust surfaces within aneast-west-stacked duplex structure (Fig. 2-de-tail). Relic Grenvillian metamorphic fabrics sug-gest epidote-amphibolite/garnet zone metamor-phic conditions, locally attaining granulite faciesconditions in the paragneisses which core the
Author's Personal Copy

258
Green Mountain Anticlinorium (DelIo Russo andStanley, 1986; Stanley, 1989).
Flanking the Green Mountains to .the east, aseries of distal flysch deposits are exposed thatare characterized by amphibolite grade (garnetzone) metamorphism, pervasive mylonitic imbri-cated fabrics and retrograde alteration assem-blages (Stanley and Ratcliffe, 1985; DelloRussoand Stanley, 1986).
Geophysical constraints on deep crustal structure
The Ontario-New York-New England seismicrefraction/ wide-angle reflection profile traversesthe Adirondack massif and extends across thewestern New England Appalachians at an obliqueangle, almost perpendicular to the north-southtrend of the principal litho-tectonic units (Fig. 1).The distinct lithologic and structural characteris-tics of the Grenvillian and Appalachian provincesallow a seismic velocity discontinuity to be re-
S. HUGHES ET AL.
solved that separates the Grenvillian upper crustfrom that of the western New England Ap-palachians (Hughes and Luetgert, 1991). This ve-locity discontinuity forms a ramp-like structuredipping eastward beneath the western New Eng-land Appalachians (Grenvillian ramp on Fig. 3a).Interpretation of the Grenvillian ramp suggeststhat it is a zone of detachment which separatesthe autochthonous Grenvillian rocks and theirPrecambrian "cover" sequence from the al-lochthonous Appalachian terranes (Hughes andLuetgert, 1991). However, surface geologic obser-vations of pronounced dipping structures in theGreen Mountain Anticlinorium are difficult toreconcile with the modeled sub-horizontal veloc-ity interfaces in that region (Fig. 3a).
Seismic velocity measurements of the Grenvil-lian basement are remarkable consistent despiteconsiderable compositional variability within themeta-igneous lithologies of the Adirondack High-lands (Hughes and Luetgert, 1992). In the eastern
WestGeologic Cross Section along Latitude 44°00' East
Foreland Thrust Belt Green Mountain Anticlinorium Connecticut Valley SynclinoriumChamplain Middlebury Lincoln Underhill Knox MountainLowlands Syncline Massif Slice Anticlinorium
CD hg f0,:..\.\~0~0
/~::'~~,P , ~:':"~~\,~~<::' \,\ SP8
Adirondack HighlandsMarcy
Anorthosite
SP12
1____-o 10
Distance (km)
Vertical exaggeration 2:1
20
"~'-"......
Fig. 2. Geologic cross section along the Ontario-New York-New England seismic refraction/wide-angle reflection profile where it
traverses the western New England Appalachians and the adjacent Adirondack Highlands. The seismic expression of the steeplydipping imbricated structures at the edge of the Grenvillian crust is examined by means of seismic refraction velocities (shotpoints
indicated) and rock sample velocities (a-i). For key to lithologies see Fig. 1. The cross section is simplified after Doll et al. (1961)and Stanley (1989).
Author's Personal Copy

Adirondack Taconic Green Mountain Connecticut Valley
@ Highlands Allochthon An ticlinori urn SynclinoriumChamplain
Thrust 00"S \, \'\C 2 ,
:-:\@- /-, '~ \ 1 u£i \ I ,\ ~\ \-.\. -/:-:.,' ~\':. ~\\\ \I Cl.I
P-. 4) -3<l> ,1 --," \ , : I ~-Q \ , ,
'( \, \ \,@ 2~x6 ," \, ":,\ ' I, , , , \\'", -0 I \
" 'is.1'" '- \ I I '\, '. '\
\~~II
E-<P-.'"
0) 3<C .' '\ \ ,\ ~/
'. \. ,\\. \. -
10 Vermont Line3 New Hampshire Line 6New York Line 7 New York Line 1
DEEP SEISMIC REFRACTION AND REFLECTION DATA FROM THE GRENVILLIAN-APPALACHIAN BOUNDARY 259
Adirondack Highlands, where anorthosites, meta-gabbros and granitic gneisses are exposed, seis-mic velocities lie in the range 6.4-6.6 kmjs andare nowhere as low as 6.0 kmjs (Fig. 3a). Lateralvelocity variations in the Grenvillian basement donot appear to be significant given the 25-35 kmshotpoint spacing and 800 m receiver spacing ofthe seismic refraction data (Hughes and Luetgert,1992). Correlation of the Grenvillian basementgneisses with those exposed in the core of theGreen Mountain Anticlinorium (see previous sec-tion) suggests that high velocities (6.5-6.6 kmjs)would be expected in the region of the GreenMountain parautochthons. The seismic velocitiesof 5.95-6.05 kmjs modeled beneath the GreenMountain Anticlinorium (Hughes and Luetgert,1991) are inconsistent with the characterizationof Grenvillian basement with seismic velocities of6.5-6.6 kmjs.
WestAdirondackHighlands
The thickness of the Grenvillian basementslices at depth beneath the Green Mountain An-ticlinorium is an important factor in contributingto the resolution of the velocity structure of theGrenvillian - Appalachian boundary zone. Esti-mates of the deep geometry of the Green Moun-tain Anticlinorium are most readily obtained fromstructural cross sections constrained by surfacegeology (Stanley and Ratcliffe, 1985; Stanley,1989). The Grenvillian basement extends at shal-low depth beneath the Foreland Thrust Belt andcrops out in a broad antiformal structure in theLincoln massif (Fig. 2). Extrapolations of the sur-face geology indicate that the Green Mountainparautochthons extend, in the form of taperingbasement slices, to a depth of 5-6 km where theybecome contiguous with the eastward extensionof the Grenvillian basement beneath the westernNew England Appalachians (Fig. 2-inset). Note
Green MountainAnticlinorium
Connecticut ValleySynclinorium
East
SP7
Eastern mostGrenvillian Basement
Fig. 3. Comparison between a seismic refraction velocity model (a) and deep seismic reflection sections (b) acquired across the
Grenvillian-Appalachian boundary in western New England. The seismic velocity model shows a steeply dipping ramp structure(Grenvillian ramp) dividing the western New England Appalachians from the Adirondack Highlands (Hughes and Luetgert, 1991).
Note the absence of velocity features that might be correlated with the parautochthonous Grenvillian rocks of the GreenMountains. The seismic reflection profiles (b) acquired across the Green Mountains and the Taconic Allochthon in southernVermont (Brown et ai., 1983; Ando et ai., 1984) display prominent dipping reflections characteristic of mylonitized and imbricated
structures at the edge of the Grenvillian craton. The models are aligned with respect to the Champlain thrust (Logan's line).
Author's Personal Copy

260
that the Grenvillian par autochthons (Mount HollyComplex) form a 20-km-wide basement block thatshould be readily resolvable, given the high seis-mic velocities (6.5-6.6 kmjs) of the lithologicallyassociated units in the Adirondack Highlands.
A further discrepancy lies in the modeled loca-tion of the Grenvillian ramp structure betweenshotpoints 9 and 10 beneath the Foreland ThrustBelt (Hughes and Luetgert, 1991). The Grenvil-lian ramp structure delineates a seismic velocityboundary that is located 25 km west of the east-ernmost exposure of Grenvillian basement in theGreen Mountains (Fig. 3a). Thus, there is a 25-km-thick "wedge" of Grenvillian basement en-closed between the modelled Grenvillian rampstructure and the easternmost exposure of Gren-villian basement. The shotpoint spacing is 25-35km across the Grenvillian-Appalachian boundaryzone, so that the modelled location of theGrenvillian ramp is unlikely to result from a lackof lateral resolution in the seismic refraction data.Additionally, a series of high-apparent-velocityreflectors are observed on the seismic refractionrecord sections, suggesting that there is a dippingzone of intense deformation and mylonitizationbetween the Grenvillian ramp structure and theGreen Mountains (Hughes and Luetgert, 1991).The absence of resolvable travel-time featuresthat might be correlated with the Green Moun-tain Anticlinorium raises questions concerningthe seismic expression of the Grenvillian pa-rautochthonous gneisses (Mount Holly Complex)which core the Green mountains.
Deep seismic reflection profiles acquired a-cross the Adirondack Highlands and the westernNew England Appalachians, by COCORP, pro-vide information with which to compare the seis-mic velocity model (Fig. 3b). The seismic reflec-tion profiles traverse the Adirondack Highlands,northern New York State, and extend across theTaconic allochthon and the Green Mountain An-ticlinorium in southern Vermont (Fig. I-inset).The geology is remarkably similar along strike, sothat comparisons may be drawn between the re-fraction model and the seismic reflection section.However, it should be noted that the ForelandThrust Belt (Taconic allochthon) is significantlybroader in the vicinity of the reflection profile,
S. HUGHES ET AL.
than in the location of the refraction profile whereit is at its narrowest and structurally most com-plex (Fig. 1).
Interpretation of the seismic reflection profilessuggests that the Grenvillian basement extendseastwards beneath a planar decollement whichunderlies the Taconic allochthon (see 2 in Fig.3b). Beneath the Green Mountain Anticlinoriuma series of prominent sub-parallel dipping reflec-tors were imaged extending to approximately 5-6s beneath the Connecticut Valley Synclinorium(See 3 in Fig. 3b). These eastward-dipping reflec-tors splay out into a zone of anastomosing reflec-tions in the mid-lower crust (Brown et aI., 1983;Ando et aI., 1984). The dipping seismic reflectorsbeneath the Green Mountain Anticlinorium areinferred to be highly deformed thrust-imbricatedbasement slivers interposed with mylonitic shearzones (Ando et aI., 1984; Phinney and Roy-Chowdhury, 1989; Thigpen, 1989). These dippingreflectors are displaced eastwards from theGrenvillian-Appalachian boundary (ChamplainTrust) compared to their location observed be-neath the seismic refraction profile because ofalong strike variations in the development of theAppalachian deformation front (Fig. 3). Thus,geologic observations together with the seismicreflection profiling suggest that the Grenvillian-Appalachian boundary zone is characterized bycomplex compositional and structural interrela-tionships, in sharp contrast to the seismic velocitymodel.
Rock samples
A suite of rock samples were collected in anattempt to resolve the apparent inconsistency be-tween the geologic cross section and seismic re-flection images on the one hand, and the seismicvelocity model on the other. These samples werecollected from the western New England Ap-palachians in the vicinity of the Ontario-NewYork-New England seismic refraction profilewhere it traverses central Vermont (Fig. 1). Therock samples were carefully selected, in the field,to ensure that representative samples of the prin-cipal lithologies were obtained (Table 1). Threemutually perpendicular cores were cut from these
Author's Personal Copy

-B-Sample a200..
-+-Sample b
~Samplec
~Samplee
----&-Sample f
600.,-.-Sample g
---Sample h
-'-Sample i800"
---.-Slate
DEEP SEISMIC REFRACTION AND REFLECTION DATA FROM THE GRENVILLIAN-APPALACHIAN BOUNDARY 261
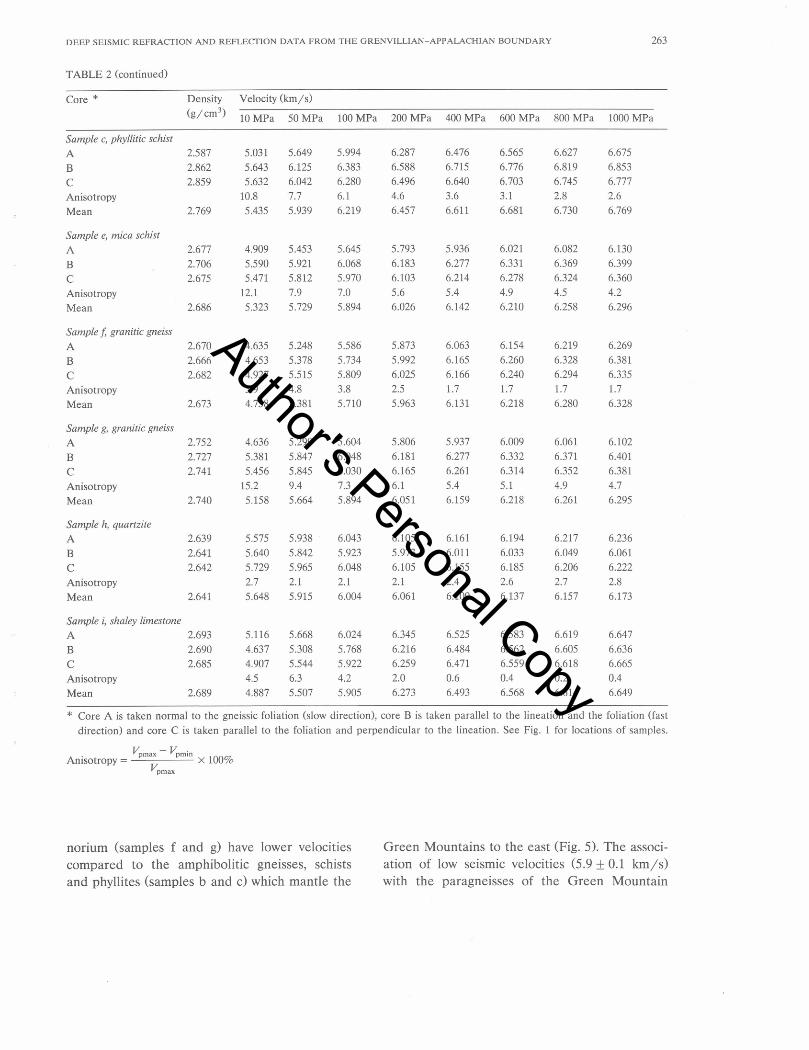
samples parallel and normal to the principal foli-ation (cleavage plane) and the structural lineationrespectively. Seismic velocities were measured oneach core at increasing pressures up to 1000 MPa(Table 2). The samples display a characteristicrapid velocity increase up to pressures of 200-300MPa associated with closing of microcracks andpore spaces. At pressures in excess of 200-300MPa the seismic velocity increases linearly withpressure with mean velocities in the range 6.0-6.5km/s (Fig. 4a). In contrast, rock samples col-lected from the Adirondack Highlands are char-acterized by mean velocities in the range 6.2-7.2km/s as shown by Figure 4b (Birch, 1960;Manghnani et aI., 1974; Christensen and Foun-tain, 1975). The seismic velocities of the Adiron-dack samples are approximately 0.5 km/s faster
o Western New England Appalachians
Velocity (km/ s)5.0 5.5 6.0 6.5 7.0 7.5
o -
--O-Sample 4
-&--Sample 5
Fig. 4. Comparison of mean laboratory velocity measurements for rock samples collected from the western New England
Appalachians (a) and from the Adirondack Highlands (b). Note that the Adirondack rock samples have an average compressional
wave velocity that is 0.5 km/s faster than that of samples collected from the western New England Appalachians. Appalachian rock
samples (a) were collected from localities shown in Fig. 1, and additional Appalachian rock samples are from Birch (1960).
Adirondack rock samples (b) denoted by samples #1-14 are from Manghnani et al. (1974) and samples 4, 5, 7 are from Christensen
and Fountain (1975). See Table 1 for location and composition of these rock samples. Laboratory data have been corrected for
temperature using a geotherm of 15°C/km (Blackwell, 1971) and an average thermal coefficient of 2.0 X 10⁻⁴ km/s °C-l
(Christensen, 1979; Kern and Richter, 1981).
-I
I200 .1....
II
~ 400I
....
6(1) I~ J~ 600 +..
II
800 .1...
II
1000 L
j....
lOI
"'/6II
i ...113
I.
120
III 26
".1
I: I
>:--~-_J 33
~Barre Granite
than those measured for samples collected fromthe western New England Appalachians.
Comparisons of the rock sample velocities withthe seismic refraction model shows a scatter aboutthe in situ velocity measurements, but in general,a broad agreement is attained between the twomeasurements (Fig. 5). The favorable correlationbetween the laboratory measurements and theseismic velocity model indicates that the rocksamples are likely to be reliable indicators of therock mass as a whole. This is because the seismicwavefield data effectively averages all the litho-logic variations observed along the seismic refrac-tion profile, thus non-representative sampleswould be easily identified by their mismatch withthe seismic velocity model. Noticeably, the parag-neisses which core the Green Mountain Anticli-
Adirondack Highlands---Sample #1
-B-Sample #2
-+-Sample #3
~Sample #4
~Sample #5
&-Sample #6
-'-Sample #7
""'---Sample #8
EC. -'-Sample #9
.. 13 o:S ---'-Sample #100...
a ~Sample #11
. ~ -Sample #12
E..20.x ~Sample #13o.0.. -EE--Sample #140...
. -< ~Sample #15
...26 -o-Sample #16
-o-Sample #17
-o-Sample 7
5.00..
Velocity (km/ s)
6.0 6.5 7.0 7.5,,0
5.5
..6
1000".. 33
Author's Personal Copy
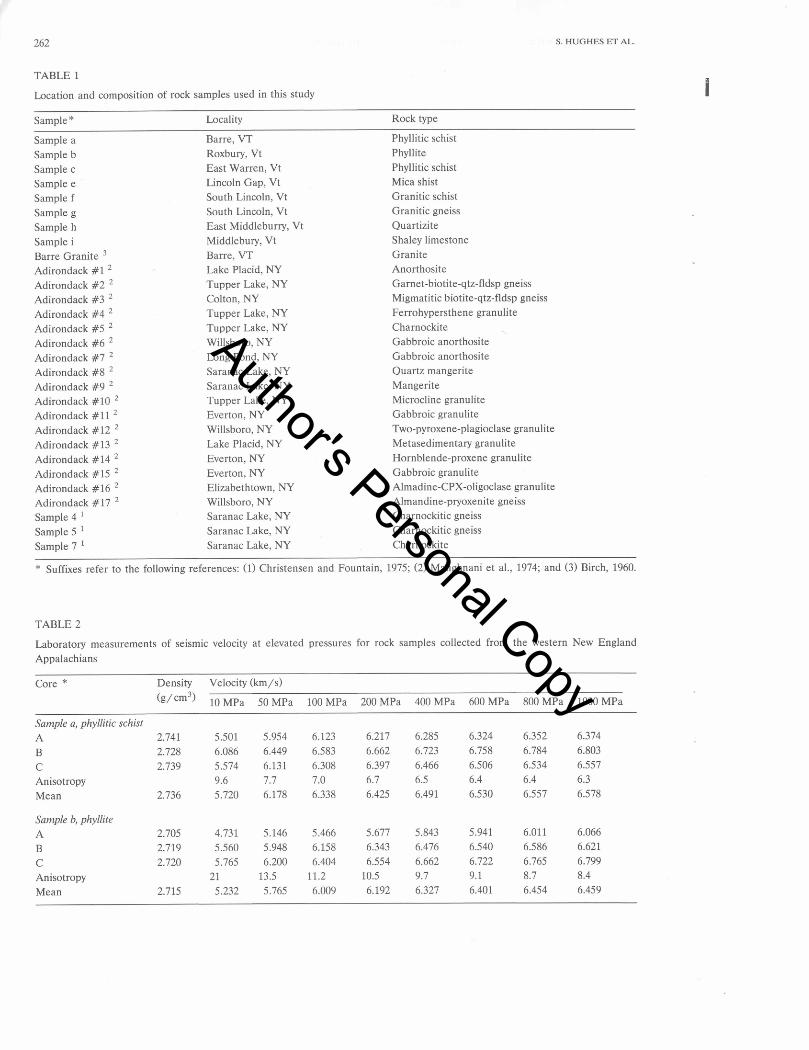
TABLE 2
Laboratory measurements of seismic velocity at elevated pressures for rock samples collected from the western New EnglandAppalachians
Core * Density Velocity (km/s)(g/ cm3)
10 MPa 50 MPa 100 MPa 200 MPa 400 MPa 600 MPa 800 MPa 1000 MPa
Sample a, phyllitic schist
A 2.741 5.501 5.954 6.123 6.217 6.285 6.324 6.352 6.374
B 2.728 6.086 6.449 6.583 6.662 6.723 6.758 6.784 6.803
C 2.739 5.574 6.131 6.308 6.397 6.466 6.506 6.534 6.557
Anisotropy 9.6 7.7 7.0 6.7 6.5 6.4 6.4 6.3
Mean 2.736 5.720 6.178 6.338 6.425 6.491 6.530 6.557 6.578
Sample b, phyllite
A 2.705 4.731 5.146 5.466 5.677 5.843 5.941 6.011 6.066
B 2.719 5.560 5.948 6.158 6.343 6.476 6.540 6.586 6.621
C 2.720 5.765 6.200 6.404 6.554 6.662 6.722 6.765 6.799
Anisotropy 21 13.5 11.2 10.5 9.7 9.1 8.7 8.4
Mean 2.715 5.232 5.765 6.009 6.192 6.327 6.401 6.454 6.459
262 S. HUGHES ET AL.
TABLE 1
Location and composition of rock samples used in this study
Sample*
Sample a
Sample b
Sample c
Sample e
Sample f
Sample g
Sample h
Sample i
Barre Granite 3
Adirondack #1 2
Adirondack #2 2
Adirondack #3 2
Adirondack #4 2
Adirondack #5 2
Adirondack #6 2
Adirondack #7 2
Adirondack #8 2
Adirondack #9 2
Adirondack #10 2
Adirondack #11 2
Adirondack #12 2
Adirondack #13 2
Adirondack #14 2
Adirondack #15 2
Adirondack #16 2
Adirondack # 17 2
Sample 4 1
Sample 5 1
Sample 7 1
Locality
Barre, VT
Roxbury, Vt
East Warren, Vt
Lincoln Gap, Vt
South Lincoln, Vt
South Lincoln, Vt
East Middleburry, Vt
Middlebury, Vt
Barre, VT
Lake Placid, NY
Tupper Lake, NY
Colton, NY
Tupper Lake, NY
Tupper Lake, NY
Willsboro, NY
Long Pond, NY
Saranac Lake, NY
Saranac Lake, NY
Tupper Lake, NY
Everton, NY
Willsboro, NY
Lake Placid, NY
Everton, NY
Everton, NY
Elizabethtown, NY
Willsboro, NY
Saranac Lake, NY
Saranac Lake, NY
Saranac Lake, NY
Rock type
Phyllitic schist
Phyllite
Phyllitic schist
Mica shist
Granitic schist
Granitic gneiss
Quartizite
Shaley limestone
Granite
Anorthosite
Garnet-biotite-qtz-fldsp gneiss
Migmatitic biotite-qtz-fldsp gneiss
Ferrohypersthene granulite
Charnockite
Gabbroic anorthosite
Gabbroic anorthosite
Quartz mangerite
Mangerite
Microcline granulite
Gabbroic granulite
Two-pyroxene-plagioclase granulite
Metasedimentary granulite
Hornblende-proxene granulite
Gabbroic granulite
Almadine-CPX -oligoclase granulite
Almandine-pryoxenite gneiss
Charnockitic gneiss
Charnockitic gneiss
Charnockite
* Suffixes refer to the following references: (1) Christensen and Fountain, 1975; (2) Manghnani et aI., 1974; and (3) Birch, 1960.
Author's Personal Copy
DEEP SEISMIC REFRACTION AND REFLECTION DATA FROM THE GRENVILLIAN-APPALACHIAN BOUNDARY 263
TABLE 2 (continued)
Core*
Density Velocity (km/s)(g/ cm3)
10 MPa 50 MPa 100 MPa 200 MPa 400 MPa 600 MPa 800 MPa 1000 MPa
Sample c, phyllitic schist
A 2.587 5.031 5.649 5.994 6.287 6.476 6.565 6.627 6.675
B 2.862 5.643 6.125 6.383 6.588 6.715 6.776 6.819 6.853
C 2.859 5.632 6.042 6.280 6.496 6.640 6.703 6.745 6.777
Anisotropy 10.8 7.7 6.1 4.6 3.6 3.1 2.8 2.6
Mean 2.769 5.435 5.939 6.219 6.457 6.611 6.681 6.730 6.769
Sample e, mica schist
A 2.677 4.909 5.453 5.645 5.793 5.936 6.021 6.082 6.130
B 2.706 5.590 5.921 6.068 6.183 6.277 6.331 6.369 6.399
C 2.675 5.471 5.812 5.970 6.103 6.214 6.278 6.324 6.360
Anisotropy 12.1 7.9 7.0 5.6 5.4 4.9 4.5 4.2
Mean 2.686 5.323 5.729 5.894 6.026 6.142 6.210 6.258 6.296
Sample f, granitic gneiss
A 2.670 4.635 5.248 5.586 5.873 6.063 6.154 6.219 6.269
B 2.666 4.653 5.378 5.734 5.992 6.165 6.260 6.328 6.381
C 2.682 4.927 5.515 5.809 6.025 6.166 6.240 6.294 6.335Anisotropy 5.9 4.8 3.8 2.5 1.7 1.7 1.7 1.7
Mean 2.673 4.738 5.381 5.710 5.963 6.131 6.218 6.280 6.328
Sample g, granitic gneiss
A 2.752 4.636 5.299 5.604 5.806 5.937 6.009 6.061 6.102
B 2.727 5.381 5.847 6.048 6.181 6.277 6.332 6.371 6.401
C 2.741 5.456 5.845 6.030 6.165 6.261 6.314 6.352 6.381Anisotropy 15.2 9.4 7.3 6.1 5.4 5.1 4.9 4.7
Mean 2.740 5.158 5.664 5.894 6.051 6.159 6.218 6.261 6.295
Sample h, quartzite
A 2.639 5.575 5.938 6.043 6.105 6.161 6.194 6.217 6.236
B 2.641 5.640 5.842 5.923 5.973 6.011 6.033 6.049 6.061
C 2.642 5.729 5.965 6.048 6.105 6.155 6.185 6.206 6.222Anisotropy 2.7 2.1 2.1 2.1 2.4 2.6 2.7 2.8
Mean 2.641 5.648 5.915 6.004 6.061 6.109 6.137 6.157 6.173
Sample i, shaley limestone
A 2.693 5.116 5.668 6.024 6.345 6.525 6.583 6.619 6.647
B 2.690 4.637 5.308 5.768 6.216 6.484 6.562 6.605 6.636
C 2.685 4.907 5.544 5.922 6.259 6.471 6.559 6.618 6.665Anisotropy 4.5 6.3 4.2 2.0 0.6 0.4 0.2 0.4
Mean 2.689 4.887 5.507 5.905 6.273 6.493 6.568 6.614 6.649
*Core A is taken normal to the gneissic foliation (slow direction), core B is taken parallel to the lineation and the foliation (fastdirection) and core C is taken parallel to the foliation and perpendicular to the lineation. See Fig. 1 for locations of samples.
. Vpmax- VpminAmsotropy = X 100%
Vpmax
norium (samples f and g) have lower velocitiescompared to the amphibolitic gneisses, schistsand phyllites (samples b and c) which mantle the
Green Mountains to the east (Fig. 5). The associ-ation of low seismic velocities (5.9:t 0.1 km/s)with the paragneisses of the Green Mountain
Author's Personal Copy

264 S. HUGHES ET AL.
Rock Sample Data at 100 MPa.- ...c:OJ:J
""'iJ) v.Q ca
iJ) iJ) iJ) iJ) iJ) iJ) iJ) iJ) iJ)
0. 0.0. 0.0. 0.0. 0. Q):;:
S S S S S E E S....::
~~ca ca ca ca ca ca ca ca (:00 EastWest(f) (f)(f) (f)(f) (f)(f) (f)
6.8
Velocity Model@
3 Km
6.4 Refraction,..-.,.
Velocity (:1:2%)r.tJ
S~Rock Samples @
100 MPa~6.0
u Vp (Fast)
o
Ivp (Mean)
Q)>
5.6
Vp (Slow)
5.2
-80 -60 -40 -20 a
Offset from SP? (Ian)
Fig. 5. Rock samples collected from the western New England Appalachians and measured for seismic velocity at 100 MPa in the
high-pressure laboratory. Sample velocities were measured parallel (slow direction) and normal (fast direction) to the principal
foliation to enable comparison with the seismic velocity model. The graph shows that the laboratory velocities agree favorably withthe seismic refraction velocities at 3 km ( ~ 100 MPa). Note that samples from the core of the Green Mountain Anticlinorium (f
and g) have a lower velocity than the mantling amphibolitic gneisses (b and c). Sample localities and shotpoints are shown inFig. 1.
Anticlinorium is in contrast to that observedwithin the Adirondack Highlands where velocitiesin excess of 6.5 kmjs predominate.
Discussion
Structurally complex regions, such as the GreenMountain Anticlinorium, are extremely difficultto image with regional seismic refraction tech-niques. Seismic velocities obtained from refrac-tion profiling are frequently attributed to an ag-gregate of the lithological and structural varia-tions along the seismic profile whose bulk proper-ties tend to increase with depth resulting in asub-horizontally stratified Earth model (Mooney,1989). On first inspection such an interpretationfor the velocity structure of the Green MountainAnticlinorium appears to be satisfactory in theabsence of resolvable seismic velocity evidencefor complex interlayered structural fabrics associ-
ated with the obducted allochthons and par-autochthons (Fig. 3a). However, both structuralgeology and seismic reflection profiling in theGreen Mountain Anticlinorium suggest that suchan interpretation is grossly simplistic and inap-propriate to these highly deformed paragneisses(Fig. 3b). Some additional factors must be affect-ing our ability to resolve the seismic velocityexpression of the Green Mountain Anticlinorium.
Composition
The Grenvillian basement lithologies exposedin the Green Mountain Anticlinorium are charac-terized by lower velocities than lithologically as-sociated units in the Adirondack Highlands. Lab-oratory-measured seismic velocities obtained froma range of samples collected across the GreenMountains and the Adirondacks show a markedvelocity contrast, with lower velocities in the Ap-
Author's Personal Copy

DEEP SEISMIC REFRACTION AND REFLECTION DATA FROM THE GRENVILLIAN-APPALACHIAN BOUNDARY 265
palachians than in the Adirondacks (Fig. 4). Afirst-order comparison is possible between Adi-rondack and Green Mountain basement sampleswhich have similar mineralogies. In these comple-mentary laboratory measurements, samples ob-tained from the Green Mountains have a seismicvelocity about 0.5 km/s lower than those mea-sured for samples from the Adirondack High-lands (Fig. 6). The Adirondack samples are com-posed of biotite-quartz-feldspar assemblages withminor garnet and pyroxene components (Mangh-nani et aI., 1974), and the Green Mountain sam-ples (Mount Holly complex) are composed ofgarnet -bioti te- plagioclase-quartz assemblages.
5.0 5.4
200
~400p..,
6Q)
!-<;:jrJJrJJQ)
d:: 600
800Hydration
1000
The Green Mountains suffered extensive ret-rograde metamorphism during the Taconian andAcadian orogenies. As a result, all lithologiesexposed in the Green Mountains are hydrated(1- 2% H20 is typical), pervasively refoliated, andcommonly display abundant chlorite-muscovite-epidote as retrograde minerals (DelloRusso andStanley, 1986). From this petrological analysis itis clear that the mineralogical composition of theGreen Mountain paragneisses has been substan-tially altered compared to their associated litho-logies in the Adirondacks, which remain rela-tively unscathed by lower Paleozoic re-metamor-phism. The retrograde mineralogies observed in
6.6
Green Mountain AdirondackAnticlinorium Highlands
Effect of Hydration on Lowering Seismic Velocity
Velocity (km/ s)5.8 6.2 7.0
o
Green Mountain Gneisses
6--Sample f
e-Sample g
~ Adirondack Gneisses
13o:S
~ i!-Sample #2Q
-<>-Sample #3
-o-Sample #4
O-Sample #5
Mar<;y Anorthosite
26-@- Sample #1
33
Fig. 6. Comparison of laboratory measurements of seismic velocity for samples of mid-Proterozoic gneisses from the Adirondack
Highlands (Manghnani et a!., 1974) and from the Green Mountain Anticlinorium (Mount Holly Complex-samples f and g). Thesamples have similar bulk compositions (garnet biotite-plagioclase-quartz gneisses), but seismic velocities are significantly lower in
the Green Mountains than in the Adirondack Highlands. We conclude that retrograde alteration (hydration) of the paragneissesfrom the Green Mountain Anticlinorium has an important effect in lowering the measured seismic velocities. One-dimensionalvelocity-depth functions for the Green Mountains (SP9) and the Adirondack Highlands (SP] 1) are shown. A sample of Marcy
Anorthosite is shown for reference.
Author's Personal Copy

266 S. HUGHES ET AL.
the Green Mountains result in a lowering of theseismic velocity of the Mount Holly Complex(Fig. 6). Thus, a primary reason for the absenceof a resolvable velocity anomaly associated withthe Green Mountain Anticlinorium is the re-metamorphism and hydration of the Grenvillianbasement parautochthons.
Structure and anisotropy
The structural relationships of the juxtaposedlitho-tectonic units in the Grenvillian-Appalachi-an boundary zone have an important affect uponthe determination of seismic velocity. The sam-ples collected from western New England are
4.5o
Velocity (km! s)
5.0 5.5 6.0 6.5o
200
'Slow'Direction
Sample g
~ Normal to Foliation.J::::
13"0..a Parallel to LineationQ) -0- and Foliation~
20.Sx Parallel to Foliation8 -[}-
and Normal to Foliation0..0..
<:t::26
'2
~400Q)
I-<
=rJ)
~ 600p..
800
1000 33
'Slow'Direction
"<''Fast'
Direction
Foreland Thrust Belt Green Mountain Anticlinorium
Westo
10100 .50
Mount HollyComplex
Fig. 7. The mylonitized gneisses of the Green Mountain Anticlinorium are characterized by 5% seismic anisotropy (a). Seismic
refraction ray paths propagate approximately normal to the steeply dipping gneissic foliation (b). Consequently, the "slow" velocity
of the Mount Holly Complex gneisses is measured by the seismic refraction profile. The bulk velocity of the Mount Holly Complex
is insufficiently different from the mantling amphibolitic gneisses of the Green Mountain Anticlinorium to permit resolution of the
imbricated basement structures by the seismic refraction profile. The observation of clear back-scattered energy (reflectedraypaths) is inhibited by the finely imbricated structures within the Green Mountain Anticlinorium.
Distance (km)
Author's Personal Copy

DEEP SEISMIC REFRACTION AND REFLECTION DATA FROM THE GRENVILLIAN-APPALACHIAN BOUNDARY 267
characterized by variable degrees of seismic ani-sotropy, from 2% in the massive granitic litho-logies to as much as 12% in the phyllites andschists (Table 2). Brocher and Christensen (1990)showed that seismic velocity measurements varyas a function of dip relative to the azimuth of theseismic profile. For velocity measurements nor-mal to the plane of the seismic profile, the maxi-mum velocity is attained when the transmittedseismic energy is parallel to the foliation and thevelocity decreases, as a sine of the dip angle, to aminimum when the foliation is normal to thetransmitted energy. This observation is related tothe preferential alignment of highly anisotropicminerals, such as micas and amphiboles in perva-sively foliated gneisses (Fountain and Chris-tensen, 1989; Brocher and Christensen, 1990).
From west to east across the Grenvillian-Ap-palachian boundary, the structural dip of the"Adirondack" gneisses increases from sub-hori-zontal in the recumbent nappes of the Adiron-dack Highlands to sub-vertical in the core of theGreen Mountain Anticlinorium (McLelland andIsachsen, 1986; Stanley, 1989). Both the seismicrefraction profile (Hughes and Luetgert, 1991)and the reflection profiles (Ando et aI., 1984)acquired across the Grenvillian-Appalachianboundary support the existence of steeply dippingfabrics (mylonitized paragneisses) beneath andalong the flanks of the Green Mountain Anticli-norium in southern Vermont (Fig. 3). Thus,transmitted seismic energy which traverses theGreen Mountain Anticlinorium propagatesthrough a series of sub-vertical lithologic unitswhich lie normal to the direction of propagation.Consequently, the minimum laboratory velocity(i.e., normal to the foliation) should be mostrepresentative of the in situ seismic velocity mea-sured along the Ontario-New York-New Eng-land seismic refraction profile (Fig. 7a). In thismanner, lower seismic velocities would be ex-pected across the Green Mountains than acrossthe Adirondack Highlands for lithologicallyequivalent basement units (Fig. 7b). Seismicanisotropy in the basement paragneisses beneaththe Green Mountains may playa contributingrole in lowering the velocities observed by theseismic refraction profile.
Spatial sampling
A variety of geometrical factors also contributeto the ability of regional seismic refraction/wide-angle reflection studies to resolve regions ofprominent structural fabric. Observation of theGreen Mountains with seismic refraction datawill be very difficult unless the bulk velocity ofthe paragneisses is quite different from the sur-rounding crust, or unless the geometry of theseismic reflectors is such as to provide clear backscattered reflected arrivals. In the Green Moun-tains the bulk velocity of the mylonitized parag-neisses is insufficiently different from themantling schists and phyllites to permit its delin-eation with seismic refraction measurements asshown by Figure 5.
The observation of steeply dipping seismic re-flectors with wide-angle seismic data necessitatesan optimum source-receiver configuration rela-tive to the lamination geometry. The relativelysparse shotpoint geometry of the Ontario-NewYork - New England seismic refraction profiledoes not permit back-scattered reflected energyto be readily observed from the sub-vertical im-bricated structures of the Green Mountains (Fig.7b). Although Hughes and Luetgert (1991) wereable to identify high-apparent-velocity reflectionsin the vicinity of the Grenvillian ramp, thesereflections were insufficiently continuous andpoorly separated in time from the first arrivals tofacilitate incorporation into 2-D ray trace model-ing. Vertical incidence seismic profiling acrossthe Green Mountains, have a much better chanceof observing reflections because reflected energypath lengths are shorter, other interfering arrivalsare fewer and the geometry is more favorable forobservation of back scattered energy.
Conclusions
The mid-Proterozoic parautochthonous rocksthat form the core of the Green Mountain Anti-clinorium were obducted from the edge of theGrenvillian continental shelf during the laterstages of the Taconian orogeny (Stanley and Rat-cliffe, 1985). Although comparable rock types(quartzites, felsic gneisses and garnet-rich, bi-
Author's Personal Copy
268
otite-plagioclase-quartz gneisses) are exposed inthe eastern Adirondack Highlands and the GreenMountain Anticlinorium their physical propertiesare sufficiently different to inhibit their correla-tion with seismic refraction measurements. Ret-rograde alteration (hydration) and pervasive my-lonitic deformation of the paragneisses that corethe Green Mountain Anticlinorium play an im-portant role in affecting the resolution of velocityanomalies associated with the Grenvillian pa-rautochthonous basement. Specifically, the veloc-ity properties of the Green Mountain parag-neisses renders them insufficiently different formthe mantling schists and phyllites to permit theimbricated Grenvillian basement structures to bedistinguished by seismic refraction techniquesalone. Seismic reflection studies on the otherhand permit the resolution of steeply dippingreflections beneath the Green Mountain Anticli-norium, but are unable to assign velocities andthus lithologic inferences are hindered.
The application of high-pressure laboratorymeasurements to the interpretation of regionalseismic refraction data suggests that cautionshould be exercised in assigning seismic velocitiesin regions of high structural dip where theanisotropic properties of the deformed and my-lonitized rocks are likely to be of paramountimportance (Fountain and Christensen, 1989;Brocher and Christensen, 1990). Inferences ofstructural relationships from seismic refractionstudies must be viewed with respect to the meta-morphic, structural and anisotropic properties ofthe lithologies traversed by the seismic profile.
Acknowledgments
The seismic data presented in this paper werecollected by the US Geological Survey in collabo-ration with the Geological Survey of Canada andthe US Air Force Geophysics Laboratory (AFGL).John Cipar (AFGL) kindly provided funding forthe collection of the rock samples. We thankDean Ballotti (Purdue University), for samplepreparation and velocity measurements in thehigh-pressure laboratory. Walter Mooney (USGS)and Tom Brocher (USGS) provided constructivereviews of early versions of this manuscript. Many
S. HUGHES ET AL.
thanks to Rolfe Stanley (University of Vermont),Nicholas Ratcliffe (USGS) and Dave Stewart(USGS) for their interest and encouragement. SHgratefully acknowledges support from the USGSDeep Continental Studies program.
References
Ando, e.J., Czuchra, B.L., Klemperer, S.L., Brown, L.D.,Cheadle, M.J., Cook, F.A., Oliver, J.E., Kaufman, S.,Walsh, T., Thompson, J.R., Lyons, J.B. and Rosenfeld,J.L., 1984. Crustal profile of a mountain belt: COCORP'sdeep seismic reflection profile in New England and impli-
cations for architecture of convergent mountain chains.Am. Assoc. Pet. Geol., 68: 819-837.
Birch, F., 1960. The velocity of compressional waves in rocks
at 10 Kbars part 1. J. Geophys. Res., 65: 1083-1102.Blackwell, D.D., 1971. The thermal structure of the continen-
tal crust. In: J.G. Heacock (Editor), The Structure andPhysical Properties of the Earth's Crust. Geophys.Monogr., Am. Geophys. Union, 14: 169-184.
Bradley, D.e., 1983. Tectonics of the Acadian orogeny in NewEngland and adjacent Canada. J. Geol., 91: 381-400.
Brocher, T.M. and Christensen, N.I., 1990. Seismic anisotropydue to preferred mineral orientation observed in shallowcrustal rocks in southern Alaska. Geology, 18: 737-740.
Brown, L.D., Ando, e.J., Klemperer, S., Oliver, J.E., Kauf-man, S., Czuchra, B., Walsh, T. and Isachsen, Y.W., 1983.Adirondack-Appalachian crustal structure: the COCORPnortheast traverse. Geol. Soc. Am. Bull., 94: 1173-1184.
Chiarenzelli, J. and McLelland, J., 1990. Age and regionalrelationships of the granitoid rocks of the AdirondackHighlands. J. Geol., 99: 571-590.
Christensen, N.I., 1979. Compressional-wave velocities in rocksat high temperatures and pressures, critical thermal gradi-ents, and crustal low velocity zones. J. Geophys. Res., 84:
6849-6857.Christensen, N.I. and Fountain, D.M., 1975. Constitution of
the lower continental crust based on experimental studiesof seismic velocities in granulite. Geol. Soc. Am. Bull., 86:227-236.
DelloRusso, V. and Stanley, R.S., 1986. Bedrock geology of
the northern part of the Lincoln Massif, Central Vermont.In: e.A. Ratte (Editor), Special Bulletin 8. Vermont Geo-logical Survey.
Doll, e.G., Cady, W.M., Thompson, J.B. and Billings, M.P.,
1961. Centennial geologic map of Vermont. Vermont Geo-logical Survey.
Fountain, D.M. and Christensen N.I., 1989. Composition of
the continental crust and upper mantle; a review. In: L.e.Pakiser and W.D. Mooney (Editors), Geophysical Frame-work of the Continental United States. Geol. Soc. Am.Mem., 172: 711-742.
Hughes, S. and Luetgert, J.H., 1991. Crustal structure of the
Author's Personal Copy

DEEP SEISMIC REFRACTION AND REFLECTION DATA FROM THE GRENVILLIAN-APPALACHIAN BOUNDARY 269
western New England Appalachians and the Adirondackmountains. J. Geophys. Res., 96: 16,471-16,494.
Hughes, S. and Luetgert, J.B., 1992. Crustal structure of the
southeastern Grenville province. northern New York Stateand eastern Ontario. J. Geophys. Res., 97: 17,455-17,479.
Isachsen, Y.W. and Fisher, D.W., 1970. Geologic Map of NewYork: Adirondack Sheet. New York State Mus. Sci. Serv.,Map Chart Ser. 15.
Kern, H. and Richter, A, 1981. Temperature derivatives ofcompressional and shear wave velocities in crustal and
mantle rocks at 6 Kbars confining pressure. J. Geophys.,49: 47-56.
Manghnani, M.B., Ramananantoandro, R. and Clark, S.P.,
1974. Compressional and shear wave velocities in granulitefacies rocks and eclogites to 10 kbars. J. Geophys. Res.,79: 5427-5446.
McLelland, J.M. and Isachsen, Y.W., 1986. Synthesis of geol-ogy of the Adirondack mountains, New York, and their
tectonic setting within the southwestern Grenville Pro-vince. In: J.M. Moore, A Davidson and AJ. Baer (Edi-tors), The Grenville Province. Geol. Assoc. Can., Spec.Pap., 31: 75-94.
Mooney, W.D., 1989. Seismic methods for determining earth-quake source parameters and lithospheric structure. In:
L.e. Pakiser and W.D. Mooney (Editors), GeophysicalFramework of the Continental United States. Geol. Soc.
Am. Mem., 172: 11-34.Phinney, R.A and Roy-Chowdhury, K., 1989. Reflection seis-
mic studies in the eastern United States. In: L.e. Pakiserand W.D. Mooney (Editors), Geophysical Framework of
the Continental United States. Geol. Soc. Am. Mem., 172:613-653.
Ratcliffe, N.M., Aleinikoff, J.M., Burton, W.e. and KaribinosP., 1991. Trondhjemetic, 1.35-1.31 Ga. gneisses of the
Mount Holly Complex of Vermont: evidence for an Elze-verian event in the Grenville basement of the UnitedStates Appalachians. Can. J. Earth Sci., 28: 77-93.
Rowley, D.B. and Kidd, W.S.F., 1980. Stratigraphic relation-ships and detrital composition of the medial Ordovicianflysch of western New England: Implications for the tec-
tonic evolution of the Taconic orogeny. J. Geol., 89: 199-218.
Stanley, R.S., 1989. A transect through the pre-Silurian fore-
land and hinterland of central Vermont. In: J.B. Lyonsand W.A Bothner (Editors), A transect through the NewEngland Appalachians. IGC 28 Fieldtrip guidebook T162,AG.U., pp. 15-29.
Stanley, R.S. and Ratcliffe, M.N., 1985. Tectonic synthesis of
the Taconic orogeny in western New England. Geol. Soc.Am. Bull., 96: 1227-1250.
Thigpen, J.T., 1989. Seismic reflection evidence for imbricate
basement slices in central New England. MSc. Thesis,Cornell University, 95 pp. (unpubl.).
Wiener, R.W., McLelland, J.M., Isachsen, Y.W. and Hall,L.M., 1984. Stratigraphy and structural geology of theAdirondack mountains, New York: review and synthesis.
In: M.J. Bartholomew (Editor), The Grenville Event in theAppalachians and Related Topics. Geol. Soc. Am., Spec.Pap., 194: 1-55.
Author's Personal Copy