Embed Size (px)
Citation preview
Time for a Tune Up: Personal Income Taxation
in Western Canada
March 2009
Kevin Milligan, Ph.D.
CanadaWestF O U N D A T I O N
G O I N G F O R G O L D
The Western Canadian Economyin the International Arena
G O I N G F O R G O L D
The Western Canadian Economyin the International Arena
© 2009 Canada West Foundation
ISBN 1-897423-46-2
This paper was prepared by Dr. Kevin Milligan of the University of British Columbia's Department of Economics. The paper is
part of the Canada West Foundation’s GoING For GolD Project research Paper Series. Each paper examines a key issue
related to improving western Canada’s ability to compete and win in the global economy over the long-term.
The opinions expressed in this document are those of the author and are not necessarily those of the Canada West Foundation’s
Board of Directors, advisors, or funders. Permission to use or reproduce this report is granted for personal or classroom use
without fee and without formal request provided that it is properly cited. Copies may not be made or distributed for profit or
commercial advantage. Additional copies can be downloaded from the Canada West Foundation website (www.cwf.ca).
Graphic Design and Layout by Jason Azmier
Western Canada’s economic prosperity is not only good for the West, but for Canada as a whole. But the West cannot rest on its
laurels. like the athletes training for the forthcoming Winter olympics in Vancouver, western Canada needs to be at the top of its
game if it is to continue to compete successfully in the international economic arena, especially as its competitors step up their
games. If we are not successful, our standard of living will fall.
The GoING For GolD Project is examining how best to position western Canada in the global economy through a series of
research papers, consultations and a seminal economic conference in Vancouver in the fall of 2009.
The GoING For GolD Project has been made possible with the support of:
Additional funding has been provided by the Provinces of British Columbia (Economic Development), Alberta (Employment,
Immigration and Industry), Saskatchewan (Enterprise and Innovation), and Manitoba (Competitiveness, Training and Trade).
G O I N G F O R G O L D
Time for a Tune Up: Personal Income Taxation in Western Canada
1
leading the Way: The GoING For GolD Project research Paper Series
The primary goal of the Canada West Foundation’s GoING For GolD Project is to ensure that Canadians make the right
public policy decisions for improving the ability of the country and its regions to compete in the upper echelon of the
global economy. The ultimate goal, however, is to ensure that Canada experiences the long-term economic prosperity that
underpins a high quality of life and an inclusive and caring society in which all citizens can participate and thrive.
The GoING For GolD Project’s research Paper Series helps achieve these goals by providing thoughtful and timely
information combined with practical options for improving public policy’s role in fostering Canada’s economic competiveness.
The diversity of topics covered by the series is intentional and highlights the many facets of public policy that will need to
be working in concert if western Canada—and by extension Canada—are to succeed in the global economy in the decades
ahead.
We cannot rest on our laurels and we cannot be reactive. We must take proactive steps today to ensure a prosperous
tomorrow. The countries that fumble the public policy ball will fall behind in the global economy and see the opportunities
available to their citizens shrink. Much of what must be done is beyond the scope of public policy; it is just one factor, but
it is a critical factor. Bad economic policy will hamstring us just as good public policy will propel us forward.
It is important to note that winning in the global economy does not mean that other regions and other countries must lose.
Even though only one competitor can rank first, healthy competition can bring out the best in all countries. There is much
that Canadians can achieve by working with international partners. This, in turn, will improve economic outcomes both at
home and abroad. There is also much that Canada can learn from the experiences of other jurisdictions and this is a key
element of the research papers.
There is much to discuss and there is much to be done. Ask any olympic athlete if their training is ever complete and they
will say that they are always training, preparing, and searching for the competitive edge. The same is true of public policy
aimed at improving our economic competitiveness—it will always be a work in progress.
The authors of the papers were given the freedom to explore key topics as they saw fit. As a result, the series does not
provide a complete set of policy recommendations or a master plan for global economic dominance. Nor does it represent
the “top 10” things that must be done to make western Canada more competitive. rather, it provides a set of useful
examples of what can and should be done combined with provocative recommendations across a broad range of relevant
policy files.
For more information about the GoING For GolD Project, please do not hesitate to contact me at [email protected].
robert roach
Director of research
2
Kevin Milligan
Personal income taxation brings in between 18-21% of provincial revenues in western Canada, and has a substantial effect on the incentives for families to work, save, and invest as well as being a direct determinant of the economic standing of each household. Personal income is taxed both by the federal and provincial governments, which has generated a legacy of co-operation. The most recent innovation in 2000-01 devolved to the provinces the ability to set their own rates, brackets, and credits, using a federally-defined taxable income base.
Through simulations, I show that the different choices made by the four western Canadian provinces have yielded substantially different tax systems, each with unique attributes. British Columbians have a relatively progressive system, with much higher rates at the top than the bottom. Albertans have the lowest marginal tax rates at top incomes, but higher for lower incomes. In Saskatchewan, average tax rates are high, but sizeable work incentives at lower incomes are provided by refundable child credits. Finally, Manitoba features high average and marginal tax rates, but a strong degree of progressivity. In common across the provinces, there is very little progressivity at higher incomes; the marginal tax rate is the same at $125,000 as at $125 million.
Internationally, these results are compared to the systems of the United States, the United Kingdom, Japan, China, and Hong Kong. Both the United States and Japan feature much greater progressivity. In contrast, the United Kingdom and Hong Kong have low and fairly flat tax structures.
The paper concludes with five recommendations, supported by the evidence and analysis gathered here.
Remain in the Tax Collection Agreements. The benefits to all Canadians from sharing the same tax platform are large. The advent of the tax on income system since 2001 has given the provinces ample flexibility to design and create their own systems.
All provinces should index tax credits and brackets to inflation. Inadequate indexation leads to stealth tax increases. Tax increases should be transparent.
Stop expanding non-refundable credits. Non-refundable tax credits add complexity and costs to the tax system.
Consolidate some existing non-refundable credits. Some non-refundable credits have dubious social or economic value and address problems better taken on elsewhere.
Consider increasing progressivity at the top. Market incomes have been growing more unequal at a fast pace. Increased progressivity would help to slow down this upward inequality trend.
Executive Summary
3
Time for a Tune Up: Personal Income Taxation in Western Canada
1. Introduction and Overview
In most countries in the world, personal income taxation remains a vital and stable source of government revenues. This statement
holds true in Canada—and in western Canada specifically. Even with great differences in resource revenues, political cultures, and
economic structures, all four western Canadian provinces make use of the flexibility of personal income taxation to raise a substantial
and very similar portion of their revenues.
Income taxes are an important determinant of economic outcomes. Not only do they affect how people work, save, and invest, they can
also influence decisions on where to live and also play a leading role in the fairness of our overall fiscal system. This suggests that a
thorough understanding of the personal income tax system in western Canada can help to position the economies of western Canada
for growth and prosperity in the years to come.
The relationship between the federal and provincial income taxes in Canada has changed frequently since Confederation. The most
recent important change was the introduction of the “tax on income” system in 2000-2001, which allowed provinces great flexibility to
set their own tax brackets, tax rates, and tax credits using a common taxable income definition set by the federal government. In the
seven years since this system was put in place, there has been a significant amount of evolution and innovation across provinces—
particularly in western Canada. At this juncture, therefore, the time is ripe to assess the success of the “tax on income” system and to
chart a path for the future of the personal income tax in western Canada.
This paper provides a detailed analysis of the present state of the personal income tax system in western Canada. I start with some
context on the importance of personal income taxation to the economy and a review of the research on the impact of personal income
taxation on individual decisions. Next is an historical overview of federal-provincial interactions over personal income taxation, followed
by a discussion of the philosophical underpinnings and structure of personal income taxation in Canada. I then provide simulations for
each province of the marginal and average tax rates produced by their tax systems, and discuss the findings and implications. Finally,
I briefly discuss the features of the tax systems of five international jurisdictions important for western Canadians in order to provide
context. The paper closes with several recommendations based on the analysis and findings.
In the past few months, most fiscal discussion has turned to appropriate responses to the recession. This paper does not address
countercyclical fiscal measures. Instead, I pursue a longer-run concentration on the tax structure that should be in place when Canada
again emerges from recession and for the future. As well, for reasons of space, this paper focuses only on personal income taxation.
This should not be interpreted as suggesting that other tax choices, such as changing the structure of corporate taxation or changing
Abstract
Personal income taxation brings in between 18-21% of provincial revenues in western Canada. It has a substantial effect on
the incentives for families to work, save, and invest as well as being a direct determinant of the economic standing of each
household. Through simulations, this paper shows that the different tax policy choices made by the four western Canadian
provinces have yielded substantially different tax systems, each with unique attributes. British Columbians have a relatively
progressive system, with much higher rates at the top than the bottom. Albertans have the lowest marginal tax rates at top
incomes, but higher for lower incomes. In Saskatchewan, average tax rates are high, but sizeable work incentives at lower
incomes are provided by refundable child credits. Finally, Manitoba features high average and marginal tax rates, but a strong
degree of progressivity. Internationally, these results are compared to the systems of the United States, the United Kingdom,
Japan, China, and Hong Kong. Both the United States and Japan feature much greater progressivity. In contrast, the United
Kingdom and Hong Kong have low and fairly flat tax structures.
4
the tax mix toward more environmental taxes, are not worthy of
study or consideration. Instead, I leave that analysis to others
and pursue here answers to the questions, what does western
Canada’s personal income tax system look like and what should
it look like?
2. Importance of PIT
Personal Income Taxation (PIT) raises a large share of total
government revenue in western Canada. Moreover, PIT
represents a large fraction of economic activity within each
province. In this section, I review some facts on the magnitude
of PIT in the economy in order to give context and perspective
for the discussion in the paper that follows.
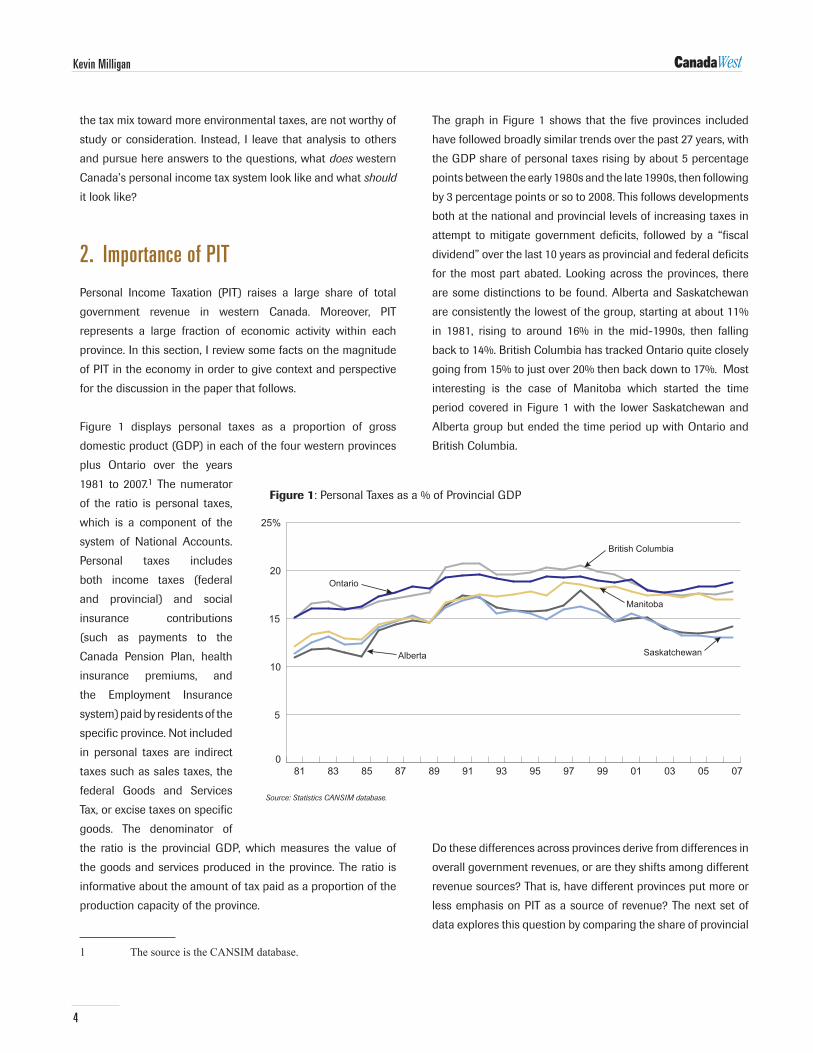
Figure 1 displays personal taxes as a proportion of gross
domestic product (GDP) in each of the four western provinces
plus ontario over the years
1981 to 2007.1 The numerator
of the ratio is personal taxes,
which is a component of the
system of National Accounts.
Personal taxes includes
both income taxes (federal
and provincial) and social
insurance contributions
(such as payments to the
Canada Pension Plan, health
insurance premiums, and
the Employment Insurance
system) paid by residents of the
specific province. Not included
in personal taxes are indirect
taxes such as sales taxes, the
federal Goods and Services
Tax, or excise taxes on specific
goods. The denominator of
the ratio is the provincial GDP, which measures the value of
the goods and services produced in the province. The ratio is
informative about the amount of tax paid as a proportion of the
production capacity of the province.
1 The source is the CANSIM database.
The graph in Figure 1 shows that the five provinces included
have followed broadly similar trends over the past 27 years, with
the GDP share of personal taxes rising by about 5 percentage
points between the early 1980s and the late 1990s, then following
by 3 percentage points or so to 2008. This follows developments
both at the national and provincial levels of increasing taxes in
attempt to mitigate government deficits, followed by a “fiscal
dividend” over the last 10 years as provincial and federal deficits
for the most part abated. looking across the provinces, there
are some distinctions to be found. Alberta and Saskatchewan
are consistently the lowest of the group, starting at about 11%
in 1981, rising to around 16% in the mid-1990s, then falling
back to 14%. British Columbia has tracked ontario quite closely
going from 15% to just over 20% then back down to 17%. Most
interesting is the case of Manitoba which started the time
period covered in Figure 1 with the lower Saskatchewan and
Alberta group but ended the time period up with ontario and
British Columbia.
Do these differences across provinces derive from differences in
overall government revenues, or are they shifts among different
revenue sources? That is, have different provinces put more or
less emphasis on PIT as a source of revenue? The next set of
data explores this question by comparing the share of provincial
Kevin Milligan
0
5
10
15
20
25%
British Columbia
Alberta Saskatchewan
Manitoba
Ontario
0705030199979593918987858381
Figure 1: Personal Taxes as a % of Provincial GDP
Source: Statistics CANSIM database.
5
Time for a Tune Up: Personal Income Taxation in Western Canada
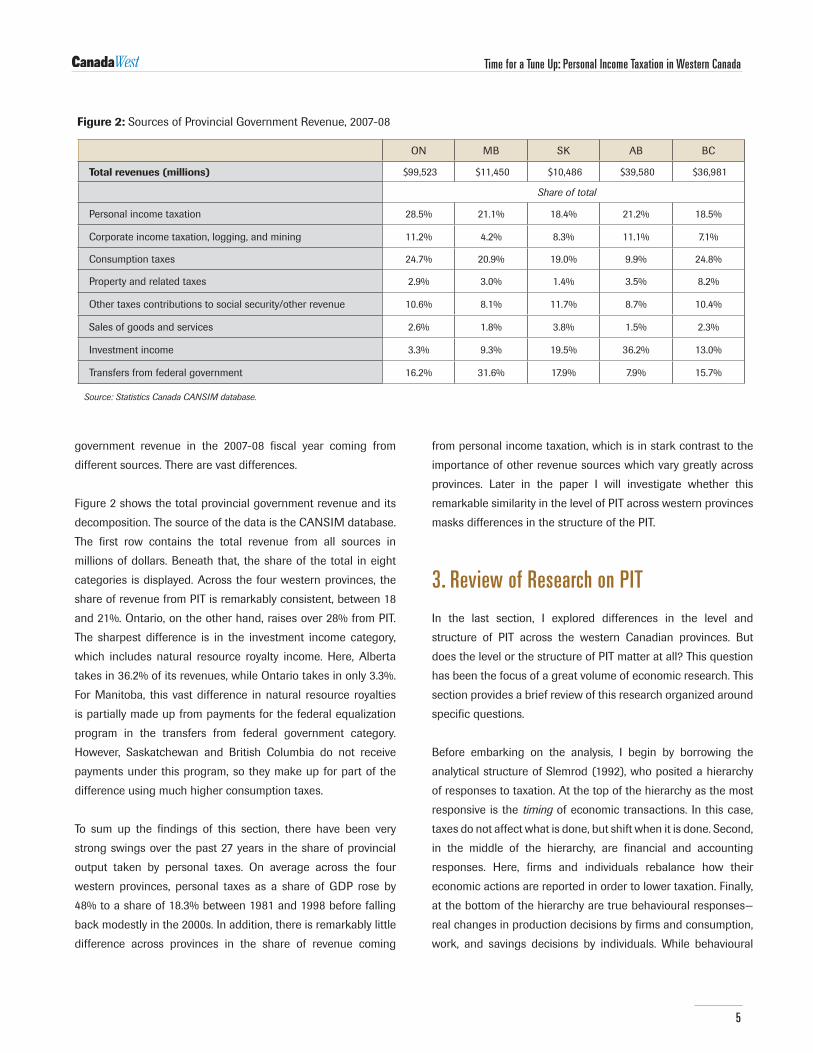
government revenue in the 2007-08 fiscal year coming from
different sources. There are vast differences.
Figure 2 shows the total provincial government revenue and its
decomposition. The source of the data is the CANSIM database.
The first row contains the total revenue from all sources in
millions of dollars. Beneath that, the share of the total in eight
categories is displayed. Across the four western provinces, the
share of revenue from PIT is remarkably consistent, between 18
and 21%. ontario, on the other hand, raises over 28% from PIT.
The sharpest difference is in the investment income category,
which includes natural resource royalty income. Here, Alberta
takes in 36.2% of its revenues, while ontario takes in only 3.3%.
For Manitoba, this vast difference in natural resource royalties
is partially made up from payments for the federal equalization
program in the transfers from federal government category.
However, Saskatchewan and British Columbia do not receive
payments under this program, so they make up for part of the
difference using much higher consumption taxes.
To sum up the findings of this section, there have been very
strong swings over the past 27 years in the share of provincial
output taken by personal taxes. on average across the four
western provinces, personal taxes as a share of GDP rose by
48% to a share of 18.3% between 1981 and 1998 before falling
back modestly in the 2000s. In addition, there is remarkably little
difference across provinces in the share of revenue coming
from personal income taxation, which is in stark contrast to the
importance of other revenue sources which vary greatly across
provinces. later in the paper I will investigate whether this
remarkable similarity in the level of PIT across western provinces
masks differences in the structure of the PIT.
3. Review of Research on PIT
In the last section, I explored differences in the level and
structure of PIT across the western Canadian provinces. But
does the level or the structure of PIT matter at all? This question
has been the focus of a great volume of economic research. This
section provides a brief review of this research organized around
specific questions.
Before embarking on the analysis, I begin by borrowing the
analytical structure of Slemrod (1992), who posited a hierarchy
of responses to taxation. At the top of the hierarchy as the most
responsive is the timing of economic transactions. In this case,
taxes do not affect what is done, but shift when it is done. Second,
in the middle of the hierarchy, are financial and accounting
responses. Here, firms and individuals rebalance how their
economic actions are reported in order to lower taxation. Finally,
at the bottom of the hierarchy are true behavioural responses—
real changes in production decisions by firms and consumption,
work, and savings decisions by individuals. While behavioural
Figure 2: Sources of Provincial Government revenue, 2007-08
oN MB SK AB BC
Total revenues (millions) $99,523 $11,450 $10,486 $39,580 $36,981
Share of total
Personal income taxation 28.5% 21.1% 18.4% 21.2% 18.5%
Corporate income taxation, logging, and mining 11.2% 4.2% 8.3% 11.1% 7.1%
Consumption taxes 24.7% 20.9% 19.0% 9.9% 24.8%
Property and related taxes 2.9% 3.0% 1.4% 3.5% 8.2%
other taxes contributions to social security/other revenue 10.6% 8.1% 11.7% 8.7% 10.4%
Sales of goods and services 2.6% 1.8% 3.8% 1.5% 2.3%
Investment income 3.3% 9.3% 19.5% 36.2% 13.0%
Transfers from federal government 16.2% 31.6% 17.9% 7.9% 15.7%
Source: Statistics Canada CANSIM database.
6
responses are perhaps less common, they are economically the
most critical since they have the largest impact on economic
efficiency and our well-being.
I now turn to the analysis of five specific questions on the impact
of PIT on economic behaviour. For each of the five, I argue from
economic principles and from drawing on the relevant research.
The review is by no means comprehensive; instead the goal is to
give a flavour of the evidence on these questions as motivation
and context for the rest of the analysis in this paper.
Does PIT affect labour mobility?
Through the late 1990s and early 2000s, there was a swell of
concern about a “brain drain” from Canada to the US, with
exchange rates, economic opportunities, and high tax rates on
large earners being three common recipients of blame. The tax
explanation requires some thought. When one moves a place of
residence, it is not high marginal tax rates that matter. Why not?
Marginal tax rates reflect the tax paid on the last dollar earned.
When you move, not only is the marginal dollar moving but the
first dollar and more generally all of the taxable income moves as
well. This means that average tax rates matter, not the marginal
rate. Moreover, the bundle of government-provided goods and
services also changes as one moves jurisdictions. Taxes may be
lower, but it is possible that the bundle of government-provided
goods is judged to be less valuable as well, making the switch
less beneficial. So, it is the net fiscal benefit (including both tax
and spending sides of the budgets) that should in theory govern
the decision to move.2
While the theoretical predictions are quite clear, the empirical
evidence has been more mixed. In a recent Canadian paper,
Day and Winer (2006) find that the magnitude of migration
induced by fiscal incentives is quite small and is unlikely to have
large effects relative to large political shocks (like troubles in
Quebec) or economic shocks (like the closing of the Atlantic
cod fishery).
Does PIT affect capital allocation decisions?
2 ThetheoryonthistopicoffiscallyinducedmigrationisgroundedinthemodelofTiebout(1956),whoarguedthatindividualscomparetheamenities,fiscalcosts,andfiscalbenefitswhenchoosinga residence.
Unlike for labour mobility, shifting one’s capital from one
jurisdiction to another does not require a physical location of
one’s domicile. This means that marginal tax rates now matter
and that government expenditure unrelated to the investment
itself now becomes irrelevant. This suggests a stronger likelihood
that tax rates will affect capital allocation across jurisdictions
than was the case for labour. Empirically, this theoretical case
holds true. Mintz and Smart (2004) show that Canadian firms
respond to interprovincial differences in corporate tax rates by
financially shifting profits from high tax to low tax provinces.
Using Slemrod’s hierarchy, this is a “second tier” response. of
course, this paper examined corporate rather than personal tax
responses, but it does provide evidence that capital is much
more sensitive to tax rate differentials across jurisdictions than
labour.
Beyond moving across jurisdictions, personal income taxation
can have a large impact on how capital is allocated across
investment opportunities within one jurisdiction. To take one
example, the portfolio choice decisions of American households
within a tax-deferred account and outside the tax-deferred
account are shown by Bergstresser and Poterba (2004) to be
different for many households. That is, the mix of investments
chosen between stocks and bonds depends on the taxation of
the investments.
Finally, there is the well-known phenomenon of the “lock-in
effect.” Because capital gains are taxed only upon realization,
the paying of tax can be deferred by not realizing a gain even
if for investment portfolio reasons it would be optimal to sell
and reallocate the capital. This phenomenon has been heavily
studied in the finance and taxation literatures (see the review
in Klein 2004), with most studies finding evidence that taxation
affects realization decisions. In light of the Slemrod hierarchy,
this should not be surprising because the lock-in effect is
a timing decision, so Slemrod would predict capital gains
realizations to be highly sensitive to taxes.
Does PIT affect corporate form decisions?
The taxation of personal income can also have an impact on
corporate form. There are several ways to extract income from
a corporation and get it into the hands of the provider of the
capital. The income could arrive as wages, a debt repayment
(interest), a dividend, or through a capital gain to existing
Kevin Milligan
7
shareholders because of a share repurchase scheme by the
firm. If these different channels face different rates of taxation,
the providers of capital benefit by choosing a channel for their
repayments wisely. In some circumstances, this can lead to a
change in the legal organization of the business activity in order
to minimize taxes.
For example, the small-business sector is one that faces these
considerations in many countries. Auerbach and Slemrod
(1997) review the evidence on the Tax reform Act of 1986 in
the United States which lowered the top personal rate beneath
the corporate rate, giving smaller businesses an opportunity to
save tax by moving away from corporate organization. They find
evidence that indeed this occurred.
In Canada, the experience with income trusts is similar. As
personal income tax rates fell in the late 1990s and early
2000s, the treatment of dividends and interest income became
disjointed in favour of interest income. The dividend tax credit
had not been properly updated to reflect changes in corporate
and individual tax rates. This led to a growing movement
away from the corporate form into an income trust structure,
which paid distributions taxed as ordinary income rather than
as dividends. (See Mintz and richardson 2006 for a complete
analysis.) Although this might be seen as an innocuous change
to avoid taxation, it potentially had serious consequences for
real corporate decisions because the legal requirements for an
income trust structure placed restrictions on distributions. This
could have led to decreased corporate investment.
Does PIT affect labour market participation and effort?
one of the most active areas of research on taxation has been
the effect of taxes on the labour market. The research in this
area is vast, so I will focus tightly on two questions. First, what
is known about the labour market participation of lower ability/
lower earning individuals? The evidence strongly suggests that
the “in or out” decision of marginal workers is affected by the
fiscal incentives they face. A major body of this research has
studied the impact of the tremendous expansion in working tax
credits for families with children in Canada, the United States,
and the United Kingdom. For example, Milligan and Stabile
(2007) find that the expansion of the National Child Benefit
system in the 1990s can account for 19 to 27% of the decline
in social assistance take up in the late 1990s. The second
question is what happens to the labour supply of more active
labour market participants. For those already in the labour
market, their response to taxes would be to work more hours in
a week or more weeks in a year (i.e., work more intensively). A
landmark paper on this topic by Blundell, Duncan, and Meghir
(1998) looked at the impact of tax rates changing over time on
the work behaviour of married women in the United Kingdom.
The authors find that hours worked responded with an elasticity
of 0.14 for women without children, rising to 0.301 for women
with a child age 0-2.3 Typical findings in the literature show
that men are less responsive to taxes than women, however, so
these findings cannot be applied directly to the case of men.
The consensus in the literature is that taxes have a moderate
impact on labour force effort.
Does PIT affect entrepreneurial effort?
The taxation of the return to entrepreneurial effort presents
some unique considerations. At first look, higher taxation of the
return to entrepreneurship would seem to predict lower effort,
which would have negative implications for this important
segment of the economy. However, as shown originally by
Domar and Musgrave (1944), taxing the return to risk can
in some circumstances increase risky investments. The key
assumption for their analysis is full-loss offset; that losses
may be deducted from other income or be tax refundable. In
that case, the government shares not only in the gains, but
also subsidizes part of any loss. Because both the upside and
downside are muted by taxation, entrepreneurs may invest
more to increase their risk exposure. This example provides a
powerful lesson for the importance of thinking carefully about
the impact of taxes on behaviour.
Empirical evidence has typically found a negative link between
self-employment or entrepreneurial activity and taxes. For
example, Gentry and Hubbard (2005) find taxes are negatively
related to entry into self-employment and attribute their finding
to the progressivity of the tax schedule—the gains are taxed
more heavily than the losses are subsidized. However, more
recently Cullen and Gordon (2007) have injected some doubt
with their finding that evidence of entrepreneurial activity is
3 Anelasticityof0.14impliesthata10percentchangeintheafter-taxwageleadstoa1.4percentchangeinwork.
Time for a Tune Up: Personal Income Taxation in Western Canada
8
strongly positively related to taxes, consistent with the Domar-
Musgrave hypothesis. So, this literature has not converged on a
consensus and remains active.
To conclude, this section has discussed evidence suggesting that
taxes can have a substantial impact on behaviour. However, the
degree of the effect depends on the object under consideration.
Evidence suggested that the labour mobility response to taxes is
not empirically large. However, capital seems more responsive.
Corporate form is extremely sensitive to tax differentials across
different channels of transferring income from business to
owner. labour supply is quite sensitive for those with children
or at the margins of the labour market; less so for those already
working. Finally, the evidence on entrepreneurship is perhaps
surprisingly ambiguous—with some evidence showing an
increase in risky investments related to increases in taxes.
An important caveat comes from the evidence in lee and
Gordon (2005). They study overall economic growth across
countries, comparing the impact of corporate tax rates and
individual marginal tax rates. They find a strong response to
higher corporate taxes, but no significant response to higher
personal tax rates. While only suggestive, this serves as a
reminder that building a policy conducive to economic growth
requires the study of more than just personal income tax rates.
4. Federal-Provincial Relations and the PIT
The relationship between the federal and provincial governments
with respect to income taxation has changed through time. This
change can best be described as evolutionary, with several more
sharp episodes of rapid change. It is important to understand
this history in order to set the stage for consideration of where
personal income taxation should go next in western Canada.
The discussion appearing below draws primarily upon la Forest
(1967), Moore, Perry, and Beach (1966), and Boadway and
Hobson (1993).
To begin, the British North America Act of 1867 assigned to
the federal government the power to raise revenue through any
means, including of course direct income taxation. In contrast,
provinces had their fields of taxation restricted. However, the
provinces were assigned the right to tax incomes for provincial
purposes. From 1867 through to the First World War, however,
the use of this power was sporadic. ontario used some direct
taxation after Confederation and British Columbia did as
well starting in the late 1800s. It was not until the First World
War, however, that the federal government moved into direct
taxation in a large way in order to fund war obligations. After
the First World War and until 1941 the use of income taxation
crept forward in many provinces, each with their own system of
income definition, tax bases, exemptions, and rates.
Again, it was war obligations that spurred another great
change. In 1941, the federal government offered to “rent” the
income tax field from the provinces in return for payments
from the federal government. The provinces would have to
shut down their existing income taxes. All 9 provinces agreed
to this arrangement, giving birth to the “tax rental agreement”
era. After the war, through many discussions between the
federal and provincial governments, this system persisted until
1962. Gradually, provinces were allowed under the terms of
the agreement to re-introduce some direct taxes and gain a
greater share of federal revenue as “rent.” The setting up of a
stand alone income taxation system in Quebec in the late 1950s
spurred more calls for change.
Many discussions through the late 1950s and early 1960s
resulted in a new arrangement starting in 1962. The federal
government kept its existing base and rate structure, but
“abated” a percentage of the tax revenue, meaning that taxpayers
essentially got a tax reduction of the specified percentage.
This percentage was set initially to 16%, but rose up to 28%
by 1971. In place of this federal income taxation, provinces
could then collect revenue for their own purposes. This revenue
was collected by the federal government and remitted to the
provincial governments, at no charge. Thus, these arrangements
are referred to as the Tax Collection Agreements.
The exact structure of these arrangements centered on the
Basic Federal Tax of the federal tax system. Basic Federal Tax
was the amount resulting from the federally-defined taxable
income being put through the federally-defined bracket and rate
structure. Provinces could then choose a percentage of the Basic
Federal Tax to levy as their “own” revenue. This is referred to as
a “tax on tax” structure. This arrangement was quite restrictive,
in that provinces had no control over the definition of total
income or the deductions/exemptions from total income that
determine taxable income. What’s more, because the bracket
Kevin Milligan
9
and rate structure were federally-defined, provinces had little
control over the progressivity of the system.4 The benefit to
the provinces was that they were able to enjoy the economies
of scale in tax collection by ceding the administration of tax
collection to the central authority. Notably, Quebec did not sign
a tax collection agreement and continued the development
of its own income tax system with different base, deductions,
credits, and rates.
The most recent development in the Tax Collection Agreement
system arrived in the late 1990s as pressure arose from the
provinces to give them more freedom in the structure of their
income taxes. The result was a move in 2000-01 away from
“tax on tax” toward “tax on income,” often referred to by
the acronym ToNI. Under the new ToNI system, the federal
government continued to set the tax base through the definition
of total income and the deductions that lead to the calculation
of taxable income. From that point, the provinces have
considerable latitude to set brackets, rates, and refundable and
non-refundable credits.5 Provinces were given the option to stick
with tax on tax or switch to tax on income, but all 9 provinces
and the three territories in the Tax Collection Agreements
chose to switch by 2001. Some provinces have introduced new
credits. others have mimicked changes to federal credits. For
inflation indexation, some provinces use a provincial inflation
index to update their brackets and credits while others have
not implemented automatic indexing. The result of these
changes is a system that is slowly taking different shapes in
each province.
To summarize, the collection of provincial income taxes has
changed dramatically from the “anything goes” era from
Confederation to 1941, through the restrictive tax rental
agreements of the middle of the 20th century, and finally to the
4 Provinceswereabletodesignandimplementdifferentrefundableandnon-refundabletaxcreditsundertheTaxCollectionAgreements.Aswell,theprairieprovinceseachimplementedaspecialflattax(thatvariedbetween1and2%)onadifferentincomebase,whichalsogavesomecontroloverbaseandprogressivitytothoseprovinces.
5 Theydonothavecompleteflexibility,however,astheagreementsrestrictthevalueanddeterminationofcreditsinsomeways.Forexample,ifacreditisthesameasthefederalequivalentcredit,theadministrationisfreeofcharge.However,ifitisdifferent,theprovincemustpayfortheadministration.SeeCanada(2000)forfulldetails.
Tax Collection Agreements since 1962 which have slowly but
steadily renewed a large degree of provincial autonomy in the
personal income taxation field.
5. The Structure of PIT in Canada
This section outlines the structure of the PIT system in Canada. I
begin by providing background on the underlying philosophical
and logical roots of the personal income tax system in Canada.
I then discuss the importance of the income tax in addressing
inequality of economic outcomes. Finally, I describe in detail the
structure of the personal income tax in Canada and in the four
western Provinces.
The roots of the PIT
The roots of the personal income taxation (PIT) structure in
Canada can be found in the royal Commission on Taxation of
1967, commonly referred to as the “Carter Commission.” The
Carter Commission constructed a real-world framework for
taxation based on the concept of “comprehensive income”
developed by economists robert Murray Haig and Henry
C. Simon. The Haig-Simon concept posited that accruals to
economic power, no matter the source, should be treated as
income and taxed equally. For example, earnings, capital gains,
accruing pension benefits, social benefits, scholarship income,
and corporate dividends all increase one’s power to consume.
Under the Haig-Simon comprehensive income, these should
all be included equally in determining the ability to pay of the
tax unit (be it individual or family). From this base should be
deducted expenses which are necessary to earn income (such
as interest paid on funds borrowed to invest) or do not yield
gratification (such as medical expenses). The end target was
a measure that could be construed as the ability to pay of the
tax unit.
In a major tax reform in Canada in 1972 implemented many of
the proposals of the Carter Commission. Many new categories
of income became taxable, including capital gains, scholarship
income, family allowance, among others. New deductions for
items such as childcare expenses helped to move the definition
of income closer to the theoretical notion of “ability to pay.”
Time for a Tune Up: Personal Income Taxation in Western Canada
10
Kevin Milligan
Even with these reforms, however, the tax system did not
conform exactly to the Haig-Simon ideal. To take a conspicuous
example, the imputed income of owner-occupied housing, as
well as any capital gains from the primary residence, were
excluded from taxation. Moreover, all capital gains are taxed
only upon realization rather than annually on accrual. on top
of these shortcomings, subsequent tax reforms and changes
have through time further eroded the structure of the tax system
from its Carter-inspired target. For example, the expansion of
eligibility and widespread adoption of registered retirement
Savings Plans means that a large fraction of households can
shield the return to savings from current taxation and defer
the tax to the future. This moves the tax base away from the
comprehensive income ideal. Instead, by exempting the return
to savings, only income that is consumed remains as the base
for tax. More recently, the complete exemption of scholarship
income and the introduction of the Tax Free Savings Account in
2009 further disconnects the definition of income from its roots.
This is not to say that these changes to the definition of income
are necessarily unwanted or undesirable. However, what is clear
is that the current logical underpinnings of the system have
become diluted and confused.
The PIT and inequality
Within the tax system, the personal income tax forms a strong
buttress against inequality. Kesselman and Cheung (2004) find
that, on a lifetime basis, only personal income taxes are strongly
progressive. Sales taxes, excise taxes, payroll taxes, and property
taxes are strongly regressive, and corporate income taxes mildly
regressive. Taking this as true, if a society does wish to have a
degree of redistribution from the market-generated distribution
of income, it must do so through the income tax.
over the past quarter century, the nature of inequality in Canada
has changed significantly. Saez and Veall (2005) document the
extraordinary rise in income inequality at the very top of the
income distribution, with the share of total income going to the
top 1/100th of one percent quadrupling from 1975 to 2000.6
Frenette, Green, and Milligan (2007) show that, in the 1980s, the
income tax and transfer system was able to “undo” most of the
increase in market inequality. However, in the 1990s, this was no
6 IntheUnitedStatesoverthesametimeperiod,VeallandSaezshowthattheincomeshareofthetop1/100th of one percent wentupbyafactorof6.
longer true and increases in market inequality led to increases
in overall inequality. In a follow-up paper, Frenette, Green, and
Milligan (2008) show that a large share of the changes in the
progressivity of the tax system were generated at the provincial
level, meaning that provinces can have a large impact on the
overall progressivity of the income tax system.
Federal structure
I next describe the structure of the federal income tax.7 I use
year 2008 as the basis or the discussion, since the 2009 tax
system could still be changed before it is finalized.
The federal personal income tax starts by assembling the
components of total income (line 150). Earned income,
interest income, self-employment income, rental income, and
employment insurance benefits, among other items, are added
together. Special treatment is accorded to several items. For
capital gains, only 50% is included and only upon realization.
Dividend income is subject to “gross up and credit” treatment,
which first multiplies the amount of dividends received by
45%, and then later is eligible for a special credit. Since 2006,
scholarship income has been excluded from total income.
Also of note, lottery and gambling winnings are not included,
in contrast to the United States. It is important to remember
that these decisions, while made by the federal government, are
binding on provinces signed to Tax Collection Agreements as
they must accept the federally-designated definition of income.
once total income is obtained, several items are subtracted
from total income in order to arrive at net income (line 236).
These items include familiar amounts such as contributions to
registered Pension Plans and registered retirement Savings
Plans, childcare expenses, and moving expenses. The Net Income
amount is important to provinces and to the federal government
because it is used to assess eligibility for many refundable tax
credits such as the GST tax credit, the National Child Benefit
Supplement, and the provincial National Child Benefit programs.
To arrive at taxable income (line 260) a few less common items
are subtracted from net income.
7 Thissectioncouldbereadinconjunctionwiththeactualtaxforms,availableathttp://www.cra-arc.gc.ca/formspubs/t1gnrl/menu-eng.html.
11
Taxable income is then used to calculate the net federal tax by
applying the tax brackets and rates. For 2008, there are four
federal tax brackets:
15% for taxable income less than or equal to $37,885
22% for taxable income between $37,885 and $75,769
26% for taxable income between $75,769 and $123,184
29% for taxable income in excess of $123,184.
The result of this calculation is called the Net Federal Tax.
The next step involves taking account of the personal
circumstances and expenditures of the individual. This is
accomplished through a set of non-refundable tax credits.
These tax credits range from a basic personal amount of $9,600
to tuition expenses and adoption expenses. The total amount of
these credits is then multiplied by 15% to arrive at the amount
to be credited against net federal tax to yield the total payable.
So, the $9,600 basic personal amount actually decreases the
tax liability by only 15%*$9,600=$1,440. If the total of the credits
is greater than the net federal tax, then the difference is not
refunded. This is why these credits are called non-refundable
tax credits.
There are three reasons why some types of expenditures might
attract special treatment in the tax system. First, the expenditure
might not be something that brings gratification, but instead
just maintains the status quo. Health expenses might fit in this
category, since someone who spends thousands a year on
medical treatments is likely worse off than someone of equal
income who does not need to spend on health. The second
type of expenditure includes expense incurred to earn income.
For example, education expenses represent an investment that
will pay off in the future. Childcare expenses can be thought
of similarly, as they allow the parent to earn income. Finally,
society might want to encourage certain types of behaviour by
subsidizing the price through the tax system.
In 2006 and 2007, there were several additional non-refundable
tax credits added in the first two budgets of the Conservative
government. These included a children’s fitness tax credit, an
expanded education credit nominally attached to textbook
expenses, an employment amount for earned income, a children
credit, and a public transit tax credit. These new initiatives do
not have any direct impact on provincial income tax receipts
because they are credits against net federal tax; under the tax on
income system only taxable income has in impact on provincial
tax receipts. Provinces are able to adopt these new credits, but
for the most part they have not.8 Moreover, provinces have
some freedom under the Tax Collection Agreements to design
their own credits, but again, for the most part they have not.9 As
time progresses there may be more adoption of federal credits
or innovation by provinces, but this has not been a dominant
feature of the tax on income era since 2000.
Manitoba
The personal income tax in Manitoba is quite straightforward,
although the rates are among the highest of any province. The
brackets and rates for 2008 are the following:
10.9% on taxable income up to and including $30,544
12.75% on taxable income between $30,544 and $66,000
17.4% on taxable income over $66,000
These brackets are not automatically indexed. The 2007
Manitoba budget set a path for the middle tax rate and bracket
to reach 10.5% and $70,000 by 2011. Manitoba has adopted a
version of the federal children’s fitness tax credit for up to $500
of expenses.
Saskatchewan
There are three tax brackets in Saskatchewan. Compared to
Manitoba above, the rate is lower at the top and the thresholds
are also much higher:
11% on taxable income up to $39,135
8 OnlyNovaScotiaandManitobaamongtheprovincesadoptedachildren’sfitnesstaxcredit.TheYukonofferscreditsthatmirrordirectlythefederalones,sotheyhavealltheaforementionedcreditsavailable.
9 OneexampleofauniquetaxcreditisinPrinceEdwardIsland,whereupto$500ofschoolsuppliesboughtbyteachersiseligibleforacredit.
Time for a Tune Up: Personal Income Taxation in Western Canada
12
13% on taxable income between $39,135 and $111,814
15% on taxable income over $111,814.
The brackets and credit amounts are updated annually for
inflation. Saskatchewan has some unique non-refundable
credits. First, there is an amount for dependent children, $4,795
in 2008. Second, there is a supplement for seniors of $1,118.
Both of these were instituted in 2001 when Saskatchewan
switched from tax on tax to tax on income. Saskatchewan has
not adopted the new federal credits introduced in 2006-07.
Alberta
There are two strongly distinctive features of the Alberta
personal income tax. First, there is only one tax bracket with a
rate of 10%. Second, the basic personal amount and the spousal
amount, both at $16,161, are much higher than the federal
amount or the amounts in other provinces. The 10% rate is
lower for high income earners compared to other provinces, but
is higher than the rate facing lower income individuals in many
other provinces. However, this is partially mitigated by the large
basic personal amount. The credit amounts in Alberta have
been adjusted annually for inflation. Alberta has not adopted
any of the new federal credits.
Another factor that has differed in Alberta is the presence of
a health premium that applied to all individuals. This health
premium was substantial, amounting to over $1,000 annually for
a family—although relief for lower income families was available.
This premium was collected provincially and not by the Canada
revenue Agency through the Tax Collection Agreement system.
only ontario and British Columbia have similar premiums.
Although nominally a premium for health insurance, the revenue
was collected into general revenues and not earmarked for
health. As of 2006, seniors no longer had to pay. As of 2009, the
entire health premium is scheduled to disappear.
British Columbia
There are five tax brackets in British Columbia, featuring the
lowest rates at the bottom of any province. The brackets and
rates for 2008 are:
5.06% for taxable income up to and including $35,016
7.7% for taxable income from $35,016 to $70,033
10.5% for taxable income from $70,033 to $80,406
12.29% for taxable income from $80,406 to $97,636
14.7% for taxable income over $95,909
Brackets and credits in BC are adjusted annually for inflation.
With the introduction of a carbon tax as of July 1, 2008, there is a
scheduled decrease in the tax rates for the bottom two brackets
in 2009 as part of the effort to maintain revenue neutrality.
British Columbia has not adopted any of the new federal tax
credits.
British Columbia also has a substantial health premium, with
rates of $1,296 per family (with reductions for lower income
families). Again, these funds go into general provincial revenues
and are not earmarked for health.
6. Simulations
In this section, I provide some numerical simulations to explore
more deeply the structure of the personal income tax in
western Canada. This analysis will provide more insight into the
differences in taxation across provinces and will be very useful
for the development of policy options later in the paper.
The simulations are performed using the Canadian Tax and
Credit Simulator, described in Milligan (2007). Using the
statistical software program Stata, the CTaCS computer
programs allow users to calculate the tax liability and refundable
credit entitlement for Canadians in any province or territory
between 1961 and 2007. The simulations presented here start
with a set of “model families.” These families differ in specific
ways that allow several interesting features of the tax system to
be brought out in interesting ways. By comparing the tax rates
faced by the model families across years and across provinces,
a complete picture of the differences in the tax systems of
different provinces can be seen.
I use two types of model families. The first is a single individual.
While the proportion of single individuals in the population is
not large, this family type is useful for the simulations because
Kevin Milligan
13
it is simple. We can more easily isolate the impact of tax rates
when there are fewer variables at play. The second model family
I employ is a married couple with two children, ages 7 and 10.
For both model families, I assume the adults are 40 years old.
The next step is to assign some different income levels to the
model families. I draw incomes from the Survey of labour and
Income Dynamics using 2005 data. This survey is a large and
nationally representative survey of Canadians focusing on
labour market variables. I select individuals between the ages
of 30 and 50 who are the major earner in their family. For these
individuals, I sum their earned income, self-employment income,
and investment income with any Canada/Quebec Pension Plan
benefits and Employment Insurance benefits to form a measure
of total income analogous to line 150 of the income tax form. I
then take percentiles of this variable from the sample to define
the income levels I assign to the model families. After some
experimentation, I found that the 25th, the 50th, and the 99th
percentiles gave the most complete description of the tax
system.10 For the married family, I assign the income only to
one of the spouses and put the other spousal income at zero.
While this is not the most typical case in Canadian society,
it allows a comparison of the taxation of singles vs. married
couples holding income constant. The income levels are then
adjusted for inflation for each year between 1981 and 2007.
Finally, an observation for each year, family type, and income
level is created for each of the four western provinces.
This income and other information are taken as input for the
CTaCS calculator. For simplicity of comparison, the income levels
are assumed to be earned income. Given an income amount, a
marital status, the number of children, the year, and the province,
CTaCS calculates the income tax owing and the refundable tax
credits to which the family would be entitled. The basic amount,
spousal amount, earned income adjustments, and children
amounts are all accounted for. other tax preferences such as
for pension contributions, rrSP contributions, or childcare
expenses are assumed to be zero for simplicity.
The output of the calculator is a detailed set of tax liabilities and
benefit entitlements. CTaCS reports the federal basic and surtax
10 The25thpercentileis$22,000,the50this$41,200,andthe99this$225,100.
liabilities, Canada/Quebec Pension Plan contributions, (Un)
Employment Insurance premiums, provincial basic income taxes
and surtaxes, and provincial health premiums. For refundable
tax credits, CTaCS reports the amounts of GST credit, Canada
Child Tax Benefit, National Child Benefit Supplement, as well as
specific refundable tax credits for each province.
Using this output, two types of tax rates are constructed as the
object of the analysis. The first is the average tax rate, calculated
as the total tax liability divided by the pre-tax income. The
second is the marginal tax rate, calculated as the extra tax that
would be incurred for a marginal increase in income. Both of
these tax rates are calculated in two ways. First, I use just the
income tax liabilities to construct a basic average and marginal
tax rates. Second, I account for the refundable tax credits in a
more sophisticated calculation for each of the tax rates. The
refundable tax credits decrease the average tax rate because
the tax credits may offset some or all of the income tax liability.
For the marginal tax rate, the incorporation of refundable tax
credits has a major impact because an extra dollar earned
leads to a (sometimes substantial) decrease in the benefit
entitlement, as the benefits are income-tested through a
claw-back mechanism. This means, effectively, that a marginal
dollar of income can face a very steep marginal tax rate as the
marginal dollar both attracts a higher tax liability and lowers
benefit entitlements.
The different tax rates have sharply different implications. If
one is concerned about the incentive to work more hours or
to invest more dollars, then the marginal tax rates are the most
important since those actions will be taxed at the marginal rate.
on the other hand, if one is considering moving jurisdictions or
cares about the overall welfare of people at different income
percentiles, then the average tax rate is the right rate to look at
since it speaks to the overall effect of tax on each dollar earned
from the first to the last. of course, in order to have a higher
average tax rate it is necessary to have a high marginal tax rate
over some sustained range of income, so there is a fundamental
relationship between the two. However, it is important to think
carefully about the implications of each.
The results below go through two sets of graphs. For each
figure, I show four panels corresponding to the four western
provinces. The first set of results looks at the development of
Time for a Tune Up: Personal Income Taxation in Western Canada
14
marginal and average tax rates through time, using years from
1981 to 2007. Marginal and average tax rates are shown for a
single individual and a married family with two children. I also
show the results for the three different income groups (25th,
50th, and 99th percentiles). The second set of results takes the
2007 year and explores marginal and average tax rates across
all income levels. Again, a single individual and a married family
with two children are considered.
Time series simulation results
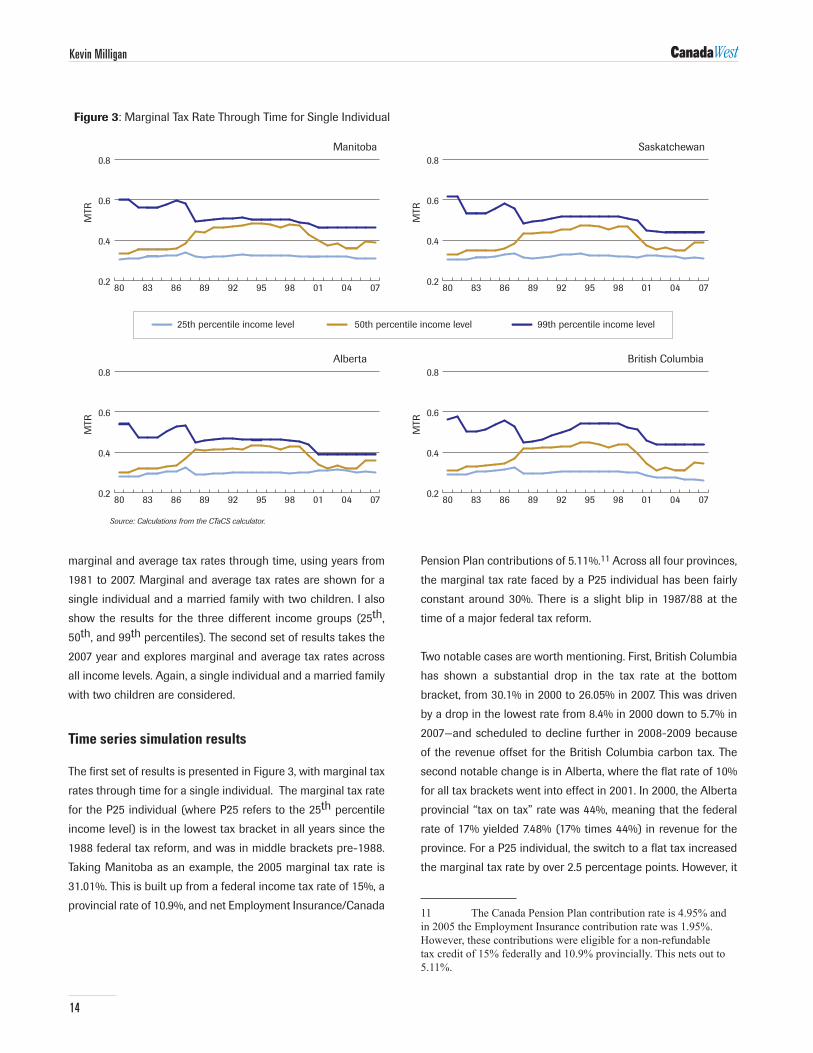
The first set of results is presented in Figure 3, with marginal tax
rates through time for a single individual. The marginal tax rate
for the P25 individual (where P25 refers to the 25th percentile
income level) is in the lowest tax bracket in all years since the
1988 federal tax reform, and was in middle brackets pre-1988.
Taking Manitoba as an example, the 2005 marginal tax rate is
31.01%. This is built up from a federal income tax rate of 15%, a
provincial rate of 10.9%, and net Employment Insurance/Canada
Pension Plan contributions of 5.11%.11 Across all four provinces,
the marginal tax rate faced by a P25 individual has been fairly
constant around 30%. There is a slight blip in 1987/88 at the
time of a major federal tax reform.
Two notable cases are worth mentioning. First, British Columbia
has shown a substantial drop in the tax rate at the bottom
bracket, from 30.1% in 2000 to 26.05% in 2007. This was driven
by a drop in the lowest rate from 8.4% in 2000 down to 5.7% in
2007—and scheduled to decline further in 2008-2009 because
of the revenue offset for the British Columbia carbon tax. The
second notable change is in Alberta, where the flat rate of 10%
for all tax brackets went into effect in 2001. In 2000, the Alberta
provincial “tax on tax” rate was 44%, meaning that the federal
rate of 17% yielded 7.48% (17% times 44%) in revenue for the
province. For a P25 individual, the switch to a flat tax increased
the marginal tax rate by over 2.5 percentage points. However, it
11 TheCanadaPensionPlancontributionrateis4.95%andin2005theEmploymentInsurancecontributionratewas1.95%.However,thesecontributionswereeligibleforanon-refundabletaxcreditof15%federallyand10.9%provincially.Thisnetsoutto5.11%.
Kevin Milligan
0
5
10
15
20
25%
British Columbia
Alberta Saskatchewan
Manitoba
Ontario
0705030199979593918987858381
Figure 3: Marginal Tax Rate Through Time for Single Individual
Source: Statistics CANSIM database.
0.2
0.4
0.6
0.8
07040198959289868380
Manitoba
MTR
0.2
0.4
0.6
0.8
07040198959289868380
Saskatchewan
MTR
0.2
0.4
0.6
0.8
07040198959289868380
Alberta
MTR
0.2
0.4
0.6
0.8
07040198959289868380
British Columbia
MTR
Source: Calculations from the CTaCS calculator.
25th percentile income level 50th percentile income level 99th percentile income level
15
is important to note that the larger basic personal amount that
was introduced at the same time meant that the impact on the
average tax rate was more moderate—this can be checked in a
later graph of average tax rates.
For middle income earners at P50, the swings have been
dramatic. Marginal tax rates rose substantially in the federal tax
reform of 1988, with a change of about 5 percentage points in
the four western provinces driven by the change in the federal
system. Whereas previously this P50 individual was in a 23%
tax bracket, the reform shifted the P50 person to a 26% federal
bracket. This was then amplified by the provincial tax on tax
to arrive at the large increase visible in Figure 3. In Manitoba,
Saskatchewan, and Alberta, the marginal tax rate for the P50
individual was only slightly less than for a P99 individual—only
British Columbia has a substantially higher rate for P99. This
resulted from the fact that there was only a 3 percentage point
gap between the middle and highest tax brackets through the
1990s (26% vs. 29%) and that middle earners faced payroll taxes
for Canada Pension and Unemployment Insurance while high
earners did not, since high earners were above the contribution
threshold for the payroll taxes. The final swing was downward,
in 2001. This resulted both from the federal income tax bracket
faced by these individuals falling from 26% to 22% and also
from the switch to tax on income in the provinces, which also
saw lower taxes arise in some provinces.
The marginal tax rates faced by high income earners at the 99th
percentile (P99) have moved on a mostly downward trajectory.
There was a slight upswing in the mid-1980s as the federal
government instituted high-income surtaxes. The 1988 federal
tax reform saw a drop in the top marginal rate from 34% down to
29%, and this is clearly visible in the graphs. For the three prairie
provinces, the top rate was fairly flat through the 1990s, finally
falling in 1999-2001 as the federal surtaxes were removed. The
outlier here was British Columbia, which increased marginal tax
rates on high earners in the 1990s through high-income surtaxes
which started in 1991 and continually increased until 1998.
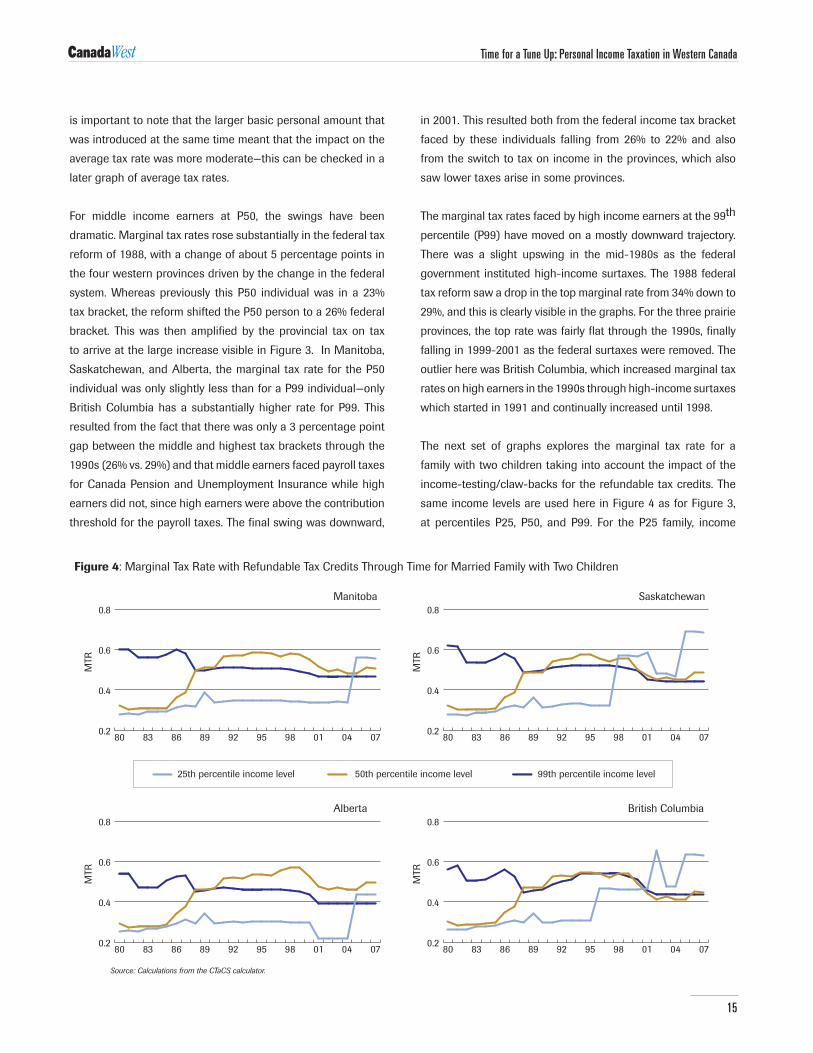
The next set of graphs explores the marginal tax rate for a
family with two children taking into account the impact of the
income-testing/claw-backs for the refundable tax credits. The
same income levels are used here in Figure 4 as for Figure 3,
at percentiles P25, P50, and P99. For the P25 family, income
Time for a Tune Up: Personal Income Taxation in Western Canada
0
5
10
15
20
25%
British Columbia
Alberta Saskatchewan
Manitoba
Ontario
0705030199979593918987858381
Figure 4: Marginal Tax Rate with Refundable Tax Credits Through Time for Married Family with Two Children
Source: Statistics CANSIM database.
0.2
0.4
0.6
0.8
07040198959289868380
Manitoba
MTR
0.2
0.4
0.6
0.8
07040198959289868380
Saskatchewan
MTR
0.2
0.4
0.6
0.8
07040198959289868380
Alberta
MTR
0.2
0.4
0.6
0.8
07040198959289868380
British Columbia
MTR
Source: Calculations from the CTaCS calculator.
25th percentile income level 50th percentile income level 99th percentile income level
16
was below the income range used to claw-back refundable tax
credits through the first part of this time period, so the marginal
tax rates look similar to those in Figure 3. However, as provincial
refundable child tax credits expanded in 1996 in British
Columbia and Saskatchewan and later in Manitoba and Alberta,
P25 families started to face very high marginal tax rates—even
exceeding those faced by P99 families in some cases.
From the late 1980s onward, the P50 families in all provinces
showed elevated marginal tax rates, equal or even higher
than for P99 families. This results from the introduction of the
income-tested child benefits at the federal level in the late
1980s, and consolidated into the Canada Child Tax Benefit in
the 1990s. Families in the P50 income range were in the middle
of the claw-back income range and so suffered from very high
marginal tax rates. This is important because marginal tax
rates have been shown to have an impact on the labour market
behaviour of individuals. These higher marginal tax rates facing
middle income families should therefore be noted.
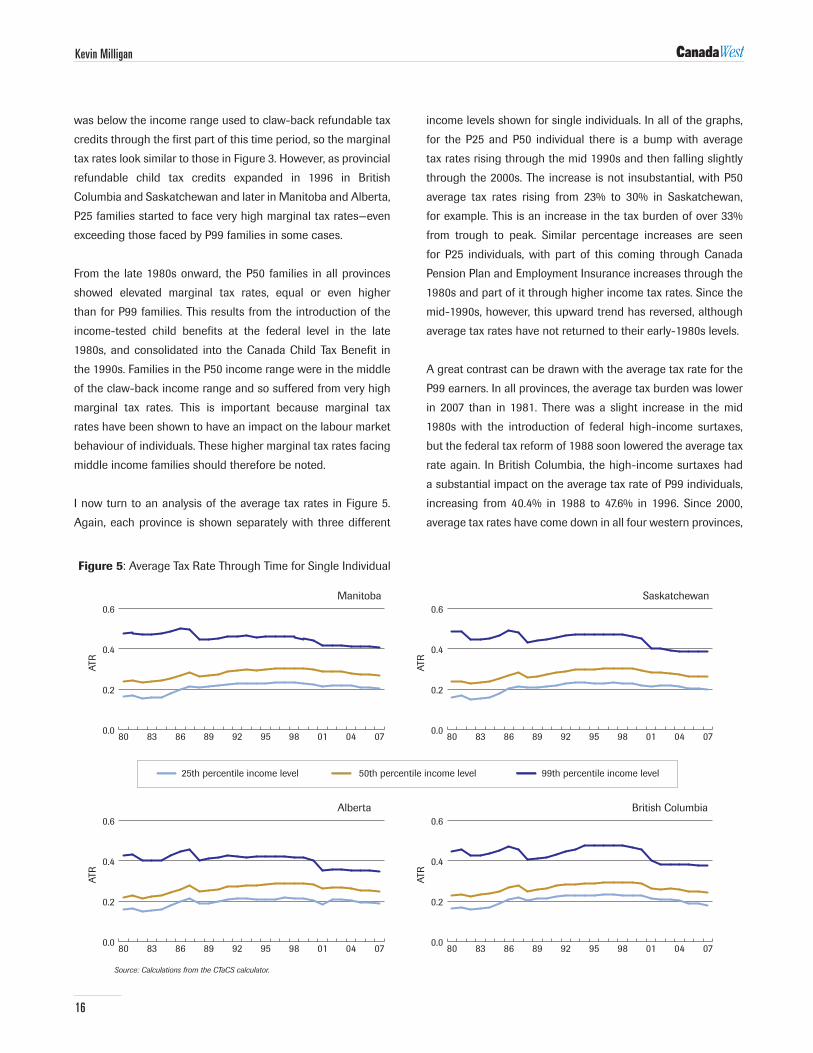
I now turn to an analysis of the average tax rates in Figure 5.
Again, each province is shown separately with three different
income levels shown for single individuals. In all of the graphs,
for the P25 and P50 individual there is a bump with average
tax rates rising through the mid 1990s and then falling slightly
through the 2000s. The increase is not insubstantial, with P50
average tax rates rising from 23% to 30% in Saskatchewan,
for example. This is an increase in the tax burden of over 33%
from trough to peak. Similar percentage increases are seen
for P25 individuals, with part of this coming through Canada
Pension Plan and Employment Insurance increases through the
1980s and part of it through higher income tax rates. Since the
mid-1990s, however, this upward trend has reversed, although
average tax rates have not returned to their early-1980s levels.
A great contrast can be drawn with the average tax rate for the
P99 earners. In all provinces, the average tax burden was lower
in 2007 than in 1981. There was a slight increase in the mid
1980s with the introduction of federal high-income surtaxes,
but the federal tax reform of 1988 soon lowered the average tax
rate again. In British Columbia, the high-income surtaxes had
a substantial impact on the average tax rate of P99 individuals,
increasing from 40.4% in 1988 to 47.6% in 1996. Since 2000,
average tax rates have come down in all four western provinces,
Kevin Milligan
0
5
10
15
20
25%
British Columbia
Alberta Saskatchewan
Manitoba
Ontario
0705030199979593918987858381
Figure 5: Average Tax Rate Through Time for Single Individual
Source: Statistics CANSIM database.
0.0
0.2
0.4
0.6
07040198959289868380
Manitoba
ATR
0.0
0.2
0.4
0.6
07040198959289868380
Saskatchewan
ATR
0.0
0.2
0.4
0.6
07040198959289868380
Alberta
ATR
0.0
0.2
0.4
0.6
07040198959289868380
British Columbia
ATR
Source: Calculations from the CTaCS calculator.
25th percentile income level 50th percentile income level 99th percentile income level
17
with the largest drop in British Columbia and only a slight drop
in Manitoba.
The final graph looking at the time series patterns across
provinces shows the average tax rate faced by the married
family with two children. Figure 6 graphs these lines for the
four provinces and the three income levels. The P99 lines are
almost unchanged from Figure 5, although the change in the
scale obscures this. P99 families do not receive any of the
income-tested refundable tax credits, so their average tax rate
is little different than for a single individual. For P50 families, the
same up-then-down pattern can be seen, although again it is
somewhat obscured by the scale. The average tax rates for P50
in Figure 6 are lower than in Figure 5 by around 10 percentage
points because these families receive large refundable tax
credits which lower their net tax liability.
The most remarkable feature of Figure 6 is the very sharp drop
of the average tax rate for P25 families. Not only does it drop,
but it drops sharply into negative territory. A negative average
tax rate simply means that the refundable tax credits exceed
the income tax liability. The expansions of the Canada Child
Tax Benefit and the introduction of the National Child Benefit
program since the late 1990s are responsible for these trends.
To conclude this analysis of the time series data, three major
findings have emerged. First, high earners have seen continually
lower marginal tax rates and overall tax burdens over the past
25 years (with the exception of British Columbia in the 1990s).
Second, middle income families saw a very substantial increase
in both their marginal tax rates and tax burdens from the late
1980s to the late 1990s. There has been some modest recovery
since then, but tax burdens for middle income families remain
historically high. Finally, modest income families have seen little
change in their statutory personal income tax rates. However,
the great expansion and proliferation of refundable child tax
credits through the 1990s and 2000s has led these families to
face very high marginal tax rates. on the other hand, these same
refundable tax credits have led to a truly remarkable decrease
in the net tax burden faced by these families, with most of them
receiving much more from the system in child benefits than
they pay in income taxes.
Time for a Tune Up: Personal Income Taxation in Western Canada
0
5
10
15
20
25%
British Columbia
Alberta Saskatchewan
Manitoba
Ontario
0705030199979593918987858381
Figure 6: Average Tax Rate with Refundable Tax Credits Through Time for Married Family with Two Children
Source: Statistics CANSIM database.
-0.3
0.0
0.3
0.6
07040198959289868380
Manitoba
ATR
-0.3
0.0
0.3
0.6
07040198959289868380
Saskatchewan
ATR
-0.3
0.0
0.3
0.6
07040198959289868380
Alberta
ATR
-0.3
0.0
0.3
0.6
07040198959289868380
British Columbia
ATR
Source: Calculations from the CTaCS calculator.
25th percentile income level 50th percentile income level 99th percentile income level
18
Kevin Milligan
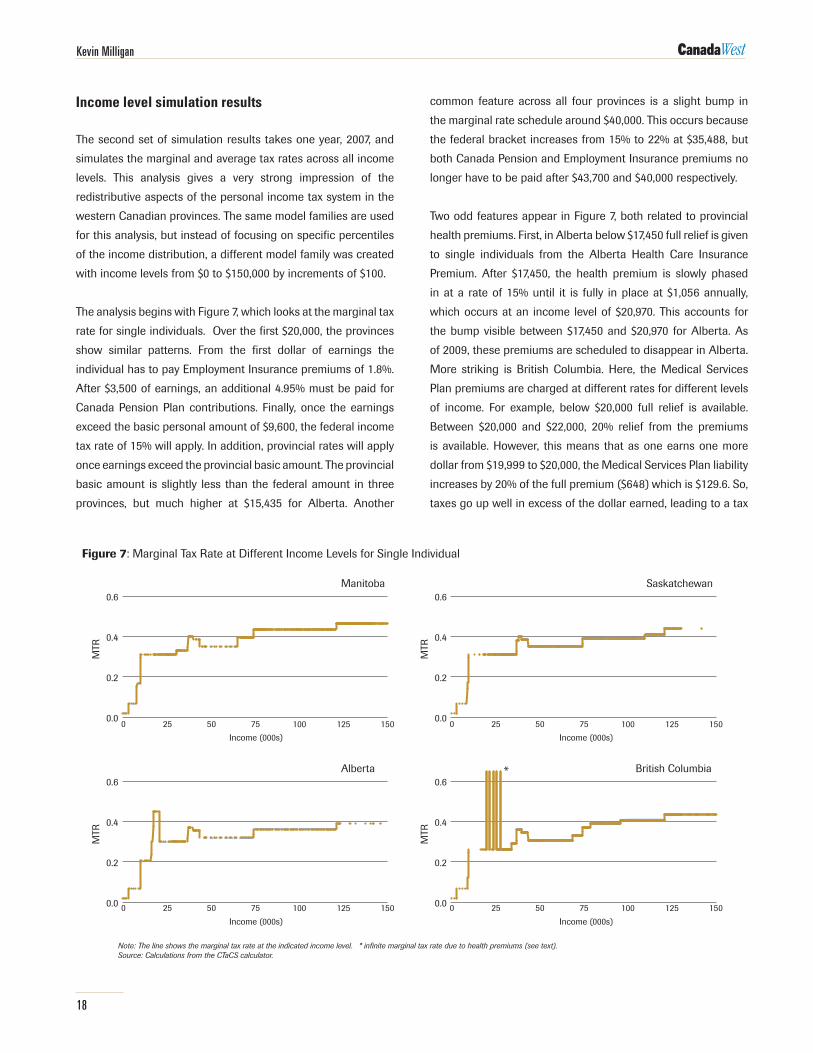
Income level simulation results
The second set of simulation results takes one year, 2007, and
simulates the marginal and average tax rates across all income
levels. This analysis gives a very strong impression of the
redistributive aspects of the personal income tax system in the
western Canadian provinces. The same model families are used
for this analysis, but instead of focusing on specific percentiles
of the income distribution, a different model family was created
with income levels from $0 to $150,000 by increments of $100.
The analysis begins with Figure 7, which looks at the marginal tax
rate for single individuals. over the first $20,000, the provinces
show similar patterns. From the first dollar of earnings the
individual has to pay Employment Insurance premiums of 1.8%.
After $3,500 of earnings, an additional 4.95% must be paid for
Canada Pension Plan contributions. Finally, once the earnings
exceed the basic personal amount of $9,600, the federal income
tax rate of 15% will apply. In addition, provincial rates will apply
once earnings exceed the provincial basic amount. The provincial
basic amount is slightly less than the federal amount in three
provinces, but much higher at $15,435 for Alberta. Another
common feature across all four provinces is a slight bump in
the marginal rate schedule around $40,000. This occurs because
the federal bracket increases from 15% to 22% at $35,488, but
both Canada Pension and Employment Insurance premiums no
longer have to be paid after $43,700 and $40,000 respectively.
Two odd features appear in Figure 7, both related to provincial
health premiums. First, in Alberta below $17,450 full relief is given
to single individuals from the Alberta Health Care Insurance
Premium. After $17,450, the health premium is slowly phased
in at a rate of 15% until it is fully in place at $1,056 annually,
which occurs at an income level of $20,970. This accounts for
the bump visible between $17,450 and $20,970 for Alberta. As
of 2009, these premiums are scheduled to disappear in Alberta.
More striking is British Columbia. Here, the Medical Services
Plan premiums are charged at different rates for different levels
of income. For example, below $20,000 full relief is available.
Between $20,000 and $22,000, 20% relief from the premiums
is available. However, this means that as one earns one more
dollar from $19,999 to $20,000, the Medical Services Plan liability
increases by 20% of the full premium ($648) which is $129.6. So,
taxes go up well in excess of the dollar earned, leading to a tax
0
5
10
15
20
25%
British Columbia
Alberta Saskatchewan
Manitoba
Ontario
0705030199979593918987858381
Figure 7: Marginal Tax Rate at Different Income Levels for Single Individual
Source: Statistics CANSIM database.
0.0
0.2
0.4
0.6Manitoba
MTR
0.0
0.2
0.4
0.6Saskatchewan
MTR
0.0
0.2
0.4
0.6Alberta
MTR
0.0
0.2
0.4
0.6British Columbia
MTR
Note: The line shows the marginal tax rate at the indicated income level. * infinite marginal tax rate due to health premiums (see text).Source: Calculations from the CTaCS calculator.
*
0 25 50 75 100 125 150
0 25 50 75 100 125 150
0 25 50 75 100 125 150
0 25 50 75 100 125 150
Income (000s)
Income (000s)
Income (000s)
Income (000s)
19
rate greater than 100%.12 There are five of these thresholds
between $20,000 and $28,000, accounting for the five large
spikes in the graph.
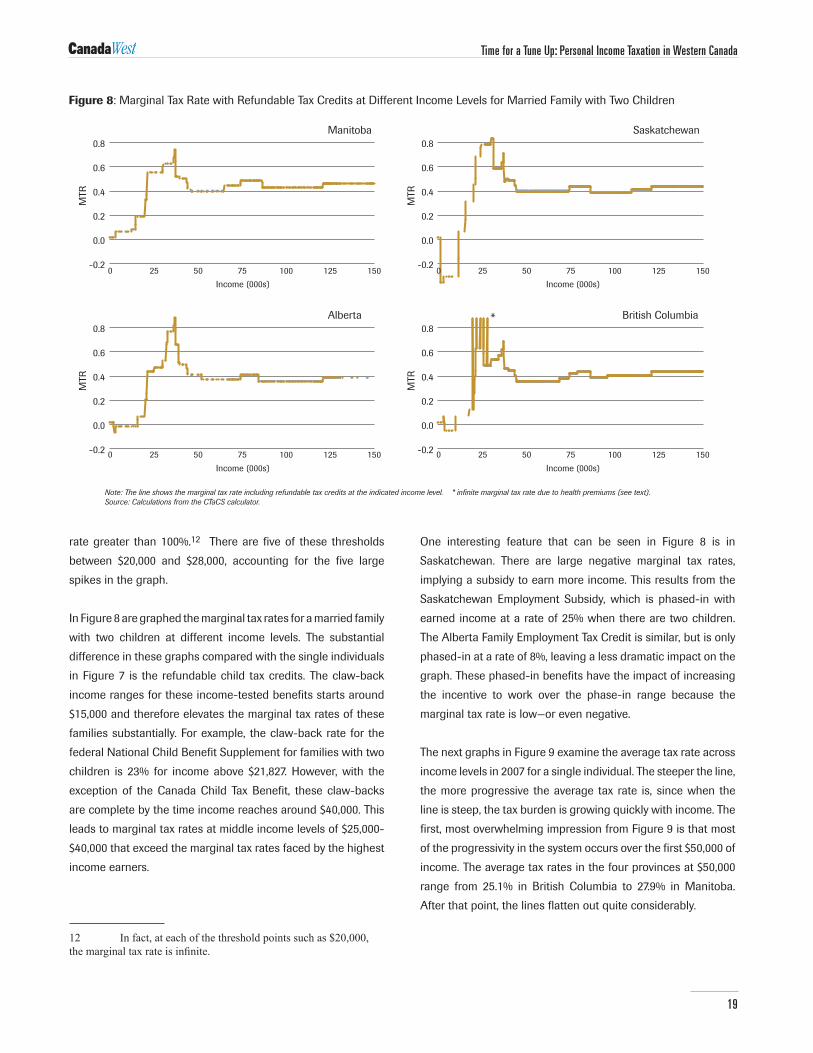
In Figure 8 are graphed the marginal tax rates for a married family
with two children at different income levels. The substantial
difference in these graphs compared with the single individuals
in Figure 7 is the refundable child tax credits. The claw-back
income ranges for these income-tested benefits starts around
$15,000 and therefore elevates the marginal tax rates of these
families substantially. For example, the claw-back rate for the
federal National Child Benefit Supplement for families with two
children is 23% for income above $21,827. However, with the
exception of the Canada Child Tax Benefit, these claw-backs
are complete by the time income reaches around $40,000. This
leads to marginal tax rates at middle income levels of $25,000-
$40,000 that exceed the marginal tax rates faced by the highest
income earners.
12 Infact,ateachofthethresholdpointssuchas$20,000,themarginaltaxrateisinfinite.
one interesting feature that can be seen in Figure 8 is in
Saskatchewan. There are large negative marginal tax rates,
implying a subsidy to earn more income. This results from the
Saskatchewan Employment Subsidy, which is phased-in with
earned income at a rate of 25% when there are two children.
The Alberta Family Employment Tax Credit is similar, but is only
phased-in at a rate of 8%, leaving a less dramatic impact on the
graph. These phased-in benefits have the impact of increasing
the incentive to work over the phase-in range because the
marginal tax rate is low—or even negative.
The next graphs in Figure 9 examine the average tax rate across
income levels in 2007 for a single individual. The steeper the line,
the more progressive the average tax rate is, since when the
line is steep, the tax burden is growing quickly with income. The
first, most overwhelming impression from Figure 9 is that most
of the progressivity in the system occurs over the first $50,000 of
income. The average tax rates in the four provinces at $50,000
range from 25.1% in British Columbia to 27.9% in Manitoba.
After that point, the lines flatten out quite considerably.
Time for a Tune Up: Personal Income Taxation in Western Canada
0
5
10
15
20
25%
British Columbia
Alberta Saskatchewan
Manitoba
Ontario
0705030199979593918987858381
Figure 8: Marginal Tax Rate with Refundable Tax Credits at Different Income Levels for Married Family with Two Children
Source: Statistics CANSIM database.
-0.2
0.0
0.2
0.4
0.6
0.8Manitoba
MTR
-0.2
0.0
0.2
0.4
0.6
0.8Saskatchewan
MTR
-0.2
0.0
0.2
0.4
0.6
0.8Alberta
MTR
-0.2
0.0
0.2
0.4
0.6
0.8British Columbia
MTR
Note: The line shows the marginal tax rate including refundable tax credits at the indicated income level. * infinite marginal tax rate due to health premiums (see text).Source: Calculations from the CTaCS calculator.
*
0 25 50 75 100 125 150
0 25 50 75 100 125 150
0 25 50 75 100 125 150
0 25 50 75 100 125 150
Income (000s)
Income (000s)
Income (000s)
Income (000s)
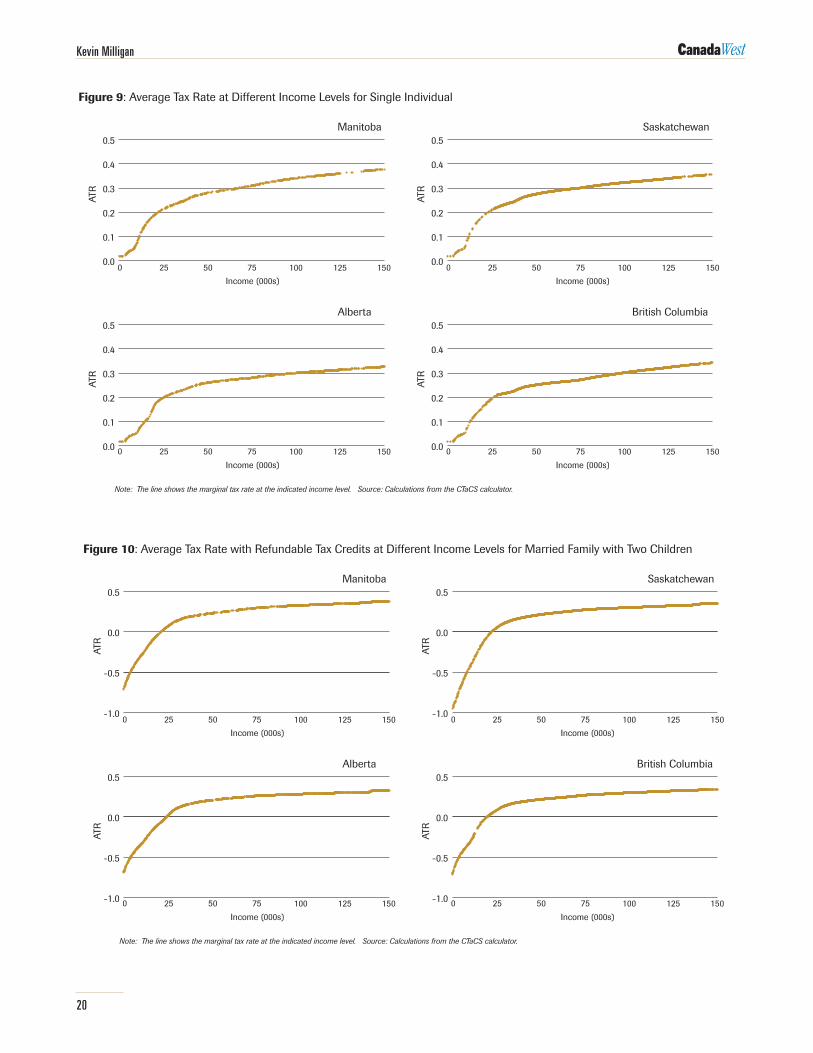
20
Kevin Milligan
0
5
10
15
20
25%
British Columbia
Alberta Saskatchewan
Manitoba
Ontario
0705030199979593918987858381
Figure 9: Average Tax Rate at Different Income Levels for Single Individual
Source: Statistics CANSIM database.
0.0
0.1
0.2
0.3
0.4
0.5Manitoba
ATR
0.0
0.1
0.2
0.3
0.4
0.5Saskatchewan
ATR
0.0
0.1
0.2
0.3
0.4
0.5Alberta
ATR
0.0
0.1
0.2
0.3
0.4
0.5British Columbia
ATR
Note: The line shows the marginal tax rate at the indicated income level. Source: Calculations from the CTaCS calculator.
0 25 50 75 100 125 150
0 25 50 75 100 125 150
0 25 50 75 100 125 150
0 25 50 75 100 125 150
Income (000s)
Income (000s)
Income (000s)
Income (000s)
0
5
10
15
20
25%
British Columbia
Alberta Saskatchewan
Manitoba
Ontario
0705030199979593918987858381
Figure 10: Average Tax Rate with Refundable Tax Credits at Different Income Levels for Married Family with Two Children
Source: Statistics CANSIM database.
-1.0
-0.5
0.0
0.5Manitoba
ATR
-1.0
-0.5
0.0
0.5Saskatchewan
ATR
-1.0
-0.5
0.0
0.5Alberta
ATR
-1.0
-0.5
0.0
0.5British Columbia
ATR
Note: The line shows the marginal tax rate at the indicated income level. Source: Calculations from the CTaCS calculator.
0 25 50 75 100 125 150
0 25 50 75 100 125 150
0 25 50 75 100 125 150
0 25 50 75 100 125 150
Income (000s)
Income (000s)
Income (000s)
Income (000s)
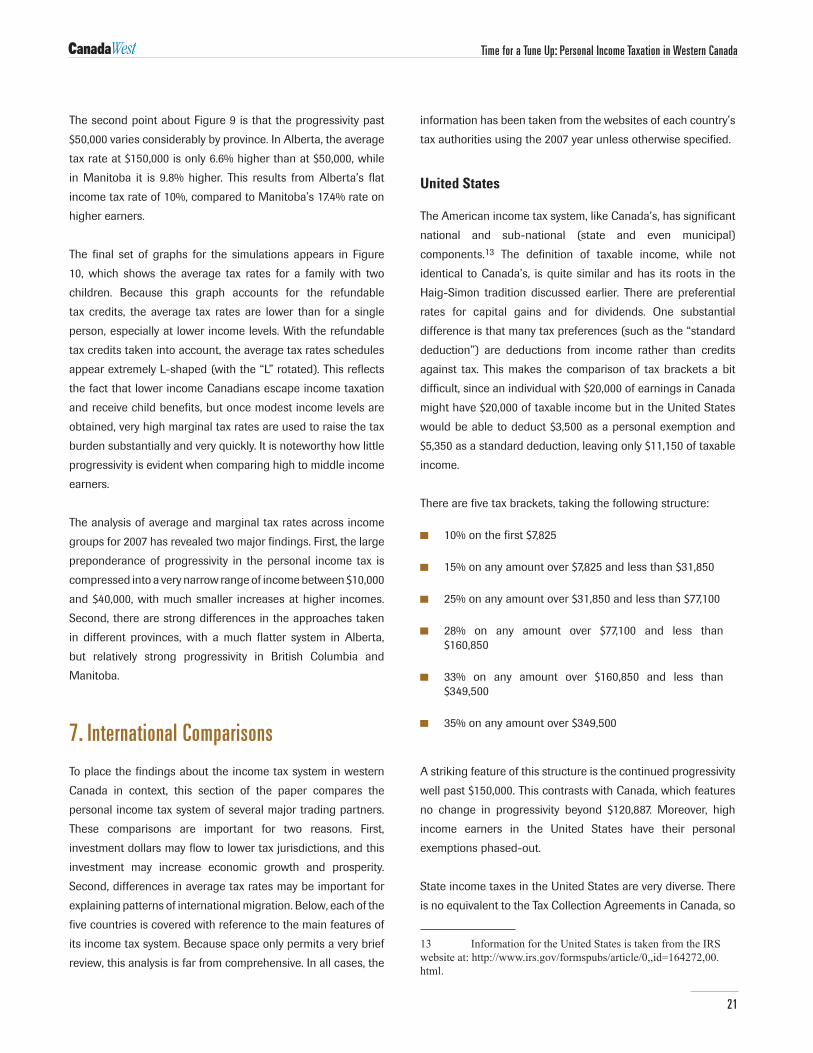
21
The second point about Figure 9 is that the progressivity past
$50,000 varies considerably by province. In Alberta, the average
tax rate at $150,000 is only 6.6% higher than at $50,000, while
in Manitoba it is 9.8% higher. This results from Alberta’s flat
income tax rate of 10%, compared to Manitoba’s 17.4% rate on
higher earners.
The final set of graphs for the simulations appears in Figure
10, which shows the average tax rates for a family with two
children. Because this graph accounts for the refundable
tax credits, the average tax rates are lower than for a single
person, especially at lower income levels. With the refundable
tax credits taken into account, the average tax rates schedules
appear extremely l-shaped (with the “l” rotated). This reflects
the fact that lower income Canadians escape income taxation
and receive child benefits, but once modest income levels are
obtained, very high marginal tax rates are used to raise the tax
burden substantially and very quickly. It is noteworthy how little
progressivity is evident when comparing high to middle income
earners.
The analysis of average and marginal tax rates across income
groups for 2007 has revealed two major findings. First, the large
preponderance of progressivity in the personal income tax is
compressed into a very narrow range of income between $10,000
and $40,000, with much smaller increases at higher incomes.
Second, there are strong differences in the approaches taken
in different provinces, with a much flatter system in Alberta,
but relatively strong progressivity in British Columbia and
Manitoba.
7. International Comparisons
To place the findings about the income tax system in western
Canada in context, this section of the paper compares the
personal income tax system of several major trading partners.
These comparisons are important for two reasons. First,
investment dollars may flow to lower tax jurisdictions, and this
investment may increase economic growth and prosperity.
Second, differences in average tax rates may be important for
explaining patterns of international migration. Below, each of the
five countries is covered with reference to the main features of
its income tax system. Because space only permits a very brief
review, this analysis is far from comprehensive. In all cases, the
information has been taken from the websites of each country’s
tax authorities using the 2007 year unless otherwise specified.
United States
The American income tax system, like Canada’s, has significant
national and sub-national (state and even municipal)
components.13 The definition of taxable income, while not
identical to Canada’s, is quite similar and has its roots in the
Haig-Simon tradition discussed earlier. There are preferential
rates for capital gains and for dividends. one substantial
difference is that many tax preferences (such as the “standard
deduction”) are deductions from income rather than credits
against tax. This makes the comparison of tax brackets a bit
difficult, since an individual with $20,000 of earnings in Canada
might have $20,000 of taxable income but in the United States
would be able to deduct $3,500 as a personal exemption and
$5,350 as a standard deduction, leaving only $11,150 of taxable
income.
There are five tax brackets, taking the following structure:
10% on the first $7,825
15% on any amount over $7,825 and less than $31,850
25% on any amount over $31,850 and less than $77,100
28% on any amount over $77,100 and less than $160,850
33% on any amount over $160,850 and less than $349,500
35% on any amount over $349,500
A striking feature of this structure is the continued progressivity
well past $150,000. This contrasts with Canada, which features
no change in progressivity beyond $120,887. Moreover, high
income earners in the United States have their personal
exemptions phased-out.
State income taxes in the United States are very diverse. There
is no equivalent to the Tax Collection Agreements in Canada, so
13 InformationfortheUnitedStatesistakenfromtheIRSwebsiteat:http://www.irs.gov/formspubs/article/0,,id=164272,00.html.
Time for a Tune Up: Personal Income Taxation in Western Canada
22
Kevin Milligan
each state designs its own tax forms and collects its own taxes.
Several states have no state income tax at all. Many others have
a flat tax rate, while the remaining states have a rate-bracket
system. The highest rate that can be found is in California, at
9.3% for incomes over $43,468. This rises to 10.3% for incomes
over $1 million.
Some municipalities, such as New York, levy an income tax. For
example, New York’s rate is 3.648%.14 Payroll taxesforSocialSecurityandMedicarearealso leviedonemployeesonearningsupto$102,000atacombinedrateof7.65%.
United Kingdom
The income tax in the United Kingdom is again quite similar
in many respects to those in Canada and the United States,
rooted in the Haig-Simon tradition.15 The tax year is from
April 1 to March 31, which is different from the calendar year
system employed in Canada and the United States. There are
preferential rates for dividend income, and, as of April 2008, a
special preferential rate on all savings income. Capital gains are
taxed at the regular rate, but there is a fairly large exemption
(£9,200 in 2007-08) before tax becomes payable.
The rate structure in 2007-08 took the following form:
10% on the first £2,230
22% on amounts higher than £2,230 and less than £34,600
40% on amounts higher than £34,600.
As of April 2008, the 10% bracket has been eliminated and the
“basic” rate has been changed from 22% to 20%. This reduces
the number of brackets in the United Kingdom down to just two.
This contrasts with Canada and the United States. Moreover,
there is no progressivity in the income tax past £34,600,
approximately $70,000 at current exchange rates. There are
also National Insurance contributions between the lower and
14 Seehttp://www.nyc.gov/html/dof/html/services/business_tax_nys_income.shtmlfordetailsontheNewYorkincometax.
15 InformationontheincometaxintheUnitedKingdomistakenfromHerMajesty’sRevenueandCustomsathttp://www.hmrc.gov.uk/rates/it.htm.
upper tax bracket thresholds in the amount of 11%, which is
substantial.16
Japan
Japan levies an income tax on a comprehensive income
base.17 There is no preference for dividend income, but only a
percentage of capital gains is included in income. The rates take
the following form:
5% on amounts up to 1,950,000 yen
10% on amounts between 1,950,000 and 3,300,000 yen
20% on amounts between 3,300,000 and 6,950,000 yen
23% on amounts between 6,950,000 yen and 9,000,000 yen
33% on amounts between 9,000,000 and 18,000,000 yen
40% on amounts over 18,000,000 yen.
The Canadian dollar is worth approximately 104 yen, meaning
that the top tax bracket starts at a level equivalent to $173,077.
Importantly, there is an additional 10% levied at all income levels
for local and prefecture taxes. The net effect of this structure
is a system with a high degree of progressivity quite far up the
income distribution. The rates at high income levels are higher
than in Canada, the United States, or the United Kingdom.
China
The Chinese income tax looks less like a Haig-Simon
comprehensive income tax and more like a “tabular” system that
charges different rates for different types of income.18 There
are special rates for interest income, capital gains, wages, and
earnings, among others. For income from salary, the first 9,600
yuan per year is exempted. (There are 6.6 Yuan per Canadian
dollar.) For any remaining income, there is a progressive structure
16 NationalInsuranceinformationisfrom:http://www.hmrc.gov.uk/rates/nic.htm.
17 InformationonJapancomesfromtheMinistryofFinance:http://www.mof.go.jp/english/tax/taxes2006e_c.pdf.
18 InformationforChinatakenfromthewebsiteoftheBeijingtaxbureau:http://english.tax861.gov.cn/zgszky/zgszky09.htm.
23
of 10 brackets with rates ranging from 5% for 6,000 yuan per
year up to 45% for amounts over 1,200,000 yuan per year. The
top bracket threshold is equivalent to $181,818 per year.
Hong Kong
Hong Kong, like China, has more of a tabular system than a
Haig-Simon comprehensive income tax.19 There are three
categories of income—profits, salaries, and property. For the
salaries tax, there is a very large personal allowance of $100,000
for a single person or $200,000 per couple, with an additional
$50,000 per child ($100,000 per newborn). one Canadian dollar
is worth 7.53 Hong Kong dollars. This means a couple with two
children would not pay tax on their first $300,000 of income
(equal to $39,841 Canadian). on the remaining income after
the personal allowances, the salaries tax is progressive, with
the following rate structure in 2007-08:
2% on first $35,000
7% on amounts from $35,000 to $70,000
12% on amounts from $70,000 to $105,000
17% on amounts over $105,000.
In 2007-08, there was a special one-time abatement of 75%
of the taxes owing up to $25,000, reflecting a budget surplus.
Compared to Canada, the United States, or the United Kingdom,
these are very low tax rates.
Summary
The income tax system in western Canada shows strong
differences from, but some similarities to, the other countries in
the comparison group selected for this section. like the United
States, the United Kingdom, and Japan, the roots of today’s
system are found in the comprehensive Haig-Simon tradition.
However, like China and Hong Kong, there is a move toward
more of a tabular system with special rates for different types
of capital income. Income tax rates in western Canada are not
strongly different from the other countries selected, with the
noticeable exception of Hong Kong which has extraordinarily
19 InformationforHongKongtakenfromInternalRevenueDepartmentfortheHongKongSpecialAdministrativeRegion:http://www.ird.gov.hk/eng/tax/ind_sal.htm.
low income tax rates. Finally, on progressivity the income tax in
western Canada appears to be more progressive than that in
the United Kingdom or Hong Kong, but perhaps less so than in
the United States or Japan.
8. Policy Discussion
The analysis and findings of the previous sections lead now
to a discussion of public policy. In this section, I introduce
three areas where the analysis suggests policy action might be
considered. I adopt a framework of revenue neutrality here; any
policy options considered should neither increase nor decrease
the total revenue from the personal income tax system. I adopt
this framework because a decision to raise or lower the overall
tax take is intimately tied to decisions about what and how
much provincial governments should spend, and that is beyond
the scope of this paper. Similarly, shifts between corporate
income taxation, consumption taxation, property taxes, or
environmental taxes might be very worthy of consideration,
but they require analysis that has not been completed here. By
sticking to a stance of revenue neutrality, focus on the structure
of the personal income taxation system can be maintained,
with a target to designing the best personal income tax system
possible in order to raise the revenue required.
This section proceeds by discussing each of the three potential
areas of PIT policy innovation, drawing on the evidence and
analysis presented earlier in the paper. Both the positives
and the negatives of policy action are considered. Decisive
recommendations are left to the next section.
Tax Collection Agreements
Currently, all provinces except for Quebec have signed Tax
Collection Agreements with the federal government. This
includes the four western provinces. As an agreeing province,
the Canada revenue Agency collects tax revenue on behalf of
the province and remits it to the provincial government. The
agreeing provinces are constrained to use the taxable income
definition set out by the federal government and there are some
further, more minor, restrictions. If a province were to pull out
of the Tax Collection Agreement, it would have to set up its own
personal income tax collection administration.
Time for a Tune Up: Personal Income Taxation in Western Canada
24
Kevin Milligan
The main advantage of pulling out of the Tax Collection
Agreement is autonomy. Currently, if the federal government
makes changes to the definition of taxable income either by
changing what is included in total income or by altering the
allowable deductions and exemptions from total income,
provincial government revenues are affected unless they
change their tax rates to adjust. With its own tax administration,
a province would not be subject to any changes made by the
federal government.
The main advantages of staying in the Tax Collection Agreement
are cost and simplicity. If a province chooses a structure similar
to the federal government for its credits, the tax administration
provided by the Canada revenue Agency is free of charge. The
simplicity advantage is more subtle. By having one set of similar
tax forms for all jurisdictions in the country, the tax system
becomes more transparent. In a perhaps small way, interprovincial
mobility of labour and capital is enhanced. The twist here is
that this benefit does not accrue only to the province that signs
a Tax Collection Agreement, but to residents of all provinces
who might benefit from the transparency and simplicity. This
provides an extra reason for the federal government to want
to enter into a Tax Collection Agreement with each province in
order to strengthen the economic union.
Tax credits
The second potential area for policy innovation is tax credits.
The current tax on income (ToNI) system allows for a lot of
flexibility in determining the non-refundable tax credits that
are recognized by a provincial government. For example, only
two provinces (Manitoba and Nova Scotia) have followed
the federal government in introducing a children’s fitness tax
credit. As another example of innovation, Prince Edward Island
now has recognition for costs for school supplies incurred by
teachers. Moreover, even if the credit is for the same category
of expense as a federal credit, provinces may choose a different
amount at which the credit can be capped. For example, the
pension income credit was expanded to $2,000 by the federal
government, a move that was only adopted by the territorial
governments of Yukon and Nunavut.
There are four options that could be considered for tax credits.
First, a province could revert to simply taking the value of federal
credits on the province’s tax form. This approach has been taken
by the Yukon. The advantage is simplicity, but the cost is the loss
of any local control over not just the distribution of who gets
credits, but also revenue changes.
A second option to innovate with credits is to replace the sundry
credits for different types of expenditures with one big basic
amount. rather than increasing compliance costs to filers and
adding to administrative complexity with the currently large
number of credits, having just one big credit enhances simplicity
by streamlining the tax system. Because the credit rate at the
provincial level is typically small, the cash value of the credits
is not large. For example, the $500 children’s fitness tax credit
if adopted in British Columbia would yield just $28.50 ($500
times the credit rate of 5.7% in 2007). This is unlikely to change
behaviour noticeably, generates compliance and administrative
costs, and further complicates the tax system.
A third approach is the opposite of the above—add new credits
in strategically important areas of social concern or targeting
groups in special need of assistance. The advantage comes from
being able to use the powerful information collected by the tax
system to target programs more accurately. The disadvantage is
the increasing complexity and the possibility that the tax system
becomes a source of political payoffs to vocal or politically
important interest groups.
Finally, the credits could be adjusted annually for inflation.
Currently, some provinces do this while others do not. Without
an annual adjustment for inflation, pay increases that keep real
purchasing power constant will be taxed more heavily because
the credits do not keep pace with generally rising prices. The
disadvantage here is a budgetary cost of foregone implicit tax
increases generated by inflation.
Tax rates
The final potential area for innovation in the provincial PIT system
is the rate structure. Provinces have considerable flexibility in
setting the rates and brackets in the ToNI system. This has been
seen in the analysis here, with Alberta’s single rate producing
some very different results than British Columbia’s sharply
progressive five brackets or Manitoba’s three brackets with
high rates. I consider two possibilities—expanding the number
of rates and brackets or contracting them down to one.
The main advantage of multiple brackets is the flexibility to affect
the progressivity of the personal income tax. While provincial
25
income tax is not as large as the federal tax, the analysis in this
paper and in Frenette, Green and Milligan (2008) has shown
that the choices made by provincial governments can still have
substantial impact on average tax burdens across different
income groups. With more brackets, like British Columbia, there
can be more differences in the tax treatment of lower and higher
income individuals. If there is a desire among the population in
a province to mitigate in part the strong upward trend in market
income inequality, adding more income tax progressivity could
help. In the international analysis, both the United States and
Japan had much more progressivity higher up the income
distribution than is the case in Canada. on the other hand, the
United Kingdom and Hong Kong showed less progressivity. A
disadvantage of having several brackets is complexity. Not only
does complexity decrease the transparency of the system, but
it also creates opportunities for wasteful tax avoidance. Having
higher rates at high income levels could also damage work
effort and investment returns.
Moving the tax system in the other direction, provinces could
adopt a rate structure like Alberta’s single rate. Because other
provinces have higher revenue requirements from their income
taxes, the rate in other provinces would most likely have to be
higher than the 10% currently used in Alberta. Having a lower
rate could improve work, savings, and investment incentives
for those seeing rate drops. As was seen in the simulations,
however, the move in Alberta to the 10% rate actually increased
the marginal tax rate faced by the P25 individuals, so it is not
obvious that a move to a single rate would improve incentives
for everybody. Moreover, the average tax rate was the least
progressive in Alberta, which might not match well with the
redistributive preferences of the citizens of other provinces. on
the plus side, an advantage of the single rate system is the
simplicity. Having only one tax rate increases the transparency
of the system and also minimizes tax planning and intrafamilial
tax arbitrage strategizing.
With market incomes growing much more strongly at the top
than in the middle, holding the tax system constant means that
after-tax inequality will continue to grow. The simulations in this
paper show a remarkable lack of progressivity in average tax
rates at higher income levels where the inequality in market
incomes has been growing. In the United States, someone
earning $350,000 faces a 7% higher tax rate than someone
earning $150,000, reflecting an assessment among Americans
that a $350,000 earner has a higher ability to pay. In Canada,
the tax rate in all provinces for the two individuals would be
the same. This may reflect a different assessment by Canadians
about the relative abilities to pay of the $150,000 and $350,000
individuals. It also may reflect a desire not to upset the incentives
of the highest earning and most productive members of society,
in order to keep them productively employed.
9. Policy Recommendations
In this section, I provide clear recommendations for the personal
income tax system of the western Canadian provinces based on
the analysis presented in this paper. With each recommendation
is a small discussion of my assessment of the merits of the
policy. The section closes with a brief discussion of options
not taken.
1. Remain in the Tax Collection Agreements
The provinces should remain signatories to Tax Collection
Agreements with the federal government. The advent of the tax
on income system since 2001 has given the provinces ample
flexibility to design and create a personal income tax system
that reflects the values and needs of its citizens.
This recommendation comes with two caveats. First, the price
charged by the Canada revenue Agency for the design of
specialized credits should be comparable or better than what
it would cost a province to collect the tax on its own. If the
federal government doesn’t offer a good deal, the Tax Collection
Agreement should be reconsidered. Second, the definition of
taxable income (comprised of total income less deductions)
should be monitored closely to ensure that federal changes do
not have adverse impacts on provincial revenues.
2. All provinces should index tax credits and brackets to inflation
When tax credits and brackets are not indexed to inflation,
nominal pay increases that don’t enhance real purchasing
power lead to higher average tax burdens; a stealth tax increase.
For the sake of transparency, all tax brackets and credits should
be fully indexed to inflation in each province. Manitoba is the
Time for a Tune Up: Personal Income Taxation in Western Canada
26
Kevin Milligan
only western province that has not indexed its personal income
tax system.
3. Stop expanding non-refundable credits
Instituting non-refundable credits for new categories of
spending generates complexity, administrative, and compliance
costs. They also cost revenue that must be made up elsewhere;
the foregone possibility of lower rates. A PIT system with ever-
expanding nonrefundable tax credits is one that has high
marginal tax rates yet raises less revenue, which is not a good
feature for a tax system. While seemingly legitimate equity or
social concerns do generate some of the demands for new tax
credits, a return to a simple standard of redistributing on a basic
measure of ability to pay is preferable.
4. Consolidate some existing non-refundable credits
Many of the existing tax preferences recognized by non-
refundable credits can be justified as reflecting a decrease in
one’s ability to pay or as a cost of earning income. However,
others are harder to justify. Specifically, the age amount for
those age 65 or higher perhaps was meant to account for
special expenses that are incurred by the elderly compared to
a young person with similar income. However, there are now
also credits for caregiver expenses and an existing credit for
medical expenses, creating duplication. Furthermore, it is hard to
understand a justification for pension income receiving special
tax preference. These credits could be rolled into a larger age
credit that aims to recognize that seniors have special expenses,
but only recognizes this once and in one place.
5. Consider increasing progressivity at the top
The degree of progressivity in the income tax system should
reflect the values of the citizens of each province. For that reason,
I am reluctant to recommend strongly a change to progressivity.
However, I do recommend that each province consider whether
its tax system could be adjusted to account for the increasing
market income inequality that has occurred over the last 25 years.
This increase in inequality has occurred primarily at the very top
of the income distribution, and a steepening of the progressivity
there could to some degree mitigate this long-term trend.
10. Conclusions
This paper has reviewed the personal income taxation system in
the provinces of western Canada. Beginning with an overview
of the importance of PIT as a revenue source and as a factor
in determining economic behaviour, I progressed to describe
its historical development and principal features. Simulations
provided evidence that tax rates have risen for middle income
individuals at the same time as they have fallen for high income
individuals. When refundable tax credits are considered,
average tax rates for both high and lower income families have
fallen considerably, but those in the middle have not. Moreover,
there were substantial differences across provinces, indicating
substantial scope for provincial governments to affect their
economies through their PIT choices.
The paper closed with recommendations for some innovations
to the existing structure, including a call for the western
provinces to remain in the tax collection agreements, index their
systems to inflation, and to simplify and rationalize their non-
refundable credits. I also recommended a reconsideration of the
progressivity of the rate structures.
As the provinces of western Canada continue to adjust their tax
systems to the changing needs and priorities of the dynamic
economy, the personal income tax remains a central pillar in
provincial revenue structures. Improving the personal income
tax can yield benefits not only by improving incentives for work,
investment, and saving, but also in providing a degree of fairness
that reflects the values of western Canadians.
References
Auerbach, Alan J. and Joel Slemrod. 1997. “The economic effects of the Tax reform Act of 1986.” Journal of Economic Literature, Vol. 35, No. 2, pp. 589-632.
Bergstresser, Daniel and James Poterba. 2004. “Asset allocation and asset location: household evidence from the survey of consumer finances.” Journal of Public Economics, Vol. 88, No. 9-10, pp. 1893-1915.
Blundell, richard, Alan Duncan and Costas Meghir. 1998. “Estimating labor Supply responses Using Tax reforms.” Econometrica, Vol. 66, No. 4, pp. 827-861.
27
Boadway, robin W. and Paul A.r. Hobson. 1993. Intergovernmental Fiscal Relations in Canada. Canada Tax Paper No. 96. Toronto, oN: Canadian Tax Foundation.
Canada. 2000. “Federal Administration of Provincial Taxes: New Directions.” ottawa: Department of Finance and Canada Customs and revenue Agency, January.
Cullen, Julie Berry and roger H. Gordon. 2007. “Taxes and entrepreneurial risk-taking: Theory and evidence for the U.S.” Journal of Public Economics, Vol. 91, No. 7-8, pp. 1479-1505.
Day, Kathleen M. and Stanley l. Winer. 2006. “Policy-induced internal migration: An empirical investigation of the Canadian case.” International Tax and Public Finance, Vol. 13, No. 5, pp. 535-564.
Domar, Evsey and richard A. Musgrave. 1944. “Proportional income taxation and risk-taking.” Quarterly Journal of Economics, Vol. 58, No. 3, pp. 388-422.
Frenette, Marc, David Green, and Kevin Milligan. 2007. “The tale of the tails: Canadian income inequality in the 1980s and 1990s.” Canadian Journal of Economics, Vol. 40, No. 3, pp. 734-764.
Frenette, Marc, David Green, and Kevin Milligan. 2008. “looking for Smoking Guns: The Impact of Changes in Tax and Transfer Systems on Canadian Income Inequality.” Manuscript, University of British Columbia.
Gentry, William M. and r. Glenn Hubbard. 2005. “’Success Taxes,’ entrepreneurial entry, and innovation” in Adam B. Jaffe, Joshua lerner, and Scott Stern, eds. Innovation Policy and the Economy, Volume 5, pp. 87-108.
Kesselman, Jonathan r. and ron Cheung. 2004. “Tax incidence, progressivity, and inequality in Canada.” Canadian Tax Journal, Vol. 52, No. 3, pp. 709-789.
Klein, Peter. 2004. “The capital gain lock-in effect and perfect substitutes.” Journal of Public Economics, Vol. 88, No. 12, pp. 2765-2783.
la Forest, Gerard V. 1967. “The Allocation of Taxing Power Under the Canadian Constitution.” Canada Tax Paper no. 46. Canadian Tax Foundation.
lee, Young and roger H. Gordon. 2005. “Tax Structure and Economic Growth.” Journal of Public Economics, Vol. 89, No. 5-6, pp. 1027-1043.
Milligan, Kevin. 2007. Canadian Tax and Credit Simulator. Database, software and documentation, Version 2007-2.
Milligan, Kevin and Mark Stabile. 2007. “The integration of child tax credits and welfare: Evidence from the Canadian
National Child Benefit program.” Journal of Public Economics, Vol. 91, No. 1-2 , pp. 305-326.
Mintz, Jack M. and Stephen r. richardson. 2006. “Income Trusts and Integration of Business and Investor Taxes: A Policy Analysis and Proposal.” Canadian Tax Journal, Vol. 54, No. 2, pp. 359-406
Mintz, Jack and Michael Smart. 2004. “Income Shifting, Investment, and Tax Competition: Theory and Evidence from Provincial Taxation in Canada.” Journal of Public Economics, Vol. 88, No. 6, pp. 1149-1168.
Moore, Milton A., J. Harvey Perry, and Donald I. Beach. 1966. “The Financing of Canadian Federation: The First Hundred Years.” Canada Tax Paper no. 43. Canadian Tax Foundation.
Saez, Emmanuel and Michael r. Veall. 2005. “The evolution of high incomes in Northern America: lessons from the Canadian experience.” American Economic Review, Vol. 95, No. 3, pp. 831-849.
Slemrod, Joel. 1992. “Do taxes matter? lessons from the 1980s.” American Economic Review Papers and Proceedings, Vol. 82, No. 2, pp. 250-256.
Tiebout, C. 1956. “A Pure Theory of local Expenditures.” The Journal of Political Economy, 64(5):416-24.
Time for a Tune Up: Personal Income Taxation in Western Canada
Head Office:#900, 1202 Centre Street SE
Calgary, AB T2G 5A5Telephone: 403.264.9535
www.cwf.ca
About the Canada West Foundation
Our VisionA dynamic and prosperous West in a strong Canada.
Our MissionA leading source of strategic insight, conducting and communicating non-partisan economic and public policy research of importance to the four western provinces and all Canadians.
Canada West Foundation is a registered Canadian charitable organization incorporated under federal charter (#11882 8698 RR 0001).
In 1970, the One Prairie Province Conference was held in Lethbridge, Alberta. Sponsored by the University of Lethbridge and the Lethbridge Herald, the conference received considerable attention from concerned citizens and community leaders. The consensus at the time was that research on the West (including BC and the Canadian North) should be expanded by a new organization. To fill this need, the Canada West Foundation was created under letters patent on December 31, 1970. Since that time, the Canada West Foundation has established itself as one of Canada’s premier research institutes. Non-partisan, accessible research and active citizen engagement are hallmarks of the Foundation’s past, present and future endeavours. These efforts are rooted in the belief that a strong West makes for a strong Canada.
More information can be found at www.cwf.ca.
British Columbia Office:#810, 1050 W. Pender Street
Vancouver, BC V6E 3S7Telephone: 604.646.4625
CanadaWestF O U N D A T I O N
Manitoba Office:#400, 161 Portage Avenue East
Winnipeg, MB R3B 0Y4Telephone: 204.947.3958
Saskatchewan Office:604 Braeside View
Saskatoon, SK S7V 1A6Telephone: 306.373.8408