Embed Size (px)
Citation preview
NORTH ATLANTIC TREATY ORGANISATION
RESEARCH AND TECHNOLOGYORGANISATION
AC/323(HFM-111)TP/56 www.rta.nato.int
RTO EDUCATIONAL NOTES EN-HFM-111
Personal Hearing Protection including Active Noise Reduction
(Les dispositifs de protection de l’ouie, y compris l’atténuation du bruit actif)
The material in this publication was assembled to support a Lecture Series
under the sponsorship of the Human Factors and Medicine Panel (HFM)
presented on 25-26 October 2004 in Warsaw, Poland; 28-29 October 2004 in
Brussels, Belgium; and 9-10 November 2004 in Virginia Beach, VA, USA.
Published June 2005
Distribution and Availability on Back Cover


NORTH ATLANTIC TREATY ORGANISATION
RESEARCH AND TECHNOLOGYORGANISATION
AC/323(HFM-111)TP/56 www.rta.nato.int
RTO EDUCATIONAL NOTES EN-HFM-111
Personal Hearing Protection including Active Noise Reduction
(Les dispositifs de protection de l’ouie, y compris l’atténuation du bruit actif)
The material in this publication was assembled to support a Lecture Series
under the sponsorship of the Human Factors and Medicine Panel (HFM)
presented on 25-26 October 2004 in Warsaw, Poland; 28-29 October 2004 in
Brussels, Belgium; and 9-10 November 2004 in Virginia Beach, VA, USA.

ii RTO-EN-HFM-111
The Research and Technology Organisation (RTO) of NATO
RTO is the single focus in NATO for Defence Research and Technology activities. Its mission is to conduct and promote co-operative research and information exchange. The objective is to support the development and effective use of national defence research and technology and to meet the military needs of the Alliance, to maintain a technological lead, and to provide advice to NATO and national decision makers. The RTO performs its mission with the support of an extensive network of national experts. It also ensures effective co-ordination with other NATO bodies involved in R&T activities.
RTO reports both to the Military Committee of NATO and to the Conference of National Armament Directors. It comprises a Research and Technology Board (RTB) as the highest level of national representation and the Research and Technology Agency (RTA), a dedicated staff with its headquarters in Neuilly, near Paris, France. In order to facilitate contacts with the military users and other NATO activities, a small part of the RTA staff is located in NATO Headquarters in Brussels. The Brussels staff also co-ordinates RTO’s co-operation with nations in Middle and Eastern Europe, to which RTO attaches particular importance especially as working together in the field of research is one of the more promising areas of co-operation.
The total spectrum of R&T activities is covered by the following 7 bodies: • AVT Applied Vehicle Technology Panel • HFM Human Factors and Medicine Panel • IST Information Systems Technology Panel • NMSG NATO Modelling and Simulation Group • SAS Studies, Analysis and Simulation Panel • SCI Systems Concepts and Integration Panel
• SET Sensors and Electronics Technology Panel
These bodies are made up of national representatives as well as generally recognised ‘world class’ scientists. They also provide a communication link to military users and other NATO bodies. RTO’s scientific and technological work is carried out by Technical Teams, created for specific activities and with a specific duration. Such Technical Teams can organise workshops, symposia, field trials, lecture series and training courses. An important function of these Technical Teams is to ensure the continuity of the expert networks.
RTO builds upon earlier co-operation in defence research and technology as set-up under the Advisory Group for Aerospace Research and Development (AGARD) and the Defence Research Group (DRG). AGARD and the DRG share common roots in that they were both established at the initiative of Dr Theodore von Kármán, a leading aerospace scientist, who early on recognised the importance of scientific support for the Allied Armed Forces. RTO is capitalising on these common roots in order to provide the Alliance and the NATO nations with a strong scientific and technological basis that will guarantee a solid base for the future.
The content of this publication has been reproduced directly from material supplied by RTO or the authors.
Published June 2005
Copyright © RTO/NATO 2005 All Rights Reserved
ISBN 92-837-1140-8
Single copies of this publication or of a part of it may be made for individual use only. The approval of the RTA Information Management Systems Branch is required for more than one copy to be made or an extract included in another publication. Requests to do so should be sent to the address on the back cover.

RTO-EN-HFM-111 iii
Personal Hearing Protection including Active Noise Reduction
(RTO-EN-HFM-111)
Executive Summary Personal hearing protection and speech communication facilities are essential for optimal performance in military operations. High noise levels increase the risk of noise induced hearing loss and deterioration of communications. For many years passive hearing protection (earmuffs and earplugs) was used to reduce the noise dose exposure to personnel. Nowadays electronic systems, based on active noise reduction, have been used to improve the performance of personal hearing protection and speech communications.
In this lecture series, criteria for adequate hearing protection, the state-of-the-art of passive and active systems, the assessment and applications are discussed. The lecture series consists of five lectures and a concluding panel discussion:
• Introduction (Dr. H.J.M. Steeneken)
• Hearing and hearing protection (Dr. A. Dancer)
• Passive hearing protectors and their performance (Mr. R. McKinley)
• Active hearing protection systems and their performance (Dr. K. Buck)
• Assessment and standardization (Dr. H.J.M. Steeneken)
• Applications: overview of military noises, insertion loss, prediction of performance (Miss. S. James)
• Final panel discussion (all lecturers)
The lecture series took place in three countries: Poland (Warsaw at CIOP, 25-26 October 2004), Belgium (Brussels at the Royal Military Academy, 28-29 October 2004), and the United States (Virginia Beach, Virginia, Courtyard by Marriott, 9-10 November 2004).

iv RTO-EN-HFM-111
Les dispositifs de protection de l’ouie, y compris l’atténuation du bruit actif
(RTO-EN-HFM-111)
Synthèse Les dispositifs de protection de l’ouie et les équipements de communication vocale sont indispensables à l’obtention de performances optimales lors des opérations militaires. Des niveaux de bruit élevés font accroître le risque de perte de l’audition due au bruit, ainsi que de la dégradation des communications. Pendant de nombreuses années, les dispositifs de protection passive de l’ouie (les protecteurs d’oreille et les bouchons d’oreille) étaient utilisés pour réduire les doses de bruit auxquels le personnel était exposé. Aujourd’hui, des systèmes électroniques, basés sur la réduction active du bruit, sont utilisés pour améliorer les performances des dispositifs de protection de l’ouie, ainsi que celles des communications vocales.
Ce cycle de conférences porte sur les critères à établir pour assurer une protection adéquate de l’ouie, les performances des systèmes actifs et passifs, l’évaluation, et les applications. La présentation consiste en 5 communications, suivies d’une table ronde :
• Introduction (Dr. H.J.M. Steeneken)
• L’ouie et la protection de l’ouie (Dr. A. Dancer)
• Les dispositifs de protection passive de l’ouie et leurs performances (M.R. McKinley)
• Les systèmes de protection active de l’ouie et leurs performances (Dr. K. Buck)
• Evaluation et normalisation (Dr. H.J.M. Steeneken)
• Applications: aperçu des bruits militaires, des pertes d’insertion, et de la prévision des performances (Mlle S. James)
• Table ronde (l’ensemble des conférenciers)
Le Cycle de conférences a été organisé dans trois pays : la Pologne (à Varsovie au CIOP les 25 et 26 octobre 2004), la Belgique (à Bruxelles à l’Académie Royale Militaire les 28 et 29 octobre 2004), ainsi qu’aux Etats-Unis (à Virginia Beach, dans la Virginie, au Courtyard by Marriott les 9 et 10 novembre 2004).
RTO-EN-HFM-111 v
Table of Contents
Page
Executive Summary iii
Synthèse iv
List of Authors/Lecturers vi
Reference
Introduction I by H.J.M. Steeneken
Hearing and Hearing Protection 1 by A.L. Dancer
Passive Hearing Protection Systems and their Performance 2 by R. McKinley and V. Bjorn
Active Hearing Protection Systems and their Performance 3 by K. Buck and V. Zimpfer-Jost
Assessment and Standardization of Personal Hearing Protection including Active Noise 4 Reduction
by H.J.M. Steeneken
Defining the Cockpit Noise Hazard, Aircrew Hearing Damage Risk and the Benefits Active 5 Noise Reduction Headsets can Provide
by S.H. James

vi RTO-EN-HFM-111
List of Authors/Lecturers
Lecture Series Director Dr. Herman J.M. STEENEKEN
Lecture Series Director TNO Human Factors
Kampweg 5, P.O. Box 23 Soesterberg 3769 ZG
THE NETHERLANDS
FRANCE Dr. Karl BUCK French-German Research Institute de Saint-Louis APC Group 5, rue du Général Cassagnou 68301 Saint-Louis Dr. Armand L. DANCER French-German Research Institute de Saint-Louis APC Group 5, rue du Général Cassagnou 68301 Saint-Louis Ms. Véronique ZIMPFER-JOST French-German Research Institute de Saint-Louis APC Group 5, rue du Général Cassagnou 68301 Saint-Louis
UNITED KINGDOM Miss. Susan Helen JAMES FST QinetiQ Cody Technical Park Room 2001 A6, Ively Road Farnborough, Hants, GU14 OLX UNITED STATES Ms. Valerie BJORN Naval Air Systems Command AEDC/DOF (Navy Liaison) 740 Fourth Street Arnold AFB, TN 37389-6000 Mr. Richard McKINLEY AFRL/HECB 2255 H Street Wright Patterson AFB Ohio 45433-7022
PANEL EXECUTIVE Col. Carel E.M. BANSE, MA
BP 25 92201 Neuilly-sur-Seine, FRANCE
Tel: +33 1 55 61 22 60/62 Fax: +33 1 55 61 22 98
E-mail: [email protected] or [email protected]
RTO-EN-HFM-111 I - 1
Introduction
Dr. Herman J.M. Steeneken TNO Human Factors
Kampweg 5, P.O. Box 23 Soesterberg 3769 ZG
THE NETHERLANDS
Introduction
Adequate hearing protection and efficient speech communication is recognized as a critical capability in most military applications such as vehicle and aircraft operations, command and control, and in the battlefield. Advanced hearing protectors are required for a range of environmental conditions, especially those with extremely high levels of low frequency noise. Passive hearing protectors equipped with an additional active noise reduction system may offer sufficient sound attenuation and suitable speech communication capabilities for these harsh noise environments. Application oriented assessment is required to guarantee optimal performance. Hence, a study was conducted to assess and select assessment methods for active noise reduction systems. The study was organized as a Round Robin test where various laboratories performed the same test with the same test material. The reproducibility of the various methods can thus be determined. The laboratories involved in this study were: DRDC Canada; ISL France/Germany; TNO-HF the Netherlands; QinetiQ UK; AFRL/HECB USA. The HFM-panel of the NATO Research and Technology Organization authorized the study and formed a special Task Group (HFM-TG028). The Task Group has finished the project and reported the results (see NATO/RTO report TR-HFM-094, 2004). Further dissemination was initiated through the organization of Lecture Series 244. The goal of this Lecture Series is to inform decision makers, scientists and human factors and medical staff on the requirements, performance and capabilities of the present state of the art of personal hearing protection.
Scope
A primary question is the human ability to cope with noise. What is a safe noise dose? What is the origin of noise induced hearing loss? The first lecture by Dr. Armand Dancer will describe the mechanical and metabolic effects. Hearing protection starts at reducing the noise level at the source. However, this is in most cases not a valid possibility. Personal hearing protection is an alternative method. Already in the 1940s efforts were made to protect (military) personnel. This was always achieved with passive hearing protectors (plugs and muffs). The performance of these devices improved in the next decennia and even double protection (plug and muff) may be used. Mr. Richard McKinley will inform on the development and the present state-of-the-art of passive hearing protection. Although the idea of active noise reduction (ANR, the addition of a similar noise in anti-phase) was born in 1934 by Lueg in Germany, practical realization was possible in the 1980. Two methods may be used: feedback and feed-forward system. Dr. Karl Buck will give a historical overview and a description of present system design. Also the performance and the integration of speech communication will be discussed. Selection and/or development of passive and active hearing protectors require robust assessment methods. For this purpose subjective and objective methods have been developed. Each method has its specific
Paper presented at the RTO HFM Lecture Series on “Personal Hearing Protection including Active Noise Reduction”, held in Warsaw, Poland, 25-26 October 2004; Belgium, Brussels, 28-29 October 2004;
Virginia Beach, VA, USA, 9-10 November 2004, and published in RTO-EN-HFM-111.
Introduction
I - 2 RTO-EN-HFM-111
advantages and restrictions. What does an attenuation curve tell us and how is it related to a certain noise condition and the degree of protection of a user? Also what is the quality of the speech communication in this condition? Dr. Herman Steeneken will describe subjective and objective assessment methods for hearing protection and speech communication and will report on the Round Robin assessment activity. Applications of hearing protection design in real conditions will be described by Miss Soo James. She will compare noise conditions in aircraft, particularly fast jets, helicopters, transport, surveillance and future aircraft. Predictions are made for near future legislation. The program consists of:
1 Hearing and hearing protection (Dr. A. Dancer) 2 Passive hearing protectors and their performance (Mr. R. McKinley) 3 Active hearing protection systems and their performance (Dr. K. Buck) 4 Assessment and standardization (Dr. H.J.M. Steeneken) 5 Applications: overview of military noises, insertion loss, prediction of performance
(Miss. S. James, Mr. R. McKinley) 6 Final panel discussion (all lecturers).
The lecture series will be held at three locations and hosted by:
1. CIOP, Warsaw, Poland (Central Institute for Labour Protection, Warsaw), 2. RMA, Brussels, Belgium (Royal Military Academy), 3. NEHC, Portsmouth VA, USA (Navy Environmental Health Center).

RTO-EN-HFM-111 1 - 1
Hearing and Hearing Protection
A.L. Dancer “Acoustics and Protection of the Soldier”
French-German Research Institute of Saint-Louis (ISL) 5 rue du Général Cassagnou 68301 Saint-Louis, France
Summary We study the origin of the Noise-Induced Hearing Losses (NIHL) in relation to the morphology and the physiology of the ear. We describe the mechanical and metabolic effects of the noises on the inner ear and their consequences on hearing. We discuss the importance and the limitations of the protective mechanisms. Finally, we present new possibilities to protect the ear against noise and to treat the acoustic trauma.
Origin of Noise-Induced-Hearing Loss 1. Introduction
Figure 1 : The external-, middle- and inner-ear in man
Paper presented at the RTO HFM Lecture Series on “Personal Hearing Protection including Active Noise Reduction”, held in Warsaw, Poland, 25-26 October 2004; Belgium, Brussels, 28-29 October 2004;
Virginia Beach, VA, USA, 9-10 November 2004, and published in RTO-EN-HFM-111.

Hearing and Hearing Protection
1 - 2 RTO-EN-HFM-111
Acoustic stimuli are transmitted from the free field to the inner ear by the external- and the middle-ear (figure 1). The Noise-Induced Hearing Losses originate from mechanical and metabolic phenomena at the inner ear level. In order to understand the effects of noise on hearing, it is necessary to study the transmission and the dissipation of the acoustic stimulus at the auditory periphery (external ear, middle ear, inner ear). 2. Transmission and dissipation of the acoustic stimulus at the auditory periphery The external ear transforms the sound field by modifying the directionality associated with head diffraction and by adding substantial acoustic gain at the higher frequencies [1]. The figure 2 represents the amplitude of the transfer function of the human external ear (T) for azimuth θ = 45° and the contribution of each element. The head and the pinna act as an acoustic screen and/or wall and as an acoustic antenna, the concha and the earcanal act as resonators (cavity and tube).
Figure 2: Average acoustic pressure gain components
for human ear for azimuth θ = 45° [1] Around 3 kHz, we observe an amplification of about 20 dB from the free field to the tympanum (θ = 45°). The transfer function of the middle ear relates the acoustic pressure at the tympanum to the input signal at the entrance to the inner ear: i.e., the acoustic pressure in the perilymph at the base of the scala vestibuli (figure 3).
Figure 3: Mean Human middle-ear transfer function [2]

Hearing and Hearing Protection
RTO-EN-HFM-111 1 - 3
As pointed out by Rosowski [3], several authors have suggested that the cochlea acts as a power detector at threshold such that the shape of the audiogram is solely determined by the relationship between stimulus sound pressure at each frequency and the resultant sound power that enters the cochlea. The figure 4 indicates that the inner ear is a simple and constant power detector for tonal thresholds (except at the lowest frequencies: below a few hundred hertz).
Figure 4: Comparison of auditory thresholds with the sound pressure
required to maintain a constant sound power at the cochlea [3] In man, the tonal thresholds correspond to 1x10-18 Watt at the entrance to the cochlea. Therefore, the shape of the audiogram is mainly caused by the transfer functions of the external- and middle-ear: i.e., the way the acoustic stimuli are transmitted from the free field to the inner ear. The same external- and middle-ear mechanisms that shape the auditory threshold function also selectively filter the spectra of noxious acoustic stimuli and play a role in determining the potency of such stimuli (Rosowski [3]). The figure 5 indicates how the free field spectrum of an impulse noise is shaped by the external- and middle-ear (the same is true for a continuous noise).
Figure 5: Comparison of the relative power spectra of impulses and the power that reaches the (cat) cochlea [4]

Hearing and Hearing Protection
1 - 4 RTO-EN-HFM-111
As the A-weighting is the standardized curve closest to the threshold-of-hearing curve, it approximates the acoustic energy at the input to the inner ear. That is the reason why the A-weighting function is widely used to evaluate the hazard of occupational exposure noise (ISO 1999). Other (more accurate) weighting functions, i.e., "Threshold" weighting…, have not demonstrated decisive advantages that could justify a change [5]. ISO 1999 enforces the use of the A-weighting function and of the isoenergy principle. The hearing hazard is evaluated by measuring the dose of the (A-weighted) acoustic energy (in J/m2) to which the subject is exposed over a 8 hours period (the limit corresponds to an exposure level of 85 dBA over 8 hours: LAeq8). The reason for the use of the isoenergy principle is a mechanical property of the inner ear. The input impedance of the inner ear (i.e., the ratio between the sound pressure produced in scala vestibuli at the stapes footplate and the volume of perilymph the footplate displaces per unit of time) is purely resistive (because of the interaction of the perilymph mass with the compliance of the basilar membrane), in analogy to an electrical resistance [6]. In consequence all sound energy that enters the cochlea is consumed in it! As long as the auditory periphery behaves linearly, the use of the A-weighting and of the isoenergy principle is a physically sound method to assess the hearing hazard (at very high levels: beyond 130 dB, other methods taking into account the actual nonlinear mechanisms of the middle- and of the inner ear may be considered [7]). 3. Mechanisms of damage The acoustic pressure at the entrance to the cochlea induces displacements of the basilar membrane and of the organ of Corti (figure 6).
Figure 6: Schematic representation of the organ of Corti
The relative displacements of the basilar membrane and of the tectorial membrane generate shearing motions of the outer and inner hair cells sterocilia (figures 7, 8). These motions open ion channels, depolarize the cells and induce the release of neurotransmitter (glutamate) at the basal end of the inner hair cells (transduction). The first auditory neurons (afferent nerve fibers), that connect the inner hair cells, convey the information to the upper auditory pathways.
0.01 mm
Organ of Corti
Outer Hair Cells
Basilar membrane
Tectorial membrane
Inner Hair Cell
Deiters’ CellsAfferent nerve fibers

Hearing and Hearing Protection
RTO-EN-HFM-111 1 - 5
Figure 7: Shearing motion of the stereocilia
Figure 8: Intact hair cells and stereocilia Exposure to intense noise induces two major types of damage to the inner ear: mechanical and/or metabolic. - Mechanical damage: at the hearing threshold the amplitude of the passive displacements of the tip of the stereocilia is about 10-12 m (1/10,000 the diameter of a stereocilium, 1/100 the diameter of the hydrogen atom). At 120 dB this amplitude reaches 1 micrometer (corresponding to an angular deflexion of 10 to 20 degrees), thousands times per second. Depending on the noise level, the stereocilia may break off immediately (i.e., for large impulse noises) or be overpowered by fatigue failure mechanisms. Following the exposure to a loud noise, the stiffness of the stereocilia decreases [8]. There is a de-polymerisation of the skeleton of actin filaments and/or a shortening of their roots and/or a downward shift of the interciliary links (figure 7). These changes (that are usually reversible) yield to a lower efficiency of the working of the ion channels and to a decrease of the sensitivity of the cochlea that corresponds to a Temporary Threshold Shift (TTS). A louder noise and/or a longer exposure will permanently damage the stereocilia and the hair cells and induce a Permanent Threshold Shift (PTS) (figure 9).
0,01 mm
Tectorial membrane
Hair Cell
Hearing and Hearing Protection
1 - 6 RTO-EN-HFM-111
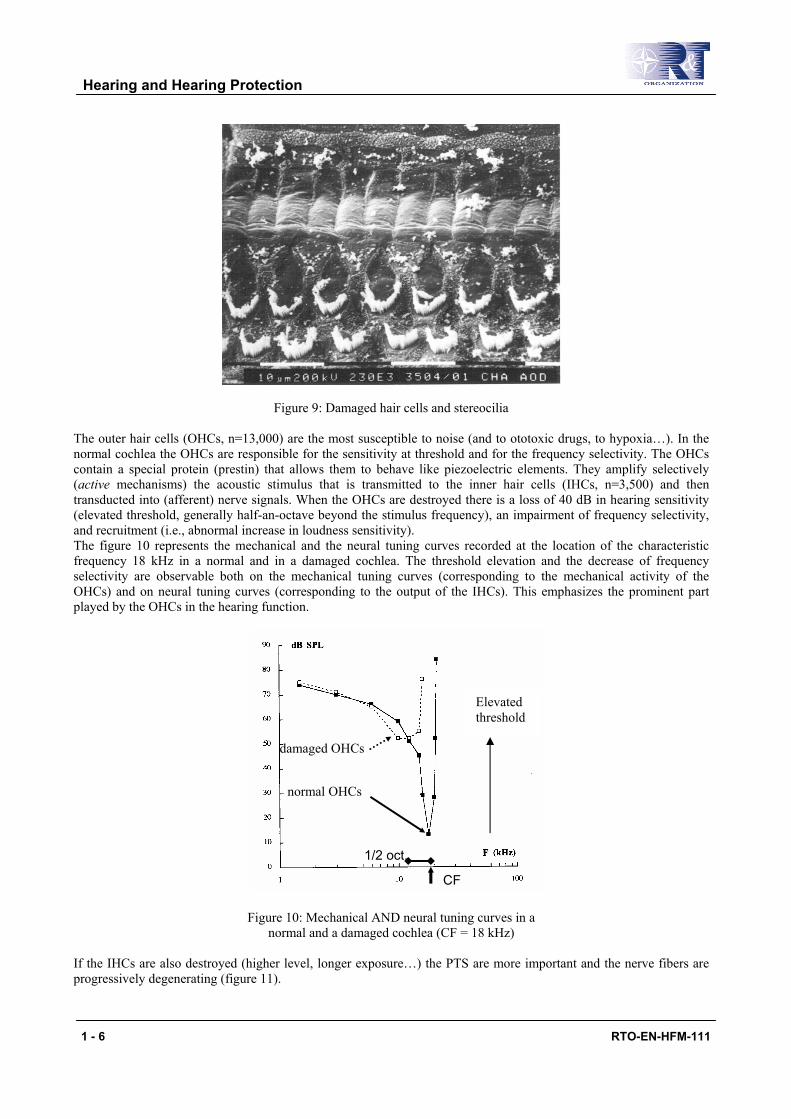
Figure 9: Damaged hair cells and stereocilia
The outer hair cells (OHCs, n=13,000) are the most susceptible to noise (and to ototoxic drugs, to hypoxia…). In the normal cochlea the OHCs are responsible for the sensitivity at threshold and for the frequency selectivity. The OHCs contain a special protein (prestin) that allows them to behave like piezoelectric elements. They amplify selectively (active mechanisms) the acoustic stimulus that is transmitted to the inner hair cells (IHCs, n=3,500) and then transducted into (afferent) nerve signals. When the OHCs are destroyed there is a loss of 40 dB in hearing sensitivity (elevated threshold, generally half-an-octave beyond the stimulus frequency), an impairment of frequency selectivity, and recruitment (i.e., abnormal increase in loudness sensitivity). The figure 10 represents the mechanical and the neural tuning curves recorded at the location of the characteristic frequency 18 kHz in a normal and in a damaged cochlea. The threshold elevation and the decrease of frequency selectivity are observable both on the mechanical tuning curves (corresponding to the mechanical activity of the OHCs) and on neural tuning curves (corresponding to the output of the IHCs). This emphasizes the prominent part played by the OHCs in the hearing function.
Figure 10: Mechanical AND neural tuning curves in a normal and a damaged cochlea (CF = 18 kHz)
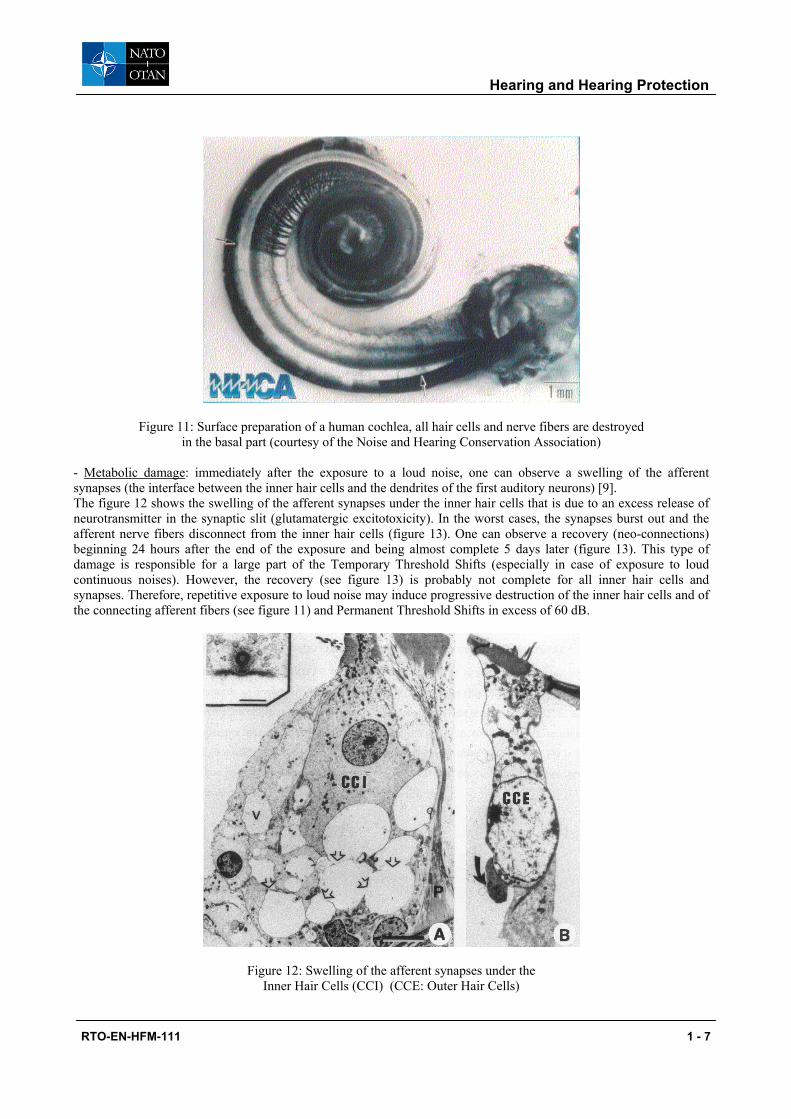
If the IHCs are also destroyed (higher level, longer exposure…) the PTS are more important and the nerve fibers are progressively degenerating (figure 11).
damaged OHCs normal OHCs
1/2 oct.
Elevated threshold
CF
Hearing and Hearing Protection
RTO-EN-HFM-111 1 - 7
Figure 11: Surface preparation of a human cochlea, all hair cells and nerve fibers are destroyed in the basal part (courtesy of the Noise and Hearing Conservation Association)
- Metabolic damage: immediately after the exposure to a loud noise, one can observe a swelling of the afferent synapses (the interface between the inner hair cells and the dendrites of the first auditory neurons) [9]. The figure 12 shows the swelling of the afferent synapses under the inner hair cells that is due to an excess release of neurotransmitter in the synaptic slit (glutamatergic excitotoxicity). In the worst cases, the synapses burst out and the afferent nerve fibers disconnect from the inner hair cells (figure 13). One can observe a recovery (neo-connections) beginning 24 hours after the end of the exposure and being almost complete 5 days later (figure 13). This type of damage is responsible for a large part of the Temporary Threshold Shifts (especially in case of exposure to loud continuous noises). However, the recovery (see figure 13) is probably not complete for all inner hair cells and synapses. Therefore, repetitive exposure to loud noise may induce progressive destruction of the inner hair cells and of the connecting afferent fibers (see figure 11) and Permanent Threshold Shifts in excess of 60 dB.
Figure 12: Swelling of the afferent synapses under the Inner Hair Cells (CCI) (CCE: Outer Hair Cells)
Hearing and Hearing Protection
1 - 8 RTO-EN-HFM-111
Figure 13: Schematic representation of synaptic recovery following the excitotoxicity (according to Gervais d'Aldin [47])
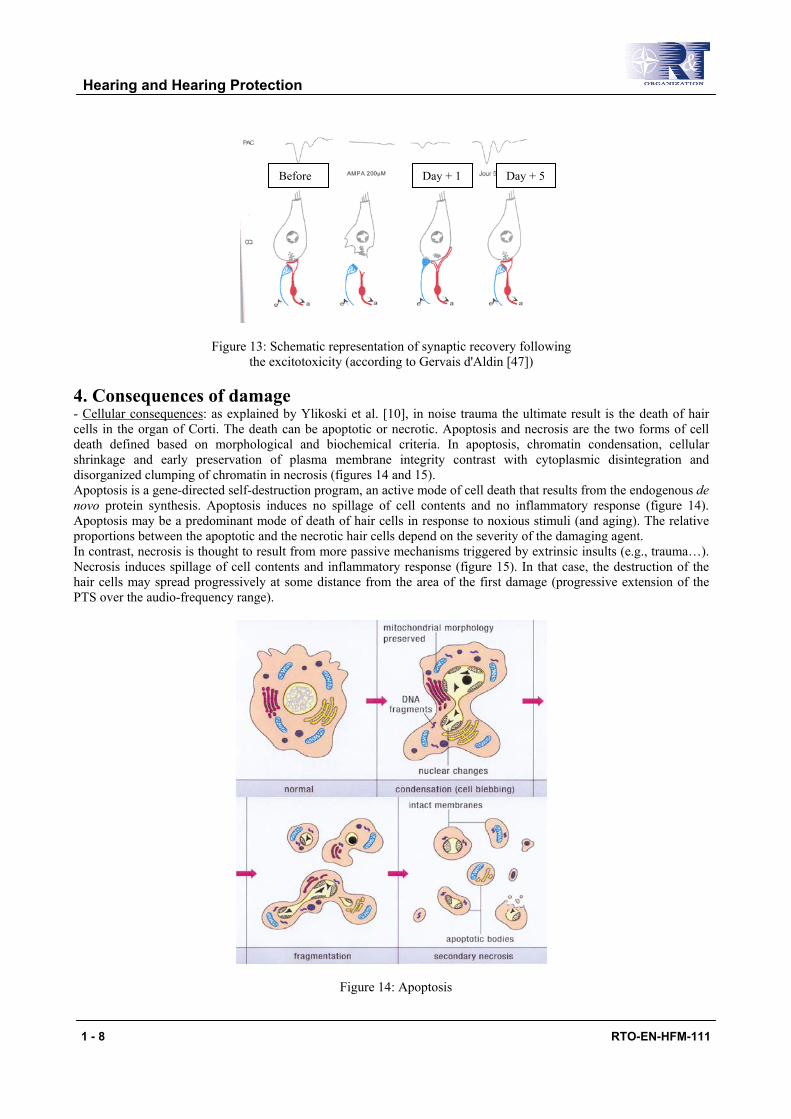
4. Consequences of damage - Cellular consequences: as explained by Ylikoski et al. [10], in noise trauma the ultimate result is the death of hair cells in the organ of Corti. The death can be apoptotic or necrotic. Apoptosis and necrosis are the two forms of cell death defined based on morphological and biochemical criteria. In apoptosis, chromatin condensation, cellular shrinkage and early preservation of plasma membrane integrity contrast with cytoplasmic disintegration and disorganized clumping of chromatin in necrosis (figures 14 and 15). Apoptosis is a gene-directed self-destruction program, an active mode of cell death that results from the endogenous de novo protein synthesis. Apoptosis induces no spillage of cell contents and no inflammatory response (figure 14). Apoptosis may be a predominant mode of death of hair cells in response to noxious stimuli (and aging). The relative proportions between the apoptotic and the necrotic hair cells depend on the severity of the damaging agent. In contrast, necrosis is thought to result from more passive mechanisms triggered by extrinsic insults (e.g., trauma…). Necrosis induces spillage of cell contents and inflammatory response (figure 15). In that case, the destruction of the hair cells may spread progressively at some distance from the area of the first damage (progressive extension of the PTS over the audio-frequency range).
Figure 14: Apoptosis
Before Day + 1 Day + 5

Hearing and Hearing Protection
RTO-EN-HFM-111 1 - 9
Figure 15: Necrosis It is very important to understand into detail the mechanisms of the death of the hair cells in order to be able to prevent Noise-Induced Hearing Loss (NIHL) and to treat the acoustic trauma (see below). - Functional consequences The functional consequences for hearing: TTS and PTS, decrease in frequency selectivity, recruitment, tinnitus (ear ringing) have been previously described. - Operational consequences The hearing losses and the decrease in frequency selectivity induce difficulties to detect, localize and identify acoustic sources in the environment and impede the efficiency and the security of the soldier. Moreover, the impairment of speech intelligibility (especially in noisy environments) can drastically reduce the global performance of complex and expensive weapon systems [11] (fig. 16).
0
20
40
60
80
100
0 25 50 75 100Speech Intelligibility (%)
Successful Missions (%)
Figure 16: Tank performance: percentage of successful missions (including navigation, reporting and gunnery) as a function of speech intelligibility [11]
Hearing and Hearing Protection
1 - 10 RTO-EN-HFM-111
- Financial consequences The NIHL are responsible for many expenses. Soldiers suffering large PTS can be definitively withdrawn from front line service. For specialized personnel large formation and training expenses may be definitively wasted. Moreover, PTS are considered as war injuries and must be compensated. For this cause, in 2003, 548 million dollar have been distributed to 74,363 US veterans. In France, the annual cost of the compensations is evaluated to 60 million dollar. In Belgium, about two thirds of the 6 million dollar paid yearly to the veterans for all kinds of disabilities correspond to NIHL ! The acoustic trauma represents the first cause of morbidity in the military during peace time ! Hearing Protection In the following, we’ll examine the possibility to predict the individual susceptibility to noise, we’ll describe the protective mechanisms that the hearing organ utilizes (the use of hearing protection devices: earplugs, earmuffs…, is presented elsewhere), and we’ll review new medical developments that could allow to prevent and/or treat the acoustic trauma.
1. Individual Susceptibility to NIHL There would be great interest in finding a test that predicts individual susceptibility to PTS. Thirty–five years ago, Ward [12] analyzed about 20 proposed tests of individual susceptibility, and found none of them good enough to be useful. Since that time, many other publications on this subject appeared. The proposed tests can be divided into two major groups: non-auditory and auditory. - non-auditory tests Bonaccorsi [13] showed, in men and guinea pigs, that a correlation exists between the concentration of melanin in the stria vascularis (the source of electrical energy into the inner ear) and susceptibility to noise. Because the concentration of melanin in the iris of the eye is positively correlated with the concentration in the stria vascularis, it follows that dark eyes are correlated with low noise susceptibility. It has also been proposed that there is a correlation between general health condition and susceptibility: different studies indicate that good cardiovascular function (i.e., low blood viscosity, low rate of blood platelets aggregate, low rate of cholesterol…) decreases the risk of hearing loss. However, the relationship between non-auditory factors and susceptibility is too weak that they do not offer a basis for an effective individual susceptibility test. - auditory tests There is a very large number of tests, almost all of them using some procedure to determine the sensitivity to Temporary Threshold Shift (TTS). Carhart [14] proposed the “Threshold of Distorsion Test” as an index of susceptibility to TTS. This test uses the level at which pure tone nonlinear combination tones can be heard. The “Threshold of Octave Masking Effect” proposed by Humes et al. is based on a similar principle. Humes [15] also proposed that “Speech Discrimination in Noise” might be used to detect “fragile” ears because frequency integration in the ear might be affected long before any TTS could be detected. The “Loudness Discrimination Index” is based on recruitment and was suggested to be an early indicator for TTS. Some authors tried to establish a correlation between the threshold of audibility and the susceptibility to noise [16]. In normal hearing subjects, the thresholds are partly determined by the performance of the transfer function of the outer and the middle ears (see beyond). Therefore, low thresholds could indicate that a large amount of acoustic energy is transmitted to the inner ear [17]. Measurement of the “Middle-Ear Acoustic Reflex”, that modulates the transmission of the acoustic energy to the inner ear (see below), has also been suggested as a test of susceptibility [18]. On the other hand, the possibility to assess the interindividual susceptibility from the measurement of the “Inner-Ear Acoustic Reflex(es)” when stimulating the ipsilateral and/or the contralateral ear exists, even if controversial [19]. All the auditory tests purport to be a prediction of the individual susceptibility to TTS, but not to PTS. In fact, most of the tests deals with TTS in humans, and there is no ethical way to induce a PTS in humans for experimental purposes. So the problem for all tests is that there must be a correlation between sensitivity to TTS and sensitivity to PTS if they are to have any practical value. Temkin [20] in 1933 first stated the hypothesis that there should be some relationship between TTS and PTS. In the intervening years, discussion has gone on and there is still no definite answer as to whether this relationship exists or not. Burns and Robinson measured the PTS acquired during a worker’s previous employment and compared it to the TTS acquired during one working day. They concluded “that a higher susceptibility to TTS tends to be associated with higher susceptibility to occupational hearing loss, and vice versa”. However, there is considerable uncertainty with respect to the hearing thresholds before the work experience, that makes it difficult to interpret these findings
Hearing and Hearing Protection
RTO-EN-HFM-111 1 - 11
unequivocally. Kryter et al. [21] postulated that the TTS observed after one working day should approximate the amount of PTS after ten years work in the same environment. However, these data are mean data for groups and are not applicable to the prediction of individual susceptibility. Other results suggest that subjects with a longer recovery time for TTS are more susceptible to PTS. The foregoing tests show some relationship between TTS (or related factors) and PTS. Unfortunately, for the most part they were designed to show the correlation for groups, rather than for individuals. Is it possible that a test of susceptibility to PTS based on TTS measurements works satisfactorily for individuals ? To answer this question experiments were performed on animals. Guinea pigs were exposed to a 1/3 octave band noise of moderate level and TTS were measured (phase I). One week later (after complete recovery), the same animals were exposed to the same noise at a higher level. PTS were measured up to 40-60 days post-exposure (Phase II). The essentially low correlation between PTS and TTS at the individual level seems to indicate that different mechanisms are involved (i.e., maximum TTS occurs one octave higher than the noise stimulus, but maximum PTS is measured at the center frequency of the noise, meaning that TTS is induced in a different part of the cochlea than PTS) [22]. It is also very important to stress that the individual susceptibility to noise is probably not the same as a function of the age and the health condition of the subjects. Somebody who is rated as resistant to noise could, under unpredictable conditions, become especially susceptible. Therefore, it would be hazardous to rate once and for all the auditory susceptibility of an individual. More recently a survey performed by Job et al. [23] on 1208 young recruits showed that the harmful effect of noise exposure (PTS, tinnitus) was strongly dependent on the presence of repeated episodes of otitis media in childhood (even when no sequelae was observable during the otoscopic examination at the time of the survey). This study indicates that a test for individual susceptibility to noise could be looked for in other directions than the usual relationships between TTS and PTS. 2. Middle-ear acoustic reflex The transmission of sound through the middle-ear is controlled by the middle-ear muscles (figure 17).
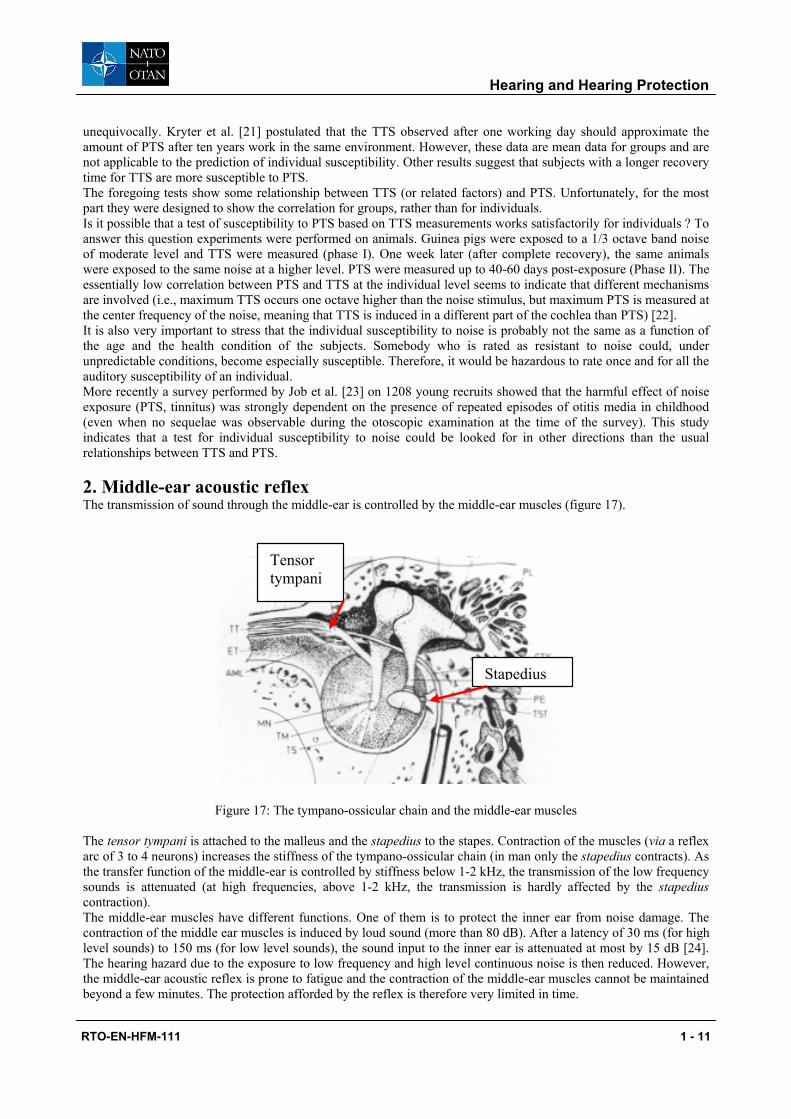
Tensor tympani
Stapedius
Figure 17: The tympano-ossicular chain and the middle-ear muscles
The tensor tympani is attached to the malleus and the stapedius to the stapes. Contraction of the muscles (via a reflex arc of 3 to 4 neurons) increases the stiffness of the tympano-ossicular chain (in man only the stapedius contracts). As the transfer function of the middle-ear is controlled by stiffness below 1-2 kHz, the transmission of the low frequency sounds is attenuated (at high frequencies, above 1-2 kHz, the transmission is hardly affected by the stapedius contraction). The middle-ear muscles have different functions. One of them is to protect the inner ear from noise damage. The contraction of the middle ear muscles is induced by loud sound (more than 80 dB). After a latency of 30 ms (for high level sounds) to 150 ms (for low level sounds), the sound input to the inner ear is attenuated at most by 15 dB [24]. The hearing hazard due to the exposure to low frequency and high level continuous noise is then reduced. However, the middle-ear acoustic reflex is prone to fatigue and the contraction of the middle-ear muscles cannot be maintained beyond a few minutes. The protection afforded by the reflex is therefore very limited in time.

Hearing and Hearing Protection
1 - 12 RTO-EN-HFM-111
On the other hand, on account of its latency (≥ 30 ms), the reflex cannot protect against impulse noises (i.e., weapon noises). However, this assertion must be somewhat balanced because in some circumstances the middle ear muscles can be contracted voluntarily: some subjects may trigger the contraction of their middle-ear muscles before shooting their weapon (but unexpected impulses from neighbouring weapons would not be attenuated). The only situation the middle-ear acoustic reflex is very efficient is when firing by bursts [25]. For a given number of rounds, the TTS may be 40 – 50 dB larger when they are fired at intervals ≥ 1 s instead of 10/s. The influence of impulse spacing on auditory hazard must be taken into account by the damage risk criteria for impulse noise (as in the MIL-STD 1474B that considers a burst as a single round [26]). 3. Inner-ear “acoustic reflex(es)” Actually, the innervation of the hair cells is more complicated than presented before in the figure 6. Besides the afferent fibers that (mainly) connect the inner hair cells (type I afferent fibers), there are two efferent systems (figure 18).
Figure 18: Schematic representation of the afferent and efferent innervation of the OHC and IHC (according to Pujol [27])
The lateral efferent system is composed of nonmyelinated (slow conduction) fibers derived from the ipsilateral superior olive (in the brainstem). These fibers form terminal or "en passant" axo-dendritic synapses with the afferent fibers connected to the IHCs. The medial efferent system is derived from neurons of the ipsilateral and controlateral superior olives. It is composed of myelinated (fast conduction) fibers that innervate the controlateral (70%) or the ipsilateral (30%) cochlea and form axo-somatic synapses with the basal pole of the OHCs. One fiber may branch to innervate about 10 OHCs in each of the three rows (figure 8). The neurotransmitter of these synapses is acetylcholin. The role of the medial efferent system is to initiate and or to regulate slow contraction of the OHCs (as compared to the rapid piezoelectric-like contractions that are the base of the active mechanisms, see beyond). Under these conditions the dynamical range of the active mechanisms could be reduced, becoming then less vulnerable). As pointed out by Guinan [28] and Henderson et al. [29], most of our information about the role of the cochlear efferent system is based on the action of the medial system. This system has been suggested to be a factor in the auditory system's response to high level noise [30]. It could account for properties such as adaptation, detection of the signal in presence of noise, and protection against excessive stimulation. Electrical stimulation of the medial efferent system leads to a reduction in distorsion product otoacoustic emissions (a by-product of the active cochlear mechanisms) and whole nerve action potential (the output signal of the cochlea). Acoustical stimulation of the controlateral ear with a sound of the same bandwidth as the TTS producing noise shows that a highly activated medial efferent system reduces the TTS caused by noise exposure. However, because there is ample evidence that the correlation between susceptibility to TTS and PTS is poor (see beyond), one can wonder whether this system may decrease PTS as well as TTS. Experiments performed by Henderson et al. indicate that the loss of the cochlear efferent system renders the ear more vulnerable to the noise effects. Moreover, Maison and Liberman [31] showed an inverse relationship between the strength of the medial efferent reflex and the PTS. Totally
Hearing and Hearing Protection
RTO-EN-HFM-111 1 - 13
de-efferented ears develop at least 10-20 dB more PTS than normal ears. As a consequence, this reflex seems to be effective in protecting the ear as well against TTS as PTS. However, because the latency of the efferent system's feedback to the cochlea is long (20 to 100 ms), it does not protect from isolated and/or unexpected impulses. As for the middle-ear acoustic reflex, it is probably efficient when the ear is exposed to a burst of impulses. Finally, one can speculate about a possible synergistic effect between the middle-ear and the inner-ear acoustic reflexes. The first one protects the ear against low frequency sound but is ineffective beyond 1 - 2 kHz. The second one is more present and effective at the base of the cochlea, on the high frequency side. 4. “Resistance/Training” to noise Preconditioning is a general biochemical phenomenon where non-damaging stimuli create tolerance to subsequent detrimental forms of trauma or stress (ischemia, light damage to the retina, noise damage to the cochlea...) (Niu and Canlon [32]). Sound conditioning is a powerful intervention for protecting hearing loss caused by noise trauma. For example, when guinea pigs are exposed to a 1 kHz tone presented continuously at 81 dB SPL for 24 hours, this exposure does not cause morphological or functional damage. Then, if the same animals are exposed to the same tone at 105 dB SPL for 72 hours. the recovery is complete after one month while a control group - non-conditioned - shows a threshold shift between 20 and 30 dB. The mechanisms responsible for sound conditioning are not well known. The efferent system provides a likely candidate (see beyond: the inner-ear acoustic reflex). However its actual efficiency is still a matter of controversy (i.e., systemic stress protects also against noise trauma in sham operated / sham de-efferented guinea pigs [33]). There are many biochemical changes that could explain sound conditioning effects. Reactive oxygen species (ROS) and an increase in Ca2+ are considered to be the two main streams of damage leading to hair cell death. However, the generalized stress response of noise exposure increases the expression of glucocorticoids and of heat shock proteins that induce an upregulation of antioxydants enzymes: endogenous antioxydants (i.e., glutathione) could protect hair cells by scavenging the Reactive Oxygen Species. Sound conditioning can be induced by different paradigms. The first uses low-level, non-damaging continuous acoustic stimulus (no TTS, no PTS, no cellular damage) before the traumatic exposure. The second uses an interrupted schedule at sound levels that produce a TTS during the first few days of exposure. Both paradigms work and their efficiency has been demonstrated in many animal species. The "sound conditioning" or "toughening" phenomenon (acquired resistance to NIHL) is not especially remarkable and unique per se. Analogous phenomena have been known for a long time and many biological and physiological situations are concerned. Generally speaking, any organism is able to progressively adapt itself to cope with (moderately) noxious agents and/or environmental conditions. The main interest of the "sound conditioning" studies is that they allow to better understand the biochemical and molecular mechanisms that are associated to an overstimulation of the ear and to design new medical treatments to prevent and/or to treat the Noise-Induced Hearing Loss. 5. Prevention and Treatment of Noise-Induced Hearing Loss In France, for the four years 1993 to 1996, 2,762 soldiers presenting an acute acoustic trauma have been treated in the ENT departments of the military hospitals (total number of days of hospitalization > 10,000) (medical cost in 1996: ~ 4 million dollar). In Germany, the medical cost is about 2.5 million dollar a year. In other countries (United Kingdom, USA...), the soldiers in the same situation are just withdrawn from hazardous noise exposure and medical treatment is not systematically implemented, but the figures are impressive just the same: in the Israeli Army 25 % of the recuits exposed to rifle fire present PTS, in the USA 11% of Army Special Forces personnel and Marines have PTS after 3-5 days of livefire training ! In the US Navy, 5 to 10% of an aircraft carrier crew has compensable and disabling hearing loss, with another 13% transitioning from hearing impairment to early stages of hearing disability. The acoustic trauma represents the first cause of morbidity in the military during peace time and is responsible for many other expenses [34]. While lack of compliance with personal hearing protection and time-in-noise policies can account for some of these data, there are inherent limitations to the use of hearing protectors (earplugs, earmuffs). In the real world (i) physical activity, perspiration, eye glasses may break the air-tight seal of earmuffs, (ii) attenuation of critical communication and situational awareness by effective hearing protectors may lead to user non-compliance, (iii) in combat scenarios the soldier cannot always anticipate damaging noises and have the personal hearing protection in place, (iv) the sound level may exceed the protective capacity of the hearing protection devices. These limitations to hearing protection and engineering strategies must be considered and countered [35].

Hearing and Hearing Protection
1 - 14 RTO-EN-HFM-111
Considering the important consequences of NIHL for the health of the soldiers and the associated costs, it is necessary to define alternative strategies to prevent and/or to reverse NIHL. Prevention: as pointed out by Kopke et al. [35], the training operations that place people at risk are often relatively short and planned in advance. Therefore, an effective agent to increase the ear's resistance to noise damage could be given for proscribed periods. Animal experiments indicate that the enhancement of the cochlear antioxydant defence (anti Reactive Oxygen Species) reduce NIHL and hair cell loss both for continuous and impulse noise. In animals, it is possible to place the drug in the middle ear on the round window membrane or even directly into the cochlea (perfusion of a glutamate or a dopaminergic agonist) [36]. This is not clinically feasible in man. Therefore, it is necessary to look for orally administered compounds with proven antioxydant efficacy. Kopke et al. [35] chose L-N-acetylcysteine, a FDA-approved oral agent (given to counteract liver damage in case of acetominophen overdose) that has few side-effects, in combination with salicylate. These drugs, when given to chinchillas as a preventive (one hour before noise administration and immediately after), reduce significantly the PTS and the hair cell loss due to prolonged continuous noise (4 kHz octave band noise, 105 dB SPL, 6 hours). The figure 19 allows to compare the percentage of missing OHC and IHC in animals protected by the administration of L-NAC and salicylate and in controls 2 weeks post-exposure. There was a 50-80% reduction in hearing loss and a similar reduction in hair cell loss. D-methionine (that enhances the synthesis of the important antioxydant glutathione) and vitamin E have also demonstrated a protective effect.
Figure 19: Cytocochleograms following noise-exposure (A: controls) (B: protected) (Kopke et al., [35])
Treatment: Most cases of NIHL will involve rather small graduated decrements in hearing that build upon each previous intensive exposure [35]. However, there are also cases of sudden NIHL of moderate to severe degree occuring within minutes or hours in response to extremely loud continuous or impulse noise. In case of mild to severe hearing loss after an accident or period of intense exposure, a rescue strategy is attractive. There may be a long period of time from the initial injury to when the hair cells are actually lost, resulting in PTS (figure 20). During those ensuing days or even weeks, cells undergo processes to repair themselves, or cell death programs (apoptosis, see beyond) may be initiated as a method of eliminating nonfunctional cells that cannot be repaired. Thus, there would appear to be a potential "therapeutic window" of time when hair cell repair could be enhanced and/or cell death pathways could be inhibited (Kopke et al., [35]).

Hearing and Hearing Protection
RTO-EN-HFM-111 1 - 15
Figure 20: Evolution of the cell damage (top: 30 min, bottom: 2 days after exposure) (B and E correspond to the central place of damage, A-D and C-F to adjacent locations) (according to Henderson et al, [37])
Before describing the new medical treatments that are under development, it is necessary to evaluate the actual efficiency of the present medical treatments that are currently implemented in the ENT departments of the (French, German, ...) military hospitals. Given the difficulties to assess the actual efficiency of those treatments in man (ignorance of the pre-exposure hearing condition, ignorance of the noise exposure parameters, use of different treatments, various implementation delays, difficulties to differentiate between the normal physiological recovery and the medical assisted recovery, impossibility to perform morphological observations of the sensory organ, ethical problems prohibiting the use of control groups...), the best approach is to use animal experimentation. D’Aldin et al. [38] studied the efficiency of the classical treatments of the acoustic trauma in guinea pigs (traumatic exposure: one-third octave band noise centered on 8 kHz at 129 dB SPL during 20 minutes). For each group of animals (n = 10), the treatment begins 1 hour after the end of the exposure and lasts for 5 days. The recovery is observed up to 14 days post-exposure (electrocochleography). Then, histological damage is assessed by scanning electron microscopy. Carbogen therapy: Carbogen is considered one of the most powerful vasodilators of cerebral capillary beds. It is supposed to improve micro-circulation and oxygenation and is an example of the blood flow promoting therapies (analogous to the administration of hydroxyethyl starch - HES - that increases plasma volume, thereby decreasing plasma viscosity). Carbogen mixture (7% carbon dioxide and 93% oxygen) is delivered at ambient pressure and at a constant flow rate for 1 hour, twice a day. No significant difference (audiograms or cochleograms) is observed between the controls and the treated animals. Isobaric oxygen therapy : The idea that inhalation of pure oxygen could be used as a treatment is based on studies that have shown that high-intensity noise causes cochlear hypoxia [39]. Pure oxygen is delivered at ambient pressure and at a constant flow rate for 1 hour, twice a day. No significant difference is observed between controls and treated annimals 14 days after the acoustic trauma. Hyperbaric oxygen therapy : The aim of this therapy is to significantly improve partial oxygen pressure in inhaled air and consequently in the cochlea (blood and cochlear liquids). At 2 ATA, the amount of oxygen and blood-dissolved oxygen fraction are multiplied by 10. The animals are placed inside a pressure chamber that is pressurized at 2.5 ATA with 100% oxygen. The pressure is then held for 1 hour, twice a day. The threshold shifts at day 14 are higher and cochlear damage is greater in treated animals than in controls. Therefore, the hyperbaric oxygen therapy should not be used -alone - as an acute treatment. Antiphlogistic therapy: According to Lamm and Arnold [40], the rationale for administration of anti-inflammatory agents is based on the observation that inflammatory tissue alterations are elicited by physically induced cellular damage, tissue hypoxia and tissue ischemia. In non-cochlear mechanically induced and/or hypoxic tissue an abnormal histamine liberation and/or a release of prostaglandine, has been observed. Lamm and Arnold [40] have shown that prednisolone and diclofenac do not relieve progressive noise-induced cochlear hypoxia and post-traumatic ischemia but induce a partial restoration of CM and CAP amplitudes. These findings indicate direct cellular effects of diclofenac and prednisolone in the cochlea. In the experiment of d'Aldin et al., methylprednisolone hemisuccinate (2, 20, 40 or 100 mg/kg) is given once a day by IM injection. With a dose of 20 mg/kg, the TS at day 14 and the cochear damage are smaller than in controls (but doses smaller than 10 mg/kg look ineffective) (figures 21 and 22). If the treatment begins 24 hours after the exposure

Hearing and Hearing Protection
1 - 16 RTO-EN-HFM-111
instead of 1 hour, the results are very similar. The corticoid therapy is effective within a "time window" of (at least) 24 hours.
Figure 21: TS observed at day 14 in controls and in corticoid treated animals (20 mg/kg) [38]
Figure 22: Cochleograms: cochlear damage observed 14 days after the trauma (left column: controls, right column: corticoid treated) (black areas: intact,
gray areas: damaged, white areas: destroyed cells) (mean of 10 animals) [38]

Hearing and Hearing Protection
RTO-EN-HFM-111 1 - 17
Combined hyperbaric oxygen – antiphlogistic therapy: Corticoids induce oxygen consumption to mobilize amino acid for glucogenesis and to alter glucose utilization by oxygen-consuming mechanisms. Moreover, acoustic overstimulation induces cochlear hypoxia. Thus, it looks interesting to combine corticoid and hyperbaric oxygen treatment. Improving partial oxygen pressure in inhaled air could compensate for the decline in partial oxygen pressure and thus potentiate corticoid effect. In the d'Aldin's experiment, animals receive corticoids (20 mg/kg) and breathe hyperbaric oxygen (2.5 ATA). The results indicate that combined corticoid and hyperbaric therapies significantly improve functional and, in a very striking way, morphological recovery. These results are in agreement with those of Lamm et al., [40,41]. These findings indicate that effective treatment modalities of acute noise-induced hearing loss are presently available, and second that the therapeutic effects are not directly associated with blood-flow promotion and re-oxygenation, but involve other effects on the cellular level. 6. Perspectives New treatments A lot remains to be done: (i) to investigate the interest of other drugs (magnesium [42,43]…) and the influence of the delay of implementation of the treatments, (ii) to assess the interest of local treatments (i.e., medicaments applied directly to the inner ear, figure 23 [44,45]) that could be used together with the systemic treatments (or alone), (iii) to evaluate the interest of new treatments that take advantage of the last advances in molecular biology (anti-oxydants, neurotransmitters agonists or antagonists, growth factors...) and could, besides cell preservation and a better recovery of the NIHL, decrease the annoyance due to noise exposure related effects, like tinnitus.
Figure 23: Round Window Microcatheter used to deliver drugs
directly into the inner ear (Kopke et al., [35])
Regeneration The mammalian organ of Corti is composed of sensory hair cells and non-sensory supporting cells. After birth, loss of hair cells is permanent and there is no evidence of spontaneous regeneration. However, in several non-mammalian species, hair cells regenerate spontaneously in response to sound trauma (by proliferation of the adjacent supporting cells) [46]. Inhibitors molecules that are present in the mammalian cochlea soon after birth prevent hair cell renewal [35]. As we'll learn more about which proliferation inhibitors and trophic factor receptors are present in the adult noise-injured Corti's organ, some combination of trophic factor exposure with antisense inhibition of the expression of proliferation inhibitors may be used to allow mammalian cochlear regenerative recovery. 7. Conclusion The military environment is filled with a variety of noise hazards. Hearing loss degrades the operational effectiveness of the soldiers, negatively impacts the quality of life of the personnel and entails huge financial costs (i.e., compensation).

Hearing and Hearing Protection
1 - 18 RTO-EN-HFM-111
Solving these problems requires a good understanding of the various mechanical and physiological phenomena that are responsible for the existence of the Noise-Induced Hearing Loss, and of the different biological mechanisms and/or medical possibilities allowing to protect the ear. REFERENCES 1. Shaw E.A.G., “The external Ear”, in “Handbook of Sensory Physiology”, W.D. Keidel and W.D. Neff Eds.,
Springer Verlag, V/1, 1974, 455 2. Puria S., Peake W.T. and Rosowski J.J., “Sound-pressure measurements in the cochlear vestibule of human-
cadaver ears”, J. Acoust. Soc. Am., 101(5), 1997, 2754 3. Rosowski J.J., “The effects of external- and middle-ear filtering on auditory threshold and noise-induced hearing
loss”, ”, J. Acoust. Soc. Am., 90(1), 1991, 124 4. Price G.R., “Hazard from intense low-frequency acoustic impulses”, J. Acoust. Soc. Am., 80, 1986, 1076 5. Patterson J.H., Hamernik R.P., Hargett C.E. and Ahroon W.A. (1993), "An isohazard function for impulse
noise", J. Acoust. Soc. Am., 93, 1993, 2860 6. Zwislocki J.J., « The role of the external and middle ear in sound transmission », in “The Nervous System”, vol.
3 “Human Communication and its Disorders”, D.B. Tower Ed., Raven Press, New York, 1975, 45 7. Price G.R. and Kalb J.T., (1991) "Insights into hazard from intense impulses from a mathematical model of the
ear", J. Acoust. Soc. Am., 90, 1991, 219 8. Saunders J.C. and Flock A., "Recovery of threshold shift in hair-cell stereocilia following exposure to intense
stimulation", Hearing Res., 23, 1986, 233 9. Robertson D., "Functional significance of dendrite swelling after loud sounds in the guinea pig cochlea",
Hearing Res., 9, 1983, 263 10. Ylikoski J., Xing-Qun L., Virkkala J., von Numers M. and Pirvola U., "Molecular mechanisms of the death
of auditory cells by noise", in: "Noise Induced Hearing Loss: Basic Mechanisms, Prevention and Control", Eds. D. Henderson, D. Prasher, R. Kopke, R. Salvi and R. Hamernik, Noise Research Network Publications, London, 2001,89
11. Peters, L., Garinther, G., "The effects of speech intelligibility on crew performance in an M1A1 tank simulator", US Army Human Eng. Lab,Techn. Memorandum, 1990, 11
12. Ward, W.D., “The concept of susceptibility”, J. Occup. Med. 7, 1965, 595 13. Bonaccorsi, P., “U colore dell’iride cone “test” di Valutazione quantitativa, nell’nemo della concentratione di
melamina nella striavasculare”, Annali Lar. Otol. Rhinol. Fraing., 64, 1965, 725 14. Carhart, R.H., “Updating special hearing tests in otological diagnosis”, Arch. Otolaryngol., 97, 1973, 88 15. Humes, L.E., “Review of four new indices of Susceptibility to Noise-Induced-Hearing-Loss”, J. Occup. Med., 19,
1977, 116 16. Botte, M-C., Baruch C. and Dancer, A., “TTS as a function of exposure frequency”, J. Acoustique, 3, 1990, 53 17. Dancer, A., “Use of animal models in the study of the effects of noise on hearing”, in “Occupational Medicine:
State of the Art Reviews”, Hanley and Belfus Eds., Philadelphia, 10, 1995, 535 18. Hohansson, B., Kylin, B. and Langfy, M., “Acoustic reflex as a test of individual susceptibility to noise”, Acta
Otolaryngol., 64, 1967, 256 19. Rajan, R., “Protective functions of the efferent pathways to the mammalian cochlea: a review”, in “Noise-
Induced Hearing Loss”, Dancer A. et al. Eds., Mosby Year Book, 1992, 429 20. Temkin, J., “Die Schädigung des Ohres durch Lärm und Erschütterung”, Mschr. Ohrenheilk. und Laryngo-
Rhinologie, 67, 1993 21. Kryter, K.D., Ward, W.D., Miller, J.D. and Eldredge D.H., “Hazardous exposure to intermittent and steady-state
noise”, J. Acoust. Soc. Am., 39, 1966, 451 22. Buck, K. and Franke, R., “Can TTS be an indicator for individual susceptibility to PTS?”, in “Basic and Applied
Aspects of Noise-Induced Hearing Loss”, Salvi R.J. et al., Eds., NATO ASI Series A: Life Sciences, 111, 1986, 441
23. Job, A., Raynal, M. and Rondet, Ph., “Hearing loss and use of personal stereos in young adults with antecedents of otitis media”, The Lancet, 353, 1999, 35
24. Loth, D., Avan, P., Menguy, C., Bisaro, F. and Teyssou, M., “Study of the latency and the rise time of the acoustic reflex as a function of the parameters of the acoustic stimulus”, Acustica, 63, 1987, 256
25. Dancer, A., Grateau, P., Cabanis, A., Lejeau, J. and Lafont, D., “Influence of spacing of impulse noises (weapon noises) on the amplitude of the TTSs in man”, J. Acoustique, 4, 1991, 421
26. Mil-STD 1474B (M2), “Military Standard: Noise limits for Army materiel”, Dept. of Defense, USA, 1984 27. Pujol, R., “Cochlear physiology and pathophysiology recent data”, Drugs of Today, 26(Suppl. 13), 1990, 43
Hearing and Hearing Protection
RTO-EN-HFM-111 1 - 19
28. Guinan J.J., "Physiology of olivocochlear efferents", in: "The Cochlea", P. Dallos, A.N. Popper and R.R. Fay eds., Springer New York, 1996, 435
29. Henderson D., Zheng X. and McFadden S., "Cochlear efferent system - A factor in susceptibility to noise?" in: "Noise-induced Hearing Loss", Eds. D. Henderson, D. Prasher, R. Kopke, R. Salvi and R. Hamernik, Noise Research Network Publications, London, 2001, 127
30. Rajan R., "Effect of electrical stimulation of the crossed olivocochlear bundle on temporary threshold shifts in auditory sensitivity. II Dependence on the level of temporary threshold shifts", J. Neurophysiol. 60, 1988, 569
31. Maison, S.F. and Liberman, M.C., "Predicting vulnerability to acoustic injury with a noninvasive assay of olivocochlear reflex strength", J. Neurosci., 20, 2000, 4701
32. Niu, X. and Canlon, B., "Theories of sound conditioning", in: "Noise-induced Hearing Loss", Eds. D. Henderson, D. Prasher, R. Kopke, R. Salvi and R. Hamernik, Noise Research Network Publications, London, 2001, 255
33. Kujawa, S.G. and Liberman M.C., "Conditioning-related protection from acoustic injury: effects of chronic deefferentiation and sham surgery", J. Neurophysiol., 78, 1997, 3095
34. Ohlin, D., “Cost Effectiveness of Hearing Conservation Programs”, in: "Damage Risk from Impulse Noise", RTO Lecture Series 219, RTO-EN-11 AC/323(HFM)TP/31, NATO, 2000, 6-1
35. Kopke et al., "Novel strategies to prevent and reverse noise-induced hearing loss", in: "Noise-Induced Hearing Loss", Eds. D. Henderson, D. Prasher, R. Kopke, R. Salvi and R. Hamernik, Noise Research Network Publications, London, 2001, 231
36. Puel, J-L. et al., “Protective effect of glutamate antagonist kynurenate on noise-induced hearing loss”, in “Advances in Noise Research: Biological Effects of Noise”, Prasher, D. and Luxon, L., Eds., Whurr London, 1, 1998, 261
37. Henderson, D. et al., "Noise-induced cell death: strategies for protection", in "Proceedings 8th ICBEN", Rotterdam 29 June-3 July 2003, 11
38. d’Aldin, Ch., Cherny, L., Devrière, F. and Dancer, A., “Treatment of acoustic trauma”, in “Ototoxicity” Henderson et al., Eds., Annals of the New York Acad. of Sc. 884, 1999, 328
39. Lamm, K. and Arnold, W., “Noise-induced cochlear hypoxia is intensity dependent, correlates with hearing loss, and precedes reduction of cochlear blood flow”, Audiol. Neurootol., 1, 1996, 148
40. Lamm, K. and Arnold, W., “Successful treatment of Noise-Induced Cochlear Ischemia, Hypoxia, and Hearing Loss”, in “Ototoxicity” Henderson et al., Eds., Annals of the New York Acad. of Sc. 884, 1999, 233
41. Lamm, K. and Arnold, W., “The effect of prednisolone and non-steroidal anti-inflammatory agents on the normal and noise-damaged guinea pig inner ear”, Hear. Res., 115, 1998, 149
42. Scheibe, F., Haupt, H., Mazurek, B. and König, O., "Therapeutic effect of magnesium on noise-induced hearing loss", ”, ", in: "Noise-Induced Hearing Loss", Eds. D. Henderson, D. Prasher, R. Kopke, R. Salvi and R. Hamernik, Noise Research Network Publications, London, 2001, 285
43. Attias, J. and Bresloff, I., “Oral magnesium reduces noise induced temporary and permanent hearing loss”, in “Cochlear Pharmacology and Noise Trauma”, Prasher, D. and Canlon, B., Eds., Noise Research Network Publications, London, 1999, 43
44. Dauman, R., “Preliminary thoughts on the type of patients who could benefit from in situ pharmacology”, in “Cochlear Pharmacology and Noise Trauma”, Prasher, D. and Canlon, B., Eds., Noise Research Network Publications, London, 1999, 191
45. Hoffer, et al., "Clinical results with the round window microcatheter and microdose gentamicin in the treatment of Meniere's disease", in: Proc. of the 4th Int. Symp. on Meniere's Disease, Kugler Publications, The Netherlands, 2000, 605
46. Corwin, J.T. and Cotanche, D.A., "Regeneration of sensory hair cells after acoustic trauma", Science, 1988, 240, 1772
47. Gervais d'Aldin Ch., "Implication du glutamate dans les processus de neurotransmission et de réparation synaptique de la cochlée", PhD Thesis, Univ. of Montpellier, France, December 1996
Hearing and Hearing Protection
1 - 20 RTO-EN-HFM-111
RTO-EN-HFM-111 2 - 1
Passive Hearing Protection Systems and Their Performance
Mr. Richard McKinley AFRL/HECB Wright Patterson AFB 2255 H Street Ohio 45433-7022
Ms. Valerie BJORN Navel Air Systems Command Research and Engineering UNITED STATES
ABSTRACT While ideally noise should be reduced at the source, in the military environment the most effective solution in terms of both cost and operational effectiveness has been to provide personnel with personal hearing protection. This protection may be in the form of either an earplug that occludes the ear canal or a circumaural protector that inserts a barrier between the ambient noise and the ear. For both devices the level of passive protection provided changes with frequency. A great deal of research was conducted in the 1940/50s to define the mechanisms and parameters that appeared to limit the performance of these types of protectors and this presentation will provide an overview of the findings of this early research. By the 1970s the performance of such devices, particularly those used in military applications, had been best optimized for use with the types of cranial protection being worn by soldiers, sailors, and aircrew. Since that time the major thrust in hearing protection enhancement has been the development and integration of Active Noise Reduction (ANR) systems where an electronic circuit is incorporated into the device to provide additional active attenuation in addition to the passive attenuation. ANR has provided significant benefits in low frequency attenuation and provides complementary performance to the passive device. However, for future military noise environments ANR headsets and ANR earplugs will not individually provide sufficient levels of protection, and passive earplugs and earmuffs may have to be used in some combination to provide adequate hearing protection. Recent research developments have resulted in improved passive earplug and earmuff attenuation performance. Deep inserted custom earplug performance and custom earmuff/earcushion design techniques have provided a substantial increase in hearing protection. Issues associated with the fitting of personal hearing protection and their performance in the field will also be discussed. INTRODUCTION Noise of sufficient intensity and duration can cause irrepairable damage to human hearing. High intensity noise has traditionally been associated with many military vehicles, especially airplanes and helicopters, Dancer (8) and James (11). However, the process of incurring a hearing loss is insidious. The person has little or no warning that the hearing loss is occurring other than possibly a little ringing in the ears. Once hearing sensitivity has been lost, it is thought to be impossible to reclaim. The only workable solution has been prevention, i.e. limiting the noise exposure by either reducing the time of exposure and/or reducing the intensity of the noise at the ear. The reduction in duration of exposure is usually so onerous that the person cannot reasonably accomplish the required work in the reduced time. Many times the required reduction is a factor of 10 or more. Noise intensity can be reduced at the source, in the path, and at the person. Source reduction and path reductions of noise are expensive and many times severely limit the performance of the vehicle or other system. Reductions of noise at the person have proven to be the most effective and least costly of the options.
Paper presented at the RTO HFM Lecture Series on “Personal Hearing Protection including Active Noise Reduction”, held in Warsaw, Poland, 25-26 October 2004; Belgium, Brussels, 28-29 October 2004;
Virginia Beach, VA, USA, 9-10 November 2004, and published in RTO-EN-HFM-111.

Passive Hearing Protection Systems and Their Performance
2 - 2 RTO-EN-HFM-111
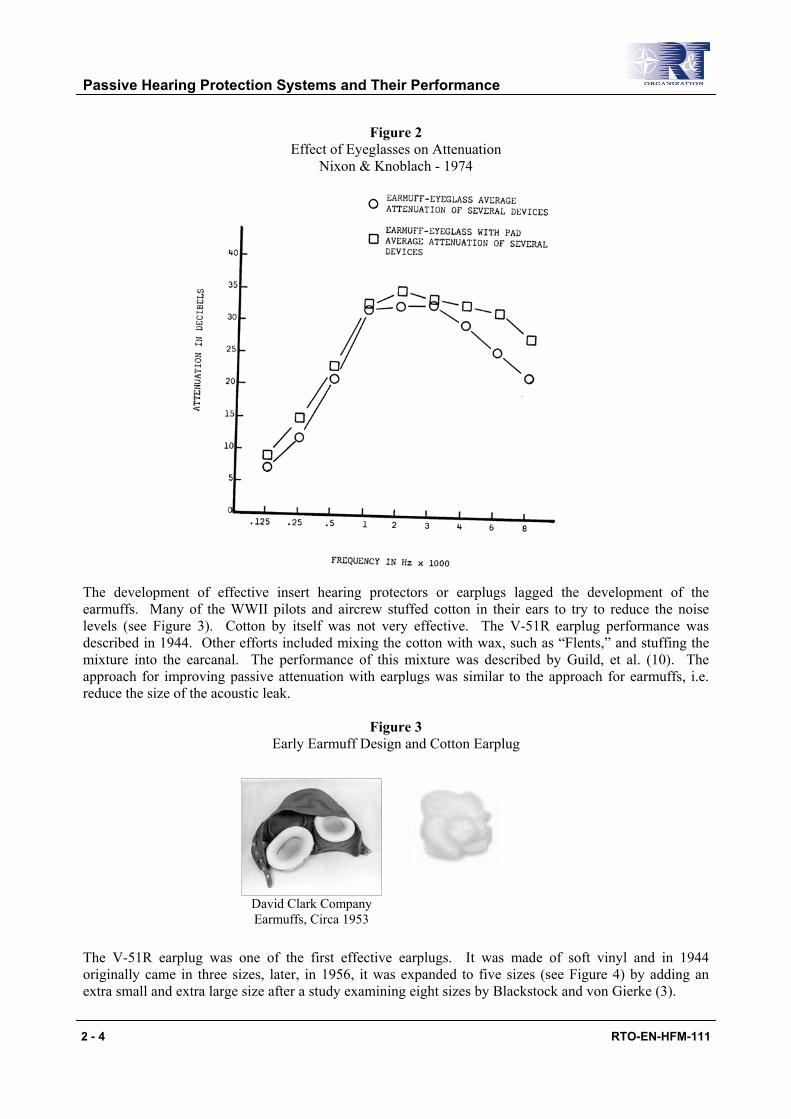
Currently, two basic types of personal noise reduction approaches are in use. Passive noise reduction and active reduction are most often used in combination, and frequently passive noise reduction is used in isolation. Passive noise reduction systems, earmuffs and earplugs, and their performance in continuous noise environments are the subjects of this report. Active noise reduction devices and their performance along with performance of hearing protectors in impulse noise are the subjects of other reports in this lecture series. BACKGROUND The first hearing protectors, the fingers, were passive noise reducers and in reality are one of the better performing passive noise reduction systems. However, it is hard to work with the index fingers of your left and right hands pressing against the ears. Passive hearing protectors have been divided into two general categories, circumaural hearing protectors or earmuffs, and insert protectors or earplugs. Each general group can also be divided into subgroups as those described by Nixon (17). The first headsets used in aircraft provided a mounting location for earphones but no real hearing protection. It was not until the end of WWII that hearing conservation and hearing protection became an issue. Some of the first hearing protectors were constructed by taking glass jelly jars and dipping them in rubber, and mounting them on the side of the head. In the 1950s, Henning von Gierke (23) and Edgar Shaw (22) independently developed models of passive hearing protection performance. These two models identified the important parameters in passive hearing protector performance, mass, volume under the earcup, headband tension, earcushion compliance, acoustic leaks, and absorption in the earcup. Both of these models were realized as analogous electrical circuits (an example of Shaw’s model is shown in Figure 1). The size of the acoustic leak between the hearing protector and the head has a dramatic effect on passive hearing protector performance. Saunders and Homma (20) have used finite element modeling to construct a new model of passive hearing protector performance. One of the more important parameters of passive earmuff performance in their model is the size of the acoustic leak. Others such as Johnson (13) have examined the effects of headband tension on passive attenuation while Nixon and Knoblach (15) investigated the effect of eyeglasses on hearing protection provided by earmuffs. One could conjecture that the effect of headband tension could be just the minimization of acoustic leaks by the increased headband force. Similarly, the eyeglasses cause acoustic leaks which also affect passive attenuation. Nixon and Knoblach (15) described the effect of eyeglasses on earmuff noise attenuation as shown in Figure 2. Earcushions attempt to seal the leak between the earmuff and head but also affect passive attenuation as described by Shaw (21).

Passive Hearing Protection Systems and Their Performance
RTO-EN-HFM-111 2 - 3
Figure 1 Hearing Protector Performance Model
Shaw – 1980
Passive Hearing Protection Systems and Their Performance
2 - 4 RTO-EN-HFM-111
Figure 2 Effect of Eyeglasses on Attenuation
Nixon & Knoblach - 1974
The development of effective insert hearing protectors or earplugs lagged the development of the earmuffs. Many of the WWII pilots and aircrew stuffed cotton in their ears to try to reduce the noise levels (see Figure 3). Cotton by itself was not very effective. The V-51R earplug performance was described in 1944. Other efforts included mixing the cotton with wax, such as “Flents,” and stuffing the mixture into the earcanal. The performance of this mixture was described by Guild, et al. (10). The approach for improving passive attenuation with earplugs was similar to the approach for earmuffs, i.e. reduce the size of the acoustic leak.
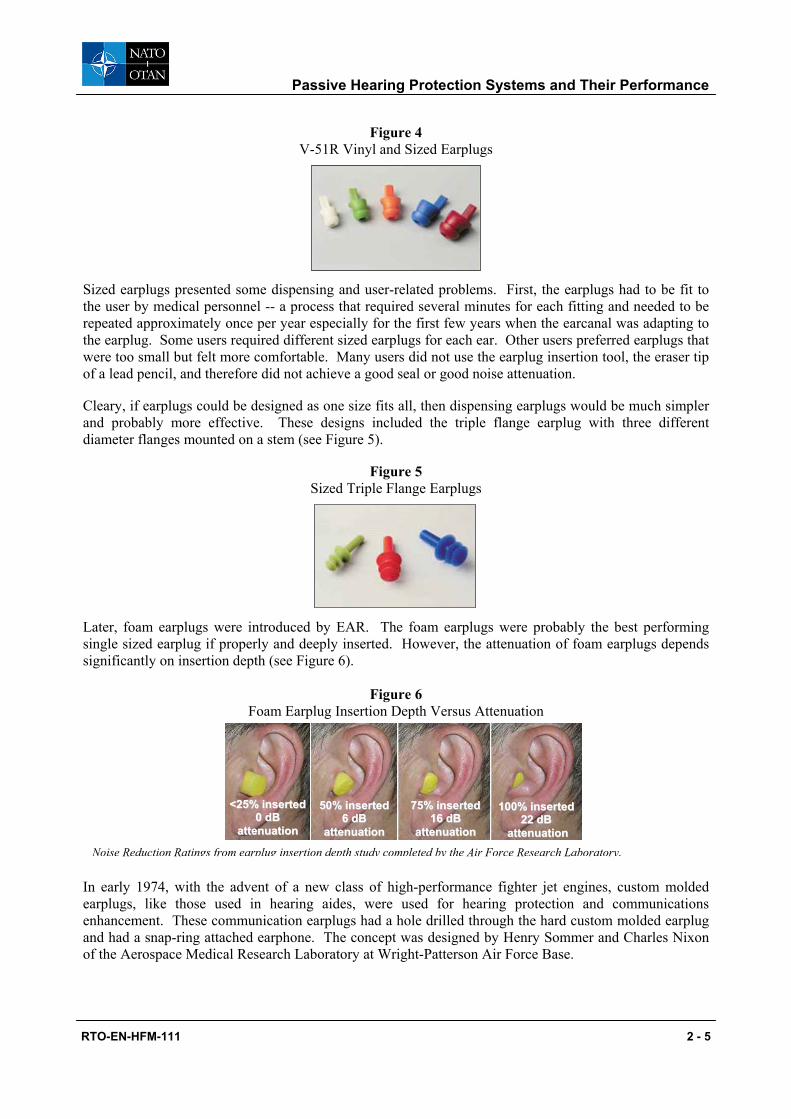
Figure 3 Early Earmuff Design and Cotton Earplug
The V-51R earplug was one of the first effective earplugs. It was made of soft vinyl and in 1944 originally came in three sizes, later, in 1956, it was expanded to five sizes (see Figure 4) by adding an extra small and extra large size after a study examining eight sizes by Blackstock and von Gierke (3).
David Clark Company Earmuffs, Circa 1953
Passive Hearing Protection Systems and Their Performance
RTO-EN-HFM-111 2 - 5
Figure 4 V-51R Vinyl and Sized Earplugs
Sized earplugs presented some dispensing and user-related problems. First, the earplugs had to be fit to the user by medical personnel -- a process that required several minutes for each fitting and needed to be repeated approximately once per year especially for the first few years when the earcanal was adapting to the earplug. Some users required different sized earplugs for each ear. Other users preferred earplugs that were too small but felt more comfortable. Many users did not use the earplug insertion tool, the eraser tip of a lead pencil, and therefore did not achieve a good seal or good noise attenuation. Cleary, if earplugs could be designed as one size fits all, then dispensing earplugs would be much simpler and probably more effective. These designs included the triple flange earplug with three different diameter flanges mounted on a stem (see Figure 5).
Figure 5 Sized Triple Flange Earplugs
Later, foam earplugs were introduced by EAR. The foam earplugs were probably the best performing single sized earplug if properly and deeply inserted. However, the attenuation of foam earplugs depends significantly on insertion depth (see Figure 6).
Figure 6 Foam Earplug Insertion Depth Versus Attenuation
In early 1974, with the advent of a new class of high-performance fighter jet engines, custom molded earplugs, like those used in hearing aides, were used for hearing protection and communications enhancement. These communication earplugs had a hole drilled through the hard custom molded earplug and had a snap-ring attached earphone. The concept was designed by Henry Sommer and Charles Nixon of the Aerospace Medical Research Laboratory at Wright-Patterson Air Force Base.
110000%% iinnsseerrtteedd 2222 ddBB
aatttteennuuaattiioonn
7755%% iinnsseerrtteedd 1166 ddBB
aatttteennuuaattiioonn
5500%% iinnsseerrtteedd 66 ddBB
aatttteennuuaattiioonn
<<2255%% iinnsseerrtteedd 00 ddBB
aatttteennuuaattiioonn
Noise Reduction Ratings from earplug insertion depth study completed by the Air Force Research Laboratory.

Passive Hearing Protection Systems and Their Performance
2 - 6 RTO-EN-HFM-111
In many military environments, insufficient hearing protection or attenuation was provided by a single earplug or earmuff. In these high noise environments, such as jet engine maintenance or the operations of a flight deck of an aircraft carrier, double protection, earplugs under an earmuff, was employed. However, the overall attenuation of the combination was not the sum of the individual device attenuations. A part of the explanation has to do with conduction of acoustic energy to the cochlea via pathways other than the earcanal/middle ear. These alternate pathways include bone and tissue conduction of noise to the cochlea. The effects of these paths were described by Zwislocki and separately by Nixon and Von Gierke (14), see Figure 7. Berger (1) used an average of the Zwislocki and Nixon data as an estimate of the bone conduction effects. Once the attenuation of the earplugs and earmuffs is sufficient, the bone/tissue conduction path becomes an alternate and sometimes predominant pathway for acoustic energy to reach the cochlea.
Figure 7 Acoustic Pathways – Air and Bone Conduction
Nixon and von Gierke - 1959
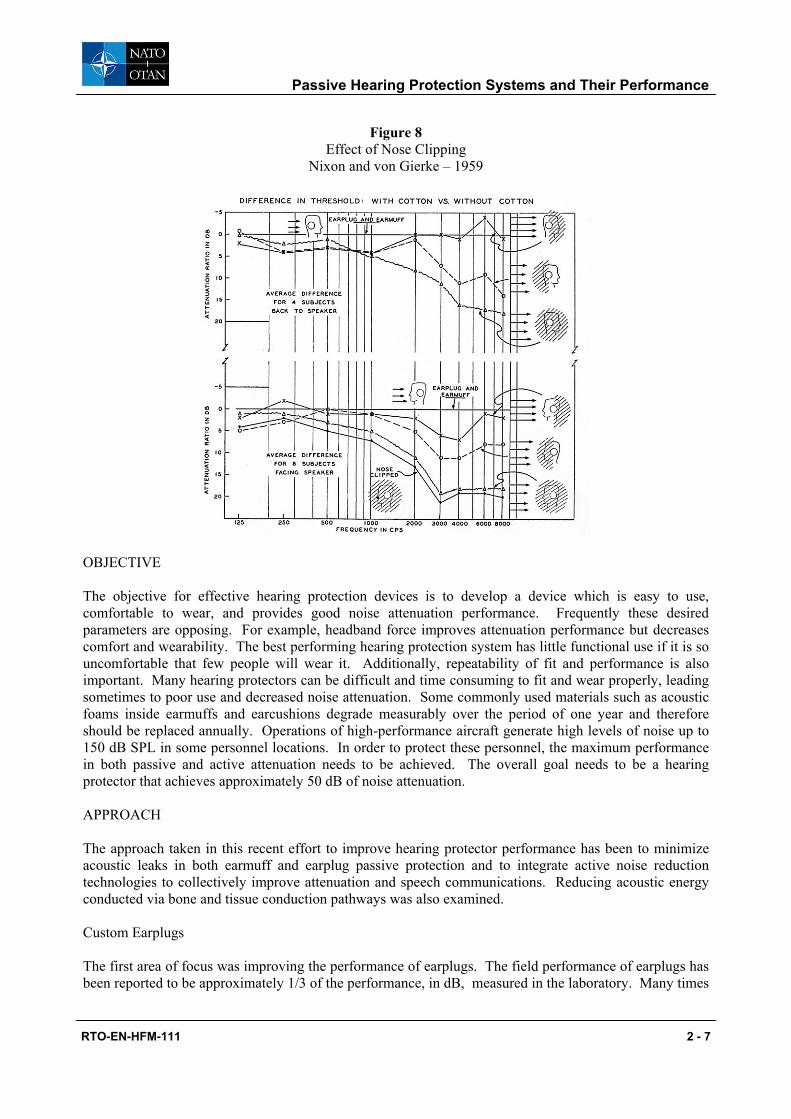
Nixon and von Gierke also investigated other factors, such as plugging the nose (Figure 8) while Franke, von Gierke, and von Witten (9) described the effects of jaw vibrations in bone/tissue conducted noise. Whether the jaw is closed or open can have a 3-5 dB effect on the bone conduction thresholds.
Passive Hearing Protection Systems and Their Performance
RTO-EN-HFM-111 2 - 7
Figure 8 Effect of Nose Clipping
Nixon and von Gierke – 1959
OBJECTIVE The objective for effective hearing protection devices is to develop a device which is easy to use, comfortable to wear, and provides good noise attenuation performance. Frequently these desired parameters are opposing. For example, headband force improves attenuation performance but decreases comfort and wearability. The best performing hearing protection system has little functional use if it is so uncomfortable that few people will wear it. Additionally, repeatability of fit and performance is also important. Many hearing protectors can be difficult and time consuming to fit and wear properly, leading sometimes to poor use and decreased noise attenuation. Some commonly used materials such as acoustic foams inside earmuffs and earcushions degrade measurably over the period of one year and therefore should be replaced annually. Operations of high-performance aircraft generate high levels of noise up to 150 dB SPL in some personnel locations. In order to protect these personnel, the maximum performance in both passive and active attenuation needs to be achieved. The overall goal needs to be a hearing protector that achieves approximately 50 dB of noise attenuation. APPROACH The approach taken in this recent effort to improve hearing protector performance has been to minimize acoustic leaks in both earmuff and earplug passive protection and to integrate active noise reduction technologies to collectively improve attenuation and speech communications. Reducing acoustic energy conducted via bone and tissue conduction pathways was also examined. Custom Earplugs The first area of focus was improving the performance of earplugs. The field performance of earplugs has been reported to be approximately 1/3 of the performance, in dB, measured in the laboratory. Many times
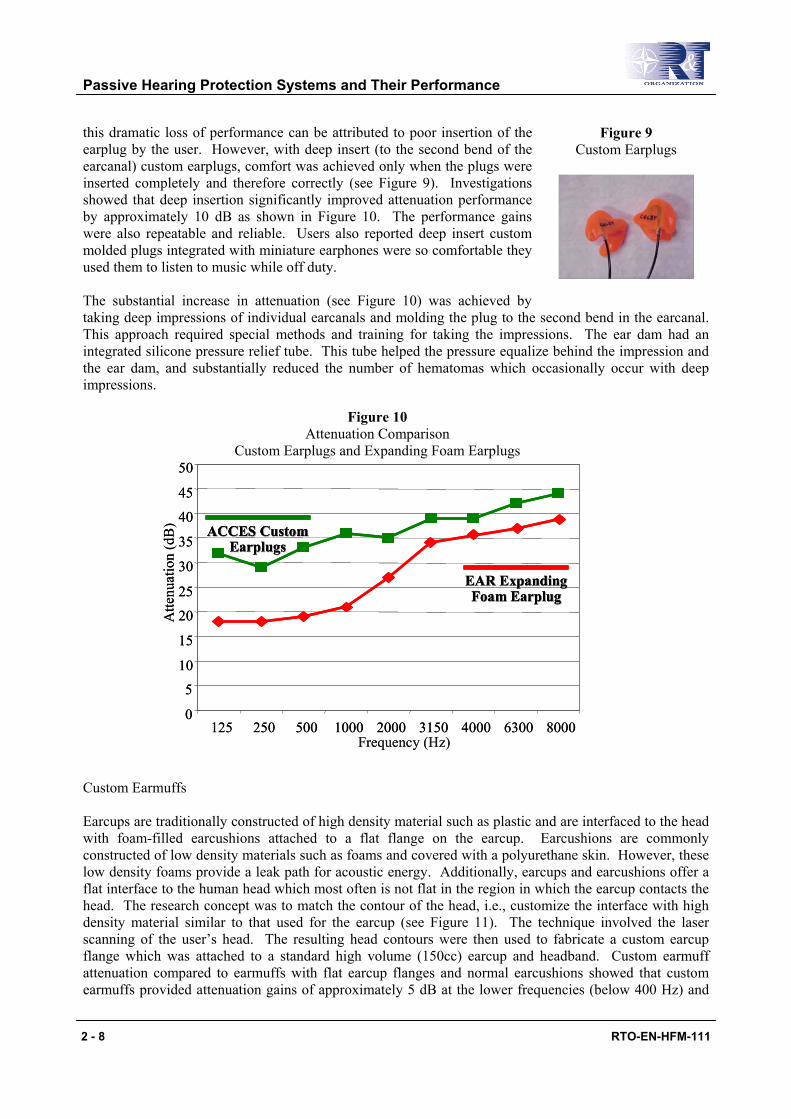
Passive Hearing Protection Systems and Their Performance
2 - 8 RTO-EN-HFM-111
this dramatic loss of performance can be attributed to poor insertion of the earplug by the user. However, with deep insert (to the second bend of the earcanal) custom earplugs, comfort was achieved only when the plugs were inserted completely and therefore correctly (see Figure 9). Investigations showed that deep insertion significantly improved attenuation performance by approximately 10 dB as shown in Figure 10. The performance gains were also repeatable and reliable. Users also reported deep insert custom molded plugs integrated with miniature earphones were so comfortable they used them to listen to music while off duty. The substantial increase in attenuation (see Figure 10) was achieved by taking deep impressions of individual earcanals and molding the plug to the second bend in the earcanal. This approach required special methods and training for taking the impressions. The ear dam had an integrated silicone pressure relief tube. This tube helped the pressure equalize behind the impression and the ear dam, and substantially reduced the number of hematomas which occasionally occur with deep impressions.
Custom Earmuffs Earcups are traditionally constructed of high density material such as plastic and are interfaced to the head with foam-filled earcushions attached to a flat flange on the earcup. Earcushions are commonly constructed of low density materials such as foams and covered with a polyurethane skin. However, these low density foams provide a leak path for acoustic energy. Additionally, earcups and earcushions offer a flat interface to the human head which most often is not flat in the region in which the earcup contacts the head. The research concept was to match the contour of the head, i.e., customize the interface with high density material similar to that used for the earcup (see Figure 11). The technique involved the laser scanning of the user’s head. The resulting head contours were then used to fabricate a custom earcup flange which was attached to a standard high volume (150cc) earcup and headband. Custom earmuff attenuation compared to earmuffs with flat earcup flanges and normal earcushions showed that custom earmuffs provided attenuation gains of approximately 5 dB at the lower frequencies (below 400 Hz) and
Figure 9 Custom Earplugs
Figure 10 Attenuation Comparison
Custom Earplugs and Expanding Foam Earplugs
Frequency (Hz)
ACCES Custom ACCES Custom EarplugsEarplugs
EAR Expanding EAR Expanding Foam EarplugFoam Earplug
0
5
10
15
20
25
30
35
40
45
50
125 250 500 1000 2000 3150 4000 6300 8000
Atte
nuat
ion
(dB
)
Frequency (Hz)
ACCES Custom ACCES Custom EarplugsEarplugs
ACCES Custom ACCES Custom EarplugsEarplugs
EAR Expanding EAR Expanding Foam EarplugFoam Earplug
EAR Expanding EAR Expanding Foam EarplugFoam Earplug
0
5
10
15
20
25
30
35
40
45
50
125 250 500 1000 2000 3150 4000 6300 8000
Atte
nuat
ion
(dB
)

Passive Hearing Protection Systems and Their Performance
RTO-EN-HFM-111 2 - 9
less at high frequencies (see Figure 12). Both the custom fit and normal fit earcups had identical internal volume and mass. Clearly, reducing the size of the acoustic leak by custom fitting the earcup and seal had a positive effect on the overall attenuation of the earmuff.
Figure 11 Head Shape Extraction and Resulting Custom Earmuff
ANR Earplugs The addition of active noise reduction to passive earmuffs and earplugs was needed to achieve the overall noise attenuation performance goal of 50 dB. Figure 13 shows the concept of ANR added to the deep insert custom earplug. The combination of a high performance earmuff, deep insert custom earplug, and active noise reduction in the earplug has demonstrated approximately 47 dB in overall noise attenuation in a broad band jet noise spectrum.
Figure 12 Attenuation of Custom Earcups and Standard Earcups
Atte
nuat
ion
(dB
SPL
)
Custom Earcups Custom Earcups w/ Putty Sealw/ Putty Seal
Standard Earcups Standard Earcups w/ Std Cushion Sealw/ Std Cushion Seal
Frequency (Hz)
Atte
nuat
ion
(dB
SPL
)
Custom Earcups Custom Earcups w/ Putty Sealw/ Putty Seal
Custom Earcups Custom Earcups w/ Putty Sealw/ Putty Seal
Standard Earcups Standard Earcups w/ Std Cushion Sealw/ Std Cushion SealStandard Earcups Standard Earcups
w/ Std Cushion Sealw/ Std Cushion Seal
Frequency (Hz)
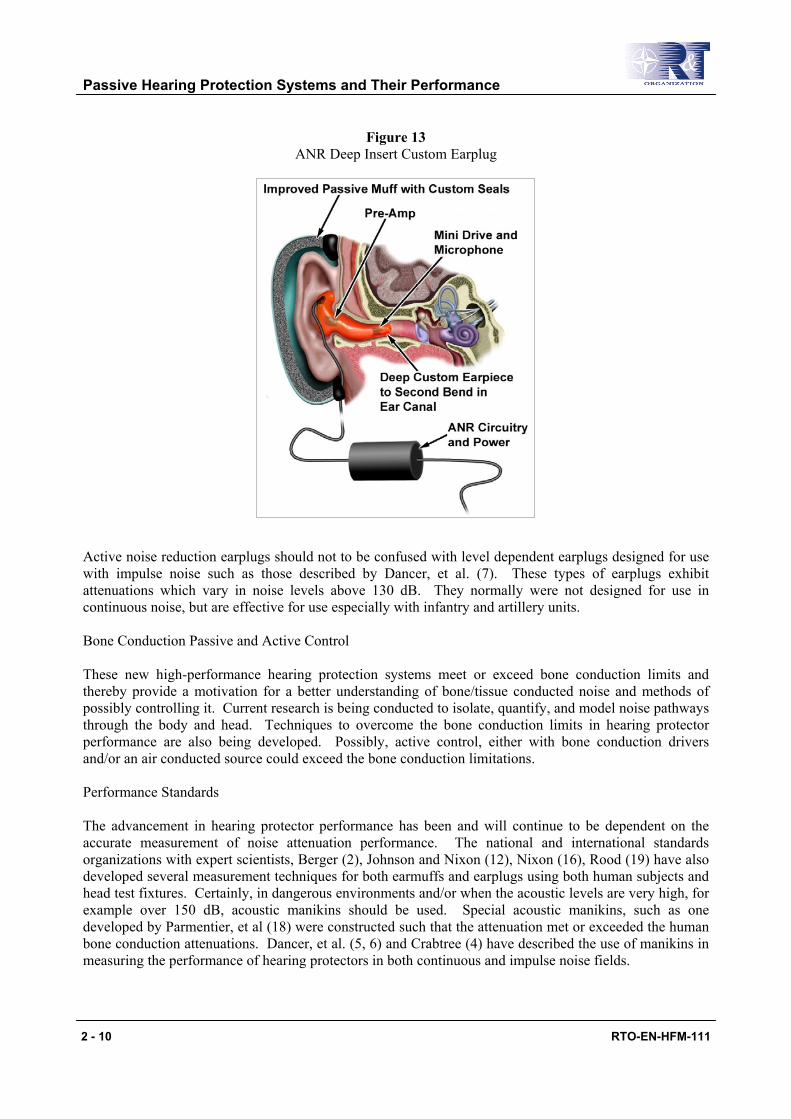
Passive Hearing Protection Systems and Their Performance
2 - 10 RTO-EN-HFM-111
Active noise reduction earplugs should not to be confused with level dependent earplugs designed for use with impulse noise such as those described by Dancer, et al. (7). These types of earplugs exhibit attenuations which vary in noise levels above 130 dB. They normally were not designed for use in continuous noise, but are effective for use especially with infantry and artillery units. Bone Conduction Passive and Active Control These new high-performance hearing protection systems meet or exceed bone conduction limits and thereby provide a motivation for a better understanding of bone/tissue conducted noise and methods of possibly controlling it. Current research is being conducted to isolate, quantify, and model noise pathways through the body and head. Techniques to overcome the bone conduction limits in hearing protector performance are also being developed. Possibly, active control, either with bone conduction drivers and/or an air conducted source could exceed the bone conduction limitations. Performance Standards The advancement in hearing protector performance has been and will continue to be dependent on the accurate measurement of noise attenuation performance. The national and international standards organizations with expert scientists, Berger (2), Johnson and Nixon (12), Nixon (16), Rood (19) have also developed several measurement techniques for both earmuffs and earplugs using both human subjects and head test fixtures. Certainly, in dangerous environments and/or when the acoustic levels are very high, for example over 150 dB, acoustic manikins should be used. Special acoustic manikins, such as one developed by Parmentier, et al (18) were constructed such that the attenuation met or exceeded the human bone conduction attenuations. Dancer, et al. (5, 6) and Crabtree (4) have described the use of manikins in measuring the performance of hearing protectors in both continuous and impulse noise fields.
Figure 13 ANR Deep Insert Custom Earplug
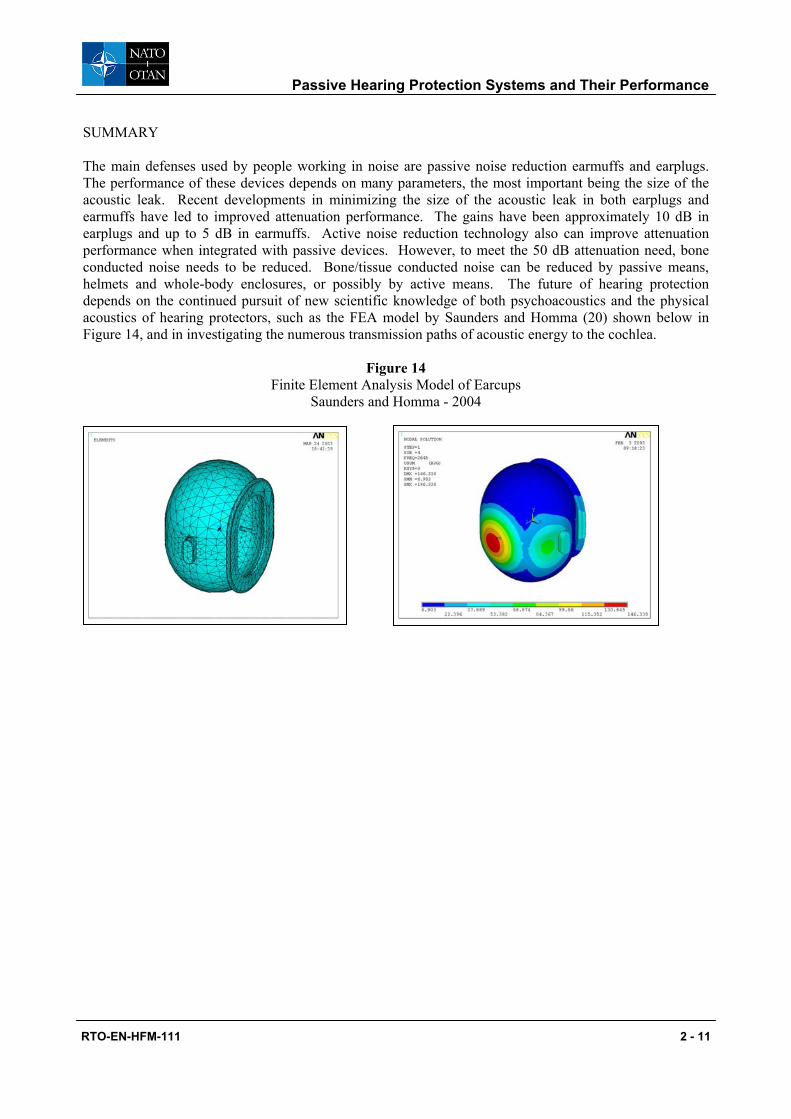
Passive Hearing Protection Systems and Their Performance
RTO-EN-HFM-111 2 - 11
SUMMARY The main defenses used by people working in noise are passive noise reduction earmuffs and earplugs. The performance of these devices depends on many parameters, the most important being the size of the acoustic leak. Recent developments in minimizing the size of the acoustic leak in both earplugs and earmuffs have led to improved attenuation performance. The gains have been approximately 10 dB in earplugs and up to 5 dB in earmuffs. Active noise reduction technology also can improve attenuation performance when integrated with passive devices. However, to meet the 50 dB attenuation need, bone conducted noise needs to be reduced. Bone/tissue conducted noise can be reduced by passive means, helmets and whole-body enclosures, or possibly by active means. The future of hearing protection depends on the continued pursuit of new scientific knowledge of both psychoacoustics and the physical acoustics of hearing protectors, such as the FEA model by Saunders and Homma (20) shown below in Figure 14, and in investigating the numerous transmission paths of acoustic energy to the cochlea.
Figure 14 Finite Element Analysis Model of Earcups
Saunders and Homma - 2004

Passive Hearing Protection Systems and Their Performance
2 - 12 RTO-EN-HFM-111
Bibliography
1. Berger, E. H., Review and Tutorial - Methods of Measuring the Attenuation of Hearing Protection Devices, J. Acoust. Soc. Am. 79(6), pages 1655-1687, 1986
2. Berger, E. H., International Activities in the Use, Standardization, and Regulation of Hearing Protection, J. Acoust. Soc. Am. 99(4), Pt.2, page 2463, 1996
3. Blackstock, D.T. and von Gierke, H.E., Development of an Extra Small and Extra Large Size for the V-51 R Earplug, Wright Air Development Center Technical Report, WADC 56-142, Wright-Patterson Air Force Base, Ohio, April 1956
4. Crabtree, R. B., Application of an Acoustic Manikin to the Study of Continuous and Impulsive Noise Exposure, in Proceedings of Inter-Noise 92, edited by G. A. Daigle and M. R. Stinson, Noise Control Foundation, Poughkeepsie, NY, pages 279-282, 1992
5. Dancer, A., Grateau, P., Cabanis, A., Barnabe, G., Cagnin, G., Vaillant, T., and Lafont, D., Effectiveness of Earplugs in High-Intensity Impulse Noise, J. Acoust. Soc. Am. 91(3), pages 1677-1689, 1992
6. Dancer, A. L., Franke, R., Parmentier, G., and Buck, K., Hearing Protector Performance and NIHL in Extreme Environments: Actual Performance of Hearing Protectors in Impulse Noise/Nonlinear Behavior, in Scientific Basis of Noise-Induced Hearing Loss, edited by A. Axlesson, H. Borchgrevink, R. P. Hamernik, P. Hellstrom, D. Henderson, and R. J. Salvi, Thieme Medical Pub., Inc., New York, NY, pages 321-338, 1996
7. Dancer, A. and Hamery, P., Nonlinear Hearing Protection Devices, Spectrum, 15(Supplement 1), 21, 1998
8. Dancer, A., Buck, K., Hamery, P., and Parmentier, G., Hearing Protection in the Military Environment, Noise & Health 5, 1-15, 1999
9. Franke, E.K., von Gierke, H.E., and von Wittern, W.W., The Jaw Motions Relative to the Skull and Their Influence on Hearing by Bone Conduction, Aero Medical Laboratory Technical Report number 6466, Wright Air Development Center, Wright-Patterson Air Force Base, Ohio, May 1951
10. Guild, E., Nixon, C.W., and Baker, D.J., User Test of Flents Anti-Noise Ear Stopples, Internal Memo, Wright Air Development Center, Wright-Patterson Air Force Base, Ohio, May 1959
11. James, S., Hancock, M., Hazel, A., and Rood, G. M., Primary Contributors to Hearing Damage Risk in the Military Aircraft Cockpit, Intl. Military Noise Conf., Baltimore, MD, 2001
12. Johnson, D.L., and Nixon, C.W., Simplified Methods for Estimating Hearing Protector Performance, Journal of Sound and Vibration, June 1974
13. Johnson, D. L., Nixon, C. W., and Skelton, M., The Effect of Reduced Headband Force on the Attenuation of Muff-Type Protectors, J. Acoust. Soc. Am. Suppl. 1, 74, S94, 1983
14. Nixon, C. W. and von Gierke, H. E., Experiments on the Bone-Conduction Threshold in a Free Sound Field, J. Acoust. Soc. Am. 31(8), pages 1121-1125, 1959
15. Nixon, C. W. and Knoblach, W. C., Hearing Protection of Earmuffs Worn Over Eyeglasses, Aerospace Medical Research Laboratory, Report No. AMRL-TR-74-61, Wright-Patterson AFB, OH, 1974
16. Nixon, C.W., Chapter 5 Hearing Protector Standards, in Personal Hearing Protection In Industry, edited by Alberti, P.W., Raven Press, New York, 1982
17. Nixon, C.W., Chapter 12 Hearing Protective Devices: Ear Protectors, in Handbook of Noise Control, edited by Harris, C., McGraw-Hill, 1979
18. Parmentier, G.; Buck, K.; Kronenberger, G., and Beck, C., Artificial Head (ATF) for Evaluation of Hearing Protectors, Institut Franco-Allemand De Recherches De St. Louis, St Louis, France, 1999
19. Rood, G. M., The In-Situ Measurement of the Attenuation of Hearing Protectors by the Use of Miniature Microphones, in Personal Hearing Protection in Industry, edited by P. W. Alberti, Raven Press, New York, NY, pages 175-197, 1982

Passive Hearing Protection Systems and Their Performance
RTO-EN-HFM-111 2 - 13
20. Saunders, W. and Homma, K. A Finite Element-Based Acoustic Engineering Design Program for Advancements in Passive Noise Reduction Performance of Helmet Mounted Noise Defenders, ATI, Blacksburg, VA, personal communication, July 2004
21. Shaw, E.A.G. and Thiessen, G.J., Improved Cushion for Ear Defenders, J. Acoust. Soc. Am., Vol 30, Num 1, pages 24-36, Jan 1958
22. Shaw, E.A.G., Hearing Protector Design Concepts and Performance Limitations, International Symposium on Personal Hearing Protection, University of Toronto, Canada, May 1980
23. von Gierke, H. E., Protection of the Ear from Noise: Limiting Factors, J. Acoust. Soc. Am. 95(5), Pt. 2, page 2914, 1994
Passive Hearing Protection Systems and Their Performance
2 - 14 RTO-EN-HFM-111

RTO-EN-HFM-111 3 - 1
Active Hearing Protection Systems and Their Performance
K. Buck and V. Zimpfer-Jost French-German Research Institute BP 34, 5 rue du Général Cassagnou
F-68301 Saint-Louis Cedex
Email: [email protected]
Summary The present paper gives a brief history of active noise cancellation. It shows that the possibility of using ANR in hearing protection devices was proposed long before the first commercial devices became known. The basic theory of active noise cancellation is quite simple and was first described in the 1930’s. The basic principles and the different approaches to obtain active noise cancellation are described in this paper. Different ANR techniques are presented (feed-forward, feedback) as well as different possibilities for their implementation (analog and/or digital). The possibility for optimum insertion of a communication signal into an ANR hearing protector is described. The impact of ANR protectors on the noise exposure and on the speech intelligibility is discussed. Critical parameters like stability and overload are discussed and some basic design rules will be shown. The problems arising during an implementation of ANR in earplugs will finally be discussed.
Introduction The noise to which the servants of modern weapon systems are exposed (figures 1 and 2) becomes, in some configurations, a major limiting factor for their use. Pilots of armoured vehicles may be exposed to maximal A-weighted noise levels in the order of 112 dB. Due to the poor efficiency of passive hearing protectors in the low frequency range, the exposure level when "protected" with a standard circumaural protector is still 105 dBA. This means that, when respecting the legal limits, the pilot may not be exposed to this noise for a period longer than 5 minutes (Leq8h = 85 dBA) respectively 15 minutes (Leq8h = 90 dBA). These exposure limits represent a serious impact on possible training periods. Even if we consider that the exposure limits will be disregarded during combat, the lack of realistic training will impede on the effectiveness.
80
85
90
95
100
105
110
115
120
10 100 1000 10000Frequency [Hz]
L [d
B]
Third Octave Noise Levels - Commander 20 km / h - L = 110,2 dB(Lin)40 km / h - L = 114,4 dB(Lin)60 km / h - L = 119,0 dB(Lin)V max - L = 122,0 dB(Lin)
Figure 1: Typical noise inside an armoured vehicle
Paper presented at the RTO HFM Lecture Series on “Personal Hearing Protection including Active Noise Reduction”, held in Warsaw, Poland, 25-26 October 2004; Belgium, Brussels, 28-29 October 2004;
Virginia Beach, VA, USA, 9-10 November 2004, and published in RTO-EN-HFM-111.
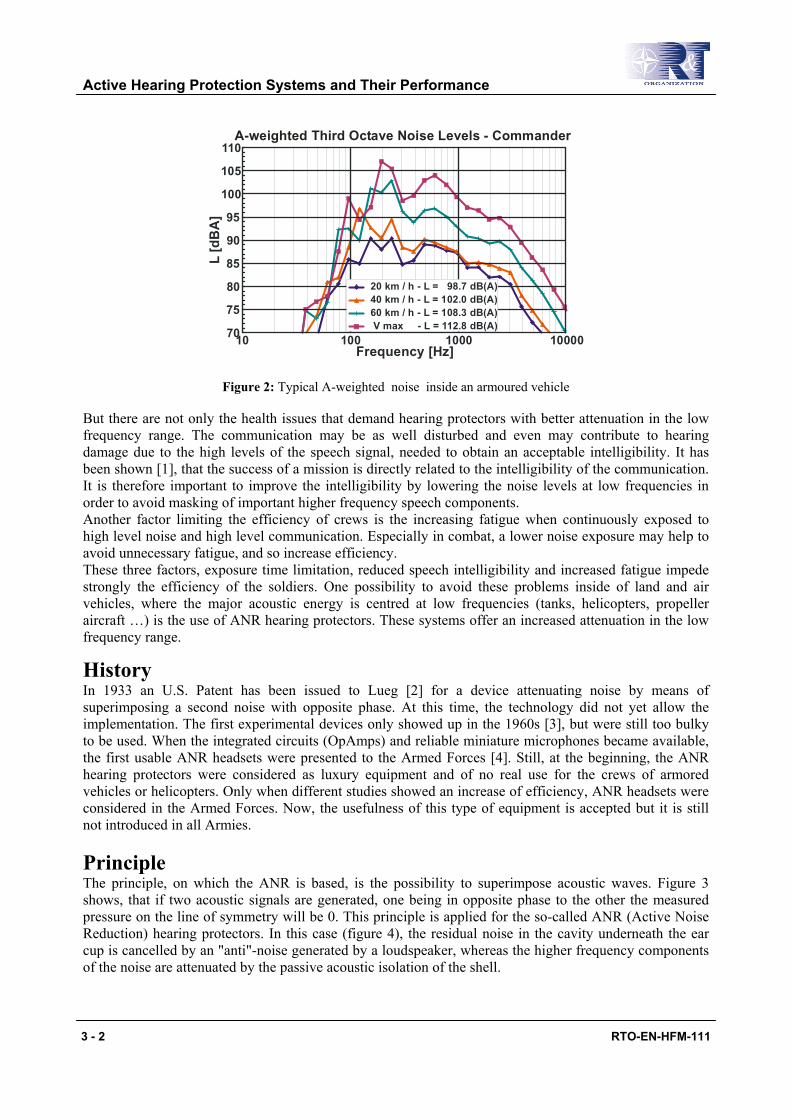
Active Hearing Protection Systems and Their Performance
3 - 2 RTO-EN-HFM-111
85
70
80
75
90
95
100
105
110
10 100 1000 10000Frequency [Hz]
L [d
BA
]
A-weighted Third Octave Noise Levels - Commander
20 km / h - L = 98.7 dB(A)40 km / h - L = 102.0 dB(A)60 km / h - L = 108.3 dB(A)V max - L = 112.8 dB(A)
Figure 2: Typical A-weighted noise inside an armoured vehicle
But there are not only the health issues that demand hearing protectors with better attenuation in the low frequency range. The communication may be as well disturbed and even may contribute to hearing damage due to the high levels of the speech signal, needed to obtain an acceptable intelligibility. It has been shown [1], that the success of a mission is directly related to the intelligibility of the communication. It is therefore important to improve the intelligibility by lowering the noise levels at low frequencies in order to avoid masking of important higher frequency speech components. Another factor limiting the efficiency of crews is the increasing fatigue when continuously exposed to high level noise and high level communication. Especially in combat, a lower noise exposure may help to avoid unnecessary fatigue, and so increase efficiency. These three factors, exposure time limitation, reduced speech intelligibility and increased fatigue impede strongly the efficiency of the soldiers. One possibility to avoid these problems inside of land and air vehicles, where the major acoustic energy is centred at low frequencies (tanks, helicopters, propeller aircraft …) is the use of ANR hearing protectors. These systems offer an increased attenuation in the low frequency range.
History In 1933 an U.S. Patent has been issued to Lueg [2] for a device attenuating noise by means of superimposing a second noise with opposite phase. At this time, the technology did not yet allow the implementation. The first experimental devices only showed up in the 1960s [3], but were still too bulky to be used. When the integrated circuits (OpAmps) and reliable miniature microphones became available, the first usable ANR headsets were presented to the Armed Forces [4]. Still, at the beginning, the ANR hearing protectors were considered as luxury equipment and of no real use for the crews of armored vehicles or helicopters. Only when different studies showed an increase of efficiency, ANR headsets were considered in the Armed Forces. Now, the usefulness of this type of equipment is accepted but it is still not introduced in all Armies. Principle The principle, on which the ANR is based, is the possibility to superimpose acoustic waves. Figure 3 shows, that if two acoustic signals are generated, one being in opposite phase to the other the measured pressure on the line of symmetry will be 0. This principle is applied for the so-called ANR (Active Noise Reduction) hearing protectors. In this case (figure 4), the residual noise in the cavity underneath the ear cup is cancelled by an "anti"-noise generated by a loudspeaker, whereas the higher frequency components of the noise are attenuated by the passive acoustic isolation of the shell.
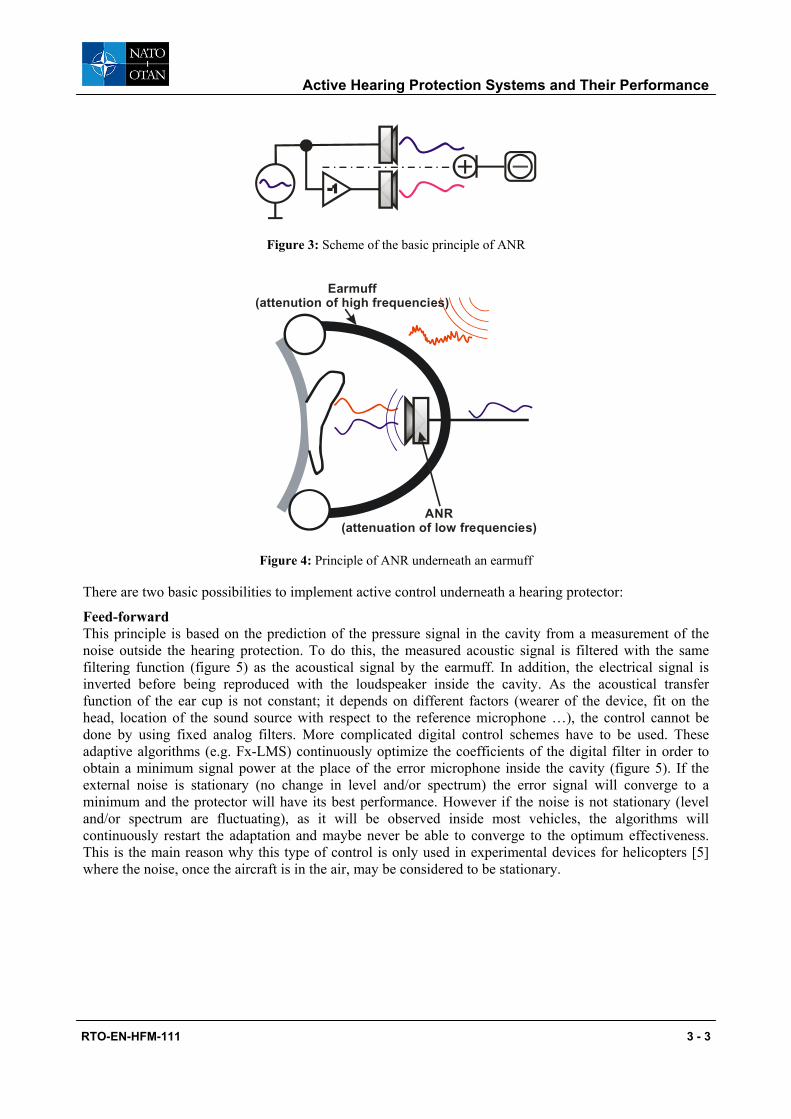
Active Hearing Protection Systems and Their Performance
RTO-EN-HFM-111 3 - 3
Figure 3: Scheme of the basic principle of ANR
Earmuff(attenution of high frequencies)
ANR(attenuation of low frequencies)
Figure 4: Principle of ANR underneath an earmuff
There are two basic possibilities to implement active control underneath a hearing protector:
Feed-forward This principle is based on the prediction of the pressure signal in the cavity from a measurement of the noise outside the hearing protection. To do this, the measured acoustic signal is filtered with the same filtering function (figure 5) as the acoustical signal by the earmuff. In addition, the electrical signal is inverted before being reproduced with the loudspeaker inside the cavity. As the acoustical transfer function of the ear cup is not constant; it depends on different factors (wearer of the device, fit on the head, location of the sound source with respect to the reference microphone …), the control cannot be done by using fixed analog filters. More complicated digital control schemes have to be used. These adaptive algorithms (e.g. Fx-LMS) continuously optimize the coefficients of the digital filter in order to obtain a minimum signal power at the place of the error microphone inside the cavity (figure 5). If the external noise is stationary (no change in level and/or spectrum) the error signal will converge to a minimum and the protector will have its best performance. However if the noise is not stationary (level and/or spectrum are fluctuating), as it will be observed inside most vehicles, the algorithms will continuously restart the adaptation and maybe never be able to converge to the optimum effectiveness. This is the main reason why this type of control is only used in experimental devices for helicopters [5] where the noise, once the aircraft is in the air, may be considered to be stationary.

Active Hearing Protection Systems and Their Performance
3 - 4 RTO-EN-HFM-111
FilterReference
Microphone
ErrorMicrophone
Figure 5: Principle of a feed forward control
Feedback This control principle works independently of the noise outside of the hearing protector. It is based on the measurement of the residual noise in the cavity of the earmuff. The basic principle of a feedback control system is represented in figure 6. The residual noise in the cavity is recorded; its polarity is inverted and this signal is fed back underneath the muff. A system as it is shown in figure 6 would be instable in normal situations and therefore some precautions have to be taken.
-1
Micro-phone
Loud-speaker
InvertingAmplifier
Figure 6: Basic principle of ANR using feedback control
Figure 7 a shows a schematic representation of all elements participating in the feedback loop of an ANR system. The electrical equivalent of this representation is shown in figure 7 b. It takes into account the transfer functions of all electric and the electro-acoustic elements. The active attenuation of such a feedback system can be represented as the modula of its closed loop transfer function Bc which is expressed as
o
c BB
+=
11
, (1)
Bo being the open loop transfer function,
tmin
outo KKAAF
VVB ⋅⋅⋅⋅== 21 . (2)

Active Hearing Protection Systems and Their Performance
RTO-EN-HFM-111 3 - 5
The active attenuation expressed in dB is ( ) [ ]dBBA oANR +⋅= 1log20 . (3)
A1
-A2
F
Compensationfilter
Power amplifier
Pre-amplifierVm
Km
Kt
Vt
No i
seF
a-A2KtA1Km
F
Vout
Vin
Vnoise
bKm - transfer function of the microphone 1 - gain of the pre-amplifier
of the microphoneA
t - transfer function of the loudspeaker - volumeK 2 - gain of the power amplifier
of the LoudspeakerA
+
Figure 7: (a) Different electrical and electro-acoustical elements of the ANR system. (b) Equivalent block diagram of the opened (solid line) and closed (solid + dotted line) feedback loop
(1) and (3) show, that the stability and the active attenuation of the feedback system are determined by the open loop transfer function Bo. Three distinct cases have to be considered: 1. | 1+Bo | > 1 Bc < 1 and AANR > 0 dB The noise is attenuated 2. 0 < | 1+Bo | < 1 Bc > 1 and AANR < 0 The noise is amplified 3. | 1 + Bo | = 0 Bc and AANR are not defined The system is instable As A1 and A2 are linear amplifications and the transfer function of the microphone can as well be considered to be flat, the ANR capability is only dependant on the frequency response of loudspeaker + volume underneath the cup (Kt) and of the transfer function of the compensation filter (F). Once the choice of the loudspeaker is done and the acoustics of the volume of the passive protector is defined, the ANR performance is fixed with the choice of the compensation filter. The shape of this filter controls the stability and the contribution of the ANR [6].
Insertion of communication (speech) signal As ANR hearing protectors are always used where the user has an important need for communication the insertion of the communication signal is very important. Two methods for the insertion of such a signal are used:
- acoustic addition via a second loudspeaker - electric addition into the feedback loop

Active Hearing Protection Systems and Their Performance
3 - 6 RTO-EN-HFM-111
In figure 8 a schematic for the insertion of the communication signal (Se) is drawn. Underneath the shell of the hearing protector, the acoustic signal is treated as if it were noise and can be formulated:
o
sseA BKASS
+⋅⋅⋅=1
1 (4)
with mto kAKAFB ⋅⋅⋅⋅= 12
two frequency ranges may now be considered: - |1+Bo| >1 and |Bo|>1 range of ANR; the transfer function of the communication is:
mt
ss
e
A
kAKAFKA
SS
⋅⋅⋅⋅⋅
≈12
(5)
- |1+Bo| < 1 outside of the range of ANR; the transfer function of the communication is:
sse
A KASS
⋅≈ (6)
If for the two paths identical loudspeakers and power amplifiers are chosen,
(5) becomes me
A
kAFSS
⋅⋅≈
1
1(7)
and (6) becomes te
A KASS
⋅≈ 2 (8)
As A1 and Km may be considered to be independent of the frequency, the transfer function of the speech signal depends only on the compensation filter at low frequencies (ANR range) and on the loudspeaker for frequencies outside the ANR range. If a one-loudspeaker system is used, the formulae (7) and (8) are valid if the signal is inserted after the compensation filter F (red insertion point in figure 8).
Km - transfer function of the microphone 1 - gain of the pre-amplifier
of the microphoneA
t - transfer function of the loudspeaker - volumeK 2 - gain of the power amplifier
of the LoudspeakerA
A1F
Km
F
AS
KS
-A2
Kt
SSe
SSaSSe
S - transfer function of the loudspeaker (Speech) K S - gain of the power amplifier
of the Loudspeaker (Speech)A
SSe
Figure 8: Insertion of a communication signal into an ANR system
Active Hearing Protection Systems and Their Performance
RTO-EN-HFM-111 3 - 7
Another insertion point for the communication signal is marked in green. If the signal is inserted at this point the transfer function of the speech signal is:
mt
t
e
A
KAKAFKAF
SS
⋅⋅⋅⋅+⋅⋅
=12
2
1 (9)
In this case the communication signal in the frequency range of the ANR will be :
me
A
kASS
⋅≈
1
1
and outside the range of ANR
te
A KAFSS
⋅⋅≈ 2
This means that the transfer function of the communication channel is "flat" in the low frequency range. However, the gain of the compensation filter is, for stability reasons, much lower than 1 in the frequency range outside the ANR bandwidth. Therefore this insertion path is not suitable for a good intelligibility of the speech. The best speech transmission is performed when the speech signal is inserted at two points [7], one before and one after the compensation filter of the feedback loop as it is shown in figure 9. The speech transfer function is represented as:
mt
t
e
A
kAKAFFAKA
SS
⋅⋅⋅⋅+⋅+⋅⋅
=12
2
1)1(
(10)
if |Bo| > 1 and A.F > 1 ; me
A
kAA
SS
⋅≈
1
and if |Bo|<1; )1(2 FAKASS
te
A ⋅+⋅⋅≈
Using this scheme, the low and high frequency range become independent of the transfer function of the loop compensation filter. If necessary, the speech transfer can be optimized by a pre-filtering of the speech F2. A transfer function of the communication channel with the ANR switched on and off is drawn in figure 10. It can be seen that, if the ANR is switched on (blue curve), the transfer function is "flat", whereas it follows the curve representing "ANR off" for higher frequencies. The use of two insertion points for the speech transmission is without any doubt the most elegant way to obtain an optimum speech quality with ANR hearing protectors, especially if the speech spectrum is pre-filtered (F2 in Figure 9).

Active Hearing Protection Systems and Their Performance
3 - 8 RTO-EN-HFM-111
Km - transfer function of the microphone 1 - gain of the pre-amplifier
of the microphoneA
t - transfer function of the loudspeaker - volumeK 2 - gain of the power amplifier
of the LoudspeakerA
A1F
Km
F
Kt SSa
SSe
-A2
A
+ +
AF2
-Loop compensation filter F F2 - compensation filter for the speech signal
Figure 9: Schematic for the insertion of a communication signal at two points.
-15
-20
-10
-5
0
5
10
10 100 1000 10000Frequency [Hz]
[dB
]
Transfer function of the communication channel
ANR OFFANR ON
Figure 10: Transfer function of the speech transmission when inserted at two points (fig.9) The use of a two-loudspeaker system is attractive for military use, as the communication system stays fully operational even if the ANR system has to be shut down for some reason.
Implementation The physical implementation of an ANR system is usually devised into two parts: - the electro-acoustical part contains, the loudspeaker, the error-microphone and their peripheral
electronics (pre- and power-amplifiers etc.) as well as the hardware of the hearing protector (volume, damping material …).
- the feedback compensation filter. These two parts contribute to the open loop transfer function (Bo) of the ANR system which is determining the ANR capabilities of the protector. The transfer function of the electro-acoustic contribution to Bo is determined - by the choice of the microphone. This choice is usually not critical. The response of microphones is
normally quite flat in the required frequency range. - by the choice of a loudspeaker. The loudspeaker has to be compatible with the noise level it has to
cancel. It should have a good efficiency over a large frequency band. Resonances within this band should be avoided as they lead to undesirable phase shifts.

Active Hearing Protection Systems and Their Performance
RTO-EN-HFM-111 3 - 9
- by the mechanical implementation of the microphone and the loudspeaker into the volume of the earmuff. This implementation has a big influence on the passive protection of the device as well as on the ANR efficiency and bandwidth. It also represents often a compromise between the requirements of ANR and the need for passive attenuation. E.g. the effective volume in front of the loudspeaker should not be too small in order to maintain passive attenuation at low frequencies. But in order to avoid resonances in the lower frequency range it should not be too large either. A good placement of the microphone is in front of the center of the membrane of the loudspeaker. There is no need to put it too close to the membrane. The acoustic wavelength that are involved (1 kHz corresponds to 30 cm) are always very long compared to this distance.
The choice of the transducers and of their mechanical implantation fixes the electro-acoustic transfer function (denominated Kt and Km in earlier figures). In figure 11 the electro-acoustic transfer function of an actual device is shown. Once this function is determined, it is the design of the feedback compensation filter that controls the final efficiency of the ANR system: it is possible to tune the ANR device, within limits given by the need of stability, to get optimal performance for a given noise environment.
5
10
15
20
25
[dB
]
-10
0
-5
−π/2
0
π/2
π
[rad
]
−π10 100 1000 10000Frequency [Hz]
Electro-Acoustic Transfer Function
Modula
Phase
Figure 11: Electro-acoustic transfer function (amplitude, phase) of an ANR system.
Analog or digital filtering In all ANR systems that are presently available on the market, the compensation filter is implemented in analog technologies. These systems are easy and cost effective to implement as far as large series are produced. However, if the active attenuation must be optimized for actual noise at the listener's place, analog systems need hardware modification in order to change the ANR characteristics (figure 12). Digital ANR systems, however, only need the download of a new parameter set. Figure 13 shows the ANR that has been obtained when the same electro-acoustic hardware has been used with 3 different coefficient sets in the digital filter. Although the analog systems are mostly used, digital systems have the potentiality to allow specific adaptations for the noise environment, a feature that will be most important for severe noise exposures where the ANR has to be optimized in order to set acceptable noise levels for different users.
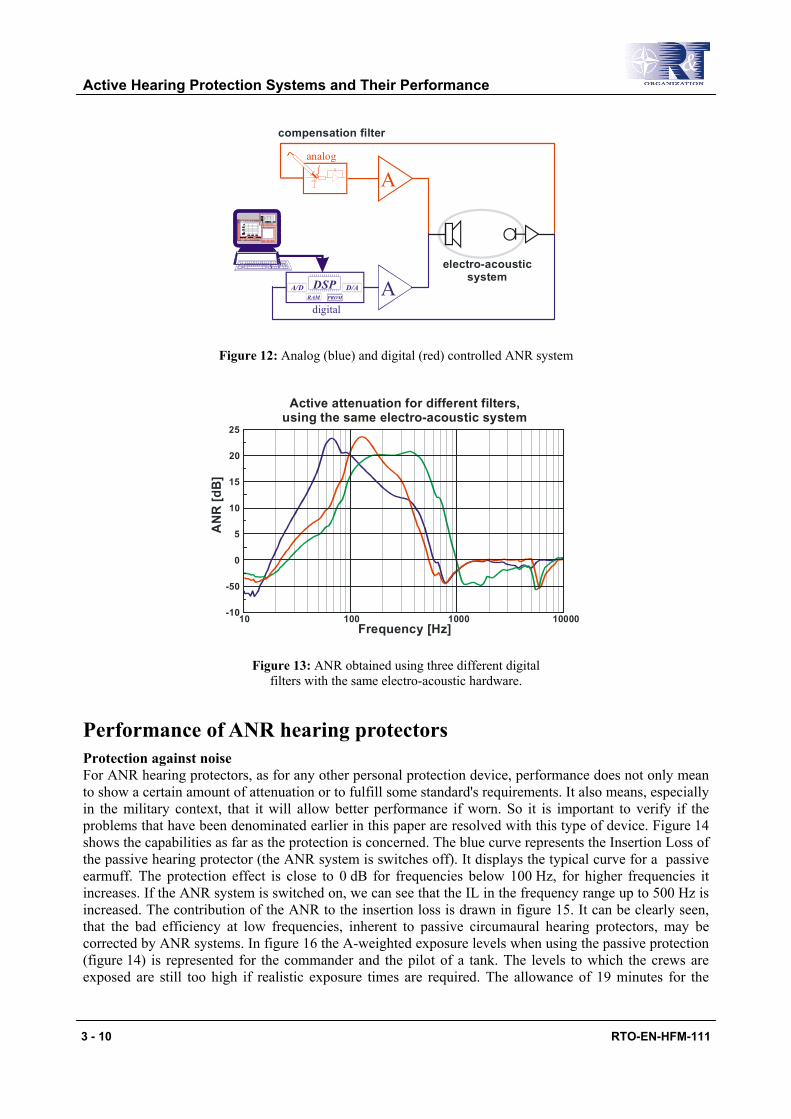
Active Hearing Protection Systems and Their Performance
3 - 10 RTO-EN-HFM-111
A
compensation filter
analog
ADSPRAM PROM
A/D D/A
digital
electro-acousticsystem
Amplitude [dB]
Figure 12: Analog (blue) and digital (red) controlled ANR system
Active attenuation for different filters,using the same electro-acoustic system
5
10
15
20
25
AN
R [d
B]
-1010 100 1000 10000Frequency [Hz]
0
-50
Figure 13: ANR obtained using three different digital filters with the same electro-acoustic hardware.
Performance of ANR hearing protectors Protection against noise For ANR hearing protectors, as for any other personal protection device, performance does not only mean to show a certain amount of attenuation or to fulfill some standard's requirements. It also means, especially in the military context, that it will allow better performance if worn. So it is important to verify if the problems that have been denominated earlier in this paper are resolved with this type of device. Figure 14 shows the capabilities as far as the protection is concerned. The blue curve represents the Insertion Loss of the passive hearing protector (the ANR system is switches off). It displays the typical curve for a passive earmuff. The protection effect is close to 0 dB for frequencies below 100 Hz, for higher frequencies it increases. If the ANR system is switched on, we can see that the IL in the frequency range up to 500 Hz is increased. The contribution of the ANR to the insertion loss is drawn in figure 15. It can be clearly seen, that the bad efficiency at low frequencies, inherent to passive circumaural hearing protectors, may be corrected by ANR systems. In figure 16 the A-weighted exposure levels when using the passive protection (figure 14) is represented for the commander and the pilot of a tank. The levels to which the crews are exposed are still too high if realistic exposure times are required. The allowance of 19 minutes for the

Active Hearing Protection Systems and Their Performance
RTO-EN-HFM-111 3 - 11
commander and of 6 minutes for the pilot of the tank cannot be considered to be sufficient. Figure 17 shows the same situations but with an ANR earmuff. Adding active attenuation for this type of noise, changes the acceptable exposure time dramatically (3 h for the commander and 1h30 for the pilot). It shows also, that if the exposure time for the pilot has to be increased, this can only be done by a still better attenuation in the 100 Hz third octave band. As long as this is not decreased to at least 85 dBA, a better attenuation for higher frequencies will not have any influence. However, in the case of the commander of the tank it would be necessary to attenuate the noise between 500 and 1000 Hz if a longer exposure time is required. In figure 18 the acceptable exposure times are shown for different configurations and for crew members equipped with passive or with active hearing protectors. This example shows, that ANR equipped earmuffs are able to give the protection that is necessary to obtain sufficient exposure time for the crew of an armored vehicle at the efficiency of these devices in terms of A-weighted exposure level, for the noise inside a tank.
50
30
40
20
10
0
-10
10 100 1000 10000Frequency [Hz]
IL [d
A]
Typical Insertion Loss (IL) of a passive ( )and an active ( ) ANR hearing Protector
ANR offANR on
Figure 14: Insertion Loss (IL) for an ANR Hearing Protector wit ANR switches ON and OFF
-5
-10
0
5
10
15
20
10 100 1000 10000Frequency [Hz]
AN
R [d
B]
Contribution of the ANR to the Insertion Loss
Figure 15: Contribution of the ANR to the insertion loss of an active hearing protector
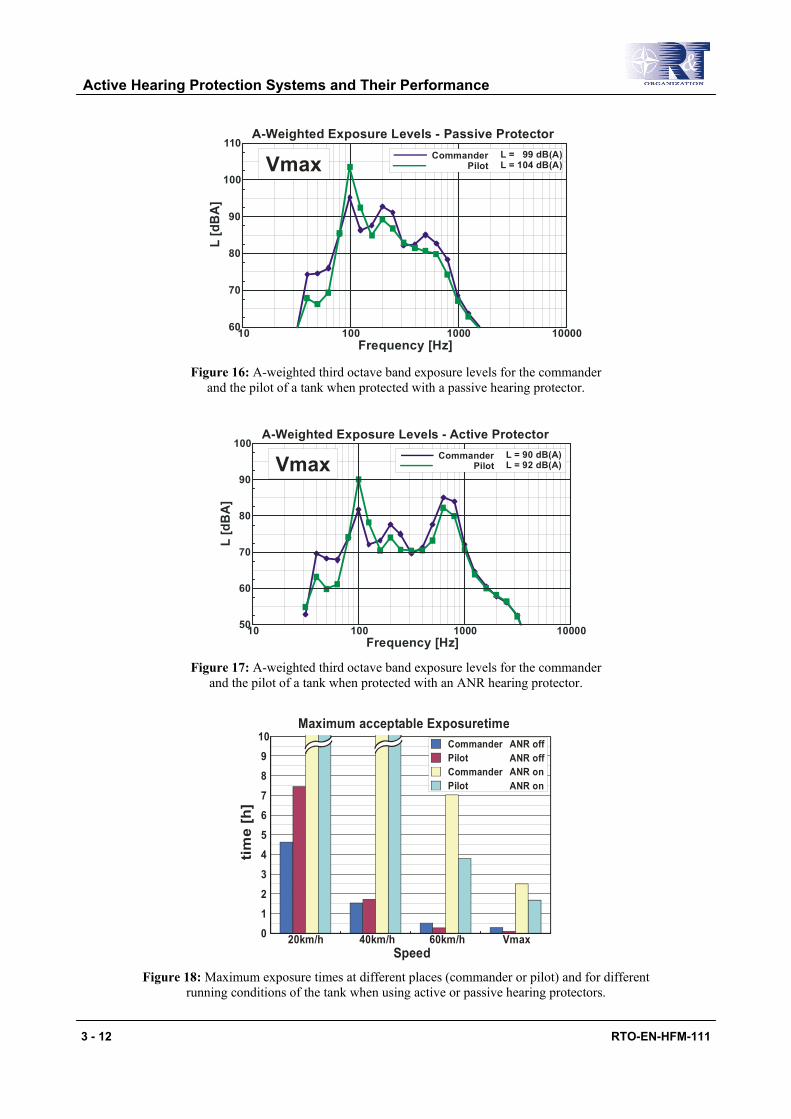
Active Hearing Protection Systems and Their Performance
3 - 12 RTO-EN-HFM-111
70
80
90
100
110
L [d
BA
]
A-Weighted Exposure Levels - Passive Protector
Vmax Pilot L = 104 dB(A)Commander L = 99 dB(A)
6010 100 1000 10000Frequency [Hz]
Figure 16: A-weighted third octave band exposure levels for the commander and the pilot of a tank when protected with a passive hearing protector.
60
70
80
90
100
L [d
BA
]
A-Weighted Exposure Levels - Active Protector
Vmax Pilot L = 92 dB(A)Commander L = 90 dB(A)
5010 100 1000 10000Frequency [Hz]
Figure 17: A-weighted third octave band exposure levels for the commander and the pilot of a tank when protected with an ANR hearing protector.
Maximum acceptable Exposuretime
012
3456789
10
20km/h 40km/h 60km/h VmaxSpeed
time
[h]
Pilot ANR onANR onCommanderANR offPilot
Commander ANR off
Figure 18: Maximum exposure times at different places (commander or pilot) and for different
running conditions of the tank when using active or passive hearing protectors.
Active Hearing Protection Systems and Their Performance
RTO-EN-HFM-111 3 - 13
Influence of ANR on Speech Intelligibility Measurements underneath the hearing protectors of tank crews [8] have shown that the noise exposure of the crew of armored vehicles during speech communication is very high and may be comparable to the exposure level without hearing protector. In figure 19 exposure levels for the pilot of a tank are drawn for three conditions: - The pilot wears no hearing protection (blue line). The linear noise level for this condition is 128 dB(lin)
or 112 dB(A). This means an acceptable exposure time is ~1 minute per day. - The pilot wears a passive hearing protector (green line). It can be observed that the level of the mid and
high frequencies is attenuated but as there is no attenuation at low frequencies, the exposure level remains high (121 dB(lin), 104 dB(A)). The maximum exposure time is still short (6 minutes).
- The pilot receives a message through the communication system underneath the passive hearing protector (red line). Although the soldier wears his hearing protection, the A-weighted exposure level is 110 dB (1.5 minutes) maximum exposure time.
Exposure Levels for the Pilot of a Tank
90
100
110
120
130
L [d
B]
5010 100 1000 10000
Frequency [Hz]
80
70
60
unprotected - L = 112 dBAA
protected + communication - L = 110 dBAA
protected no communication - L = 104 dBAA
Figure 19: Exposure Levels of the Pilot of a Tank at Vmax for different conditions.
In a first approach it seems unusual that such a high speech level has to be used by the soldier in order to obtain an acceptable intelligibility, especially, as the noise in the frequency range that is important for intelligibility is already well attenuated. This high speech level can be explained by two effects: - The psycho-acoustical masking of the high frequency components of the communication by the low
frequency components of the noise. - The bad quality of the transmission channel. In fact, both of these effects have a part of responsibility for this effect. The transmission quality is degraded as, due to masking, a high communication level is needed. Due to the degraded signal, a higher level is needed for good intelligibility. In order to confirm this assumption, the calculation method of the STI (Speech Transmission Index) has been modified by Wessling [8]. The modification consisted in the use of real, level depending, masking curves for the calculation of the signal to noise ratios. In figure 20 the masking curves (solid lines) and the third octave spectra of the physical noise (dashed lines) are drawn for the noise to which the pilot of a tank is submitted when wearing an ANR earmuff (red curve – ANR off; green curve – ANR on). The spectrum of speech is represented for 3 different levels (80, 90 and 100 dB). For the exposure with the ANR switched off, the speech is not masked by the noise (dashed red line) but by the psycho-acoustical excitation (solid red line). In this condition, the area of speech at 80 dB (blue area) is fully masked. As for a good intelligibility the Speech Transmission Index (STI) should be about 0.6 a speech level of about 100 dB has to be used (see table in figure 20). When switching the ANR

Active Hearing Protection Systems and Their Performance
3 - 14 RTO-EN-HFM-111
on, only the noise exposure at frequencies lower than 500 Hz is decreased. But, as at the upper spread of making is, (a) induced by the high noise levels at low frequencies, (b) nonlinear (the masking at higher frequencies decreases faster that the level of the masker), the speech spectrum is now only masked by the physical noise. As a consequence the unmasked area of speech increases considerably and the level of speech, required for good intelligibility (STI > 0.6) is already reached at 80 dB.
Physical noise and psycho-acoustic ExcitationTank at Vmax - Pilot
140
80
100
120
[dB
]
2010 100 1000 10000
Frequency [Hz]
60
40
Ls = 100 dB
Ls = 80 dB
Ls = 90 dB
Psycho-acoustic excitationPhysical noisePsycho-acoustic excitationPhysical noise
ANR on
ANR off
Ls = 80 dB STI = 0.157 STI = 0.575
Ls = 100 dB STI = 0.656 STI = 0.879 Ls = 90 dB STI = 0.397 STI = 0.784
ANR onANR off
Figure 20: Noise exposure of the pilot and its impact on the quality of speech
This example shows that if the noise exposure has strong low frequency components, ANR will be very beneficial to the intelligibility and help to avoid unnecessary noise exposure due to communication.
Response to impulse noise When ANR hearing protectors are used by soldiers, it is important to know, how these devices will behave when exposed to weapon noise. In theory, these devices should reduce the noise level of impulse noise in the same way they reduce continuous noise. In reality, the transducers and the electronics are usually not able to handle the levels that occur in such situations. Figure 21 shows the contribution of the ANR when the protectors are exposed to impulse noise with different peak pressure levels. It can be observed that per Noise impulses with a peak level up to 150 dB (red and green curve) the contribution of the ANR is the same as for continuous noise (black line). For the higher peak pressure levels (blue and mauve curves) the contribution of the ANR breaks down. The reason for this diminution can be seen in figure 22.

Active Hearing Protection Systems and Their Performance
RTO-EN-HFM-111 3 - 15
Contribution of the ANR forImpulse Noise with different Peak Pressure Levels
5
10
15
20
25
AN
R[d
B]
-1010 100 1000 10000
Frequency [Hz]
0
-50
130 dB150 dB160 dB170 dBpink noise
Figure 21: Contribution of the ANR for impulse noise (explosion) with different peak pressure levels and for continuous noise.
0 10 20 30 40 50Time [ms]
80604020
0-20-40-60
Pres
sure
[Pa]
Pressure-time history underneath the earcup
L = 150 dBpeak
0 10 20 30 40 50Time [ms]
0.40.30.20.10.0
-0.1-0.2-0.3
Pres
sure
[kPa
]
L = 160 dBpeak
-0.4
0 10 20 30 40 50Time [ms]
1.0
0.5
0.0
-0.5
Pres
sure
[kPa
] L = 170 dBpeak
-1.0
ANR off
Anti-NoiseANR on
ANR off
Anti-NoiseANR on
ANR off
Anti-NoiseANR on
Figure 22: Pressure time histories underneath the hearing protector, when exposed to impulse noise.

Active Hearing Protection Systems and Their Performance
3 - 16 RTO-EN-HFM-111
In this figure the pressure-time histories underneath the earmuff are displayed for three impulse noises with different peak levels. For each level, the peak pressure history with the ANR switched on (blue) and off (black) is drawn. The red curve represents the difference between these curves; it can be assimilated to the "cancellation" pressure or "anti-noise". It can be observed, that the peak pressure of the 150 dB impulse noise is reduced by about 10 dB when the ANR is switched on, whereas no significant (~1 dB) can be measured for higher peak pressure levels. When looking at the curves of the "anti-noise" (red curves) it can be seen, that for the 150 dB peak level no saturation of the signal is present. For the two higher levels, the "anti-noise" is limited to a pressure of about 100 Pa (134 dB). Apparently the electro-acoustic system cannot produce higher pressures in the bandwidth where the ANR is attenuating.
ANR Earplugs Need The use of active headsets is appropriate when supplementary protection against low frequency noise and good communication are needed. This is typically the case for crewmembers of armored vehicles, propeller aircraft or helicopters. For other noise sources like jet engines the use of ANR earmuffs will not bring any supplementary protection. In figure 23 a typical third octave band noise close to a fighter aircraft (position of ground support during takeoff) is compared to noise inside an armored vehicle. It can be seen that the maximum level for the jet engine noise is situated at frequencies (>600 Hz) where the ANR in earmuffs is no more effective (figure 15). Worse, the ANR system amplifies the residual noise just at these frequencies (figure 16). For the jet engine noise A-weighted exposure levels when using different hearing protectors are shown in figure 24. We can see that the exposure level when using ANR in an earmuff (dashed black line) is increased by 1 dB, compared to the same earmuff with the ANR switched off (solid black line). The use of standard earplugs (blue line) reduces the exposure level to 101 dBA. However this level is still too high to guarantee a sufficient exposure time allowance and a good quality of the communication. The problem can be solved if an ANR earplug is used. The contribution of the ANR should be: ANR = 5 dB for f < 200 Hz ANR = 10 dB for 200 Hz < f <1500 Hz ANR = 5 dB for f < 1.5 kHz < 3 kHz ANR = 0 dB for f > 3 kHz).
80
90
100
110
120
140
10 100 1000 10000Frequency [Hz]
130
L [d
B]
Third Octave Band Noise LevelsArmored Vehicle (Pilot)Fighter Airplane (Wingman)
Figure 23: Third octave band noise levels near a fighter airplane and inside an armoured vehicle The use of such an ANR earplug (green curve in figure 24) will bring the exposure level to 93 dBA.
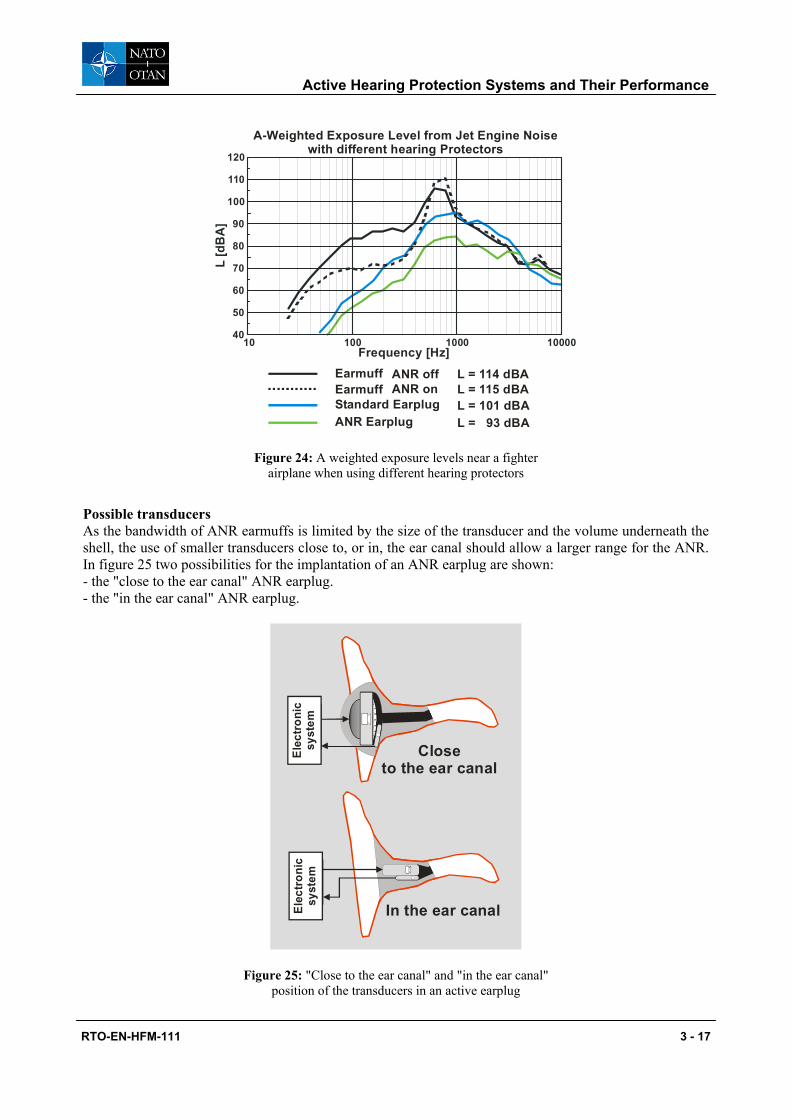
Active Hearing Protection Systems and Their Performance
RTO-EN-HFM-111 3 - 17
80
90
100
110
120
4010 100 1000 10000
Frequency [Hz]
70
60
50
A-Weighted Exposure Level from Jet Engine Noisewith different hearing Protectors
ANR Earplug L = 93 dBA
Earmuff ANR off L = 114 dBAANR on L = 115 dBAEarmuff
Standard Earplug L = 101 dBA
L [d
BA
]
Figure 24: A weighted exposure levels near a fighter airplane when using different hearing protectors
Possible transducers As the bandwidth of ANR earmuffs is limited by the size of the transducer and the volume underneath the shell, the use of smaller transducers close to, or in, the ear canal should allow a larger range for the ANR. In figure 25 two possibilities for the implantation of an ANR earplug are shown: - the "close to the ear canal" ANR earplug. - the "in the ear canal" ANR earplug.
Ele
ctro
nic
sys
tem
Elec
tron
icsy
stem
Ele
ctro
nic
sys
tem
Elec
tron
icsy
stem
In the ear canal
Closeto the ear canal
Figure 25: "Close to the ear canal" and "in the ear canal" position of the transducers in an active earplug

Active Hearing Protection Systems and Their Performance
3 - 18 RTO-EN-HFM-111
For the "close to the ear canal" system walkman-type transducers can be used. However, the characteristics of these transducers, resonances at medium frequencies, do not allow to extend the bandwidth far enough [9]. In order to overcome the problems that are characteristic to the walkman-type transducer, a miniature piezo-ceramic transducer has been developed [10]. Figure 26 shows the design and the electro-acoustic transfer function of this device. The electro-acoustic transfer function is almost flat over the whole frequency range. The first resonance is situated at about 20 kHz (not on the plot) and has not a strong influence on the ANR. Two simulated ANR curves (red and blue solid line) are drawn in figure 27. One has been optimized for maximum ANR amplitude, the other for a maximum bandwidth. The maximum ANR amplitude is about 22 dB at 200 Hz and the higher ANR limit (0 dB crossing) is at 1.5 kHz. The experimental values (dots) are in good agreement with the simulated values. The simulated maximum bandwidth curve (blue solid line) shows that the objective of an effective ANR up to 4 kHz can almost be reached with this type of transducer. There is only one major problem with this technology; due to its low sensitivity the voltage that is needed to produce significant pressure levels (in the order of 100 dB) is substantially higher than 100 Volts. This voltage is too high to be applied to a personnel protection device. However emerging technologies may allow to increase the sensibility by a tenfold or more, and in this case the use of piezo-ceramic transducers will be reconsidered.
Figure 26: Piezo-ceramic ANR earplug and its electro-acoustic transfer function

Active Hearing Protection Systems and Their Performance
RTO-EN-HFM-111 3 - 19
Active Attenuation of an Earplug usinga piezo-ceramic transducer
5
10
15
20
25
AN
R [d
B]
-1010 100 1000 10000
Frequency [Hz]
0
-5
Figure 27: ANR earplug using a "hearing aid"-type receiver and the electro-acoustic transfer function of the system
Another type of transducers to be used for "in the ear canal" ANR systems are "hearing aid"-type receivers. These miniature loudspeakers are small enough to fit into the ear canal and they are sensitive enough to produce the needed pressure levels. Figure 28 shows such an experimental earplug and the transfer function of the electro-acoustic system when adapted to an ear simulator. The photograph shows that the loudspeaker (receiver) and the microphone are hosted inside the casing in a way that there is only a minimum distance between those two elements. This is necessary to keep the delays due to the distance between receiver and microphone as small as possible. The plug has been designed in a way to obtain a minimum of total volume underneath the earplug (volume in front of the transducer + residual volume of the ear canal).As a consequence, the efficiency of the receiver is increased at low frequencies, and the resonance of the volume of the ear canal is at a high frequency.
10 100 1k 10kFrequency [Hz]
Contribution of the ANR30
20
10
0
-10
-20
ANR
[dB]
Figure 28: ANR of an active earplug using "hearing aid"-type receivers
The electro-acoustic transfer function of this configuration is shown in figure 28. Although the transfer function of this system is not as flat as that of the piezo-ceramic transducer (there are two distinct resonances at frequencies below 10 kHz) it allows good ANR performance. Simulations of the ANR contribution have been made as shown in Figure 29. One curve (blue) shows the ANR when compensated for maximum bandwidth, the other curve (red) represents the ANR when calculated for maximum level. The low frequency part of this simulation has been kept artificially. If compared to the results with a piezo-ceramic transducer, the bandwidth when yielding maximum ANR is comparable. However, the
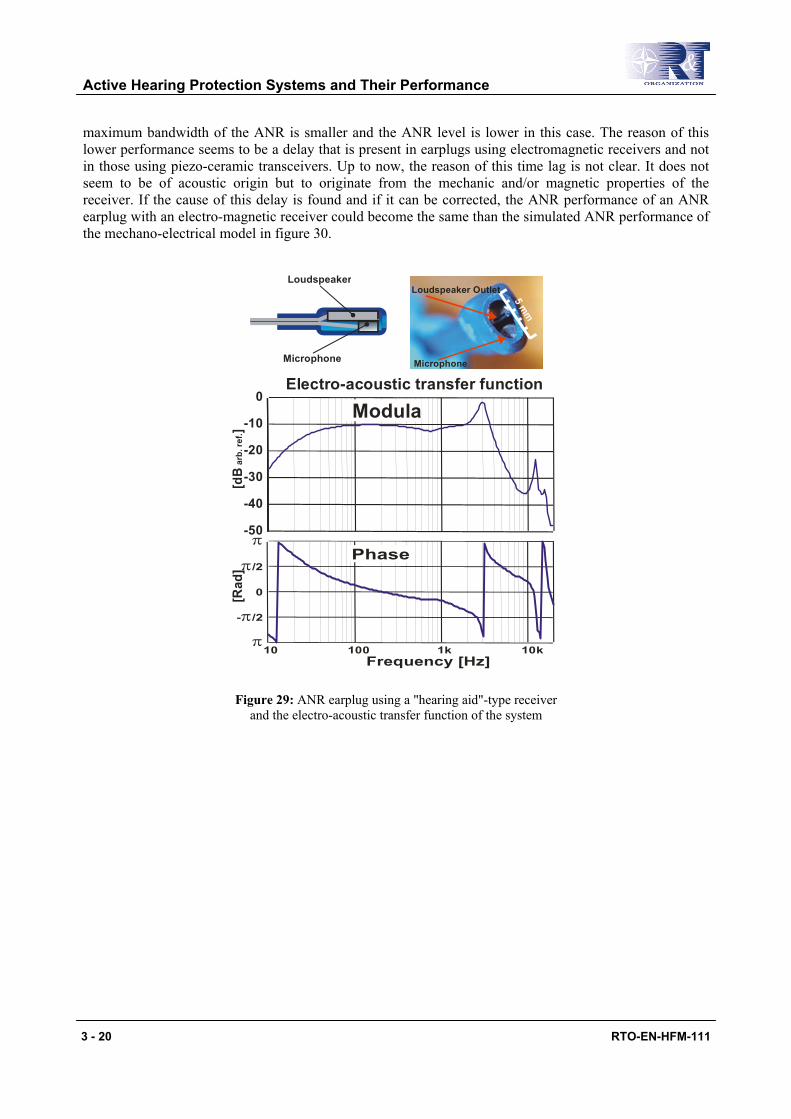
Active Hearing Protection Systems and Their Performance
3 - 20 RTO-EN-HFM-111
maximum bandwidth of the ANR is smaller and the ANR level is lower in this case. The reason of this lower performance seems to be a delay that is present in earplugs using electromagnetic receivers and not in those using piezo-ceramic transceivers. Up to now, the reason of this time lag is not clear. It does not seem to be of acoustic origin but to originate from the mechanic and/or magnetic properties of the receiver. If the cause of this delay is found and if it can be corrected, the ANR performance of an ANR earplug with an electro-magnetic receiver could become the same than the simulated ANR performance of the mechano-electrical model in figure 30.
5 mm
Loudspeaker Outlet
MicrophoneMicrophone
Loudspeaker
0
-10
-20
-30
-40
-50
Modula
[dB
] a
rb. r
ef.
10 100 1k 10kFrequency [Hz]
π
π/2
- /2π
π
0
Phase
[Rad
]
Electro-acoustic transfer function
Figure 29: ANR earplug using a "hearing aid"-type receiver and the electro-acoustic transfer function of the system

Active Hearing Protection Systems and Their Performance
RTO-EN-HFM-111 3 - 21
10 100 1k 10k
20
10
0
-10
ANR
[dB
]
frequency [Hz]
Contribution of the ANR
mechano-electric analogactual receiver
Maximum bandwidth
10 100 1k 10k
30
10
0
-10
ANR
[dB
]
frequency [Hz]
Contribution of the ANR
mechano-electric analogactual receiver
Maximum amplitude
20
Figure 30: Contribution of ANR in an active earplug with an actual receiver (blue) or the electro-mechanic analog (red)
Conclusions When military personnel is exposed to noise with high levels having a very strong low frequency component (armored vehicles, helicopters, propeller driven airplanes …) ANR headsets are a good choice as personnel hearing protector. With the help of the ANR system (complementary to the passive protection of the headset by itself) the efficiency of the soldier is increased. In the frequency range below 500 Hz an ANR headset has an insertion loss that is about 15-20 dB better than a standard hearing protection. This improvement leads to - longer acceptable exposure times. This means longer and more representative training scenarios. - better intelligibility at the same speech level. This leads to a better success rate for missions. - lower noise exposure levels that will induce less fatigue and therefore lead to a better performance of the
soldier. The presently available analog ANR hearing protectors are without any doubt helpful in many situations. However, for some situations, it could be helpful to use more flexible digital ANR devices. In some situations, e.g. ground personnel around jet airplanes, present ANR hearing protectors do not add any protection, in contrary the noise exposure could even increase. These personnel may be exposed to such high levels, that the performance of standard single or double passive hearing protection (ear cups and/or earmuffs) is not enough. Considering the requirements for such protection devices, only ANR earplugs (personal fit if possible) may be suitable. These future devices have to be designed in a way, that the contribution of the ANR at 3 KHz (and higher if possible) should not be less than 7 dB and not less than 10 dB for frequencies lower than 1.5 kHz. There is still some technical challenge to reach this performance. Once arrived at this protection level, the next step for better hearing protection will be the limitation of bone conduction.

Active Hearing Protection Systems and Their Performance
3 - 22 RTO-EN-HFM-111
References 1. Peters L. and Garinther G., "The effects of speech intelligibility on crew performance in a M1A1 tank
simiulator", US Army Human Eng. Lab., Techn. Memorandum, 1990
2. Lueg P., "Process of silencing sound oscillations.", US Patent No. 2043416, 1936
3. Simshauser E.D., Meeker W.F. and Balakrishnan A.V.,"The Noise Cancelling Headset – An Active Ear Defender", Journal Acoustical Society of America, Vol. 28, 1956
4. Carter J., "Active Noise Reduction.", Aerospace Medical Research Laboratory, Wright-Patterson Air Force Base, Report No. AFAMRL-TR-84-008, 1984
5. Brammer A. J., Pan G. J. and Crabtree R. B., "Adaptive feedforward active noise reduction headset for low-frequency noise", proc. ACTIVE 97, Budapest, Hungary, 365-372, 1997
6. Zimpfer V.," Amélioration du traitement numérique des signaux dans les systèmes actifs en protection auditive.", Ph.D. Thesis, INSA de Lyon, N°ISA0101, 2000
7. Steeneken H. J. M. et Verhave J. A., "Personal active noise reduction with integrated Speech communication devices: development and assement.", AGARD conférence proceedings CP-596 : Audio effectiveness in aviation, Copenhagen (Danmark) 1996, p.18.1-18.8.
8. Wessling T., "Erweiterung der Methode nach Houtgast und Steeneken zur Prognose der Sprachverständlichkeit (sog. STI) für Fälle tieffrequenten Lärms hohen Pegels", Diplomarbeit, Ruhr-Universität Bochum, 1997
9. Franke R. , Buck K., Billoud G., Sunyach J., "Protecteur auditif miniaturisé à atténuation active utilisant un filtre numérique", French-German Research Institute Saint-Louis France, Rapport R121/89, 1989
10. Bauer R., "Protecteur auditif actif de type bouchon d’oreille : étude électro-acoustique et réalisation". Ph.D. Thesis, Université du Maine, 2000.
RTO-EN-HFM-111 4 - 1
Assessment and Standardization of Personal Hearing Protection including Active Noise Reduction
Dr. Herman J.M. Steeneken TNO-Human Factors
The Netherlands
Email: [email protected]
Abstract The performance of passive hearing protection is normally quantified by the sound attenuation or insertion loss (IL). The IL allows prediction of the noise level at the eardrum for a given ambient noise spectrum. A subjective test (with test-signal levels at the threshold of hearing) is normally used to measure the sound attenuation. Active noise reduction requires a different assessment method. Due to self-noise and level dependency, assessment methods operating at threshold level cannot be used and have to be replaced by objective methods. The effect of high noise levels and impulsive noises may introduce a non-linear behaviour of active systems. Therefore, the use of artificial heads is applied to avoid the risk of introduction of temporary or permanent hearing loss. Comparison of results from subjective and objective test methods will be discussed. Prediction of the noise dose, representative for a certain noise condition, can be obtained by consideration of the environmental noise spectrum, the insertion loss of the hearing protector and an estimation of the variance of the insertion loss among individual users. Examples of such a prediction (by using a spreadsheet) will be given at the lecture. Speech communication quality is an important issue for use at operational conditions. The noise level at the ear is one of the major variables that define the speech communication quality. Subjective and objective assessment methods for speech communication systems will be presented and discussed. Prediction of the speech intelligibility of a communication system (in a similar condition as presented for the noise dose) will be demonstrated by using an objective intelligibility measure. Some performance measures for hearing protection, speech communication and criteria for speech quality are standardised by international bodies. International standards are provided by ISO, CEN, and IEC. 1. Introduction An important characteristic of a hearing protection device is the Insertion Loss (IL), which quantifies the ability to attenuate environmental noise. In order to derive the IL the attenuation of the hearing protector as a function of frequency the spectrum of the ambient noise should be known. For passive hearing protectors (such as earmuffs and earplugs) methods based on the detection of test-signals at threshold level are normally used.
Paper presented at the RTO HFM Lecture Series on “Personal Hearing Protection including Active Noise Reduction”, held in Warsaw, Poland, 25-26 October 2004; Belgium, Brussels, 28-29 October 2004;
Virginia Beach, VA, USA, 9-10 November 2004, and published in RTO-EN-HFM-111.
Assessment and Standardization of Personal Hearing Protection including Active Noise Reduction
4 - 2 RTO-EN-HFM-111
Assessment of headsets equipped with active noise reduction requires a different approach. ANR systems may introduce audible electronic noise and may show a non-linear behaviour at high noise levels, the use of test-signals at threshold level is therefore not appropriate. As stated above the present standardized methods suitable for ANR devices (see: ISO 4869-1, and ISO 4869-2, EN 352-1 and associated standards EN 13819-1 and EN 13819-2) make use of the threshold of hearing of a subject. Therefore, a special Task Group was established by the NATO-RTO (2001) to develop and evaluate assessment methods for hearing protectors with ANR and specifically for military applications. The Task Group initiated a so-called Round Robin test series in which five laboratories assessed the same set of ANR headsets. This assessment included the passive and active attenuation and the quality of speech communication. Some of the results of this study are discussed in this lecture. The full results are published under the auspices of the RTO-HFM panel [22]. ANR based hearing protectors are equipped with an electro-acoustic system, which can also be used for intercom applications. Assessment should include the speech communication facility. Hearing protection devices in general may give some discomfort to the user and some ANR based systems sometimes show instability that can result in a hazardous noise. This requires ergonomic assessment by users under representative conditions. 2. Insertion Loss and sound attenuation A single number expresses the Insertion Loss provided by a (passive) hearing protector and represents the noise reduction in decibels. It is the difference between the mean sound level at the entrance of the ear canal with and without the hearing protector fitted on the head. The official definition of insertion loss, according to standard EN 13819-2, is: “The mean algebraic difference in decibels between the one-third octave band sound pressure level, measured by a microphone of the acoustic test fixture in a specified sound field under specified conditions with the hearing protector absent, and the hearing protector on, with other conditions identical”. This means that the IL is an application dependent measure. A different spectrum of the environmental noise will result in a different sound level for hearing protectors with the same IL value. For the assessment and comparison of hearing protectors we need a unique quantification of the performance. This is determined by the sound attenuation as a function of frequency. In general this sound attenuation will be user dependent. The main cause of this variance is the fit of the ear-cushions on the head of the user and for earplugs the fit of the plug in the ear canal. A poor system will show differences of the individual attenuation values up to 10 dB at low frequencies, for a good system this will be limited to 3-5 dB. Representative assessment of the sound attenuation should therefore be performed with many subjects. A typical number is 5-16 subjects (depending on the purpose of the assessment). The results are given by the mean sound attenuation in decibels and the corresponding variance expressed by the standard deviation. An example of the attenuation of a custom moulded earplug is given in figure 1. The mean sound attenuation and the standard deviation (the spread in individual results presented by the vertical bars) have been obtained with the REAT method (Real Ear ATtenuation) described in section 2.1.1.
Fig. 1. Average sound attenuation and standard deviation in dB as a function
of test frequency for a custom moulded earplug.

Assessment and Standardization of Personal Hearing Protection including Active Noise Reduction
RTO-EN-HFM-111 4 - 3
With this attenuation curve and the noise spectrum, the IL can be calculated for a specific application. However, the result is based on the mean attenuation curve, hence only 50% of the population is covered by this prediction. A better coverage is obtained by reduction of the mean attenuation with one standard deviation value. This provides coverage of 84% of the population. This method is called the Assumed Protection Value (APV84) [12]. Determination of the attenuation curve of passive systems can be accomplished with subjective and objective test methods. These will be discussed in section 2.1 and 2.2 respectively. The following parameters are of interest for systems equipped with an ANR system:
1. Passive sound attenuation as a function of frequency, 2. Active sound attenuation as a function of frequency, 3. Variance among systems, 4. Variance among users, 5. Stability of the open system during placing on or removing from the head (donning and doffing of
the headset), 6. Sensitivity to vibrations, 7. Maximum sound pressure level (dynamic range), 8. Overload response.
ANR systems are normally integrated in a standard passive hearing protector. This may reduce the passive attenuation. It is therefore of interest to compare the passive attenuation of the headset with and without the ANR system integrated. A poor fit on the head of a user or significant volume reduction under the ear shell may have an affect on the acoustical properties hence, on the ANR performance. Doffing of the headset may trigger oscillations of a feedback based ANR system. Vibrations may introduce a (periodic) volume change under the ear shell and a corresponding sound-pressure variation. This effect may be introduced in the ANR system by the sensing microphone and may also introduce overload of the microphone circuit. Overload of the system will introduce non-linear distortion. This will reduce the effectiveness of ANR [7]. 2.1 Subjective Assessment 2.1.1 Real Ear ATtenuation (REAT) The standardized REAT method is used for assessment of passive hearing protectors like earmuffs and earplugs. With REAT the sound attenuation is determined by measuring subjective hearing thresholds with and without a hearing protector. For this purpose a subject is placed in a diffuse sound field such as obtained in a room as shown in figure 7. A subject is positioned in this room (see figure 2) and exposed to periodic noise bursts from which he/she can control the level. The task is to set the level of the noise burst around the threshold of hearing. Thresholds are measured with a modified von Békésy procedure in which successive presentations are decreased in level by 2 dB as long as the subject indicates, by pressing a button, that the signals are above threshold. The button is to be released when the signal becomes inaudible, after which the level is increased in steps of 2 dB. When the signal is again above threshold, the button is to be pressed anew and the procedure repeats itself. The measurement continues until 10 reversals have occurred. The threshold is taken as the dB average of the last six reversals. Preferred frequencies of the narrow band sound bursts are in octave steps at 125, 250, 500, 1000, 2000, 4000 and 8000 Hz. In figure 3 displays of the level changes for three completed trials at three different frequencies and one trial in progress are given. Presenting the frequencies to each subject in random order minimizes order effects for frequency and the influence of fatigue. The noise bursts have a bandwidth of one octave and duration of 250 ms; the interval between the noise bursts is also 250 ms. Prior to the measurements, the subjects have to be informed on the test situation and procedures and they are instructed how to insert an earplug or placing an earmuff. To help them check the fit of the earplug or muff, a broadband noise with a level of about 70 dBA is presented in the test room. Before starting the measurement, the test leader also performs a visual check of the fit. ISO and CEN standardized this procedure.
Assessment and Standardization of Personal Hearing Protection including Active Noise Reduction
4 - 4 RTO-EN-HFM-111
A number of sixteen subjects is standardized for the measurement of the sound attenuation. They all should have a hearing threshold of at most 15 dB for frequencies of 2000 Hz and below, and at most 25 dB for frequencies above 2000 Hz.
Fig. 2. A subject performing a REAT measurement. Furthermore, it has to be verified that for all subjects, the results of three consecutive threshold measurements, performed according to the standard procedure does not differ more than 6 dB at any test frequency. The measuring procedure is controlled by a computer program, the measuring set-up includes a PC, noise generator, octave-band filter, gate for control of the sound burst, and a subject response unit. The experimenter has feedback on the actions of the subject and the corresponding sound level. After 10 level reversals, the mean level is calculated from the last 6 and displayed in the matrix. Then the program switches to the next, randomly selected, frequency. The sound attenuation of the earmuff under test is to be taken as the decibel difference between the open- and occluded-ear threshold measurements. Over all 16 subjects, the average values and standard deviations are to be determined for each frequency (see figure 1). Subsequently, the Assumed Protection Value for 84% of the population (APV84) is obtained by subtracting the standard deviation from the mean value. 2.1.2 Level matching for ANR-systems For subjective measurement of the ANR-attenuation (not including the passive attenuation) two methods are available: 1. Subjective matching of the loudness of two sound levels, representative for the additional attenuation of the ANR system [13]. 2. Determining the masking of a test tone as a function of frequency [21].
Assessment and Standardization of Personal Hearing Protection including Active Noise Reduction
RTO-EN-HFM-111 4 - 5
Fig. 3. Display on the experimenter station during a REATmeasurement. (1). For the subjective loudness matching a subject (with a separate ANR system for each ear) is placed in a diffuse sound field. The sound level alternates periodically between two levels (typically every second). An example of this level alternation is given in figure 4.
Figure 4. Test signal level as a function of time for the subjective measurement of the suppression of an ANR system. The ANR system is switched
on and off simultaneously with the test signal envelope.
During the highest sound pressure level the ANR system is switched “on”, while during the lower sound level the ANR system is switched “off”. The subject only hears a small difference between the two sound levels, as the ANR system will attenuate the highest level only. The subject is asked to match both levels for equal loudness by adjusting the level difference, ∆L, between the two signals. The resulting difference in sound level outside the earmuff is equal to the (subjective) attenuation provided by the ANR system.
Assessment and Standardization of Personal Hearing Protection including Active Noise Reduction
4 - 6 RTO-EN-HFM-111
Since the subject perceives a continuous signal he/she may loose track with the alternation rhythm, therefore the on-off alternations are to be indicated by a visual display (light signal). A study showed that the reproducibility lies between 1-3dB. It should be noted that the subject provides a response based on two ear listening. This type of measurement has to be performed in a specific room with a diffuse sound field. The test signals are 1/3 octave-bands of noise and measurements are performed in one-octave steps. The absolute signal level can be adjusted to any level that is high enough not to interfere with the system noise. However, as the noise reduction of ANR systems may be level dependent, the measurements should be performed systematically as a function of the level. The results obtained with this method will be compared in section 2.3 with results of two objective methods described in section 2.2. (2). The masking method as proposed by Zera et al. [21] is based on detection of a pure tone that is masked by noise. The detection threshold will shift when the ANR system is switched on/off. This is related to the attenuation provided by the ANR. This method was not included in the round robin as the level calibration of the test tone is dependent on the ANR system and hence, no benefit with respect to the MIRE method (see 2.2.1) will be obtained. 2.2 Objective Assessment 2.2.1 MIRE-method Two somewhat related methods might be used for measuring the sound attenuation of ANR-systems: (1) Comparison of the sound pressure level measured under the earmuff with the ANR system switched on and off. The level difference between the two measurements gives the additional sound attenuation provided by the ANR system. The sound pressure level is obtained from the sense-microphone (loop-microphone) of the ANR-system. The loop-microphone is part of the ANR system and positioned close to the loudspeaker or telephone cartridge in order to minimize the time delay in the feedback loop. It is normally not possible to tap the microphone output with a commercial system. (2) Similar measurements as described under (1) by making use of an additional microphone, positioned close to the entrance of the ear canal (MIRE, Microphone In Real Ear). This method is also applicable for passive systems. The active sound attenuation can be obtained by measuring the difference between the sound pressure level under the ear shell with the ANR system switched on and off. The additional microphone is placed close to the entrance of the ear canal (Figure 5). This MIRE method will be considered as a international standard for measuring the acoustic attenuation of ANR based hearing protection devices (EN 352-5). The MIRE method allows a comparison of the levels at an occluded (ANR switched on and off) and unoccluded ear. This comparison provides the total, passive, and active attenuation of the ANR device. The noise level and noise spectrum used for the assessment of the performance of the ANR headset should be identical to the noise level and spectrum of the environmental noise in which the device will be used. ANR systems may have a level dependent performance therefore; it is advised to determine the attenuation as a function of the noise level. The attenuation may be determined for both the left and right ear cups as a function of the frequency in 1/3 octave-bands using a spectrum analyser.

Assessment and Standardization of Personal Hearing Protection including Active Noise Reduction
RTO-EN-HFM-111 4 - 7
A B Figure 5. Microphone configuration used for the MIRE-method.
2.2.2. Microphone in artificial ear (MIArtE) Exposure of a subject to a high noise level may introduce temporary or permanent hearing loss. Therefore, a pilot test can be performed in which the subject is replaced by an artificial ear or head (MIArtE, MIcrophone in Artificial Ear, Figure 6). An option is to use a standardized artificial ear with a test microphone inside the ear canal and with a representative cavity.
Figure 6. Artificial ear mounted in an artificial head (MIArtE). The method can also be used with a similar microphone as is used with the MIRE-method but placed in the concha of an artificial ear. A very simple method is to use a microphone mounted in a flat plate coupler; see Figure 8 [3, 6, 20]. These three objective methods were compared in the round robin test (see section 2.4). The objective attenuation is determined in 1/3 octave frequency bands by subtraction of the 1/3 octave spectra obtained with the test microphone, with and without the hearing protector placed on the head. The preferred frequency range is 12.5 Hz to 20 kHz. (Note: Most acoustic test facilities cannot provide a diffuse acoustic field at frequencies below 50 Hz and generation of sufficient sound pressure levels in a large volume test chamber at low frequencies is difficult and can be expensive). The dynamic range of the system (maximum level of the acoustical noise outside the hearing protector to the minimum noise level under the hearing protector) determines the range of attenuation values that can be obtained accurately. With the use of an active system the minimum noise level will increase due to the electronic self-noise of the system. The noise measured under an ear cup mounted on the head of a subject may additionally introduce physiological noise. A typical environment for measurements performed with subjects or with a dummy head is shown in figure 7.
Assessment and Standardization of Personal Hearing Protection including Active Noise Reduction
4 - 8 RTO-EN-HFM-111
Figure 7. Artificial head placed in a high noise room, designed for generation of a diffuse sound field (max. 120 dBA). Two of the five high power loudspeakers (back view) are visible at the left.
In the center of the wall a sound absorption module is placed. The small loudspeakers are not used (these are available for REAT experiments).
2.2.3 Testing at high stationary noise levels For stationary noises a high continuous (stationary) noise level and a simple flat plate coupler in a small enclosure can be used. Such a system consists of a microphone mounted in a dummy head with flat sides. However, this type of fixture can introduce errors due to the increase in the trapped volume due to lack of a pinna-simulator and the flat sides. The small volume allows easy generation of high noise levels, although the resulting sound field will not be diffuse. With the system shown in figure 8 levels up to 130 dBA can be achieved [20].
Figure 8. Dummy head with “flat-plate” microphone in a volume suitable for relatively high noise levels (130 dBA).
2.2.4 Testing at high impulsive noise levels Impulsive noise will introduce much higher levels, for a short period of time. The Institute Saint Louis developed a specific test for this type of noise [1,2]. In the military environment, crews are regularly exposed to munitions noise and hearing protectors should therefore also be evaluated under these
Assessment and Standardization of Personal Hearing Protection including Active Noise Reduction
RTO-EN-HFM-111 4 - 9
conditions. The peak levels needed for a realistic evaluation (150 dB to 190 dB) of such an exposure is created using explosive charges. In order to avoid overload of the microphones in an unoccluded condition the Transfer Function of the Open Ear (TFOE) has to be determined. The procedure can be performed at low levels. Once this function is known, the attenuation can be calculated: Att (f) = Lfree field (f) – Lprotected ear (f) + TFOE (f) The pressure-time history for the free field and at the ear underneath the ear cup is measured simultaneously using the set-up shown in figures 9 and 10. The attenuation is calculated using the above formula in 1/3 octave bands. As the signals created by explosive charges are highly reproducible, this method can also be used to show the influence of the ANR system on the time signal. If the pressure-time history underneath the ear cup is measured with the ANR system switched on/off, the difference between these two measurements represents the pressure signal produced by the ANR system.
Figure 9. Measuring set-up for the attenuation measurement by using explosive charges.
The use of explosive charges as an impulse noise source associated with the above measurement method, allows the evaluation of the effectiveness of ANR hearing protectors for all noise levels that can be found in a military environment. It also allows determination of the limits of the electro-acoustic system and its behaviour in an overload condition.
Figure 10. Experimental set-up for attenuation measurements with impulsive noise at ISL.
Assessment and Standardization of Personal Hearing Protection including Active Noise Reduction
4 - 10 RTO-EN-HFM-111
2.3 Comparison of subjective and objective measuring results Experimental results of subjective and objective attenuation measurements for an ANR system were compared. The subjective attenuation was measured according to the method described in 2.1.1 with four subjects and various signal levels. For one of the conditions the 1/3 octave-band signal level was 105dB SPL. The mean attenuation for this condition, as a function of frequency with one-octave steps, is given in figure 11.
Figure 11. Mean sound attenuation measured with 4 subjects in one-octave intervals, for the subjective level matching and objective methods.
The objective attenuation (of the ANR system only) was measured with the loop microphone as well as with the MIRE-method (see 2.2.1.). For the objective measurement a pink noise (level 105 dB SPL) was used. The results indicate that the attenuation values obtained with the subjective level matching method and those obtained with the additional microphone (MIRE) are in close agreement. The attenuation values obtained with the loop microphone are somewhat higher (2-5 dB). Obviously, the sound field under the earmuff is not homogeneous and is minimal at the sensing position of the loop microphone. The MIRE-method provides a good prediction of the subjective results. 2.4 Validity of subjective and objective measuring methods The Task Group on “Assessment of personal active noise reduction” HFM-094 /TG-028 performed a Round Robin test. A Round Robin test implies that several laboratories perform the same tests with the same systems. Such an experimental design provides information on the reproducibility of the test methods included in the Round Robin. Various assessment methods were used, however it was suggested that all laboratories assess the attenuation of the systems for the passive, and the active conditions. The common experiments included measuring methods that use a subject in order to consider the fit of the earmuff to the human head. For some countries noise regulations do not allow the use of human subjects. In this case an artificial head or artificial ear had to be used. The use of high noise levels and tests with subjects may induce hearing damage. Therefore, participants were encouraged to also use artificial heads or artificial ears in order to compare results of these different methods. Five laboratories participated in the Round Robin test. These were: DRDC, Canada; ISL, France; TNO Human Factors, the Netherlands; Qinetiq, UK; and HECB, USA.
Assessment and Standardization of Personal Hearing Protection including Active Noise Reduction
RTO-EN-HFM-111 4 - 11
The tests included: 1. Passive, active, and total attenuation of five headsets, 2. The experimental designs include 5-10 replicas and a limited group of subjects, 3. Speech communication quality (intelligibility), 4. Human factors.
The methods that were used for the attenuation were: MIRE, MIArtE, High noise, and Impulsive noise. For speech communication the subjective MRT and the objective STI were used. Two laboratories performed a human factors test. The final report of the Round Robin is published by the RTO [22], in this overview we will give some of the results. 2.4.1 Attenuation measurements The fit of a headset may differ from person-to-person. This implies that leakage as well as trapped volume underneath the earcup may occur and that both the passive and active attenuation may vary. Hence, the spread of the attenuation values obtained with different subjects is a measure for the “goodness of the fit” and the inter-individual differences in morphology. In figure 12 an example of the mean attenuation as a function of frequency is given for two measured conditions (passive and total insertion loss) and the calculated attenuation contributed by the ANR system. The vertical bars represent the standard deviation based on the number of measurements (5 to 10 different subjects). It is clear that the standard deviation values are small for the active attenuation and larger for passive and total attenuation. This may be explained by the small sensitivity of the ANR to acoustic impedance changes. For the passive attenuation, leakage is one of the important parameters while for an ANR system the effect of leakage is smaller. Comparison of inter-subject variance with intra-subject variance provides information about the necessity to measure with many subjects and a few or no replica’s or with few subjects and many replicas. In figure 13 an example is given for the mean attenuation curves obtained with one subject and repeated measures performed at different sessions and at different days. The intra standard deviations are much smaller than the inter (subject) standard deviations.
-10.0
0.0
10.0
20.0
30.0
40.0
50.0
12.5 25 50 10
020
040
080
016
0031
5063
0012
500
1/3 octave band (Hz)
Atte
nuat
ion
(dB
)
PASSIVE LEFT TOTAL LEFT ACTIVE LEFT
System 3
Figure 12. Example of the total, passive and ANR attenuation of headset 3
as a function of frequency. The curves present the mean attenuation obtained for 5 subjects measured on the left earcup.
The vertical bars indicate the standard deviation.
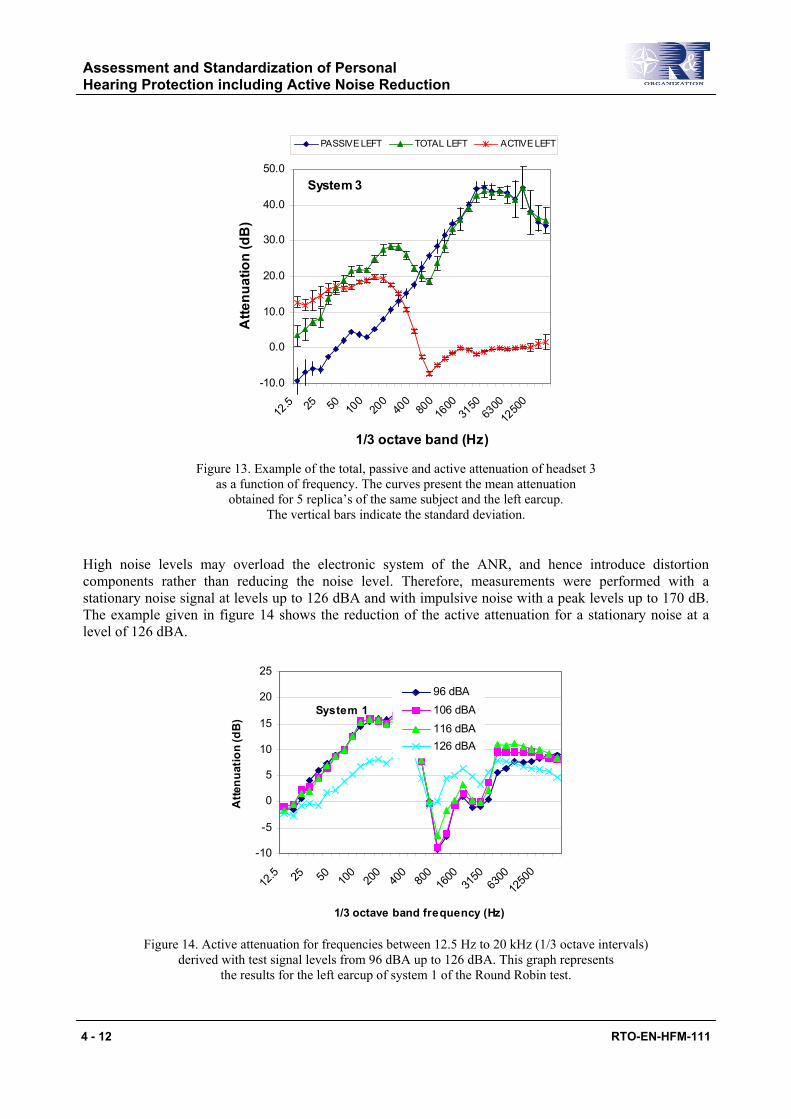
Assessment and Standardization of Personal Hearing Protection including Active Noise Reduction
4 - 12 RTO-EN-HFM-111
-10.0
0.0
10.0
20.0
30.0
40.0
50.0
12.5 25 50 10
020
040
080
016
0031
5063
0012
500
1/3 octave band (Hz)
Atte
nuat
ion
(dB
)
PASSIVE LEFT TOTAL LEFT ACTIVE LEFT
System 3
Figure 13. Example of the total, passive and active attenuation of headset 3
as a function of frequency. The curves present the mean attenuation obtained for 5 replica’s of the same subject and the left earcup.
The vertical bars indicate the standard deviation.
High noise levels may overload the electronic system of the ANR, and hence introduce distortion components rather than reducing the noise level. Therefore, measurements were performed with a stationary noise signal at levels up to 126 dBA and with impulsive noise with a peak levels up to 170 dB. The example given in figure 14 shows the reduction of the active attenuation for a stationary noise at a level of 126 dBA.
-10
-5
0
5
10
15
20
25
12.5 25 50 10
020
040
080
016
0031
5063
0012
500
1/3 octave band frequency (Hz)
Atte
nuat
ion
(dB
)
96 dBA106 dBA116 dBA126 dBA
System 1
Figure 14. Active attenuation for frequencies between 12.5 Hz to 20 kHz (1/3 octave intervals)
derived with test signal levels from 96 dBA up to 126 dBA. This graph represents the results for the left earcup of system 1 of the Round Robin test.

Assessment and Standardization of Personal Hearing Protection including Active Noise Reduction
RTO-EN-HFM-111 4 - 13
3. Communication quality 3.1 Subjective intelligibility measure-ment Subjective intelligibility tests can be largely categorised by the speech items tested and by the response procedure used. The smallest items tested are at the segmental level, e.g., phonemes. Other test items are CVC combinations (Consonant-Vowel-Consonant), nonsense words, meaningful words, and sentences. Besides intelligibility scores the speech quality can be determined by questionnaires or scaling methods, using one or more subjective scales such as: overall impression, naturalness, noisiness, clarity, etc. Speech quality assessment is used for communications with a high intelligibility, for which most tests based on intelligibility scores cannot be applied because of ceiling effects. The overview given below describes representative tests from this segmental level up to sentence level, as well as tests giving a general impression of transmission or speech quality. 3.1.1. Tests at phoneme and word level A frequently used test for determining phoneme scores is the rhyme test. A rhyme test is a forced-choice test in which a listener, after each word that is presented, has to select his response from a small group of visually presented alternatives. In general, the alternatives only differ with respect to the phoneme at one particular position in the test word. A frequently used rhyme test is the Modified Rhyme Test (MRT, testing consonants and vowels). The MRT is based on six alternatives [5]. A general approach is obtained with a test with an open response, such as with monosyllabic word tests (Fletcher, 1929). Open response tests make use of short nonsense or meaningful words of the CVC type. Sometimes VCV words, CV words, VC words, CCVC words, or CVCC words are used. This may depend on features of the particular language or the wish to evaluate specific clusters such as consonant clusters or diphone clusters. With nonsense words and an open response, the listener can respond with any combination of phonemes corresponding to the type of word as defined beforehand. This procedure requires extensive training of the listeners. Listeners give their response on a keyboard that allows automatic scoring of the responses. In figure 15 a panel of 4 listeners performs a CVC listening task in an anechoic room. The test results can be presented as phoneme scores and word scores but also confusions between the initial consonants, vowels, and final consonants can be derived. The confusion matrices obtained with open response tests provide useful (diagnostic) information for improving the performance of a system. Multidimensional scaling techniques may help to visualize the relations between the stimuli. With word tests it is recommended to use embedded words in a carrier phrase. Such a carrier phrase (which is neglected in many studies) will cause representative echoes and reverberation in conditions with a distortion in the time domain. Also automatic gain control (AGC) settling will be established by the carrier phrase. An important aspect of using a carrier phrase is also that it stabilizes the vocal effort of the speaker during the pronunciation and that it reduces the vocal stress on the test words. Finally it can function as a cue to the listener that the next test word is going to be presented.
Figure 15. Listening panel performing a CVC listening task.

Assessment and Standardization of Personal Hearing Protection including Active Noise Reduction
4 - 14 RTO-EN-HFM-111
3.1.2. Tests at sentence level Sentence intelligibility is sometimes measured by asking the subjects to estimate the percentage of words correctly heard on a 0-100% scale. This scoring method tends to give a wide spread among listeners. Sentence intelligibility saturates to 100% at poor signal-to-noise ratios (SNR 0 dB), the effective range is small. 3.1.3. Quality rating Quality rating is a generic method, used to evaluate the user's acceptance of a transmission channel or speech output system. For quality ratings, normal test sentences or a free conversation are used to obtain the listener's impression. The listener is asked to rate his impression on a subjective scale such as the five-point scale: bad, poor, fair, good, and excellent. Different types of scales are used, including: intelligibility, quality, acceptability, natural-ness, etc. Quality rating or the so-called Mean Opinion Score (MOS) gives a wide variation among listener scores. The MOS does not give an absolute measure since the scales used by the listeners are not calibrated. Therefore the MOS can be used only for rank-ordering conditions. For a more absolute evaluation, the use of reference conditions is required as an anchor. 3.2 Relation between various measures Fig. 16 gives, for five intelligibility measures, the score as a function of the signal-to-noise ratio of speech masked by noise. This gives an indication of the effective range of each test. The relation between intelligibility scores and the signal-to-noise ratio is valid only for noise with a frequency spectrum similar to the long-term speech spectrum, which makes the signal-to-noise ratio the same for each frequency band. This is for instance the case with voice-babble. A signal-to-noise ratio of 0 dB means that speech and noise have an equal spectral density. As can be seen from the graph, the CVC-nonsense words discriminate over a wide range, while meaningful test words1 have a slightly smaller. The digits and the alphabet (not shown) give saturation at a signal-to-noise ratio of 5 dB. This is due to: (a) the limited number of test words and (b): the fact that recognition of these words is controlled mainly by the vowels rather than by the consonants. Vowels have an average level approximately 5 dB above the average level of consonants, and are therefore more resistant to noise. On the other hand non-linear distortions, such as clipping, will have a greater impact on vowels than on consonants. Therefore the use of the digits and the alphabet, for which recognition is based mainly on vowels, may lead to misleading results. 3.3 Objective prediction of intelligibility There are various methods to predict speech intelligibility, either by direct measurement or by making use of the physical properties of a channel under test. A standardized objective method to predict speech intelligibility (either by measure-ment or by calculation) is provided by the STI (Speech Transmission Index [14], and by a revised version STIr [16, 19].
1 Meaningful test words are normally phonetically balanced (PB), hence the frequency distribution of the phonemes is
representative for the language used.

Assessment and Standardization of Personal Hearing Protection including Active Noise Reduction
RTO-EN-HFM-111 4 - 15
111
Inte
lligi
bilit
y sc
ore
(%)
0
20
40
60
80
100
0.0 0.2 0.4 0.6 0.8 1.0
PB-words
CVCEQB
STIrbad goodfairpoor excellent
sentences(non-optimized SRT)
Figure 16. Qualification and relation between some intelligibility scores. The method is standardized by IEC (IEC 60268-16, 3rd edition, 2002). The STI is obtained by applying a specific speech-like test signal at the audio input and by analysis of this transmitted test signal through the same measuring microphone as used with the MIRE method. For application with an ANR system the STI is measured as a function of the environmental noise level at a condition with and without the ANR system switched on. The STI for a specific communication system with ANR as a function of the noise level is given in figure 17. Hence, the effect of the ANR on the STI-value can be obtained by comparing two conditions. In addition to the STI-value a qualification (based on STI) is also given. The improvement of the speech transmission quality for this example is obvious. It is shown that a 10 dB higher noise level can be applied at a constant speech intelligibility of STI=0.7. Hence, the effective improvement in this situation and for this type of noise is 10 dB. 3.4 Round Robin Speech communication performance Objective measurements are not laborious and therefore allow studying the effect of a variable as a function of its level. In figure 18 the results of such a study are given for the STI as a function of the environmental noise level. The results show that this system provides a fair intelligibility for noise levels above 95 dBA (STI > 0.45).
Figure 17 STI at three noise levels for an ANR system switched on and off.
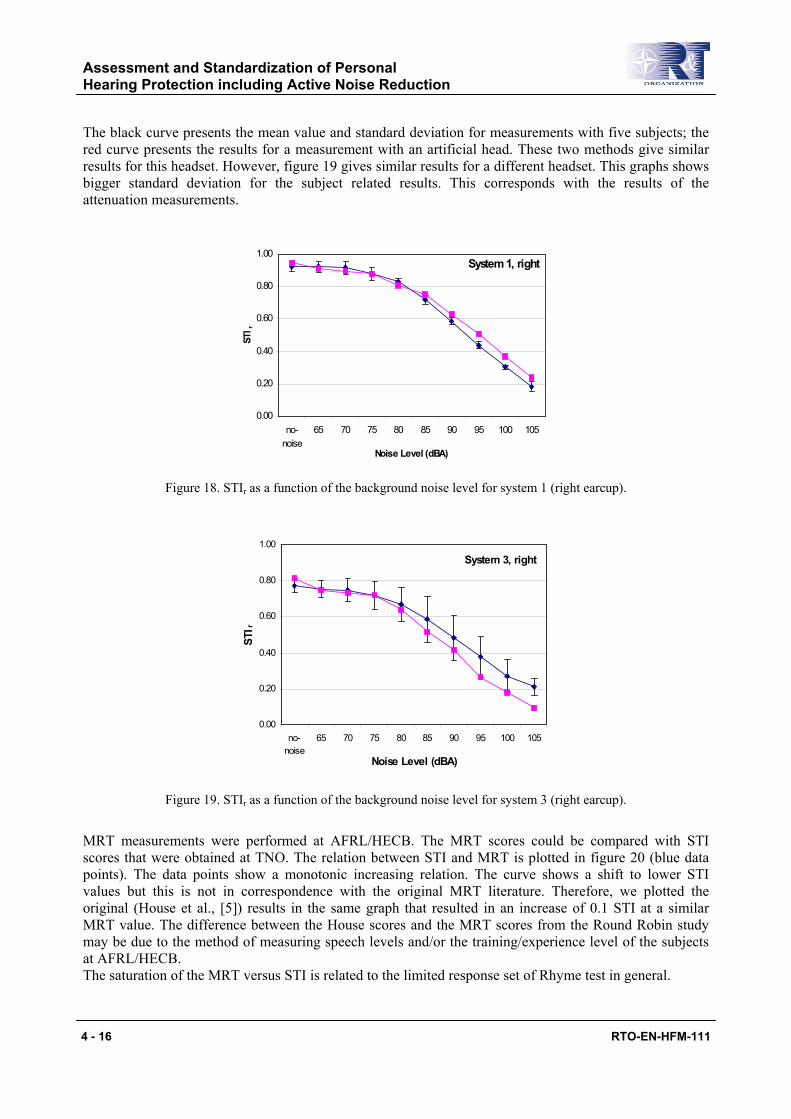
Assessment and Standardization of Personal Hearing Protection including Active Noise Reduction
4 - 16 RTO-EN-HFM-111
The black curve presents the mean value and standard deviation for measurements with five subjects; the red curve presents the results for a measurement with an artificial head. These two methods give similar results for this headset. However, figure 19 gives similar results for a different headset. This graphs shows bigger standard deviation for the subject related results. This corresponds with the results of the attenuation measurements.
System 1, right
0.00
0.20
0.40
0.60
0.80
1.00
no-noise
65 70 75 80 85 90 95 100 105
Noise Level (dBA)
STI r
Figure 18. STIr as a function of the background noise level for system 1 (right earcup).
System 3, right
0.00
0.20
0.40
0.60
0.80
1.00
no-noise
65 70 75 80 85 90 95 100 105
Noise Level (dBA)
STI r
Figure 19. STIr as a function of the background noise level for system 3 (right earcup).
MRT measurements were performed at AFRL/HECB. The MRT scores could be compared with STI scores that were obtained at TNO. The relation between STI and MRT is plotted in figure 20 (blue data points). The data points show a monotonic increasing relation. The curve shows a shift to lower STI values but this is not in correspondence with the original MRT literature. Therefore, we plotted the original (House et al., [5]) results in the same graph that resulted in an increase of 0.1 STI at a similar MRT value. The difference between the House scores and the MRT scores from the Round Robin study may be due to the method of measuring speech levels and/or the training/experience level of the subjects at AFRL/HECB. The saturation of the MRT versus STI is related to the limited response set of Rhyme test in general.
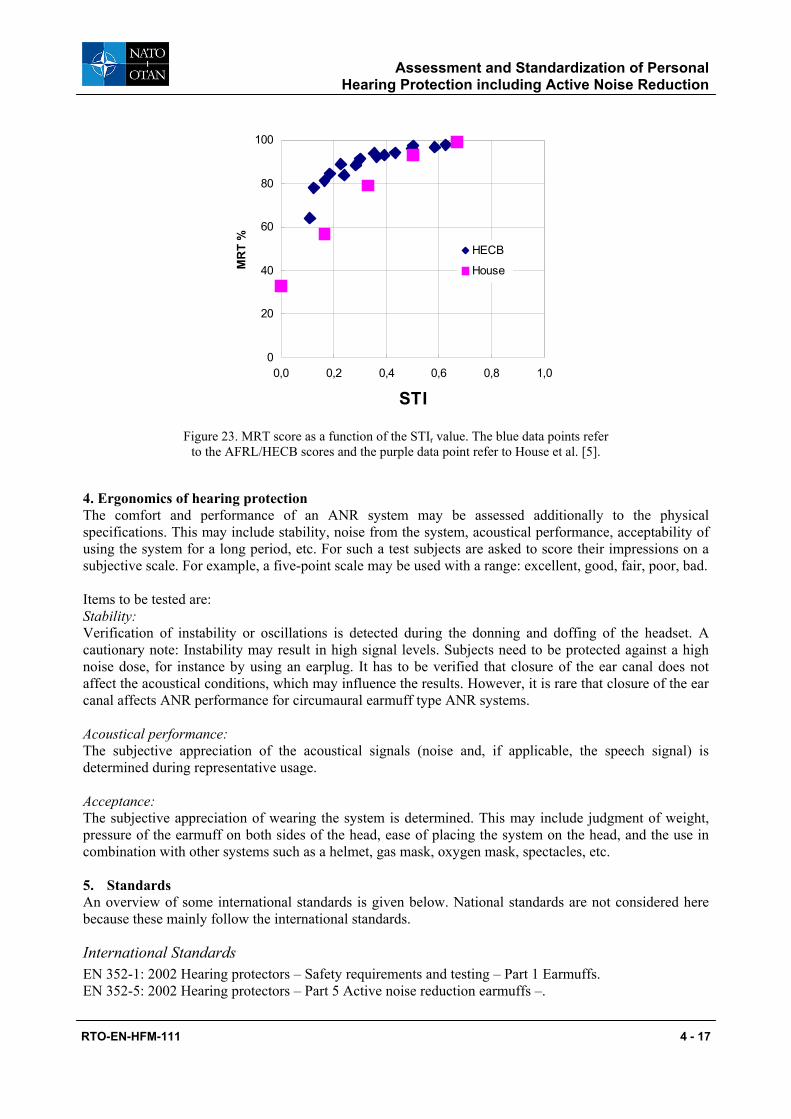
Assessment and Standardization of Personal Hearing Protection including Active Noise Reduction
RTO-EN-HFM-111 4 - 17
0
20
40
60
80
100
0,0 0,2 0,4 0,6 0,8 1,0
STI
MR
T %
HECB
House
0
20
40
60
80
100
0,0 0,2 0,4 0,6 0,8 1,0
STI
MR
T %
HECB
House
Figure 23. MRT score as a function of the STIr value. The blue data points refer to the AFRL/HECB scores and the purple data point refer to House et al. [5].
4. Ergonomics of hearing protection The comfort and performance of an ANR system may be assessed additionally to the physical specifications. This may include stability, noise from the system, acoustical performance, acceptability of using the system for a long period, etc. For such a test subjects are asked to score their impressions on a subjective scale. For example, a five-point scale may be used with a range: excellent, good, fair, poor, bad. Items to be tested are: Stability: Verification of instability or oscillations is detected during the donning and doffing of the headset. A cautionary note: Instability may result in high signal levels. Subjects need to be protected against a high noise dose, for instance by using an earplug. It has to be verified that closure of the ear canal does not affect the acoustical conditions, which may influence the results. However, it is rare that closure of the ear canal affects ANR performance for circumaural earmuff type ANR systems. Acoustical performance: The subjective appreciation of the acoustical signals (noise and, if applicable, the speech signal) is determined during representative usage. Acceptance: The subjective appreciation of wearing the system is determined. This may include judgment of weight, pressure of the earmuff on both sides of the head, ease of placing the system on the head, and the use in combination with other systems such as a helmet, gas mask, oxygen mask, spectacles, etc. 5. Standards An overview of some international standards is given below. National standards are not considered here because these mainly follow the international standards.
International Standards EN 352-1: 2002 Hearing protectors – Safety requirements and testing – Part 1 Earmuffs. EN 352-5: 2002 Hearing protectors – Part 5 Active noise reduction earmuffs –.
Assessment and Standardization of Personal Hearing Protection including Active Noise Reduction
4 - 18 RTO-EN-HFM-111
Associated standards: EN 13819-1: 2002 Acoustics - Physical test methods, and EN 13819-2: 2002 Acoustics - Acoustic test methods. EN 24869-1: 1990 Acoustics – Hearing protectors – Part 1: Subjective method for the measurement of sound attenuation. ISO 4869-1: 1990 Acoustics – Hearing protectors – Part 1: Subjective method for the measurement of sound attenuation. ISO 4869-2: 1994 Acoustics – Hearing protectors – Part 2: Estimation of effective A-weighted sound pressure levels when hearing protectors are worn. IEC 60268-16 third edition 2002-03, Part 16: Objective rating of speech intelligibility by Speech Transmission Index. IEC 60849 edition 1998, “Sound systems for emergency purposes” (This standard will be replaced by ISO). ISO TR 4870, first edition 1991-12-15. Acoustics: The construction and calibration of speech intelligibility tests. ISO 9921, “Ergonomics -Assessment of speech communication” (First edition, 2003-10-15). ISO 11904-1:2002, Acoustics - Determination of sound immissions from sound sources placed close to the ears - Part 1: Technique using microphones in real ears (MIRE-technique)
6. Summary The performance of passive hearing protection is normally determined by subjective tests in which the threshold of hearing for a number of subjects is obtained with and without a hearing protector. The difference between the two threshold levels quantifies the insertion loss of the hearing protector. The insertion loss is determined at a number of frequencies. Active noise reduction systems require a different assessment method. Due to self-noise and noise-level dependency, methods operating at threshold level cannot be used. The effect of high noise levels and impulsive noise may introduce a non-linear behaviour of active systems. Therefore the use of artificial heads (to avoid the risk of introducing hearing loss of subjects) is applied. Comparison of results from subjective and objective test methods is a good agreement. Speech communication quality is an important issue for a user in operational conditions. The noise level at the ear is one of the major variables that define the speech communication quality. Subjective and objective assessment of speech communication systems is a method to predict performance under realistic conditions. Some of the performance measures are standardised by international bodies.
7. References [1] Buck K. and Parmentier G., (1996). "Evaluation of active hearing protectors with high level impulse noise". Proceedings of Internoise, Liverpool, 989-992. [2] Buck K., Parmentier G., (1999) “Artificial Heads for High Level Impulse Sound Measurement”, Proceedings of International Congress on Sound and Vibration (ICSV). [3] Crabtree, R.B., and Behar, A. (2000). “Measurement of hearing protection insertion loss at ultrasonic frequencies”. Applied Acoustics, 59, 287-299. [4] Green, D.M. (1993). “Maximum likelihood method for estimating thresholds in a yes-no task”, J. Acoust. Soc. Am., 93(4), pp.2096-2105.
Assessment and Standardization of Personal Hearing Protection including Active Noise Reduction
RTO-EN-HFM-111 4 - 19
[5] House, A.S., Williams, C.E., Hecker, M.H.L., Kryter, K.D., (1965). “Articulation testing methods: Consonantal differences with a closed-response set.” J. Acoust. Soc. Am. 37, 158-166. [6] James, Susan. H. (1990). “In-flight assessment of a helmet mounted active noise reduction system in Sea Harrier FRS1”. KMT Harpur. January 1990. [7] James, Susan H. (2001). “A noise survey of the Sea Harrier cockpit and an assessment of the benefits an Active Noise Reduction headset may provide”. QINETIQ/FST/CSS/CR011650/1.0. [8] Lueg, P. (1936). “Process of silencing sound oscillations”. US Patent No. 2043416. [9] McKinley, R.L. and Nixon, C.W. (1993) “Active noise reduction headsets”. Proc. 6th Int. Conference on Noise as Public Health problem, Nice, pp83-86. [10] Parmentier G., Dancer A., Buck K., Kronenberger G., Beck C. (2000). “Artificial Head (ATF) for Evaluation of Hearing Protectors”, Acustica, 86, 847-852. [11] Rood, G.M. and James, S.H. (2003) “Evaluation of assessment methods of Active Noise Reduction Systems in an International Round Robin: Part1; UK National Report”. QinetiQ/FST/TR034699/1.0 April 2003. [12] Smoorenburg, G.F., Bronkhorst, A.W., Soede, W., and Reus A.J.C. de. (1993) “Assessment of hearing protector performance in impulse noise. Feasibility study part II: Methods”. Report IZF 1993-C32, TNO Human Factors, Soesterberg, the Netherlands. [13] Steeneken, H.J.M. & Verhave, J.A. (1997). Personal active noise reduction with integrated speech communication devices: development and assessment. AGARD Conference Proceedings 596, Audio effectiveness in aviation, Neuilly-sur-Seine: AGARD (pp. 18-1 - 18-8). [14] Steeneken, H.J.M., and Houtgast, T. (1980). “A physical method for measuring speech-transmission quality”, J. Acoust. Soc. Am., 67, 318-326. [15] Steeneken, H.J.M., (1998). "Personal Active Noise Reduction with integrated Speech Communication devices: development and assessment". Noise and Health 1998; 1:67-75. [16] Steeneken, H.J.M., and Houtgast, T. (1999). “Mutual dependence of the octave-band weights in predicting speech intelligibility”. Speech Communication, 1999, vol.28, 109-123. [17] Steeneken, H.J.M., Buck, K, Crabtree, B., James, S., McKinley, R. (2001). ”Standardized assessment of personal active noise reduction”. International Military Noise Conference, Baltimore, Maryland, 24-26 April. [18] Steeneken, H.J.M., Verhave, J.A. (2001). “Digitally controlled Active Noise Reduction with integrated Speech Communication”. Proc CIOP noise conference, Kielce Poland. [19] Steeneken, H.J.M., and Houtgast, T. (2002). “Validation of the revised STIr method”. Speech Communication, 2002, vol. 38. [20] Steeneken, H.J.M., and Verhave, J.A. (2003). “Evaluation of Assessment methods for Personal Active Noise Reduction in an International Round Robin”. Report TNO-TM-03-A015, TNO-Human Factors, Soesterberg, the Netherlands. [21] Zera, J., Brammer, A.J., and Pan, G.J., (1997). “Comparison between subjective and objective measures of active hearing protector and communication headset attenuation. J. Acoust. Soc. Am. 101 (6), 3486-3497. [22] “Assessment methods for Personal Active Noise Reduction validated in an International Round Robin”, (Méthodes d'évaluation des protecteurs auditifs à atténuation active du bruit). Report TR-HFM-094, 2004, NATO-RTO, Neuilly sur Seine.
Assessment and Standardization of Personal Hearing Protection including Active Noise Reduction
4 - 20 RTO-EN-HFM-111

RTO-EN-HFM-111 5 - 1
Defining the Cockpit Noise Hazard, Aircrew Hearing Damage Risk and the Benefits Active Noise Reduction Headsets Can Provide
Miss S. James Future Systems & Technology Division
QinetiQ, Farnborough, Hants GU14 OLX, UK
Abstract
Over the years, cockpit noise levels in military aircraft have been steadily increasing, particularly in fast jets. As the noise levels increase, greater levels of personal hearing protection are required to keep aircrew noise dose within legislative levels and speech and non-speech signal communications intelligible during front line operations. If the predictions of noise levels in the next generation of fast jets are confirmed, then even more effective mitigation techniques will be needed.
This paper outlines the problem areas in the military cockpit including the contribution cockpit noise and electrical communications make to aircrew noise dose and the benefits offered by newer personal protection technologies such as Active Noise Reduction. Results of both experimental trials and in-service operational trials are presented.
1 Introduction In recent years a number of surveys have been conducted in a variety of military aircraft. These have shown that even with the very best hearing protection some aircrew are still being exposed to a noise dose in excess of the current legislative criteria set out in the UK’s Health & Safety Executive’s (HSEs) Noise at Work regulations. This situation will be further exacerbated in February 2006 when new and more stringent noise legislation arising from the EU’s Physical Agents Directive 2003/10/EC will become UK law.
The Ministry of Defence (MoD) considers personal protection (including hearing protection) a duty of care issue and aim to provide personal protective equipment (PPE) that is fit for purpose and that aligns with legislative criteria. The high noise levels that some aircrew are subjected to will, without adequate protection, cause permanent hearing damage which, in turn, will require aircrew to be downgraded from flying duties with the incumbent re-training costs for downgraded personnel and training costs for new/replacement aircrew. Additionally, since 1987 when section 10 of the Crown Proceedings Act was repealed, military personnel have gained the right to sue the MoD for disabilities incurred during the course of duty. Hence, MoD will not only have to meet the costs of disability pensions but there is the added burden of compensation and litigation costs. A similar situation is found in the US, where the military pay out some $270m a year in service disability pensions related solely to hearing loss and it would not be unreasonable to assume that the UK figures will soon be proportionate.
Up until about ten years ago the hearing protection devices (HPDs) used in the cockpit environment had essentially been optimised to provide maximum performance within the confines of the helmet/headset technology available at that time. Small benefits may have been achieved by using new materials in the earshell cushions or as an absorptive lining to the earshell, but if a major noise problem was monitored within the cockpit there was little scope to make radical enhancements to personal hearing protection. During the last 15 years however, Active Noise Reduction (ANR) techniques have become available to enhance the attenuation of HPDs. These could now be adopted in the military cockpit environment to help meet the current and future noise legislation.
Paper presented at the RTO HFM Lecture Series on “Personal Hearing Protection including Active Noise Reduction”, held in Warsaw, Poland, 25-26 October 2004; Belgium, Brussels, 28-29 October 2004;
Virginia Beach, VA, USA, 9-10 November 2004, and published in RTO-EN-HFM-111.

Defining the Cockpit Noise Hazard, Aircrew Hearing Damage Risk and the Benefits Active Noise Reduction Headsets Can Provide
5 - 2 RTO-EN-HFM-111
This paper aims to: • present existing knowledge of the noise hazards in both current and future military aircraft and the
major contributors to aircrew noise dose; • provide an understanding of the effects of high noise at the ear; • address the impact cockpit noise can make on operational capability; • discuss the methods of alleviating noise problems and the benefits ANR can offer
2 Major contributors to aircrew noise dose 2.1 Internal cockpit and cabin noise 2.1.1 History
Cockpit noise is not a new problem. It is documented that in the biplanes era communications could be a problem and in post World War 1 commercial aviation, the constant noise exposure of pilots undertaking long haul flights in aircraft of the Handley Page type, further highlighted the issue of hearing loss and the ‘Aviators Notch’. Figure 1 illustrates the levels of noise in a World War 2 USAAF aircraft and shows that even for these early cockpits, noise levels were reaching 120dB [1]. The introduction of the gas turbine engine in the late 1940’s removed the propeller and exhaust noise and internal cockpit noise levels were noticeably reduced. As aircraft design progressed and the engine(s) gradually moved towards the rear of the aircraft or became buried in the fuselage, further reductions in internal cockpit noise were achieved.
The majority of the current problems associated with high levels of cockpit noise are generated, essentially, from the post 1960’s need to fly operationally at high speed and low-level. These flight tactics were adopted in order to minimise detection by radar and exposure times to ground based weapon systems. Ingress to target is usually flown at speeds of around 420 to 480 knots at heights at, or below, 250 feet and egress is quite often lower and faster. At these speeds and heights noise levels in the fast jet aircraft cockpit have been increasing over the years, with one or two exceptions, and cockpit noise levels of 115dB to 120dB are now not unusual during high-speed, low-level flight.
High cockpit noise is not exclusive to fast jets. A similar upward trend in cockpit and cabin noise has been exhibited in the military helicopter fleet over the last 30 years. At some crew locations in the modern Chinook helicopter noise levels of 120dB are also now being generated.
2.1.2 Modern fast jet noise
In fast jets the internal cockpit noise spectrum is generally random in nature with high energy levels spread over a broad frequency band. The noise is generated from two predominant sources. One is the external airflow around the aircraft canopy and the front structure of the aircraft, and the other is internally generated noise from the air conditioning and cooling flows into the cockpit space.
Boundary layer flow noise Generally the noise levels generated from the external airflow sources are dependent upon the dynamic pressures on the aircraft (1/2ρv2) and thus the speed and height. The levels of noise are generated from the turbulent flow around and across the canopy and from any protuberances around the cockpit area such as IR sensors, canards, refuelling probes etc.
Noise levels decrease with altitude as the dynamic pressures are reduced due to the decrease in air density at altitude. This is clearly demonstrated in Figure 2 that shows a comparison of the cockpit noise measured in a Harrier GR5 during high-speed, low-level flight and during flight at altitude. A difference in cockpit noise levels of some 10dB is exhibited across the frequency band. Another source of increase in internal noise levels is from aircraft manoeuvres that further alter the instability of the flow patterns around the canopy and aircraft front fuselage. In many cases there will be differences in noise levels between front and rear crew.
Defining the Cockpit Noise Hazard, Aircrew Hearing Damage Risk and the Benefits Active Noise Reduction Headsets Can Provide
RTO-EN-HFM-111 5 - 3
Cockpit conditioning noise The other major source of internal noise is from the airflow from the cockpit conditioning and pressurisation systems. The noise is mainly generated through turbulent flow from the outlet sprays. The noise levels associated with the cabin conditioning/cooling flow are nominally constant with speed and height, although the cockpit noise spectrum will vary with conditioning mode. For example, Figure 3 compares the cockpit noise spectrum in an F-16A with the Environmental Conditioning System (ECS) on normal setting and with maximum defog switched on. The plot shows that with the ECS on there is a large increase in high frequency energy that increases the overall A-weighted Sound Pressure Level (SPL) by some 10dB and, if used for any length of time, will provide a significant contribution to the noise dose received by the pilot. Combined effects of boundary flow and cockpit conditioning Depending upon the design of the aircraft and its systems, the cockpit noise may be dominated by either the externally or internally generated noise or be a balance of both of these noise sources. Measurements made in a Jaguar GR1 showed it to be an example of where contributions from both sources are approximately equal, and the cockpit noise remains essentially constant irrespective of speed or height (Figure 4). In some fast jet aircraft, however, there may be other contributing factors. Measurements in the Harrier GR5, for instance, showed a contribution from the engine compressor fan (Figure 5). This large fan is close to the cockpit and as a dominant source is seen as a discrete narrow band noise source around 2.5kHz. The absolute frequency will obviously be dependent upon engine speed.
2.1.3 Helicopter noise
Helicopters have a different mechanism of generating noise and the sources are both aerodynamic and mechanical. The cockpit or cabin noise is predominantly narrow band discrete tones with associated harmonics superimposed on a low-level, broadband background noise. Aerodynamically induced noise is generated from the main and tail rotors, including interactions between the rotors in a twin rotor design (e.g. Chinook) and interactions between the rotors and fuselage. The mechanical noise originates from revolving systems connected to the rotors in the form of gearboxes, transmission shafts, transfer gears, auxiliary systems, drive shafts etc. Figure 6 shows a narrow band analyses for a Lynx helicopter and the sources of the noise peaks. Due to each type of helicopter being mechanically and aerodynamically different (e.g. 2,3,4,5 or more rotor blades in the main rotor, or differing gearing ratios in the main gearbox), each helicopter will have a unique acoustic signature. Boundary layer noise is not present to any great extent due to the restricted forward speeds of helicopters, but turbulent airflow noise will be apparent when the helicopters are flown with doors, windows or ramps open. Some helicopters, such as Merlin, have a significant range of avionics systems equipment installed in the aircraft with cooling fans and this equipment may add significantly to the overall cockpit/cabin noise levels.
2.1.4 Transport and Surveillance aircraft noise
The cockpit and cabin noise in aircraft that fall between being helicopters or fast jets i.e. transport aircraft of the Hercules type (turbo-prop), C17 type (turbo-fan) or those that use the Tilt Rotor approach, can have a number of sources. Some noise will be generated from the propellers, rotors or wing mounted gas turbines, some from boundary layer flow and some from equipment cooling and cockpit conditioning systems. The overall cockpit and cabin noise levels are a differing combination of discrete and random noise. Propeller driven For propeller driven aircraft, the cockpit and cabin noise spectrum is normally dominated by the fundamental frequency of the propeller, generally in the 80Hz to 100Hz region, and this is exhibited as a discrete, narrow-band frequency peak superimposed on lower level, broadband background noise. Figure 7 compares the cockpit noise environment for the 4-bladed propeller driven Hercules C130K [2] and the 6-bladed propeller driven C130J [3]. The plot shows how the fundamental blade passing frequency
Defining the Cockpit Noise Hazard, Aircrew Hearing Damage Risk and the Benefits Active Noise Reduction Headsets Can Provide
5 - 4 RTO-EN-HFM-111
(68Hz and 102Hz for the C130K and C130J respectively) dominates the whole cockpit noise spectrum. Similarly, passengers transported in the cargo compartment of this type of aircraft will also be exposed to high noise levels. In the C130J, noise levels of up to 118dB were measured in the forward cargo compartment during high-level route sorties with maximum levels occurring just forward of the propeller plane.
Gas Turbine driven Aircraft that are essentially civil-based militarised aircraft e.g. Nimrod (surveillance/maritime patrol) and AWACS/JSTARS (Boeing 707) (Command & Control) generate higher amounts of boundary layer noise in the cockpit than the cabin. The predominant noise source in the operator’s cabin is from the forced airflow into the aircraft to cool the avionics and crew.
2.1.5 Future aircraft noise problems
For the fast jets, it is probable that during forward flight cockpit noise levels will remain high, and be similar to those currently found in Harrier and EF Typhoon where levels are at their highest during low level operations. It is currently proposed that the Royal Navy (RN) will employ the short-takeoff/vertical-landing (STOVL) variant of the Joint Strike Fighter (JSF) F-35B. The takeoff and landing operation succeeds through technology known as the shaft-driven lift fan propulsion system. The counter rotating blades of the lift fan provide about 18,000 pounds of lifting power and, based on the minimal amount of F-35 cockpit noise data available, it is believed the overall internal cockpit noise levels during a vertical landing will be around 120dB. As the fan is situated immediately behind the cockpit, during this phase of flight the cockpit noise will be dominated by a strong tonal component, although there is currently little information available on what the exact spectral components will be.
2.2 Electrical communications
It is important to note that hearing damage occurs in the early stages of the hearing process, i.e. as damage to the hair cells in the cochlea of the inner ear. Interpretation of the signal is only performed in the high level processes of the brain that occur after the cochlea processing. Consequently, it doesn’t matter what the signal is at the ear (speech, noise, music etc.) if it is presented at a high enough level for a long enough duration it will cause hearing damage. During flying duties in the cockpit/cabin environment the noise dose received by aircrew is a combination of both the cockpit/cabin noise transmitted through their HPD and the electrical communication signal that is delivered directly to the ear via the communications telephone mounted in the HPD.
Aircrews’ speech communications are generally converted into electrical signals by a microphone built into the oronasal oxygen mask, by a 'noise-cancelling' boom microphone or by throat/bone conduction microphones. In the cockpit and cabin environment ambient noise is often introduced into the speech communications line through the microphone of the speaker and the transmitted signal is a combination of the intended signal (i.e. speech) and the unwanted noise. This combination signal is transmitted to the ear of the listener via radio or intercom and may be further contaminated with noise pick-up from the electronic systems or from radio interference. This contamination of the intended signal will reduce its intelligibility and clarity and the additional noise will add to the overall noise dose received by the listener. Hence, when considering the cockpit noise hazard it is important to address methods for reducing the levels of “unwanted” noise on the communications line. 3. Effects of high noise at the ear 3.1 Overview High noise levels in the aircraft cockpit or cabin, and the consequent high noise levels at the aircrews’ ear, can lead to a number of short and longer-term problems for aircrew. The types and levels of cockpit and cabin noise generated during flight operations will, without adequate protection, cause permanent hearing

Defining the Cockpit Noise Hazard, Aircrew Hearing Damage Risk and the Benefits Active Noise Reduction Headsets Can Provide
RTO-EN-HFM-111 5 - 5
damage. High noise will also interfere with speech communications (reducing the clarity and intelligibility of the speech signal), with non-speech communication signals such as the detection of auditory warning alerts or, inhibit signal detection tasks such as listening for sonar returns. Hence, there are both flight safety and operational implications. Whilst these physiological effects are relatively easy to assess and quantify, high noise levels are also known to effect the cognitive, perceptual and psychomotor responses, although to date, little research has been conducted into the psychological effects of high noise or the operational implications. This paper is only concerned with the cockpit noise hazard and the risk it poses to aircrews' hearing. Hence, only the direct effects of the two main contributors (cockpit noise and electrical communication signals) are considered here.
3.2 Hearing damage risk and current UK legislation
If the human ear is exposed to sound energy above a certain amplitude for a long enough period, some permanent hearing damage will result. The main difficulty in predicting hearing damage lies in determining the length of exposure and the levels that cause a defined amount of damage. The situation is confounded by many variables such as individual sensitivity, intermittence of exposure, whether noise is steady or impulsive and any noise exposure outside the working environment. The risk of hearing damage is correlated with the amounts of ‘A’-weighted energy received by the ear. Energy is a function of level and time exposure, and the current UK legislation quotes an allowable daily noise dose for a nominal 8-hour working day of 85dB(A), or an equivalent continuous noise level (Leq). An Leq is the notional sound level which would, in the course of an 8 hour period, cause the same A-weighted energy to be received by the ear as that due to the actual fluctuating sound over the actual working period. Hence, energy levels may be offset against exposure duration to provide an equivalent continuous level. In the UK a 3dB(A)-conversion rate is used for a doubling of sound energy. If the noise level increases by 3dB(A) then to maintain the same risk of hearing damage the exposure duration must be halved to give an equivalent continuous noise level. Similarly, if the noise level is reduced by 3dB(A), the exposure time may be doubled to maintain the same Leq and risk of hearing damage.
3.3 Future legislation (Physical Agents Directive 2003/10/EC)
In 1993 the European Commission (EC) proposed the Physical Agents Directive which sought to establish a new framework for the regulation of physical agents at work applying initially to noise, vibration, optical radiation and non-optical electromagnetic fields. The proposed framework for noise regulation is more stringent than the 1986 directive aiming to reduce the first and second action levels to 80dB(A) and 85dB(A) respectively. There have been many years of negotiation and conciliation between the member states and the new directive was formally adopted by the EC in early December 2002 and appeared in the Official Journal of the European Communities on 15 February 2003. The UK now has three years from that date to bring in implementing legislation.
3.4 Physiological effects of direct high cockpit and cabin noise
Even with a protective helmet or headset, cockpit noise levels reaching the ear can alone be high enough to produce a risk of hearing damage. Over the years, there has been a number of reviews of hearing damage risk in UK Military aircraft starting in around 1974 [4] when some of the first personal noise dosimeters produced were used to provide risk figures for aircrew wearing the Mk2 and Mk3 flight helmets and early headsets. With the introduction of the Mk4 series helmets and the Racal Atlantic headsets, both with considerably improved acoustic attenuation characteristics, a continuing assessment has been made as new aircraft and aircraft types have entered service [5-13]. All forms of hearing protection have an acoustic attenuation characteristic that varies with frequency and will let through the structure of the device different levels of noise at different frequencies. Thus, while the

Defining the Cockpit Noise Hazard, Aircrew Hearing Damage Risk and the Benefits Active Noise Reduction Headsets Can Provide
5 - 6 RTO-EN-HFM-111
helmet has a defined fixed attenuation characteristic (see Figure 8), using the helmet in different noise fields will result in different noise levels at the ear. For example, in a helicopter that is rich in low frequency sound, the limited low-frequency attenuation characteristics of a helmet or headset will let through almost all the low frequency noise. However, at the higher frequencies where the helicopter generates little noise and the helmet attenuation is at its maximum, the noise levels at the aircrews’ ear will be low. For a fast jet, the cockpit noise is higher across a much broader frequency range and hence the noise spectrum at the ear will generally be higher than for a helicopter, with a higher hearing damage risk. Figure 9 shows typical noise levels at the ear for the fast jet, helicopter and Hercules cockpit environment.
To minimise hearing damage caused directly by the transmission of cockpit and cabin noise through the HPD, the cockpit noise levels can either be reduced at source or the noise attenuation characteristics of the HPD can be improved.
3.5 Effects of communications levels
On top of the risk generated from cockpit noise levels alone will come the risk associated with the additional contribution from the communications (comms) [14]. When considering the contribution the comms make to aircrew noise dose the preferred personal listening levels and aircraft type need to be considered.
In order to assess any trend in comms load with aircraft type the average comms contribution and the associated standard deviations were calculated for some aircraft that have been surveyed by QinetiQ. The results are shown in Table 3-1. Although the comms contribution to overall noise dose appears to be relatively small compared to that contributed by the ambient noise reaching the ear, it is important to remember that it is additional to the background noise, effectively riding on top of the background signal. If no comms were present throughout, for example, a Harrier flight, the aircrew could fly 10 times as long for the same risk of hearing damage, i.e. the comms is making a significant contribution.
Aircraft Category Aircraft Type mean comms dB(A)
Sdev comms dB(A)
Helicopters Sea King Mk5 6.3 2.2
Sea King Mk4 7.9 1.4
Sea king Mk6 7.1 2.0
Lynx Mk7 & Mk9 9.8 2.5
Chinook HC1 8.6 2.6
Fast jets Harrier GR5 10.0 4.3
Jaguar GR1 9.9 4.2
Tornado 10.4 2.9
Hawk 9.1 3.2
Sea Harrier 9.1 2.7
Training Tucano 8.5 1.8
Transport Hercules C1/C3 8.4 3.0
HS125 10.6 4.8
Table 3-1 The overall mean communications contribution figure calculated for each aircraft type

Defining the Cockpit Noise Hazard, Aircrew Hearing Damage Risk and the Benefits Active Noise Reduction Headsets Can Provide
RTO-EN-HFM-111 5 - 7
4 Operational Issues and Impact 4.1 Cockpit Noise survey data Over the last 12 years QinetiQ have conducted a series of comprehensive cockpit noise surveys in a range of helicopters, fast jets, transport, training and surveillance aircraft. All surveys have been carried out at operational squadrons, using operational aircraft and the normal range of operational sorties. Two types of measurements have normally been made. Firstly, noise dose measurements for comparison with the legislative criteria and secondly, audio recordings to allow analyses of the cockpit and “noise at ear" spectra.
Table 4-1 presents the mean measured noise dose and the associated standard deviations for all the aircraft that have been surveyed over the last 15 years. However, it is important to note that the mean noise dose calculated from the data only represents the exposure level experienced by 50% of the aircrew. To protect the majority of aircrew it is important that a representative noise dose figure is used in the hearing damage risk calculations so for the purpose of this paper, a mean noise dose value plus two standard deviations covering 98% of aircrew will be used (column 4, Table 4-1).
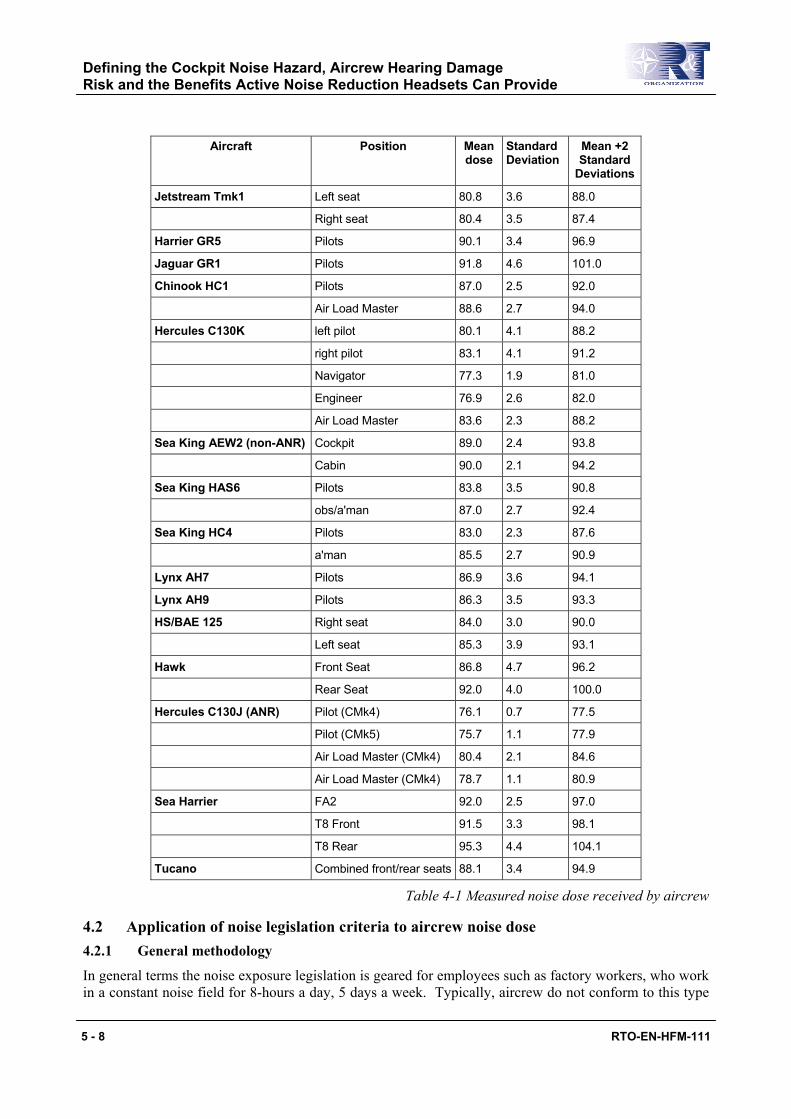
Defining the Cockpit Noise Hazard, Aircrew Hearing Damage Risk and the Benefits Active Noise Reduction Headsets Can Provide
5 - 8 RTO-EN-HFM-111
Aircraft Position Mean dose
StandardDeviation
Mean +2 Standard
Deviations
Jetstream Tmk1 Left seat 80.8 3.6 88.0
Right seat 80.4 3.5 87.4
Harrier GR5 Pilots 90.1 3.4 96.9
Jaguar GR1 Pilots 91.8 4.6 101.0
Chinook HC1 Pilots 87.0 2.5 92.0
Air Load Master 88.6 2.7 94.0
Hercules C130K left pilot 80.1 4.1 88.2
right pilot 83.1 4.1 91.2
Navigator 77.3 1.9 81.0
Engineer 76.9 2.6 82.0
Air Load Master 83.6 2.3 88.2
Sea King AEW2 (non-ANR) Cockpit 89.0 2.4 93.8
Cabin 90.0 2.1 94.2
Sea King HAS6 Pilots 83.8 3.5 90.8
obs/a'man 87.0 2.7 92.4
Sea King HC4 Pilots 83.0 2.3 87.6
a'man 85.5 2.7 90.9
Lynx AH7 Pilots 86.9 3.6 94.1
Lynx AH9 Pilots 86.3 3.5 93.3
HS/BAE 125 Right seat 84.0 3.0 90.0
Left seat 85.3 3.9 93.1
Hawk Front Seat 86.8 4.7 96.2
Rear Seat 92.0 4.0 100.0
Hercules C130J (ANR) Pilot (CMk4) 76.1 0.7 77.5
Pilot (CMk5) 75.7 1.1 77.9
Air Load Master (CMk4) 80.4 2.1 84.6
Air Load Master (CMk4) 78.7 1.1 80.9
Sea Harrier FA2 92.0 2.5 97.0
T8 Front 91.5 3.3 98.1
T8 Rear 95.3 4.4 104.1
Tucano Combined front/rear seats 88.1 3.4 94.9
Table 4-1 Measured noise dose received by aircrew
4.2 Application of noise legislation criteria to aircrew noise dose 4.2.1 General methodology
In general terms the noise exposure legislation is geared for employees such as factory workers, who work in a constant noise field for 8-hours a day, 5 days a week. Typically, aircrew do not conform to this type

Defining the Cockpit Noise Hazard, Aircrew Hearing Damage Risk and the Benefits Active Noise Reduction Headsets Can Provide
RTO-EN-HFM-111 5 - 9
of working pattern and are generally only exposed to the high cockpit/cabin noise for a small proportion of their daily working shift. The measured noise dose figures shown in Table 4-1 are the dose received during a single sortie and the majority of the 98% cover figures shown in column 4, exceed the current 85dB(A) criteria. For direct comparison with the legislation a correction could be made to normalise the sortie Leq to an 8-hour Leq, on the assumption that aircrew spend all their non-flying hours in a quiet environment and are not exposed to any other contributory noise. However, perhaps more importantly for aircrew is an understanding of the numbers of hours they may fly in their particular cockpit whilst staying within the noise exposure limits.
The 1989 directive specifies a maximum permissible exposure level at the ear of 85dB(A) for 8 hours. If, for example, a noise dose figure giving a 98% cover of 100dB(A) were measured, it would be some 15dB(A) above the allowable legislative level of 85dB(A). 15dB(A) represents a ratio of 32:1, and within a nominal 8-hour working day would represent an allowable flying time of just 15 minutes (480 minutes/ 32). However, if the new legislative level of 80dB(A) is adopted, the example noise dose figure of 100dB(A) will now be some 20dB(A) above the allowable limit and represents a ratio of 100:1. This reduces the allowable daily flying time to just under 5 minutes.
Table 4-2 presents the calculations of the allowable number of hours that aircrew may fly daily in their cockpit /cabin with the level of hearing protection they are currently provided with, for both the current and future legislative limits.
The table shows that the dose received by Harrier, Jaguar, Hawk and Sea Harrier crew would limit their daily flying time to less that 40 minutes if they are to stay within the current legislative guidelines of an 85dB(A) Leq (8hr). However, with the introduction of the more stringent guidelines the allowable flying duration will be prohibitive for the majority of aircraft. Hence, if an operationally viable number of flying hours are to be permitted whilst keeping aircrew noise dose within the strict daily criteria set out in the new legislation, the noise levels reaching the aircrews’ ears will have to be significantly reduced.
4.3 Impact of legislation on hearing protection requirements
Hearing damage risk is based on a combination of the level and duration of the noise exposure. There is a clear understanding of the numbers of hours aircrew are required to fly operationally in a working year but averaging noise dose over annual working hours is not strictly accommodated in the legislation. Nevertheless, it is a useful way of providing an indication of the levels of improvement in hearing protection that are required if legislative criteria are to be met whilst allowing flight operations to continue unlimited.
Aircrew may fly anything between 150 and 420 hours per year depending on the aircraft type and crew position. If the current legislation is taken as an example, aircrew could fly 8 hours a day, every day of the year assuming their noise dose did not exceed 85dB(A). To calculate hearing damage risk over a working year an adjustment can be made to the allowable noise dose of 85dB(A) to account for the proportion of the working year that is actually spent flying. The adjustment is calculated using the following formula:
Exposure time correction factor = 10log(n/1920)
where n = number of hours flown 1920 = number of hours in a 40 hour week, 48 week year
If the number of annual flying hours equalled 1920 then no correction need be applied but if, for example, aircrew only flew 250 hours a year a correction factor of 8.9dB(A) is calculated and their exposure limit could theoretically be increased to 93.9dB(A).
Clearly the number of hours flown will effect the annual Leq calculated. But if the actual measured noise dose for a particular aircraft is compared to the adjusted allowable noise dose calculated for the number of annual hours that aircraft normally flies, then an indication of the reduction in noise exposure required to stay within the regulations will be provided. If, for example, a noise dose figure of 100dB(A) is used then

Defining the Cockpit Noise Hazard, Aircrew Hearing Damage Risk and the Benefits Active Noise Reduction Headsets Can Provide
5 - 10 RTO-EN-HFM-111
for aircrew who typically fly 250 hours a year, it is clear that some steps need to be taken to reduce the noise exposure by 6.1 dB(A) to the 93.9dB(A) allowable figure. The pilot can either fly fewer hours per year (in this case reducing from 250 hours to less than 63 hours) or the noise exposure needs to be reduced.
Aircraft Position Allowable daily flying
hours
Allowable daily flying
minutes
Allowable daily flying
hours
Allowable daily flying
minutes
85dB(A) limit 80dB(A) limit
Jetstream Tmk1 Left seat 4.0 240.6 1.3 76.1
Right seat 4.6 276.2 1.5 87.3
Harrier GR5 Pilots 0.5 31.0 0.2 9.8
Jaguar GR1 Pilots 0.2 12.1 0.1 3.8
Chinook HC1 Pilots 1.6 95.8 0.5 30.3
Air Load Master 1.0 60.4 0.3 19.1
Hercules C130K left pilot 3.8 228.7 1.2 72.3
right pilot 1.9 115.1 0.6 36.4
Navigator 20.1 1205.7 6.4 381.3
Engineer 16.0 957.7 5.0 302.9
Air Load Master 3.8 228.7 1.2 72.3
Sea King AEW2 (non-ANR) Cockpit 1.1 63.3 0.3 20.0
cabin 1.0 57.7 0.3 18.2
Sea King HAS6 pilots 2.1 126.3 0.7 39.9
obs/a'man 1.5 87.3 0.5 27.6
Sea King HC4 pilots 4.4 263.8 1.4 83.4
a'man 2.1 123.4 0.7 39.0
Lynx AH7 pilots 1.0 59.1 0.3 18.7
Lynx AH9 pilots 1.2 71.0 0.4 22.5
HS/BAE 125 Right seat 2.5 151.8 0.8 48.0
Left seat 1.2 74.3 0.4 23.5
Hawk Front Seat 0.6 36.4 0.2 11.5
Rear Seat 0.3 15.2 0.1 4.8
Hercules C130J (ANR) Pilot (CMk4) 45.0 2699.2 14.2 853.6
Pilot (CMk5) 41.0 2461.7 13.0 778.5
Air Load Master (CMk4) 8.8 526.3 2.8 166.4
Air Load Master (CMk4) 20.6 1233.8 6.5 390.2
Sea Harrier FA2 0.5 30.3 0.2 9.6
T8 Front 0.4 23.5 0.1 7.4
T8 Rear 0.1 5.9 0.0 1.9
Tucano Combined front/rear seats 0.8 49.1 0.3 15.5
Table 4-2 Allowable flying duration in accordance with current and future legislation
Based on annual averaging Table 4-3 provides an indication of the reductions in noise dose (or enhancements to hearing protection) required to meet both the current and future noise legislation. Calculations have been made for the first action level criteria as it is the maximum exposure level

Defining the Cockpit Noise Hazard, Aircrew Hearing Damage Risk and the Benefits Active Noise Reduction Headsets Can Provide
RTO-EN-HFM-111 5 - 11
employees can be exposed to without hearing protection and it is the noise dose value that protects about 97% of the population from hearing damage.
Aircraft Position Hours flown
annually Noise dose correction
factor
Reduction in noise dose to meet 85dB(A)
Leq
Reduction in noise dose to meet 80dB(A)
Leq
dB(A) dB(A) dB(A)
Jetstream Tmk1 Left seat 350.0 -7.4 0.0 0.6
Right seat 350.0 -7.4 0.0 0.0
Harrier GR5 Pilots 260.0 -8.7 3.2 8.2
Jaguar GR1 Pilots 250.0 -8.9 7.1 12.1
Chinook HC1 Pilots 350.0 -7.4 0.0 4.6
Air Load Master 350.0 -7.4 1.6 6.6
Hercules C130K Left pilot 340.0 -7.5 0.0 0.7
Right pilot 320.0 -7.8 0.0 3.4
Navigator 320.0 -7.8 0.0 0.0
Engineer 250.0 -8.9 0.0 0.0
Air Load Master 420.0 -6.6 0.0 1.6
Sea King AEW2 Pilot 250.0 -8.9 0.0 4.9
Observer 250.0 -8.9 0.3 5.3
Sea King HAS6 Pilots 250.0 -8.9 0.0 1.9
obs/a'man 210.0 -9.6 0.0 2.8
Sea King HC4 Pilots 275.0 -8.4 0.0 0.0
A'man 275.0 -8.4 0.0 2.5
Lynx AH7 Pilots 250.0 -8.9 0.2 5.2
Lynx AH9 Pilots 250.0 -8.9 0.0 4.4
HS/BAE 125 Right seat 250.0 -8.9 0.0 1.1
Left seat 250.0 -8.9 0.0 4.2
Hawk Front Seat 250.0 -8.9 2.3 7.3
Rear Seat 250.0 -8.9 6.1 11.1
Hercules C130J Pilot (CMk4) 340.0 -7.5 0.0 0.0
(with ANR) Pilot (CMk5) 340.0 -7.5 0.0 0.0
Air Load Master (CMk4) 420.0 -6.6 0.0 0.0
Air Load Master (CMk4) 420.0 -6.6 0.0 0.0
Sea Harrier FA2 150.0 -11.1 0.9 5.9
T8 Front 150.0 -11.1 2.0 7.0
T8 Rear 150.0 -11.1 8.0 13.0
Tucano Combined front & rear 250.0 -8.9 1.0 6.0
Table 4-3 Hearing protection requirements to meet current and future legislation for annual flying hours flown
Defining the Cockpit Noise Hazard, Aircrew Hearing Damage Risk and the Benefits Active Noise Reduction Headsets Can Provide
5 - 12 RTO-EN-HFM-111
5 Methods of Alleviating Noise Problems 5.1 Introduction In order to adhere to the new noise exposure criteria whilst still flying an operationally viable number of hours, the calculations presented in section 4 have shown that noise exposure must be reduced by as much 13dB(A) in some aircraft. Both the current and new directives require that noise be reduced at source as far as is reasonably possible and then hearing protection provided to bring the personal noise exposure within the set limits. For new aircraft, reducing noise at source is most effectively, and efficiently, carried out during the design stages. However, it is generally impractical, and certainly unlikely to be cost effective, to modify an existing in-service aircraft. However, the possibility of modification should be reviewed for individual aircraft, once the primary noise sources are identified.
The most cost-effective approach to reduce aircrew noise exposure for in-service aircraft would be to upgrade the hearing protection levels in existing aircrew flying helmets and headsets. Improving the passive attenuation of the headsets fitted to the UK’s Mk4 or Mk10 series helmets, or the Racal Atlantic and other headset types currently being used by aircrew can achieve this. Alternatively, ANR techniques can be used in appropriate noise fields, and this technology is already fully cleared and flying in some UK aircraft. These approaches are discussed in more detail in the following sections.
5.2 Reducing noise by personal hearing protection 5.2.1 Flight Helmet/Headset approach
In most military cockpits, aircrew are required to wear a protective flight helmet, and this helmet can be made to provide a level of acoustic protection by incorporating hearing protection earmuffs into the helmet shell. Alternatively, headsets are used in larger transport or surveillance aircraft, but, in both cases, the earmuffs provide the overall hearing protection.
The level of protection provided by these types of devices varies with frequency and the passive circumaural protectors generally have three different mechanisms controlling the protection in the low, mid and high frequency bands. The overall effect of these mechanisms is to produce the attenuation characteristics shown in Figure 8. Whilst the absolute attenuation levels vary depending on the device type, the general attenuation characteristic is similar for all circumaural hearing protectors. As is the case for most engineering systems, some protectors are better than others, some companies understand the design process better than others and some sacrifice good design and performance for lower cost.
Changes can be made to the attenuation characteristic by using different materials for the earshell itself (in the mid-frequency range), different internal absorbent materials (at higher frequencies) or by the increase of shell volume (at low frequencies). Doubling the volume of the shell will provide a theoretical increase in low frequency attenuation of some 6dB and a further doubling will provide a further 6dB increase, and so on. However, practicality of use, particularly in the aircraft cockpit, precludes the use of the large physical sizes of helmet that would be necessary to house these large volume earshells. Although, as in the USA with the SPH4 helmet, larger volume earshells could be used in helicopters and transport aircraft.
5.3 Methods of improving the attenuation of hearing protectors 5.3.1 Active Control of Noise (Active Noise Reduction – ANR)
Because of the relatively poor attenuation of circumaural protectors at the lower frequencies, coupled with the high levels of cockpit noise at these frequencies, the noise levels at the pilots ear (Figure 9) are rich in low frequency content. Whilst improved passive methods are available, in terms of large volume earshells, they are generally impracticable for aircrew helmets and headsets. Hence, the approach started some 20 years ago, [15 & 16], was the use of active methods of cancelling the noise.
The principle of ANR is relatively simple and well documented but the practical application has proved more difficult. A number of systems exist in the UK, USA, France, Netherlands etc. and a typical active
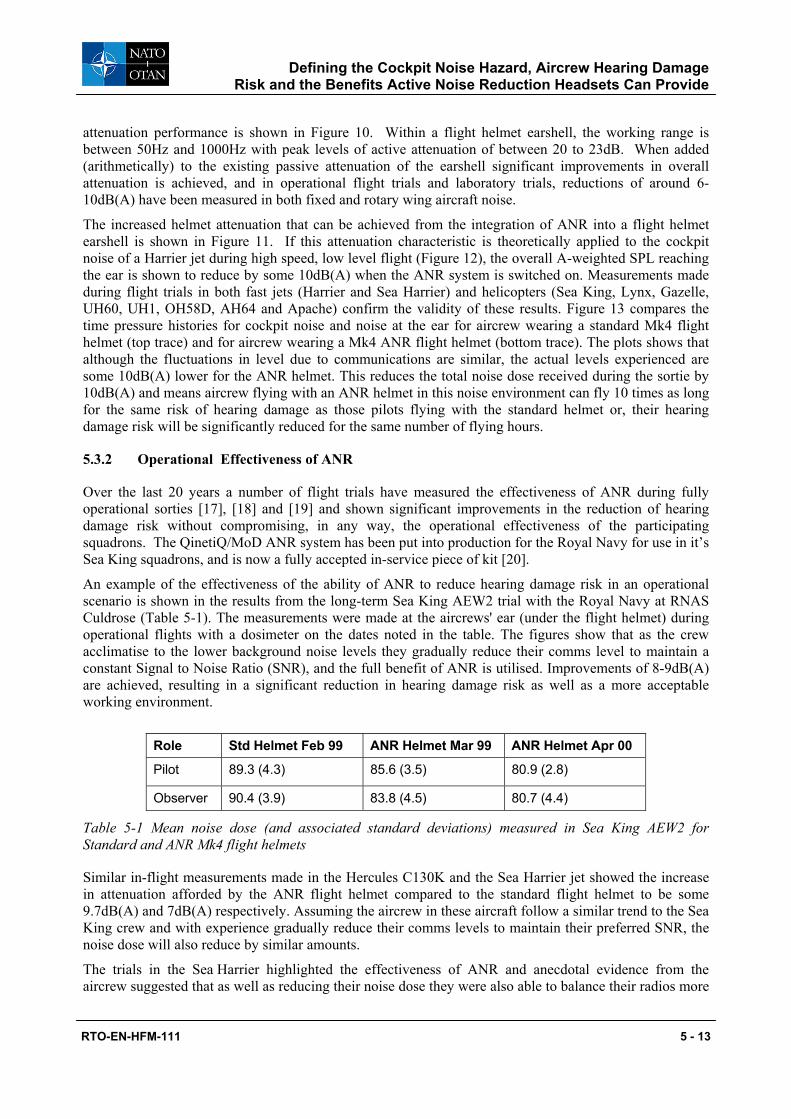
Defining the Cockpit Noise Hazard, Aircrew Hearing Damage Risk and the Benefits Active Noise Reduction Headsets Can Provide
RTO-EN-HFM-111 5 - 13
attenuation performance is shown in Figure 10. Within a flight helmet earshell, the working range is between 50Hz and 1000Hz with peak levels of active attenuation of between 20 to 23dB. When added (arithmetically) to the existing passive attenuation of the earshell significant improvements in overall attenuation is achieved, and in operational flight trials and laboratory trials, reductions of around 6-10dB(A) have been measured in both fixed and rotary wing aircraft noise.
The increased helmet attenuation that can be achieved from the integration of ANR into a flight helmet earshell is shown in Figure 11. If this attenuation characteristic is theoretically applied to the cockpit noise of a Harrier jet during high speed, low level flight (Figure 12), the overall A-weighted SPL reaching the ear is shown to reduce by some 10dB(A) when the ANR system is switched on. Measurements made during flight trials in both fast jets (Harrier and Sea Harrier) and helicopters (Sea King, Lynx, Gazelle, UH60, UH1, OH58D, AH64 and Apache) confirm the validity of these results. Figure 13 compares the time pressure histories for cockpit noise and noise at the ear for aircrew wearing a standard Mk4 flight helmet (top trace) and for aircrew wearing a Mk4 ANR flight helmet (bottom trace). The plots shows that although the fluctuations in level due to communications are similar, the actual levels experienced are some 10dB(A) lower for the ANR helmet. This reduces the total noise dose received during the sortie by 10dB(A) and means aircrew flying with an ANR helmet in this noise environment can fly 10 times as long for the same risk of hearing damage as those pilots flying with the standard helmet or, their hearing damage risk will be significantly reduced for the same number of flying hours.
5.3.2 Operational Effectiveness of ANR
Over the last 20 years a number of flight trials have measured the effectiveness of ANR during fully operational sorties [17], [18] and [19] and shown significant improvements in the reduction of hearing damage risk without compromising, in any way, the operational effectiveness of the participating squadrons. The QinetiQ/MoD ANR system has been put into production for the Royal Navy for use in it’s Sea King squadrons, and is now a fully accepted in-service piece of kit [20].
An example of the effectiveness of the ability of ANR to reduce hearing damage risk in an operational scenario is shown in the results from the long-term Sea King AEW2 trial with the Royal Navy at RNAS Culdrose (Table 5-1). The measurements were made at the aircrews' ear (under the flight helmet) during operational flights with a dosimeter on the dates noted in the table. The figures show that as the crew acclimatise to the lower background noise levels they gradually reduce their comms level to maintain a constant Signal to Noise Ratio (SNR), and the full benefit of ANR is utilised. Improvements of 8-9dB(A) are achieved, resulting in a significant reduction in hearing damage risk as well as a more acceptable working environment.
Role Std Helmet Feb 99 ANR Helmet Mar 99 ANR Helmet Apr 00
Pilot 89.3 (4.3) 85.6 (3.5) 80.9 (2.8)
Observer 90.4 (3.9) 83.8 (4.5) 80.7 (4.4)
Table 5-1 Mean noise dose (and associated standard deviations) measured in Sea King AEW2 for Standard and ANR Mk4 flight helmets
Similar in-flight measurements made in the Hercules C130K and the Sea Harrier jet showed the increase in attenuation afforded by the ANR flight helmet compared to the standard flight helmet to be some 9.7dB(A) and 7dB(A) respectively. Assuming the aircrew in these aircraft follow a similar trend to the Sea King crew and with experience gradually reduce their comms levels to maintain their preferred SNR, the noise dose will also reduce by similar amounts.
The trials in the Sea Harrier highlighted the effectiveness of ANR and anecdotal evidence from the aircrew suggested that as well as reducing their noise dose they were also able to balance their radios more
Defining the Cockpit Noise Hazard, Aircrew Hearing Damage Risk and the Benefits Active Noise Reduction Headsets Can Provide
5 - 14 RTO-EN-HFM-111
effectively, resulting in improved clarity and intelligibility of speech communications. ANR is now a fleet wide fit for Sea Harrier.
Similarly in the C-130J, ANR is now in full service use and has significantly reduced noise exposure levels.
5.4 Future hearing protection development 5.4.1 Overview
The in-flight measured data suggests that the integration of ANR into the current generation of military flight helmets and headsets will provide a 6-10dB(A) reduction in aircrew noise dose in fast jet, helicopter and transport aircraft. Whilst the absolute benefit may vary slightly depending on the specific noise field characteristics, the current analogue ANR systems should bring noise levels at the aircrews' ear, in the majority of operational aircraft, down to a level where hearing damage risk is within the new European and UK legislative criteria. However, the fast jet cockpit is likely to remain a problem area where existing ANR systems will reduce noise dose but will not fully resolve the problem.
Comprehensive measurements made in the Sea Harrier jet suggest that once aircrew are fully acclimatised to the new noise environment a reduction in noise dose of 7dB(A) will be achieved. As other jets have similar cockpit noise spectra it may be assumed that current analogue ANR systems will provide, in these cockpits, the same level of benefit as exhibited for the Sea Harrier. Table 4-3 shows that to meet the noise dose criteria set out in the new legislation, improvements in hearing protection up to 13 dB(A) are needed if all fast jet crew are to be adequately protected. Hence, ANR as it stands today is not a panacea. Significant improvements in hearing protection are still required if current aircrew are to be sufficiently protected and, similarly for future jets. Whilst cockpit noise data for the F-35 is scant, calculations made on the limited data available suggest that the noise dose received by JSF aircrew will be similar to current worst-case jet aircraft.
5.4.2 Passive devices
Some new developments have shown that improvements in passive attenuation can be achieved through the use of different materials and construction techniques. The use of passive hearing protection provides the simplest, least expensive and most operationally effective method of providing hearing protection for aircrew. Where noise levels are high, the smaller levels of attenuation gained by improvements of passive attenuation are highly cost effective, especially compared to the relative expense of electronic control systems and aircraft installation costs.
The use of new earshell cushion technologies has been shown to improve the variance measured during acoustic attenuation trials. By reducing the variance in performance across subjects, the target attenuation figures in high attenuation devices become easier to meet due to lower variance in the measured attenuation figures and hence, a lower penalty is incurred when meeting the demands of the population spread (mean minus two standard deviations). There is also some preliminary evidence from the USA that personally tailored cushions (i.e. which fit correctly around the individual head and similar to those used in the early Mk3 series flight helmets) may provide increased levels of hearing protection. It is possible that anthropometric scanning techniques could offer some benefit in this advanced approach.
5.4.3 Active devices
Over the last 20 years a better understanding of the interaction between active and passive devices has been gained allowing the combination of these two differing protection techniques to provide greater levels of hearing protection.
Analogue ANR systems may be further enhanced by miniaturising the electronic circuitry such that the full earshell volume can be taken advantage of. Currently, some of the active performance is used to
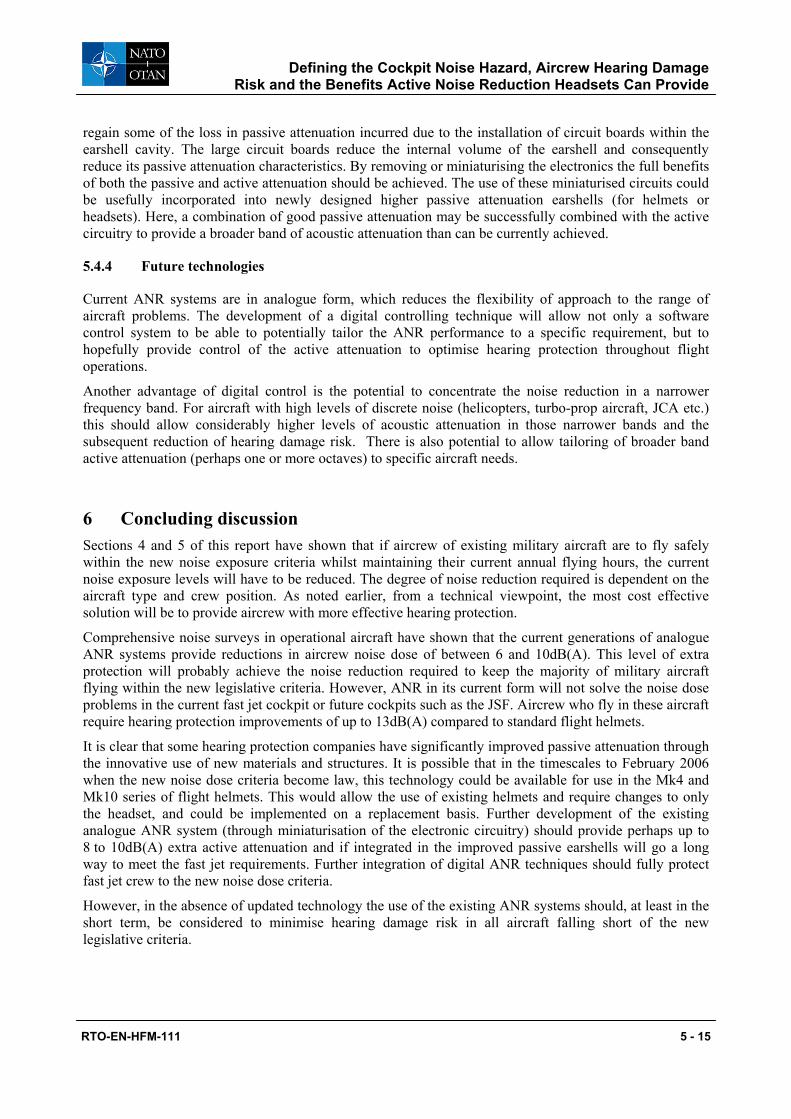
Defining the Cockpit Noise Hazard, Aircrew Hearing Damage Risk and the Benefits Active Noise Reduction Headsets Can Provide
RTO-EN-HFM-111 5 - 15
regain some of the loss in passive attenuation incurred due to the installation of circuit boards within the earshell cavity. The large circuit boards reduce the internal volume of the earshell and consequently reduce its passive attenuation characteristics. By removing or miniaturising the electronics the full benefits of both the passive and active attenuation should be achieved. The use of these miniaturised circuits could be usefully incorporated into newly designed higher passive attenuation earshells (for helmets or headsets). Here, a combination of good passive attenuation may be successfully combined with the active circuitry to provide a broader band of acoustic attenuation than can be currently achieved.
5.4.4 Future technologies
Current ANR systems are in analogue form, which reduces the flexibility of approach to the range of aircraft problems. The development of a digital controlling technique will allow not only a software control system to be able to potentially tailor the ANR performance to a specific requirement, but to hopefully provide control of the active attenuation to optimise hearing protection throughout flight operations.
Another advantage of digital control is the potential to concentrate the noise reduction in a narrower frequency band. For aircraft with high levels of discrete noise (helicopters, turbo-prop aircraft, JCA etc.) this should allow considerably higher levels of acoustic attenuation in those narrower bands and the subsequent reduction of hearing damage risk. There is also potential to allow tailoring of broader band active attenuation (perhaps one or more octaves) to specific aircraft needs.
6 Concluding discussion Sections 4 and 5 of this report have shown that if aircrew of existing military aircraft are to fly safely within the new noise exposure criteria whilst maintaining their current annual flying hours, the current noise exposure levels will have to be reduced. The degree of noise reduction required is dependent on the aircraft type and crew position. As noted earlier, from a technical viewpoint, the most cost effective solution will be to provide aircrew with more effective hearing protection.
Comprehensive noise surveys in operational aircraft have shown that the current generations of analogue ANR systems provide reductions in aircrew noise dose of between 6 and 10dB(A). This level of extra protection will probably achieve the noise reduction required to keep the majority of military aircraft flying within the new legislative criteria. However, ANR in its current form will not solve the noise dose problems in the current fast jet cockpit or future cockpits such as the JSF. Aircrew who fly in these aircraft require hearing protection improvements of up to 13dB(A) compared to standard flight helmets.
It is clear that some hearing protection companies have significantly improved passive attenuation through the innovative use of new materials and structures. It is possible that in the timescales to February 2006 when the new noise dose criteria become law, this technology could be available for use in the Mk4 and Mk10 series of flight helmets. This would allow the use of existing helmets and require changes to only the headset, and could be implemented on a replacement basis. Further development of the existing analogue ANR system (through miniaturisation of the electronic circuitry) should provide perhaps up to 8 to 10dB(A) extra active attenuation and if integrated in the improved passive earshells will go a long way to meet the fast jet requirements. Further integration of digital ANR techniques should fully protect fast jet crew to the new noise dose criteria.
However, in the absence of updated technology the use of the existing ANR systems should, at least in the short term, be considered to minimise hearing damage risk in all aircraft falling short of the new legislative criteria.
Defining the Cockpit Noise Hazard, Aircrew Hearing Damage Risk and the Benefits Active Noise Reduction Headsets Can Provide
5 - 16 RTO-EN-HFM-111
7 References [1] Transmission and reception of sounds under combat conditions. Summary technical report of division 17,
National Defence Research Committee 1946. [2] An Active Noise Reduction trial on Hercules C130K at RAF Lyneham during January–March 2000. M.K.
Hancock, DERA/AS/SID/CR000386/1.0, June 2000 [3] A Noise Data Gathering Exercise conducted in the CMk4 and CMk5 variants of the Hercules C130J aircraft..
S.H.James, M.K.Hancock, A.F.Hazell. QinetiQ/FST/CSS/TR021269/1 February 2002 [4] A Survey of Noise Doses Received by Military Aircrew. GM Rood & Sqn Ldr MC Glen. RAE TR 77080 1977 [5] A noise survey performed in the Harrier GR5 at RAF Wittering during February and March 1992. Susan
Mungur, K Harpur, M Hancock. DRA Technical Memorandum FS 1038 August 1992 [6] A noise survey performed in the Jaguar GR1A at RAF Coltishall during July 1992. K Harpur, Susan Mungur,
M Hancock. DRA Technical Memorandum FS 1040 Nov 1992 [7] A noise survey performed in the Chinook HC1 at RAF Odiham during August 1993. M. Hancock, K. Harpur,
C. Skelton. DRA/AS/FS/CR93064/1 Nov 1993 [8] A noise survey performed in the Hercules C1/3 at RAF Lyneham during May 1994. K Harpur, M Hancock, C
Skelton. DRA/AS/MMI/CR94189/1.0, August 1994 [9] A noise survey performed in the Sea King AEW2 at RNAS Culdrose July 1994. K Harpur, M Hancock.
DRA/AS/MMI/CR94215/1 June 1993 [10] A noise survey performed in the Sea King HAS6 during November 1994 and the Sea King HC4 during January
1995. M K Hancock, C Leeks, S H James, S Fifield. DRA Customer Report DRA/AS/MMI/CR95073/1 June 1995
[11] A noise survey conducted on the HS/BAe 125 at RAF Northolt during September 1996. M K Hancock, A Hazell, C Leeks. DERA/AS/SID/884/TR97027/1.0 March 1997
[12] A noise survey of the Sea Harrier cockpit and an assessment of the benefits an Active Noise Reduction headset may provide. S. James, M. Hancock, A. Hazell. QinetiQ/FST/CSS/CR011650/1.0 August 2001
[13] A noise survey conducted on the Tucano T1 at RAF Linton-on-Ouse during November 2003. M Hancock, A Hazell, M Aitchison. QINETIQ/FST/CR041089 March 2004
[14] The contribution of the communications signal to the noise dose received by aircrew. S. James. DERA/AS/SID/CR000186/1.0 March 2000
[15] An Active Noise reduction system for Aircrew helmets. PD Wheeler, SG Halliday. AGARD CP-311 1981 [16] Evaluation of an ANR system for the Mk 4 flying helmets during laboratory and helicopter trials. G.M Rood,
S.H. Lucas. RAE TR 85035 April 1985 [17] An assessment of active noise reduction headsets for use in the Hercules C130 aircraft. Susan James, Mark
Hancock. January 1999 DERA/AS/SID/CR990019/1.0 [18] In-flight assessment of a helmet mounted active noise reduction system in Sea Harrier FRS1. Susan H James,
KMT Harpur. RAE Tech Memo MM 33 January 1990 [19] In-flight assessment of a helmet mounted active noise reduction system in Sea King 5 helicopters. Susan H
James, GM Rood. RAE Tech Memo MM 1 January 1989 [20] A review of noise surveys conducted on the Sea King AEW2 at RNAS Culdrose as part of the introduction into
service of Active Noise Reduction. M Hancock, A Hazell, P Kellett. DERA/AS/SID/CR000590/1.0 Jan 2001
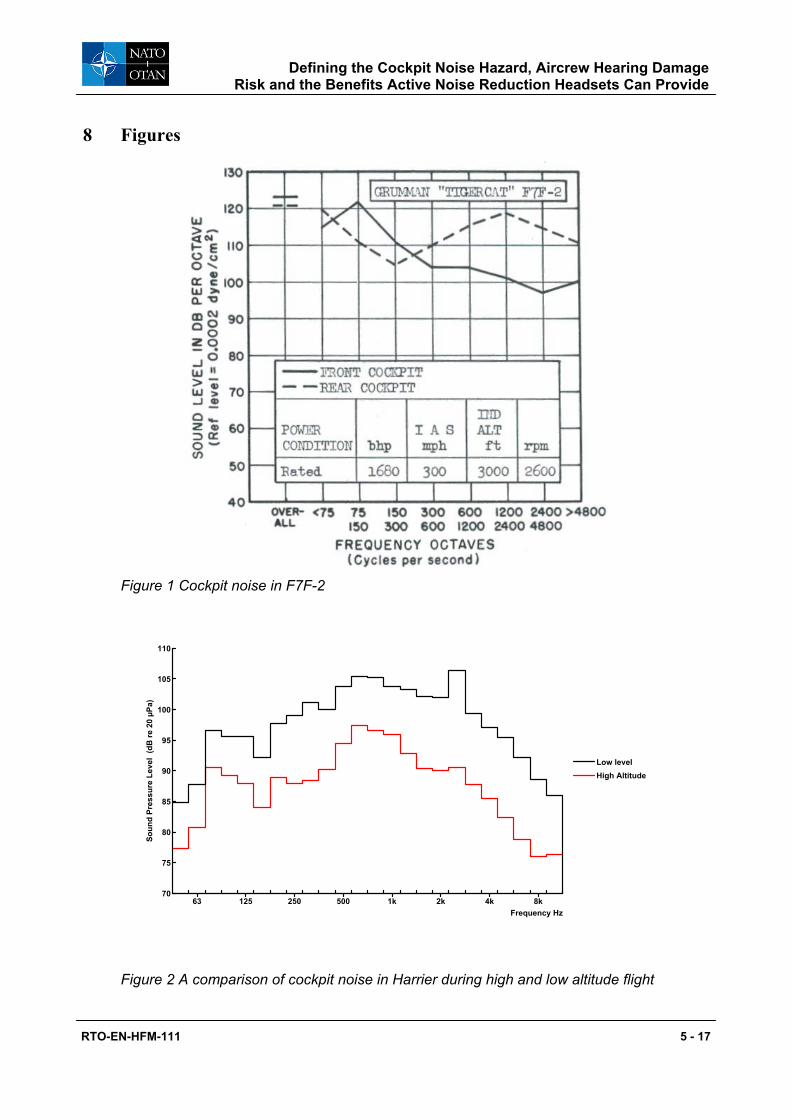
Defining the Cockpit Noise Hazard, Aircrew Hearing Damage Risk and the Benefits Active Noise Reduction Headsets Can Provide
RTO-EN-HFM-111 5 - 17
8 Figures
Figure 1 Cockpit noise in F7F-2
70
75
80
85
90
95
100
105
110
Soun
d Pr
essu
re L
evel
(dB
re 2
0 µP
a)
63 125 250 500 1k 2k 4k 8kFrequency Hz
Low levelHigh Altitude
Figure 2 A comparison of cockpit noise in Harrier during high and low altitude flight

Defining the Cockpit Noise Hazard, Aircrew Hearing Damage Risk and the Benefits Active Noise Reduction Headsets Can Provide
5 - 18 RTO-EN-HFM-111
80
85
90
95
100
105
110
115
120
Soun
d Pr
essu
re L
evel
(dB
re 2
0 µP
a)
63 125 250 500 1k 2k 4k 8kFrequency (Hz)
Max DefogNormal
Figure 3 A comparison of cockpit noise in the F-16A with ECS switched on and off
50
55
60
65
70
75
80
85
90
95
100
105
110
Soun
d Pr
essu
re L
evel
(dB
re 2
0 µP
a)
63 125 250 500 1k 2k 4k 8kFrequency (Hz)
Low levelHigh altitude
Figure 4 A comparison of cockpit noise in Jaguar during high and low altitude flight

Defining the Cockpit Noise Hazard, Aircrew Hearing Damage Risk and the Benefits Active Noise Reduction Headsets Can Provide
RTO-EN-HFM-111 5 - 19
60
70
80
90
100
110
120
Soun
d Pr
essu
re L
evel
(dB
re 2
0 µP
a)
0 1k 2k 3k 4k 5k 6k 7k 8k 9k 10kFrequency (Hz)
420kn, 250ft, 75420kn, 35kft, 85
Figure 5 Cockpit noise in Harrier illustrating the compressor fan tone.
60
65
70
75
80
85
90
95
100
105
110
Soun
d Pr
essu
re L
evel
(dB
re 2
0 µP
a)
0 500 1k 1.5k 2k 2.5k 3k 3.5k 4k 4.5k 5kFrequency (Hz)
Rotor Noise
Main GearboxConformal Gears
Gearbox MeshingMain Gearbox InputBevel Gears
Figure 6 Narrowband analysis of cockpit noise in the Lynx helicopter (100 knots)
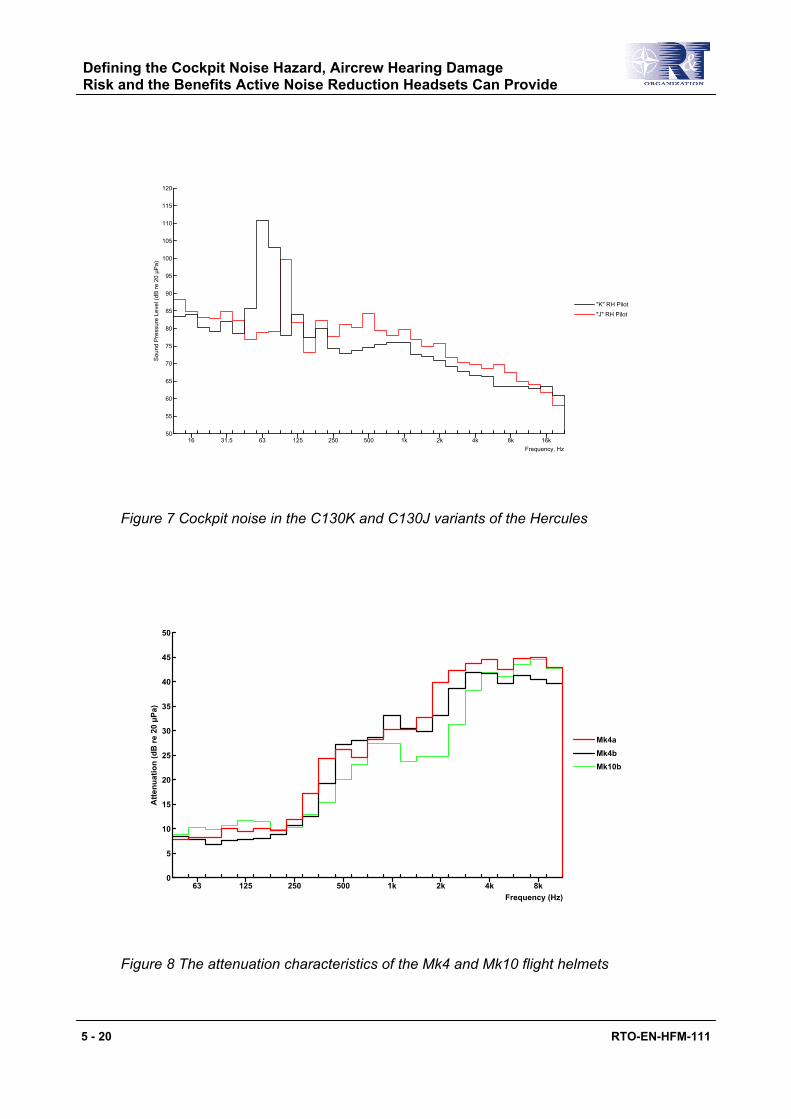
Defining the Cockpit Noise Hazard, Aircrew Hearing Damage Risk and the Benefits Active Noise Reduction Headsets Can Provide
5 - 20 RTO-EN-HFM-111
50
55
60
65
70
75
80
85
90
95
100
105
110
115
120
Sou
nd P
ress
ure
Leve
l (dB
re 2
0 µP
a)
16 31.5 63 125 250 500 1k 2k 4k 8k 16kFrequency, Hz
"K" RH Pilot
"J" RH Pilot
Figure 7 Cockpit noise in the C130K and C130J variants of the Hercules
0
5
10
15
20
25
30
35
40
45
50
Atte
nuat
ion
(dB
re 2
0 µP
a)
63 125 250 500 1k 2k 4k 8kFrequency (Hz)
Mk4aMk4bMk10b
Figure 8 The attenuation characteristics of the Mk4 and Mk10 flight helmets
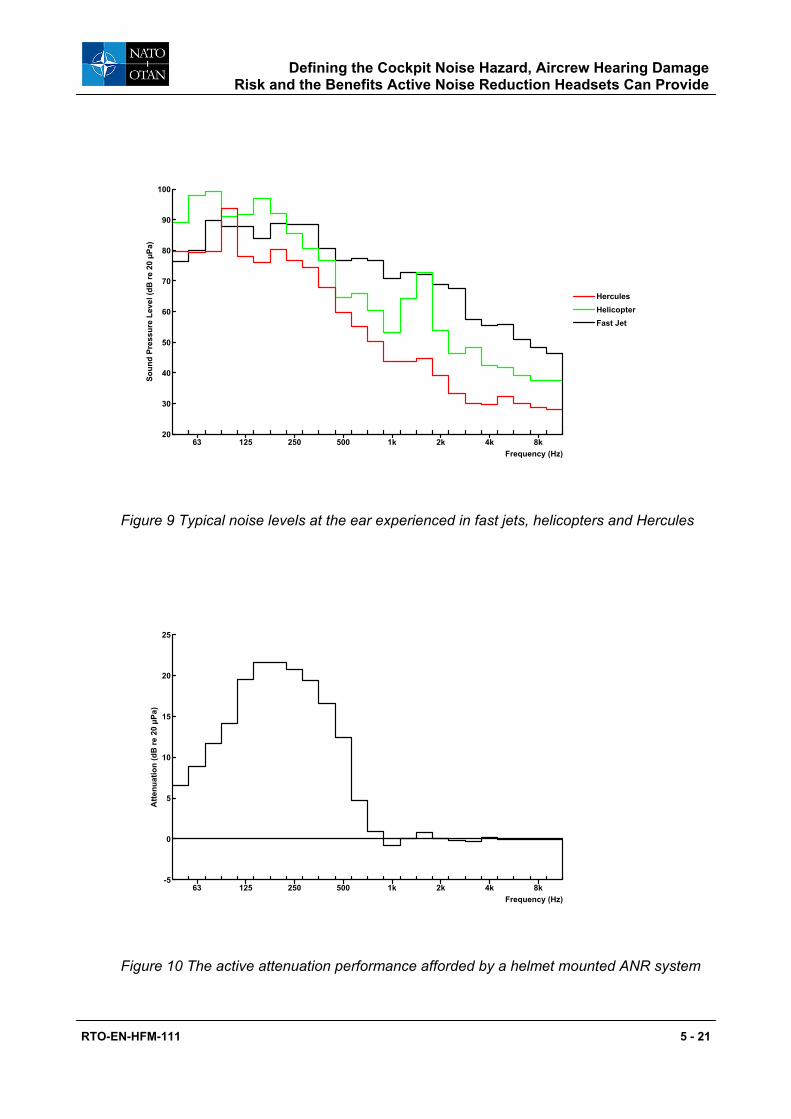
Defining the Cockpit Noise Hazard, Aircrew Hearing Damage Risk and the Benefits Active Noise Reduction Headsets Can Provide
RTO-EN-HFM-111 5 - 21
20
30
40
50
60
70
80
90
100
Soun
d Pr
essu
re L
evel
(dB
re 2
0 µP
a)
63 125 250 500 1k 2k 4k 8kFrequency (Hz)
HerculesHelicopterFast Jet
Figure 9 Typical noise levels at the ear experienced in fast jets, helicopters and Hercules
-5
0
5
10
15
20
25
Atte
nuat
ion
(dB
re 2
0 µP
a)
63 125 250 500 1k 2k 4k 8kFrequency (Hz)
Figure 10 The active attenuation performance afforded by a helmet mounted ANR system

Defining the Cockpit Noise Hazard, Aircrew Hearing Damage Risk and the Benefits Active Noise Reduction Headsets Can Provide
5 - 22 RTO-EN-HFM-111
0
5
10
15
20
25
30
35
40
45
50
Atte
nuat
ion
(dB
re 2
0 µP
a)
63 125 250 500 1k 2k 4k 8kFrequency (Hz)
Standard Mk4ANR Mk4
Figure 11 The passive plus active attenuation performance afforded by a helmet mounted ANR system
50
60
70
80
90
100
110
120
Soun
d Pr
essu
re L
evel
(dB
re 2
0 µP
a)
63 125 250 500 1k 2k 4k 8kFrequency (Hz)
A L
COCKPITPASSIVEPASSIVE + ACTIVE
Figure 12 A comparison of noise levels at the ear in Harrier GR5 during high-speed low level flight for passive and passive plus active helmet attenuation.
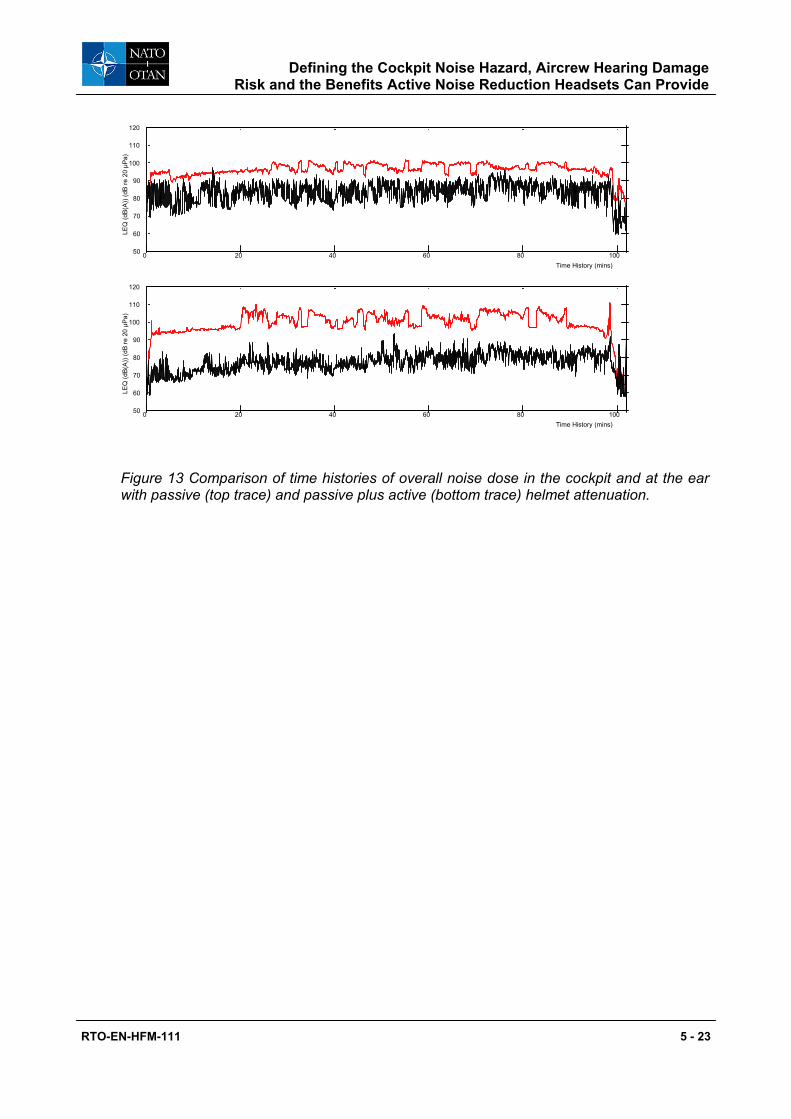
Defining the Cockpit Noise Hazard, Aircrew Hearing Damage Risk and the Benefits Active Noise Reduction Headsets Can Provide
RTO-EN-HFM-111 5 - 23
Standard Mk4A
ANR Helmet
Cabin noise
Noise at ear
Noise at ear
Cabin noise
50
60
70
80
90
100
110
120LE
Q (d
B(A)
) (dB
re 2
0 µP
a)
0 20 40 60 80 100Time History (mins)
50
60
70
80
90
100
110
120
LEQ
(dB(
A)) (
dB re
20
µPa)
0 20 40 60 80 100Time History (mins)
Figure 13 Comparison of time histories of overall noise dose in the cockpit and at the ear with passive (top trace) and passive plus active (bottom trace) helmet attenuation.

Defining the Cockpit Noise Hazard, Aircrew Hearing Damage Risk and the Benefits Active Noise Reduction Headsets Can Provide
5 - 24 RTO-EN-HFM-111

RTO-EN-HFM-111
REPORT DOCUMENTATION PAGE
1. Recipient’s Reference 2. Originator’s References 3. Further Reference 4. Security Classificationof Document
RTO-EN-HFM-111 AC/323(HFM-111)TP/56
ISBN 92-837-1140-8 UNCLASSIFIED/ UNLIMITED
5. Originator Research and Technology Organisation North Atlantic Treaty Organisation BP 25, F-92201 Neuilly-sur-Seine Cedex, France
6. Title Personal Hearing Protection including Active Noise Reduction
7. Presented at/Sponsored by
The Human Factors and Medicine Panel (HFM) to support a Lecture Series presented on 25-26 October 2004 in Warsaw, Poland; 28-29 October 2004 in Brussels, Belgium; and 9-10 November 2004 in Virginia Beach, VA, USA.
8. Author(s)/Editor(s) 9. Date
Multiple June 2005
10. Author’s/Editor’s Address 11. Pages
Multiple 114
12. Distribution Statement
There are no restrictions on the distribution of this document. Information about the availability of this and other RTO unclassified publications is given on the back cover.
13. Keywords/Descriptors
Acoustic measurement Active Noise Reduction (ANR) Ear protectors Hazards Hearing protective devices
Human factors engineering Insertion loss Noise (sound) Noise masking Noise reduction
Passive hearing protection Protective equipment Standardization Talk-through hearing protectorsVoice communication
14. Abstract
Personal hearing protection and speech communication facilities are essential for optimal performance in military operations. High noise levels increase the risk of noise induced hearing loss and deterioration of communications. These proceedings from a lecture series on hearing protection and speech communication discuss the state-of-the-art of these topics. This includes:
• The physiological effects in the ear due to a high noise exposure and criteria for an adequate protection
• The construction and performance of passive hearing protectors (isolation of noise) • Active hearing protectors (electronic generation of anti noise) • Optimal design or selection of systems by various assessment methods • Realistic examples of military applications
The lecture series were held in Poland, Belgium, and the USA.

RTO-EN-HFM-111

NORTH ATLANTIC TREATY ORGANISATION RESEARCH AND TECHNOLOGY ORGANISATION
BP 25
F-92201 NEUILLY-SUR-SEINE CEDEX • FRANCE Télécopie 0(1)55.61.22.99 • E-mail [email protected]
DIFFUSION DES PUBLICATIONS
RTO NON CLASSIFIEES
Les publications de l’AGARD et de la RTO peuvent parfois être obtenues auprès des centres nationaux de distribution indiqués ci-dessous. Si vous souhaitez recevoir toutes les publications de la RTO, ou simplement celles qui concernent certains Panels, vous pouvez demander d’être inclus soit à titre personnel, soit au nom de votre organisation, sur la liste d’envoi. Les publications de la RTO et de l’AGARD sont également en vente auprès des agences de vente indiquées ci-dessous. Les demandes de documents RTO ou AGARD doivent comporter la dénomination « RTO » ou « AGARD » selon le cas, suivi du numéro de série. Des informations analogues, telles que le titre est la date de publication sont souhaitables. Si vous souhaitez recevoir une notification électronique de la disponibilité des rapports de la RTO au fur et à mesure de leur publication, vous pouvez consulter notre site Web (www.rta.nato.int) et vous abonner à ce service.
CENTRES DE DIFFUSION NATIONAUX
ALLEMAGNE FRANCE PAYS-BAS Streitkräfteamt / Abteilung III O.N.E.R.A. (ISP) Royal Netherlands Military Fachinformationszentrum der 29, Avenue de la Division Leclerc Academy Library
Bundeswehr (FIZBw) BP 72, 92322 Châtillon Cedex P.O. Box 90.002 Friedrich-Ebert-Allee 34, D-53113 Bonn 4800 PA Breda GRECE (Correspondant)
BELGIQUE Defence Industry & Research POLOGNE Etat-Major de la Défense General Directorate, Research Directorate Armament Policy Department Département d’Etat-Major Stratégie Fakinos Base Camp, S.T.G. 1020 218 Niepodleglosci Av. ACOS-STRAT – Coord. RTO Holargos, Athens 00-911 Warsaw Quartier Reine Elisabeth Rue d’Evère, B-1140 Bruxelles HONGRIE PORTUGAL Department for Scientific Analysis Estado Maior da Força Aérea
CANADA Institute of Military Technology SDFA – Centro de Documentação DSIGRD2 Ministry of Defence Alfragide Bibliothécaire des ressources du savoir H-1525 Budapest P O Box 26 P-2720 Amadora R et D pour la défense Canada Ministère de la Défense nationale ISLANDE REPUBLIQUE TCHEQUE 305, rue Rideau, 9e étage Director of Aviation LOM PRAHA s. p. Ottawa, Ontario K1A 0K2 c/o Flugrad o. z. VTÚLaPVO
Reykjavik Mladoboleslavská 944 DANEMARK PO Box 18
Danish Defence Research Establishment ITALIE 197 21 Praha 9 Ryvangs Allé 1, P.O. Box 2715 Centro di Documentazione DK-2100 Copenhagen Ø Tecnico-Scientifica della Difesa ROYAUME-UNI
Via XX Settembre 123 Dstl Knowledge Services ESPAGNE 00187 Roma Information Centre, Building 247
SDG TECEN / DGAM Dstl Porton Down C/ Arturo Soria 289 LUXEMBOURG Salisbury Madrid 28033 Voir Belgique Wiltshire SP4 0JQ
ETATS-UNIS NORVEGE TURQUIE
NASA Center for AeroSpace Norwegian Defence Research Establishment Milli Savunma Bakanlığı (MSB) Information (CASI) Attn: Biblioteket ARGE ve Teknoloji Dairesi Başkanlığı
Parkway Center, 7121 Standard Drive P.O. Box 25, NO-2007 Kjeller 06650 Bakanliklar – Ankara Hanover, MD 21076-1320
AGENCES DE VENTE NASA Center for AeroSpace The British Library Document Canada Institute for Scientific and
Information (CASI) Supply Centre Technical Information (CISTI) Parkway Center, 7121 Standard Drive Boston Spa, Wetherby National Research Council Hanover, MD 21076-1320 West Yorkshire LS23 7BQ Acquisitions, Montreal Road, Building M-55 ETATS-UNIS ROYAUME-UNI Ottawa K1A 0S2, CANADA
Les demandes de documents RTO ou AGARD doivent comporter la dénomination « RTO » ou « AGARD » selon le cas, suivie du numéro de série (par exemple AGARD-AG-315). Des informations analogues, telles que le titre et la date de publication sont souhaitables. Des références bibliographiques complètes ainsi que des résumés des publications RTO et AGARD figurent dans les journaux suivants :
Scientific and Technical Aerospace Reports (STAR) Government Reports Announcements & Index (GRA&I) STAR peut être consulté en ligne au localisateur de publié par le National Technical Information Service ressources uniformes (URL) suivant: Springfield
http://www.sti.nasa.gov/Pubs/star/Star.html Virginia 2216 STAR est édité par CASI dans le cadre du programme ETATS-UNIS NASA d’information scientifique et technique (STI) (accessible également en mode interactif dans la base de STI Program Office, MS 157A données bibliographiques en ligne du NTIS, et sur CD-ROM) NASA Langley Research Center Hampton, Virginia 23681-0001 ETATS-UNIS

NORTH ATLANTIC TREATY ORGANISATION RESEARCH AND TECHNOLOGY ORGANISATION
BP 25
F-92201 NEUILLY-SUR-SEINE CEDEX • FRANCE Télécopie 0(1)55.61.22.99 • E-mail [email protected]
DISTRIBUTION OF UNCLASSIFIED RTO PUBLICATIONS
AGARD & RTO publications are sometimes available from the National Distribution Centres listed below. If you wish to receive all RTO reports, or just those relating to one or more specific RTO Panels, they may be willing to include you (or your Organisation) in their distribution. RTO and AGARD reports may also be purchased from the Sales Agencies listed below. Requests for RTO or AGARD documents should include the word ‘RTO’ or ‘AGARD’, as appropriate, followed by the serial number. Collateral information such as title and publication date is desirable.
If you wish to receive electronic notification of RTO reports as they are published, please visit our website (www.rta.nato.int) from where you can register for this service.
NATIONAL DISTRIBUTION CENTRES
BELGIUM GERMANY NORWAY Etat-Major de la Défense Streitkräfteamt / Abteilung III Norwegian Defence Research Département d’Etat-Major Stratégie Fachinformationszentrum der Establishment ACOS-STRAT – Coord. RTO Bundeswehr (FIZBw) Attn: Biblioteket Quartier Reine Elisabeth Friedrich-Ebert-Allee 34 P.O. Box 25, NO-2007 Kjeller Rue d’Evère D-53113 Bonn B-1140 Bruxelles POLAND
GREECE (Point of Contact) Armament Policy Department CANADA Defence Industry & Research 218 Niepodleglosci Av.
DRDKIM2 General Directorate, Research Directorate 00-911 Warsaw Knowledge Resources Librarian Fakinos Base Camp, S.T.G. 1020 Defence R&D Canada Holargos, Athens PORTUGAL Department of National Defence Estado Maior da Força Aérea 305 Rideau Street HUNGARY SDFA – Centro de Documentação 9th Floor Department for Scientific Analysis Alfragide, P-2720 Amadora Ottawa, Ontario K1A 0K2 Institute of Military Technology
Ministry of Defence SPAINCZECH REPUBLIC H-1525 Budapest P O Box 26 SDG TECEN / DGAM
LOM PRAHA s. p. C/ Arturo Soria 289 o. z. VTÚLaPVO ICELAND Madrid 28033 Mladoboleslavská 944 Director of Aviation PO Box 18 c/o Flugrad, Reykjavik TURKEY 197 21 Praha 9 Milli Savunma Bakanlığı (MSB)
ITALY ARGE ve Teknoloji Dairesi Başkanlığı DENMARK Centro di Documentazione 06650 Bakanliklar – Ankara
Danish Defence Research Tecnico-Scientifica della Difesa Establishment Via XX Settembre 123 UNITED KINGDOM
Ryvangs Allé 1 00187 Roma Dstl Knowledge Services P.O. Box 2715 Information Centre, Building 247 DK-2100 Copenhagen Ø LUXEMBOURG Dstl Porton Down
See Belgium Salisbury, Wiltshire SP4 0JQ FRANCE
O.N.E.R.A. (ISP) NETHERLANDS UNITED STATES 29, Avenue de la Division Leclerc Royal Netherlands Military NASA Center for AeroSpace BP 72 Academy Library Information (CASI) 92322 Châtillon Cedex P.O. Box 90.002 Parkway Center, 7121 Standard Drive 4800 PA Breda Hanover, MD 21076-1320
SALES AGENCIES NASA Center for AeroSpace The British Library Document Canada Institute for Scientific and
Information (CASI) Supply Centre Technical Information (CISTI) Parkway Center Boston Spa, Wetherby National Research Council 7121 Standard Drive West Yorkshire LS23 7BQ Acquisitions Hanover, MD 21076-1320 UNITED KINGDOM Montreal Road, Building M-55 UNITED STATES Ottawa K1A 0S2, CANADA
Requests for RTO or AGARD documents should include the word ‘RTO’ or ‘AGARD’, as appropriate, followed by the serial number (for example AGARD-AG-315). Collateral information such as title and publication date is desirable. Full bibliographical references and abstracts of RTO and AGARD publications are given in the following journals:
Scientific and Technical Aerospace Reports (STAR) Government Reports Announcements & Index (GRA&I) STAR is available on-line at the following uniform published by the National Technical Information Service resource locator: Springfield
http://www.sti.nasa.gov/Pubs/star/Star.html Virginia 2216 STAR is published by CASI for the NASA Scientific UNITED STATES and Technical Information (STI) Program (also available online in the NTIS Bibliographic STI Program Office, MS 157A Database or on CD-ROM) NASA Langley Research Center Hampton, Virginia 23681-0001 UNITED STATES
ISBN 92-837-1140-8