Embed Size (px)
Citation preview
~
NASA Technical Memorandum 100024
Personal Computer (PC) Based Image Processing Applied to Fluid Mechanics Y-C Cho and B.G. McLachlan, Ames Research Center, Moffett Field, California
October 1987
National Aeronautics and Space Administration
Ames Research Center Moffett Field, California 94035
https://ntrs.nasa.gov/search.jsp?R=19880001705 2018-05-25T22:41:13+00:00Z
. . Personal computer ( P C ) based image processing applied t o f l u i d mechanics research
Y-C Cho and B . G . McLachlan
NASA Ames Research Center, Moffett Field, CA 94035
ABSTRACT
A PC based image processing system was employed to determine the instantaneous velocity f i e l d of a two- dimensional unsteady flow. The flow was visualized u s i n g a suspension of seeding pa r t i c l e s i n water, and a laser sheet for i l lumination. a s a pat tern of s t reaks . The s t reak pat tern was d ig i t ized and processed u s i n g various imaging operat ions, including contrast manipulation, noise cleaning, f i l t e r i n g , s t a t i s t i c a l differencing, thresholding, e t c . Information concerning the veloci ty was extracted from the enhanced image by measuring the length and or ienta- t ion of the individual s t reaks . The f lu id ve loc i t i e s deduced from the randomly d is t r ibu ted p a r t i c l e s t reaks were interpolated to obtain ve loc i t i e s a t uniform grid points . lu t ion technique w i t h an adaptive Gaussian window. The r e s u l t s a r e compared w i t h a numerical prediction by a Navier-Stokes computation.
With a f i n i t e time exposure, the pa r t i c l e motion was captured on a photograph
For the interpolat ion we used a simple convo-
1. INTRODUCTION
An important task i n experimental f l u id dynamics is determination of flow ve loc i t i e s . Most of the commonly and l a se r Doppler velocimetry, measure flow veloci ty a t one s p a t i a l used methods, such a s hot wire anemometry
locat ion a t a time.' determinu the veloci ty f i e l d of a steady flow or the phase-locked average velocity f i e l d of a periodic unsteady flow. flow. Conventional point-measurement methods, such a s those mentioned above, a r e not su i t ab le for such mea- surements. Thus f l u i d dynamicists have been seeking new methods tha t explo i t modern computer technology. These new methods include st i l l i n the process of be ing
With repeated measurements a t extended s p a t i a l locat ions these methods can be used t o
A more challenging undertaking is measurement of the veloci ty f i e ld of a non-periodic unsteady
l a se r speckle velocimetry (LSV) and p a r t i c l e image velocimetry (PIV), which a re
We recently embarked on a research program to develop image processing techniques applied t o the measure- ment of t h e velocity f i e l d of unsteady flow. For the i n i t i a l phase of the program, PC based image processing was used t o determine the velocity f i e l d around a c i r cu la r cylinder which was subjected to an impulsive l i nea r motion. The "Par t ic le Streak Method" was employed fo r measurement. The concept is simple and dates back to the ear ly par t of the c e n t ~ r y . ~ , ~ viously viable largely because the manual manipulation of the images required too much time and e f f o r t . Advancement i n d i g i t a l image processing technologies appl ica t ions , sometimes excessive emphasis has been placed on automation of data reduction, and a good portion of the s ign i f icant image data is discarded t o avoid the r i s k of including wrong da ta . To accumulate s u f f i - c i en t data points t o map out the veloci ty f i e l d , repeated image detect ion of a spec i f i c s t a t e is required. Such repe t i t ion is i n p rac t ice feas ib le only fo r steady flow. In the present s t u d y , we use a semi-automatic data-reduction scheme, which can recover s ign i f i can t image data much more e f f i c i e n t l y than a current ly ava i l - able automatic ~ c h e m e . ~
Despite its long his tory and inherent s impl ic i ty , t h i s method was not pre-
has recently revived i n t e r e s t i n t h e m e t h ~ d . ~ ' ~ In its
I n the proceeding sec t ions , we w i l l descr ibe the image processing system, the experimental setup for taking s t reak images, the enhancement of the images, extract ion of the binary images, determination of the ve loc i t ies from the binary images, and interpolat ion of t h e ve loc i t ies . I t w i l l be followed by discussions of the results, which a r e compared w i t h a numerical predict ion made by a Navier-Stokes computation.
2 . IMAGE PROCESSING SYSTEM
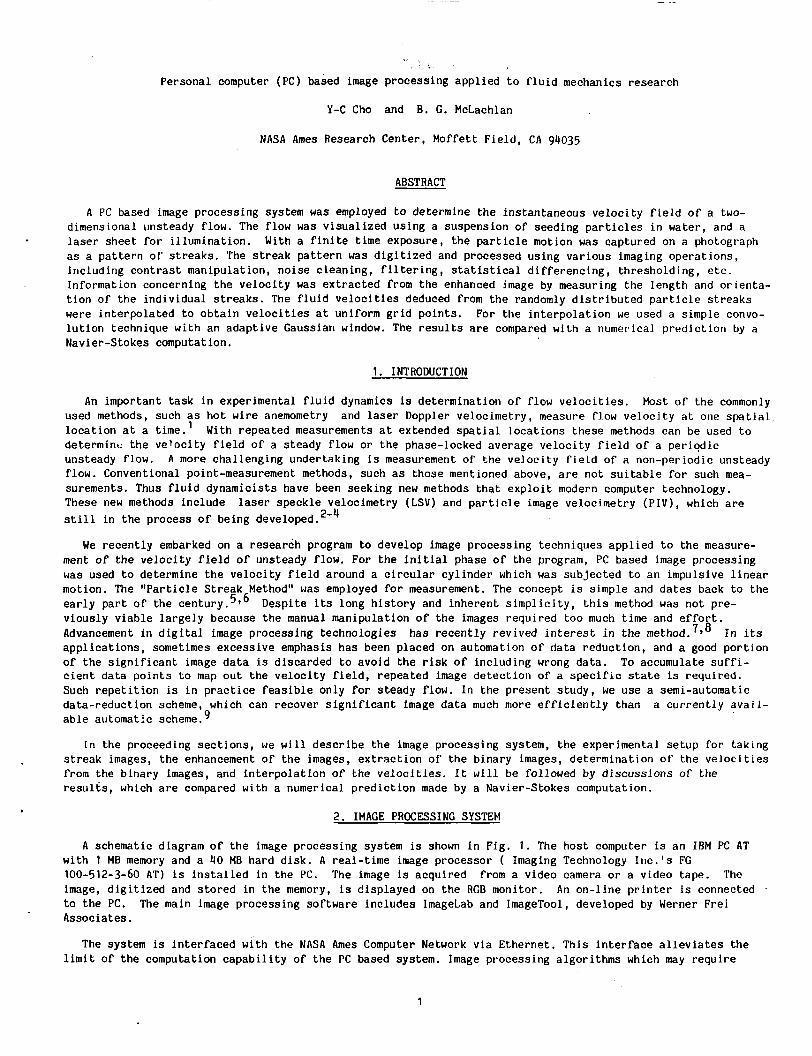
A schematic diagram of the image processing system is shown i n Fig. 1 . The host computer is an IBM PC AT w i t h 1 MB memory and a 40 MB hard d i s k . A real-t ime image processor ( Imaging Technology I I IC . 'S FG 100-512-3-60 AT) is ins t a l l ed i n the PC. The image is acquired from a video camera o r a video tape. The image, d ig i t ized and s tored i n the memory, is displayed on the RCB monitor. An on-line p r in t e r is connected to the PC. The main image processing software includes ImageLab and ImageTool, developed by Werner Frei Associates.
The system is interfaced w i t h the NASA Ames Computer Network via Ethernet. T h i s in te r face a l l e v i a t e s the l i m i t of the computation capabi l i ty of the PC based system. Image processing algorithms which may require
1
ORIGINAL PAGE TS OF POOR QUALITY
l a r g e memory a n d s o p h i s t i c a t e d s u b r o u t i n e s c a n b e e x e c u t e d on t h e N A S A Ames c o m p u t e r s s u c h a s MicroVax, Vax, or C r a y .
INTERFACE WITH NASA A-COMPUTER NETWORK W A X . MICROVAX. CRAVI
40 HB nD. i 2 MB MEMORY
VIDEO INPUT IMAGING TECH F G 100 512 3 60 AT
IMAGELAB A N D IMAGETOOL ISOFTWAREI
VIDEO OUTPUT R S - l l O
F i g u r e 1 . S c h e m a t i c d i a g r a m of PC b a s e d p r o c e s s i n g s y s t e m .
image
LASER SHEET
CYLINDRICAL
LASER
CIRCULAR CYLINDER
CAMERA
I / MIRROR
F i g u r e 2 . E x p e r i m e n t a l a r r a n g e m e t i t u s e d t o o b t a i n s t r e a k p h o t o g r a p h .
3. EXPERIMENTAL SETUP
A s c h e m a t i c of t h e e x p e r i m e n t a l a r r a n g e m e n t is shown i n F i g . 2 . Shown is a water t o w i n g t a n k t h a t h a s g l a s s walls for v i e w i n g a n d a n o p e n t o p . The t a n k is 48 i n . i n l e n g t h , 2 0 i n . i n h e i g h t , a n d 13 i n . i n w i d t h . The c i r c u l a r c y l i n d e r model is of 0.5 i n . d i a m e t e r a n d 1 1 i n . s p a n , a n d was h o r i z o n t a l l y f i x e d be tween two P l e x i g l a s e n d p l a t e s t h a t are a t t a c h e d to a l e a d - s c r e w a s s e m b l y a t o p t h e tow t a n k . A t time t = 0 t h e c y l i n d e r was i m p u l s i v e l y set i n t o m o t i o n w i t h a c o n s t a n t s p e e d i n a h o r i z o n t a l d i r e c t i o n normal t o its s p a n .
The flow was v i s u a l i z e d by means of a s u s p e n s i o n of n e u t r a l l y b u o y a n t s e e d i n g p a r t i c l e s i n water i l l u m i - n a t e d by a laser s h e e t t h a t was v e r t i c a l l y a l i g n e d w i t h t h e t a n k c e n t e r l i n e a n d t h e d i r e c t i o n of m o t i o n . S h o r t time e x p o s u r e p h o t o g r a p h s of t h e i n d u c e d p a r t i c l e m o t i o n i n t h e p l a n e of i l l u m i n a t i o n were t a k e n s u c c e s s i v e l y a t r e g u l a r i n t e r v a l s i n t h e c y l i n d e r m o t i o n . The p h o t o g r a p h s were t a k e n u s i n g ASA 160 color f i l m a n d a 35 mm s i n g l e - l e n s - r e f l e x camera e q u i p p e d w i t h a 55 mm macro l e n s s e t a t f2.8. The camera was moved w i t h t h e model t o p r o d u c e t h e s t r e a k p a t t e r n a s s e e n by a n o b s e r v e r i n t h e model frame of r e f e r e n c e . The p a r t i c l e s u s e d were made of P l i o l i t e ACL a n d r a n g e d i n d i a m e t e r f rom .0021 t o .0035 i n .
4 . PROCESSING OF STREAK IMAGE
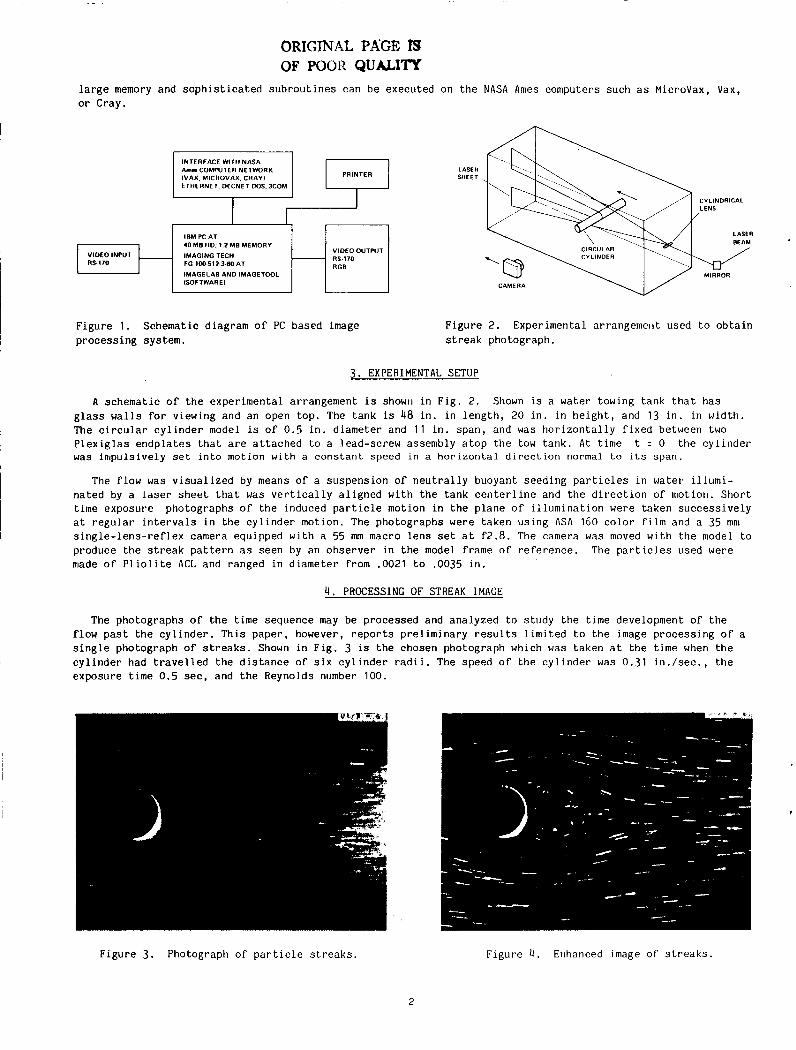
The p h o t o g r a p h s of t h e time s e q u e n c e may b e p r o c e s s e d a n d a n a l y z e d t o s t u d y t h e time d e v e l o p m e n t of t h e flow p a s t t h e c y l i n d e r . T h i s p a p e r , however , r e p o r t s p r e l i m i n a r y r e s u l t s l i m i t e d t o t h e image p r o c e s s i n g of a s i n g l e p h o t o g r a p h of s t r e a k s . Shown i n F i g . 3 is t h e c h o s e n p h o t o g r a p h which was t a k e n a t t h e time when t h e c y l i n d e r had t r a v e l l e d t h e d i s t a n c e of s i x c y l i n d e r r a d i i . The s p e e d of t h e c y l i n d e r was 0 . 3 1 i n . / s e c . , t h e e x p o s u r e time 0.5 sec, a n d t h e R e y n o l d s number 100.
F i g u r e 3 . P h o t o g r a p h of p a r t i c l e s t r e a k s . F i g u r e 4 . Enhanced image of streaks.
2
ORIGINAL PAGE. IS ,OF POOR QUALITY
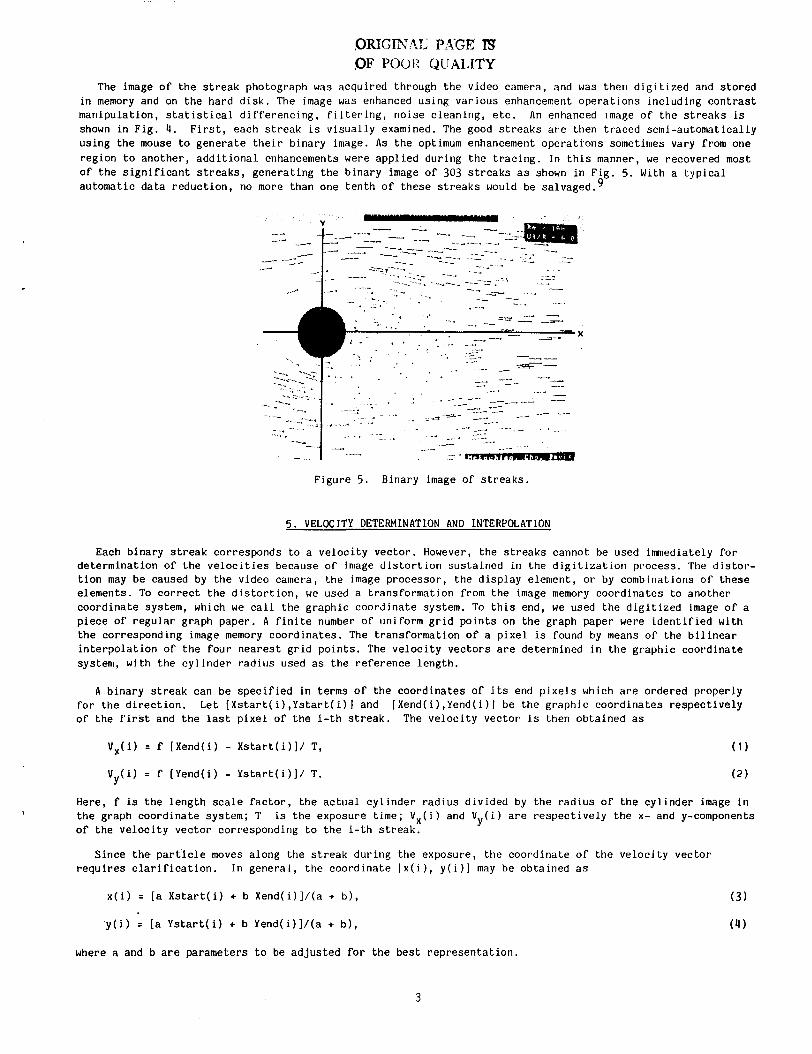
The image of the s t reak photograph was acquired through the video camera, and was then digit ized and stored i n memory and on the hard d i s k . The image was enhanced using various enhancement operations including contrast manipulation, s t a t i s t i c a l differencing, f i l t e r i n g , noise cleaning, e t c . An enhanced image of the streaks is shown i n Fig. 4 . F i r s t , each streak is visually examined. The good s t reaks a re then traced semi-automatically using the mouse to generate the i r binary image. As the optimum enhancement operations sometimes vary from one region t o another, additional enhancements were applied during the tracing. In t h i s manner, we recovered most of the s ignif icant s t reaks, generating the binary image of 303 st reaks a s shown i n F i g . 5. With a typical automatic data reduction, no more than one tenth of these s t reaks would be ~ a l v a g e d . ~
Figure 5 . Binary image of s t reaks.
5. VELOCITY DETERMINATION AND INTERPOLATION
Each binary s t reak corresponds to a velocity vector. However, the s t reaks cannot be used imnediately for determination of the veloci t ies because of image dis tor t ion sustained i n the digit izatiori pi’ocess. The distor- tion may be caused by the video camera, the image processor, the display element, or by combiiiations of these elements. To correct the d is tor t ion , we used a transformation from the image memory coordinates to another coordinate system, which we ca l l the graphic coordinate system. To t h i s end, we used the digit ized image of a piece of regular graph paper. A f i n i t e number of uniform grid points on the graph paper were identified w i t h the corresponding image memory coordinates. The transformation of a pixel is found by means of the bi l inear interpolation of the fotlr nearest grid points. The velocity vectors a r e determined i n the graphic coordinate system, with the cylinder radius used as the reference length.
A binary streak can be specified i n terms of the coordinates of its end pjxels which a r e ordered properly for the direction. Let [ X s t a r t ( i ) , Y s t a r t ( i ) ] and [Xend(i),Yend(i)l be the graphic coordinates respectively of the f i r s t and the l a s t pixel of t h e i - t h s t reak. The velocity vector js then obtained as
V x ( i ) = f [Xend(i) - X s t a r t ( i ) ] / T , ( 1 )
V ( i ) = f [Yend(i) - Y s t a r t ( i ) ] / T. (2) Y
Here, f is t h e length scale factor , the actual cylinder radius divided by the radius of the cylinder image in the graph coordinate system; T of the velocity vector corresponding t o the i - t h streak.
i s the exposure time; V,(i) and V ( i ) a re respectively the x- and y-components Y
Since the par t ic le moves along the streak during the exposure, the coordinate of the velocity vector requires c la r i f ica t ion . I n general, the coordinate [ x ( i ) , y ( i ) l may be obtained a s
x ( i ) = [a Xs tar t ( i ) + b Xend(i)l /(a + b ) ,
y ( i ) I [a Ys tar t ( i ) + b Yend(i)]/(a + b ) ,
where a and b a r e parameters to be adjusted for the best representation.
3
Equations ( 1 ) and ( 2 ) determine the velocity vectors a t the locations where the binary s t reaks a r e recov-
V ( x , y ) a t the graph coordinate ( x , y ) ered. I t is frequently desired to interpolate the ve loc i t ies a t some othe+r locations. Here we use a simple convolution w i t h an adaptive Gaussian win do^.^"^ is obtained a s
The velocity vector
+ i V ( X , Y ) = 2 2 2
e - ( [x -x ( i ) l + [ ( y - y ( i ) l ) / h ( x , y ) i
(5)
where h ( x , y ) is the width of a Gaussian window and its optimum value is inversely proportional t o the square root of the density of the s t reaks .
T h i s interpolation has been chosen fo r the following reasons: F i r s t i t is simple t o use, par t icu lar ly for the interpolations from data points of a nonuniform dis t r ibu t ion a s i n the present s t u d y . Another reason is that the seeding pa r t i c l e s , and t h u s the s t reaks a re of a random or a Gaussian d is t r ibu t ion , and t h i s fac t is philosophically consistent w i t h the choice of the Gaussian window formula.
6 . DISCUSSIONS AND CONCLUDING REMARKS
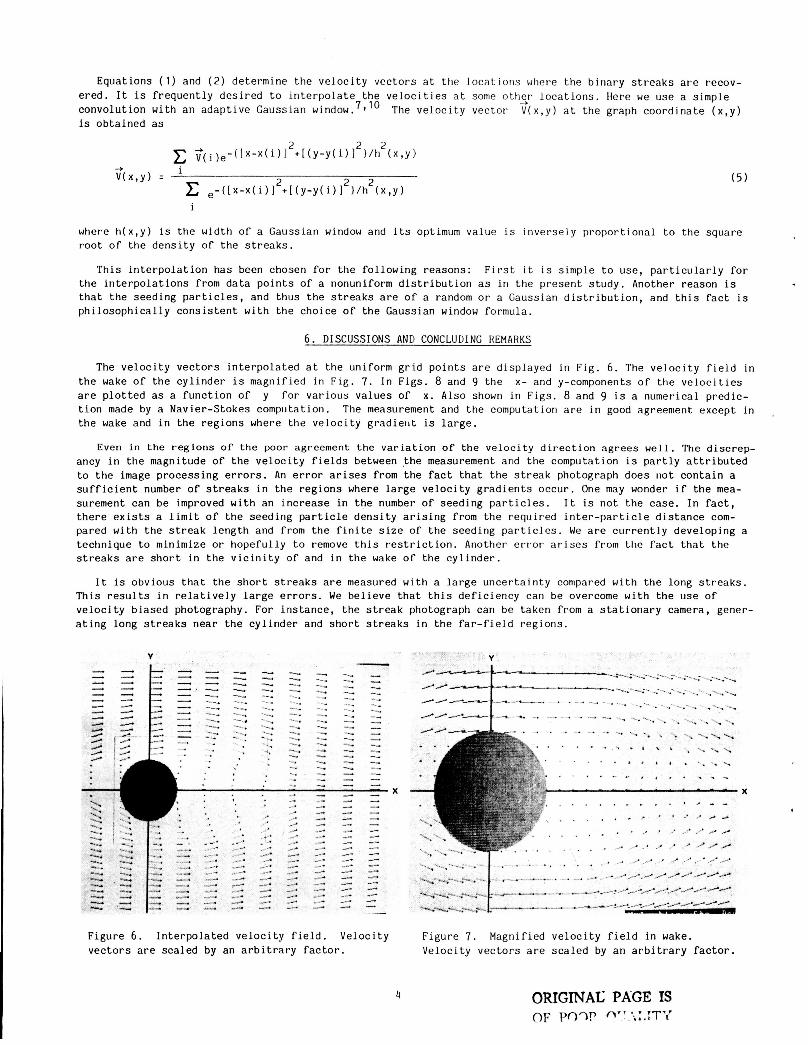
The velocity vectors interpolated a t the uniform grid points a r e displayed i n Fig. 6 . The velocity f ie ld in the wake of the cylinder is magnified i n Fig. 7. I n Figs. 8 and 9 the a re plotted as a function of tion made by a Navier-Stokes computation. the wake and i n the regions where the velocity gradietit is large.
x - and y-components of the ve loc i t ies y for various values of x . Also shown i n Figs. 8 and 9 is a numerical predic-
The measurement and the computation a r e in good agreement except i n .
Even i n the regions of the poor agreement the variation of the velocity direction agrees well. The discrep- ancy i n the magnitude of the velocity f i e lds between the measurement and the computation is partly a t t r ibu ted to the image processing e r rors . An e r ror a r i s e s from the f a c t that the streak photograph does riot contain a su f f i c i en t number of s t reaks i n the regions where large velocity gradients occur. One may wonder i f the mea- surement can be improved w i t h an increase i n the number of seeding pa r t i c l e s . I t is not the case. I n f ac t , there ex i s t s a l i m i t of the seeding pa r t i c l e density a r i s ing from the required in te r -par t ic le distance com- pared wi th the s t reak length and from the f i n i t e s i z e of the seeding pa r t i c l e s . We a re currently developing a technique to minimize or hopefully t o remove t h i s r e s t r i c t ion . Another e r ror a r i s e s from the f ac t that the s t reaks a r e shor t i n the v ic in i ty of and i n the wake of the cylinder.
I t is obvious tha t the short s t reaks a re measured w i t h a large uncertainty compared w i t h the long s t reaks . T h i s r e su l t s i n re la t ive ly la rge e r rors . We believe that t h i s deficiency can be overcome w i t h the use of velocity biased photography. For instance, the s t reak photograph can be taken from a s ta t ionary camera, gener- a t ing long s t reaks near the cylinder and short s t reaks i n the fa r - f ie ld regions.
-.. -__
_-1
L I- - -- _A -.- _..- e A - -
Figure 6 . Interpolated velocity f i e l d . Velocity Figure 7 . Magnified velocity f i e ld i n wake. vectors a re scaled by an a rb i t r a ry factor. Velocity vectors a re scaled by an a rb i t r a ry fac tor .
4 ORIGINAC PAGE IS OF PO?? nTY.'i:.TTy<
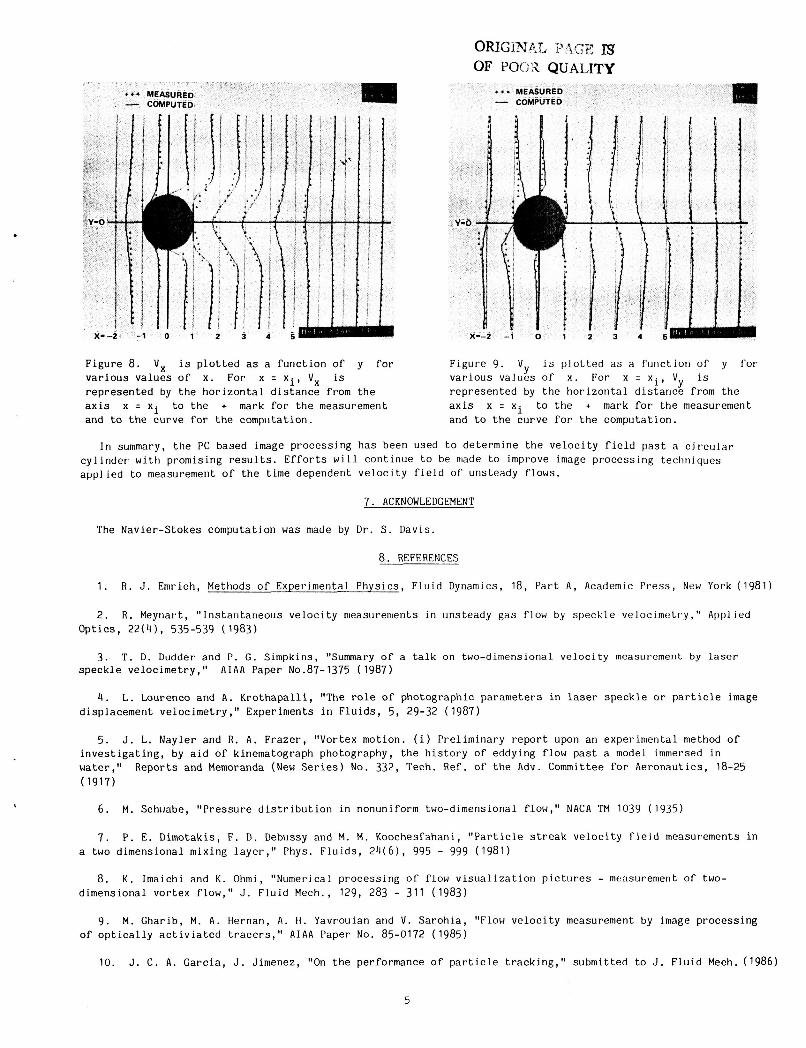
Figure 8. V x is plotted a s a function of y for Figure 9. Vy is plotted a s a function of y for various values of x . For x = x i , V x is various values of x . For x = x i , Vy is represented by the horizontal distance from the represented by the horizontal distance from the ax is x = x i to the + mark for the measurement ax is x = x i to the + mark for the measurement and to the curve for the computation. and to the curve for the computation.
I n summary, the PC based image processing has been used to determine the velocity f i e ld past a cjrciilar cylinder w j ~ h promising r e su l t s . Efforts w i l l continue t o be made to improve image processing techriiques applied to measurement of the time dependent velocity f i e ld of unsteady flows.
7 . ACKNOWLEDGEMENT
The Navier-Stokes computation was made by Dr. S. Davis.
8. REFERENCES
1 . R . J . Emrich, Methods of Experimental Physics, F l u i d Dynamics, 18, Part A , Academic Press, New York (1981)
2. R . Meyriart, "Instaritaneous velocity nieasiireriients i n unsteady gas flow by speckle velocinietr.y," Applied Optics, 2 2 ( 4 ) , 535-539 (1983)
3 . T. D . Dudder and P. G . Simpkins, "Summary of a talk o n two-dimensional velocity measurement by l aser speckle velocimetry," A I A A Paper No.87-1375 (1987)
4 . L . Lourenco and A . Krothapalli, "The ro le of photographic parameters i n l aser speckle or partic1.e image displacement velocimetry," Experiments i n F l u i d s , 5, 29-32 (1987)
5 . J . L. Nayler and R . A . Frazer, "Vortex motion. ( i ) Preliminary report upon an experimental method of investigating, by aid of kinematograph photography, the history of eddying flow past a model immersed i n water," Reports and Memoranda (New Ser ies ) No. 332, Tech. Ref. of the Adv. Committee for Aeronautics, 18-25 (1917)
6. M . Schirabe, "Pressure d is t r ibu t ion i n nonuniform two-dimensional flow," N A C A TM 1039 (1935)
7 . P . E . Dimotakis, F . D . Debirssy and M . M . Koochesfahani, "Par t ic le s t reak velocity f i e jd measurements i n a two dimensional mixing layer , " P h y s . F l u i d s , 2 4 ( 6 ) , 995 - 999 (1981)
8. K . Imaichi and K . O h m i , "Numerical processing of flow visualization p ic tures - measurement of two- dimensional vortex flow," J . F l u i d Mech., 129, 283 - 311 (1983)
9 . M . Gharib, M. A . Hernan, A . t i . Yavrouian and V . Sarohia, "Flow velocity measurement by image processing of op t ica l ly ac t iv ia ted t r ace r s , " A I A A Paper No. 85-0172 (1985)
10. J . C . A . Garcia, J . Jimenez, "On the performance of par t ic le tracking," submitted to J . F l u i d Mech. (1986)
5
1. Report No.
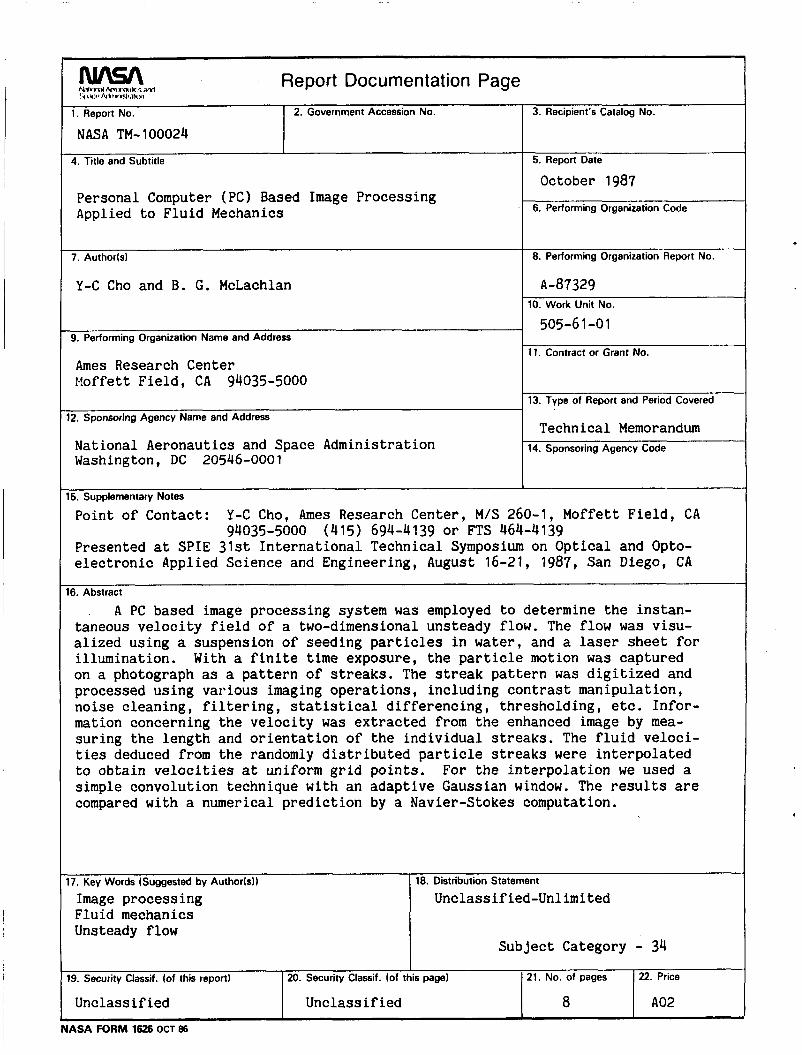
NASA TM-100024
Personal Computer (PC) Based Image Processing Applied to Fluid Mechanics
2. Government Accession No.
7. Author(s1
19. Security Classif. lof this report) 20. Security Classif. (of this page) 21. No. of pages
Unclassified Unclassified 8
Y-C Cho and B. G. McLachlan
22. Price
A02
9. Performing Organization Name and Address
Ames Research Center Moffett Field, CA 94035-5000
12. Sponsoring Agency Name and Address
National Aeronautics and Space Administration Washington, DC 20546-0001
3. Recipient's Catalog No.
5. Report Date
October 1987 6. Performing Organization Code
8. Performing Organization Report No.
A-87329 10. Work Unit No.
505-6 1-0 1
11. Contract or Grant No.
13. Type of Report and Period Covered
Technical Memorandum 14. Sponsoring Agency Code
15. Supplementary Notes
Point of Contact: Y-C Cho, Ames Research Center, M/S 260-1, Moffett Field, CA
Presented at SPIE 3lst International Technical Symposium on Optical and Opto- electronic Applied Science and Engineering, August 16-21, 1987, San Diego, CA
94035-5000 (4 15) 694-4 139 or FTS 464-4 139
16.Abstract
A PC based image processing system was employed to determine the instan- taneous velocity field of a two-dimensional unsteady flow. The flow was visu- alized using a suspension of seeding particles in water, and a laser sheet for illumination. With a finite time exposure, the particle motion was captured on a photograph as a pattern of streaks. The streak pattern was digitized and processed using various imaging operations, including contrast manipulation, noise cleaning, filtering, statistical differencing, thresholding, etc. Infor- mation concerning the velocity was extracted from the enhanced image by mea- suring the length and orientation of the individual streaks. The fluid veloci- ties deduced from the randomly distributed particle streaks were interpolated to obtain velocities at uniform grid points. For the interpolation we used a simple convolution technique with an adaptive Gaussian window. The results are compared with a numerical prediction by a Navier-Stokes computation.
17. Key Words (Suggested by Authorls))
Image processing Fluid mechanics Unsteady flow
~~
18. Distribution Statement
Unclassified-Unlimited
Subject Category - 34
,