Embed Size (px)
DESCRIPTION
Personal Carbon Trading: A review of evidence on acceptability and potential behavioural impact. Abigail Bristow Professor of Transport Studies, Department of Civil and Building Engineering, Loughborough University. Structure. Context Policy definitions Personal Carbon Trading Carbon Tax - PowerPoint PPT Presentation
Citation preview

Personal Carbon Trading: A review of evidence on acceptability and potential behavioural impact
Abigail Bristow
Professor of Transport Studies, Department of Civil and Building Engineering, Loughborough University
Structure
Context Policy definitions
Personal Carbon Trading Carbon Tax
Acceptability Behavioural response Conclusions
Context
Disconnect – between firstly: A very ambitious UK 80% target reduction in greenhouse
gas emissions by 2050; and A low carbon strategy for transport that may deliver 5%
reductions by 2020.
and secondly The dominance of policies based on technological
development; and The need for behavioural change.
More radical approaches?
A policy framework to incentivise individuals:
Trading - Personal Carbon Trading (PCT) Taxation - Carbon Tax (CT)

Definitions
PCT Individuals receive a carbon allowance based on average
emissions; To cover personal transport use and domestic energy
consumption; The allowance reduces over time in line with reductions
targets Those with emissions below the allowance may sell
carbon permits and those with emissions above the limit would have to buy more permits and/or reduce their emissions.
CT More familiar concept, increases the price of carbon
intensive goods/service relative to other things.
Research to date
Much of the work carried out on PCT and similar schemes has been theoretical.
Now there are a limited number of empirical studies and polls – reviewed here including: On Acceptability – YouGov 2006a and b; Energy
Saving Trust 2007; Harwatt 2008; Bird et al., 2009; Owen et al., 2008; Bristow et al., 2008, 2010; Von Knobelsdorff 2008; Howell 2008; Wallace et al., 2010; Capstick and Lewis 2009 and Jagers et al., 2010.
On Behavioural response: Harwatt 2008; Zanni and Bristow 2009; Capstick and Lewis 2010; Wallace 2009; Parag et al., 2009.
PCT acceptability
Some studies are highly exploratory and qualitative pieces of work with small samples (Harwatt 2008; Howell 2008).
Others have relatively small samples (Capstick and Lewis 2009; Bristow et al., 2008)
Table 1 contains only those studies with a sample of more than 100.

Table 1: Support for personal carbon trading (or similar)
Study type, sample size and date % support
National Poll, 1619, 2006 (YouGov) 25%
National Poll, 2645, 2006 (YouGov) 61%
In-home interviews 1192, 2007 (EST) 29%
On-line poll, 1081, 2008 (Bird et al) 31%
CAPI South East England, 208, 2008 (Bristow et al) 43%
Postal survey, Cambridge, 152, 2008 (Von Knobelsdorf) 44%
Postal survey, Nottinghamshire, 317, 2008 (Wallace) 42%
Postal survey, national, Sweden, 938, 2007 (Jagers et al) 36%
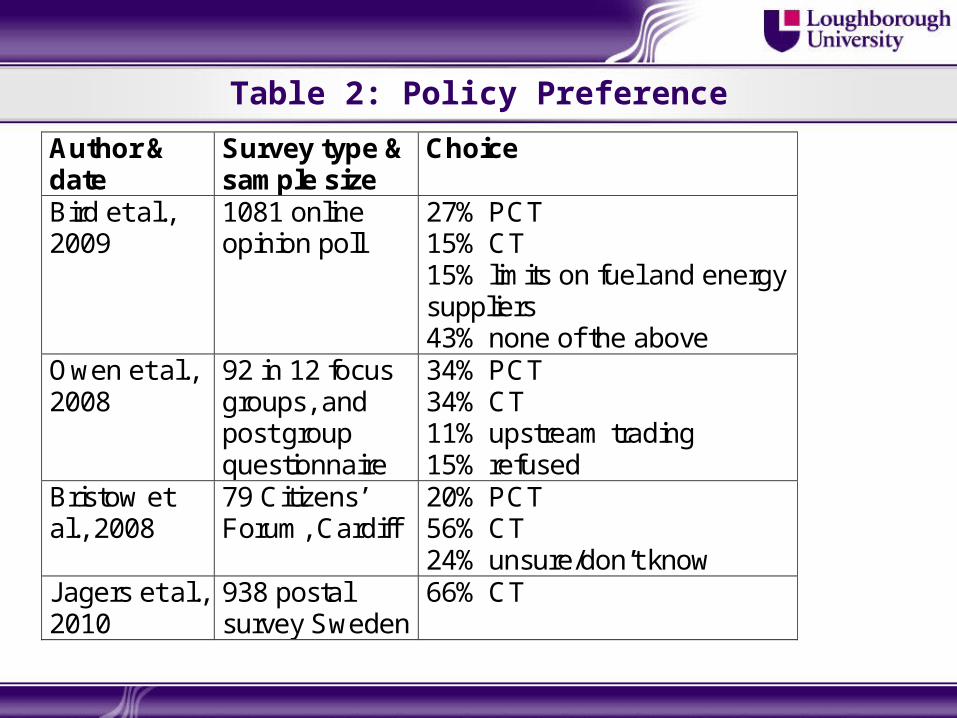
Table 2: Policy Preference
Author & date
Survey type & sample size
Choice
Bird et al., 2009
1081 online opinion poll
27% PCT 15% CT 15% limits on fuel and energy suppliers 43% none of the above
Owen et al., 2008
92 in 12 focus groups, and post group questionnaire
34% PCT 34% CT 11% upstream trading 15% refused
Bristow et al., 2008
79 Citizens’ Forum, Cardiff
20% PCT 56% CT 24% unsure/don’t know
Jagers et al., 2010
938 postal survey Sweden
66% CT

What influences acceptability?
Opinion polls relating to green taxes show significant increases in support when revenues are recycled in ways that respondents support: particularly environmental improvements and reducing other taxes.
Stated choice experiments (Bristow et al., 2010) on PCT and CT looked at design attributes. Threshold set at 4 tonnes CO2
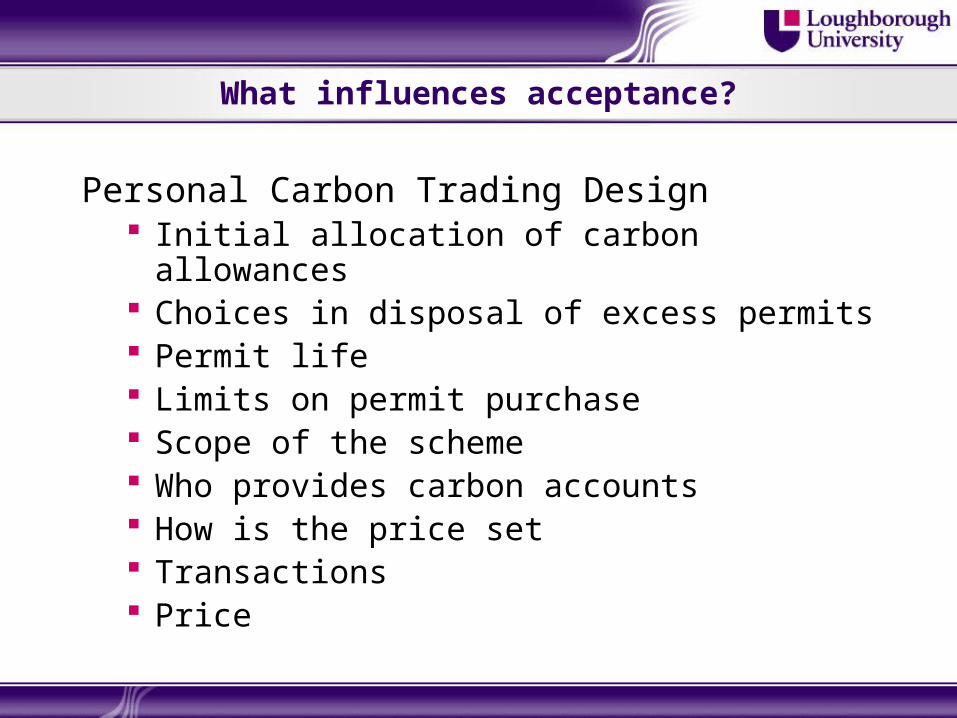
What influences acceptance?
Personal Carbon Trading Design Initial allocation of carbon allowances Choices in disposal of excess permits Permit life Limits on permit purchase Scope of the scheme Who provides carbon accounts How is the price set Transactions Price
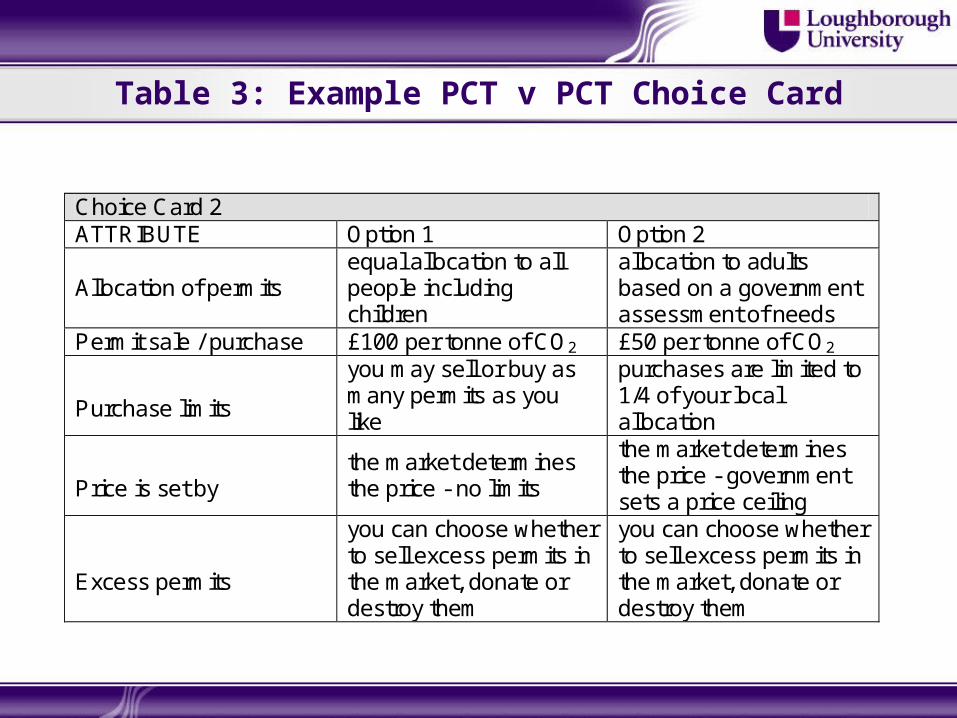
Table 3: Example PCT v PCT Choice Card
1
Choice Card 2 ATTRIBUTE Option 1 Option 2
Allocation of permits equal allocation to all people including children
allocation to adults based on a government assessment of needs
Permit sale / purchase £100 per tonne of CO2 £50 per tonne of CO2
Purchase limits
you may sell or buy as many permits as you like
purchases are limited to 1/4 of your local allocation
Price is set by
the market determines the price - no limits
the market determines the price - government sets a price ceiling
Excess permits
you can choose whether to sell excess permits in the market, donate or destroy them
you can choose whether to sell excess permits in the market, donate or destroy them
2

Table 4: Preferred Model
Permit Allocation Coefficient t statEqual Allocation to all including children BASE
Equal Allocation to all adults and children get 40% of adult allocation
n.s.
Equal Allocation to all adults, no allocation to Children -0.172 2.7
Allocation According to current levels of consumption n.s.Equal allocation to all with extra permits for those with greater need, for example, living in rural area, poor housing or disability
0.350 3.4
Equal allocation to all households n.s.Allocation to adults based on a Government. assessment of needs
-0.289 2.8
Equal allocation. to all but additional financial support for those with greater need, for example, living in rural area, poor housing or disability
n.s.

Model
Transactions Coefficient t stat
Payments-as now. Automatic updating of carbon account
BASE
Payments-additional transaction. Needs authorisation of carbon movement in and out of account
n.s.
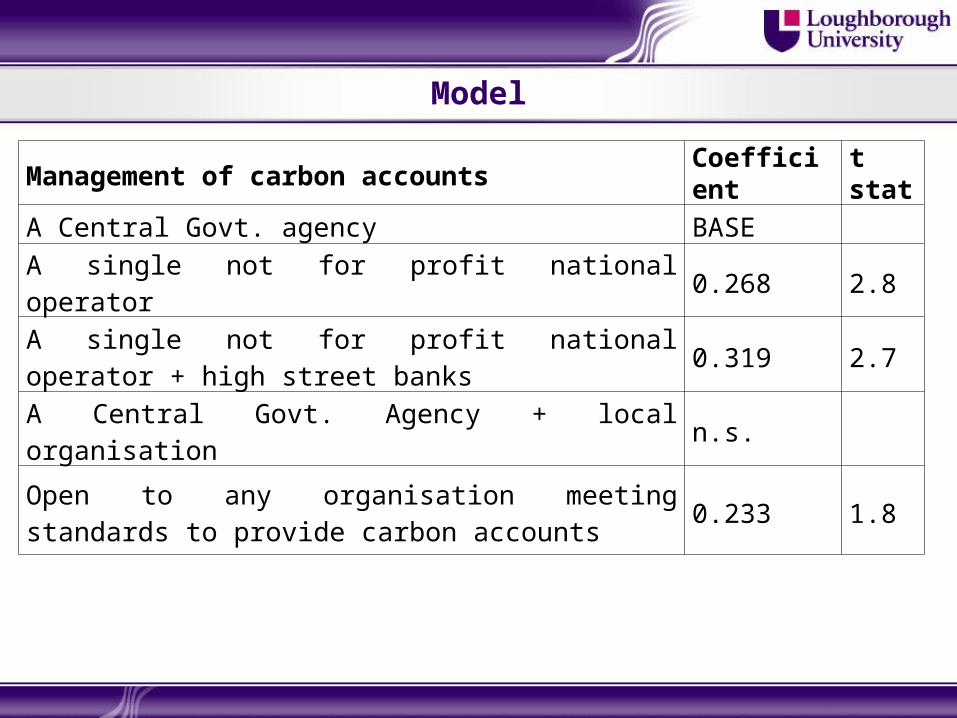
Model
Management of carbon accounts Coefficient t stat
A Central Govt. agency BASE
A single not for profit national operator 0.268 2.8
A single not for profit national operator + high street banks
0.319 2.7
A Central Govt. Agency + local organisation n.s.
Open to any organisation meeting standards to provide carbon accounts
0.233 1.8

Model
Excess Permits Coefficient t statYou can choose whether to sell excess permits in the market, donate or destroy them
BASE
Excess permits must be sold in the market-0.145 2.5
Excess permits may be sold privately to whoever you wish n.s.Excess permits must be sold in the market or donated to charity -0.182 1.9
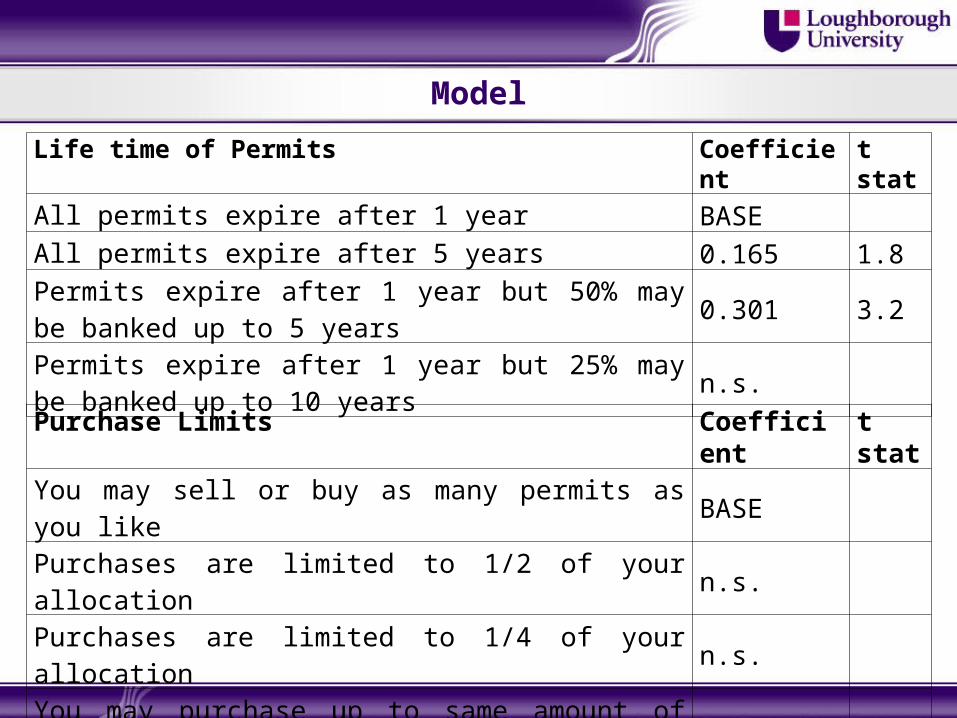
Model
Life time of Permits Coefficient t stat
All permits expire after 1 year BASE
All permits expire after 5 years 0.165 1.8
Permits expire after 1 year but 50% may be banked up to 5 years
0.301 3.2
Permits expire after 1 year but 25% may be banked up to 10 years
n.s.
Purchase Limits Coefficient t statYou may sell or buy as many permits as you like BASE
Purchases are limited to 1/2 of your allocation n.s.
Purchases are limited to 1/4 of your allocation n.s.
You may purchase up to same amount of your original allocation
0.402 2.7

Model
Market Operation Coefficient t stat
The market determines the price - no limits BASE
Govt. Sets the price of permits on an annual basis 0.242 3.8
The market determines the price and government sets a price ceiling
n.s.
Scope of the scheme
Home energy + all transport use, car, public transport and air travel BASE
Home and private car use only n.s.
Home, private car and air transport. n.s.
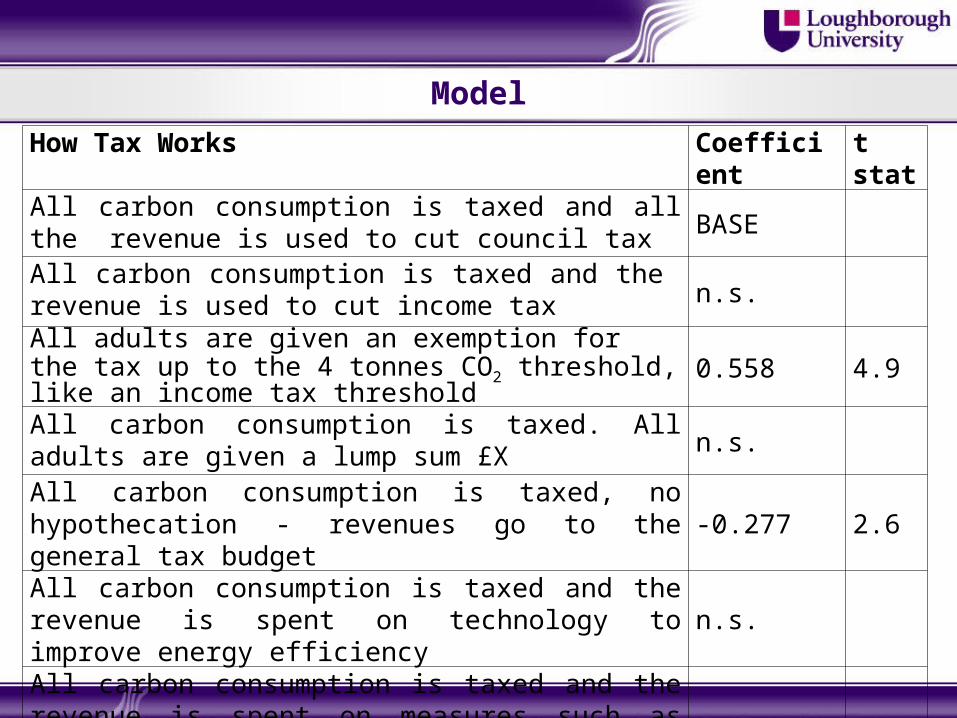
Model
How Tax Works Coefficient t statAll carbon consumption is taxed and all the revenue is used to cut council tax BASE
All carbon consumption is taxed and the revenue is used to cut income tax n.s.
All adults are given an exemption for the tax up to the 4 tonnes CO2 threshold, like an income tax threshold 0.558 4.9
All carbon consumption is taxed. All adults are given a lump sum £X n.s.
All carbon consumption is taxed, no hypothecation - revenues go to the general tax budget -0.277 2.6
All carbon consumption is taxed and the revenue is spent on technology to improve energy efficiency n.s.
All carbon consumption is taxed and the revenue is spent on measures such as more public transport to make it easier to change individuals behaviour
0.454 4.2

Model
Permit Sale and Purchase Coefficient t statPCT (COST) if CF more than 4 tonnes -0.000204 5.3PCT (COST if CF less than 4 tonnes n.s.CT (COST) -0.000398 6.2CT_LCF (COST) when ‘all adults are given a lump sum £X’ n.s.
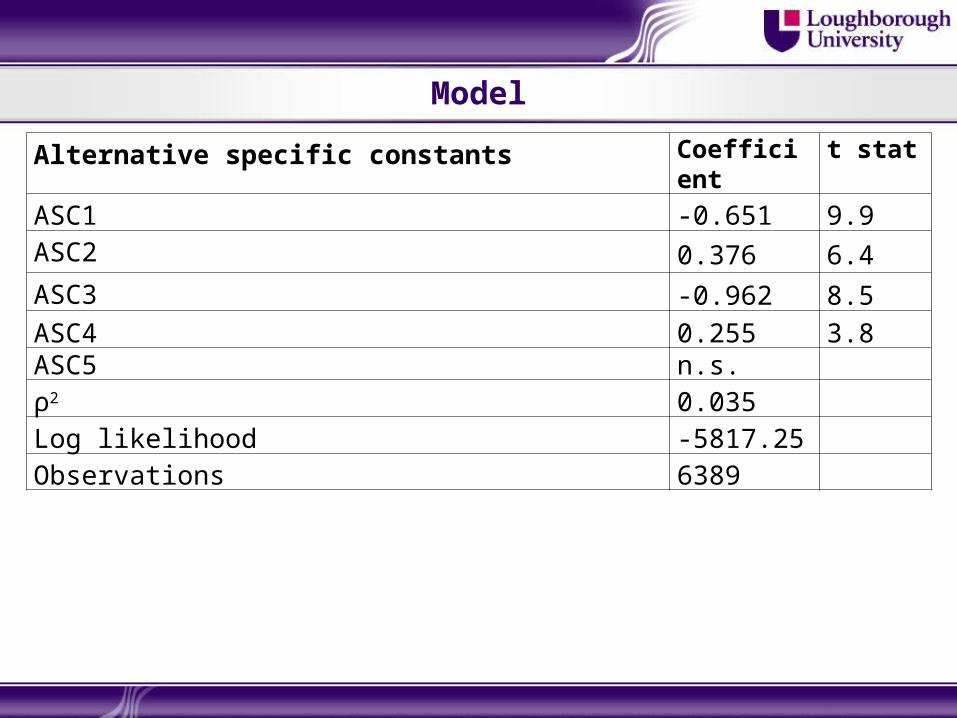
Model
Alternative specific constants Coefficient t stat
ASC1 -0.651 9.9ASC2 0.376 6.4
ASC3 -0.962 8.5
ASC4 0.255 3.8ASC5 n.s.ρ2 0.035Log likelihood -5817.25Observations 6389

Forecasting: example
Equal allocation adult and children + no limits on purchase + market determined price + choice in disposal of permits = 59% acceptance
Change one factor to: government sets price = 65% acceptance
Change another factor to purchase limit is allowance level= 73% acceptance
Change another factor to extra permits allocated to those in need= 80% acceptance
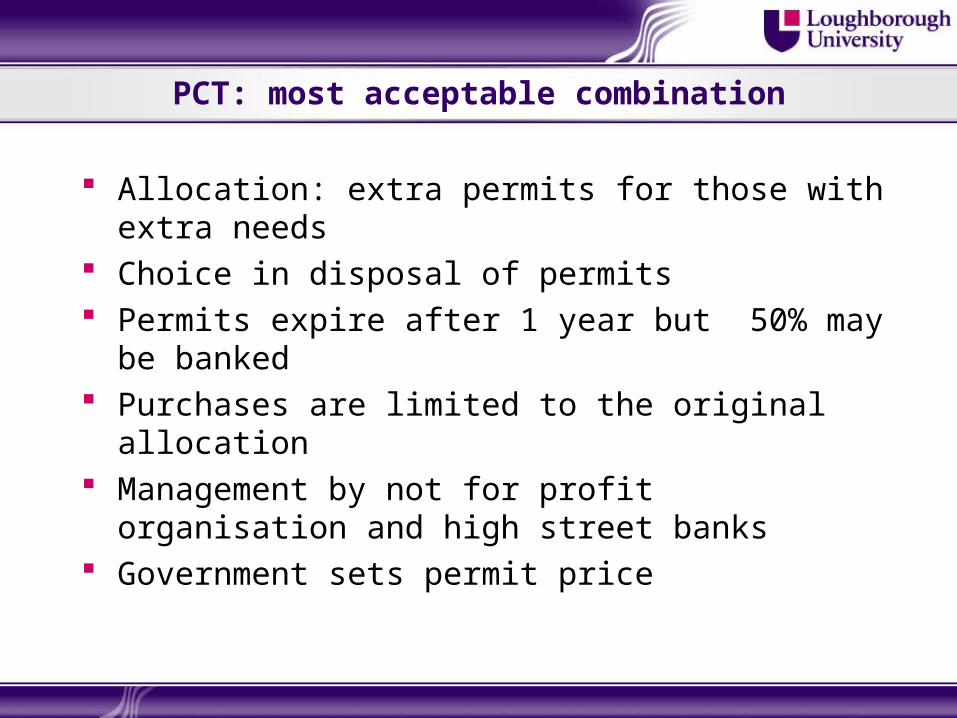
PCT: most acceptable combination
Allocation: extra permits for those with extra needs Choice in disposal of permits Permits expire after 1 year but 50% may be banked Purchases are limited to the original allocation Management by not for profit organisation and high
street banks Government sets permit price

Carbon Tax
What happens to the revenues? Least preferred: no hypothecation Two preferred options:
Revenue is spent on measures to support behavioural change
Threshold exemption (like income tax)

Potential Behavioural Response
There is even less evidence on potential behavioural response – partly due to the challenges in designing effective experiments.
The five studies that have examined behaviour are all quite different making comparison difficult.
Therefore, the focus here is on our study in Cardiff and the South East – allowance is 4 tonnes CO2
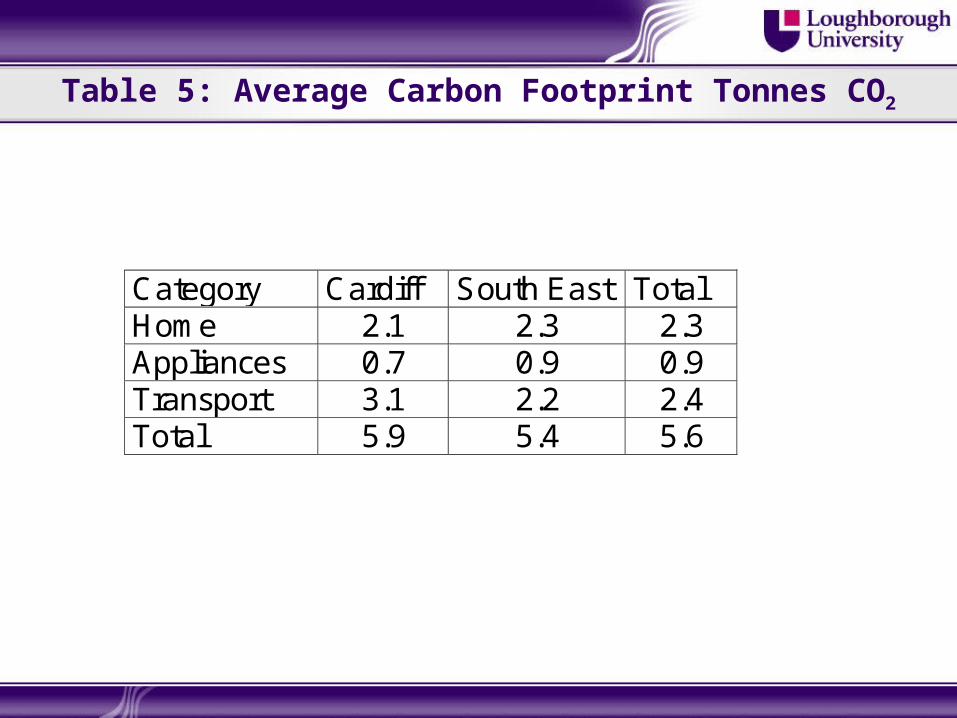
Table 5: Average Carbon Footprint Tonnes CO2
Category Cardiff South East Total Home 2.1 2.3 2.3 Appliances 0.7 0.9 0.9 Transport 3.1 2.2 2.4 Total 5.9 5.4 5.6
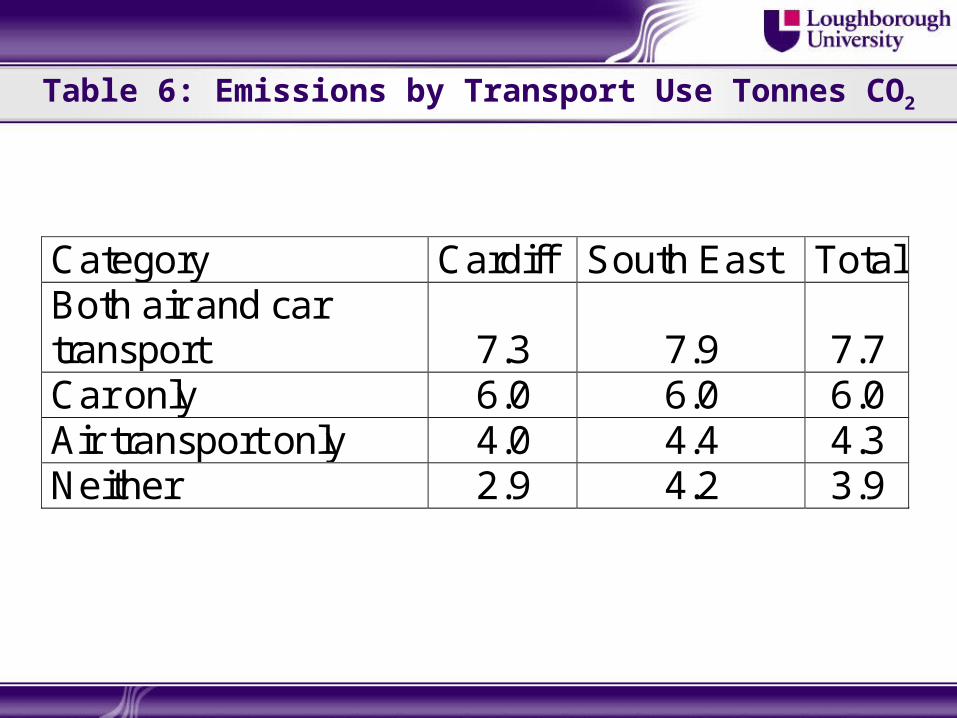
Table 6: Emissions by Transport Use Tonnes CO2
Category Cardiff South East Total Both air and car transport
7.3
7.9 7.7
Car only 6.0 6.0 6.0 Air transport only 4.0 4.4 4.3 Neither 2.9 4.2 3.9
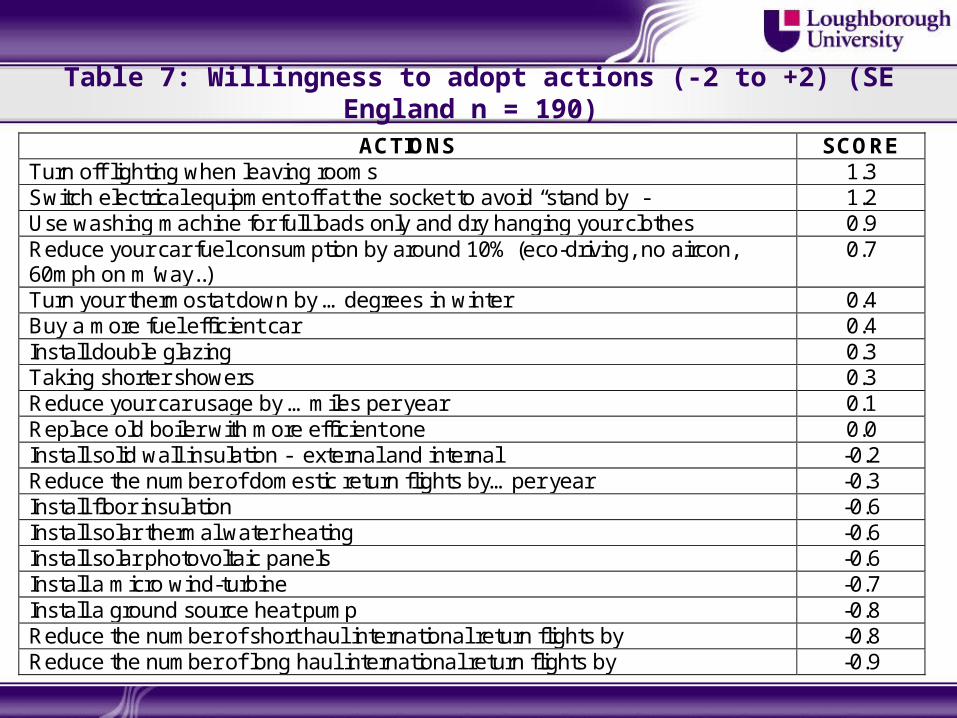
Table 7: Willingness to adopt actions (-2 to +2) (SE England n = 190)
ACTIONS SCORE Turn off lighting when leaving rooms 1.3 Switch electrical equipment off at the socket to avoid “stand by” - 1.2 Use washing machine for full loads only and dry hanging your clothes 0.9 Reduce your car fuel consumption by around 10% (eco-driving, no aircon, 60mph on m’way..)
0.7
Turn your thermostat down by …degrees in winter 0.4 Buy a more fuel efficient car 0.4 Install double glazing 0.3 Taking shorter showers 0.3 Reduce your car usage by …miles per year 0.1 Replace old boiler with more efficient one 0.0 Install solid wall insulation - external and internal -0.2 Reduce the number of domestic return flights by…per year -0.3 Install floor insulation -0.6 Install solar thermal water heating -0.6 Install solar photovoltaic panels -0.6 Install a micro wind-turbine -0.7 Install a ground source heat pump -0.8 Reduce the number of short haul international return flights by -0.8 Reduce the number of long haul international return flights by -0.9
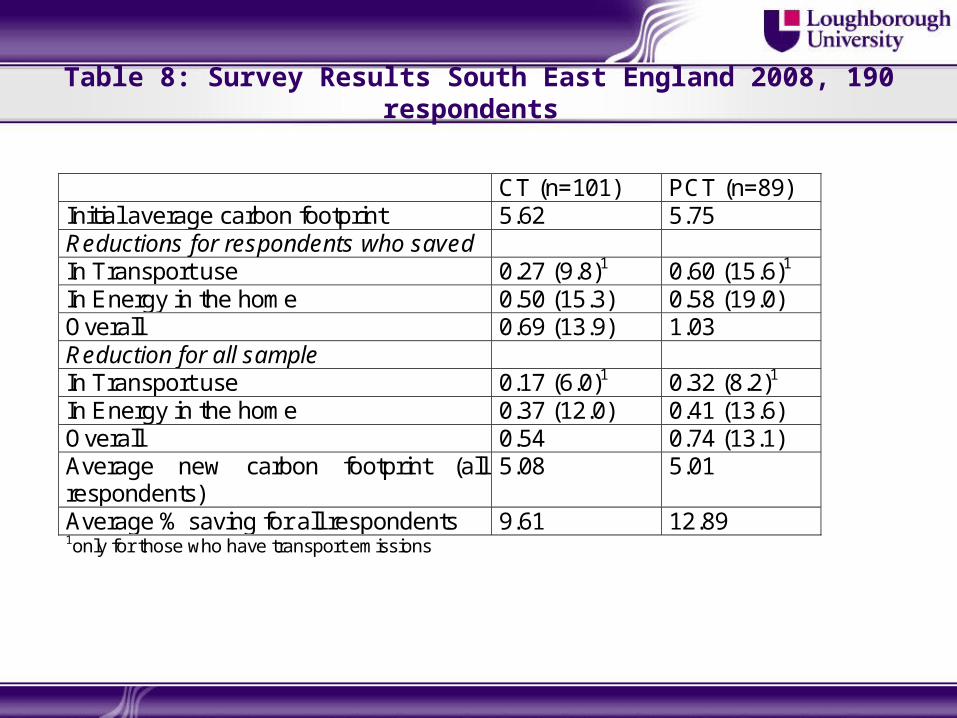
Table 8: Survey Results South East England 2008, 190 respondents
CT (n=101) PCT (n=89) Initial average carbon footprint 5.62 5.75 Reductions for respondents who saved In Transport use 0.27 (9.8)1 0.60 (15.6)1 In Energy in the home 0.50 (15.3) 0.58 (19.0) Overall 0.69 (13.9) 1.03 Reduction for all sample In Transport use 0.17 (6.0)1 0.32 (8.2)1 In Energy in the home 0.37 (12.0) 0.41 (13.6) Overall 0.54 0.74 (13.1) Average new carbon footprint (all respondents)
5.08 5.01
Average % saving for all respondents 9.61 12.89 1only for those who have transport emissions
Behaviour
People are willing to do the easy, marginal actions Reluctant to consider new technologies for
heating/lighting Very reluctant to give up international flights 10-13% reductions in emissions across the sample
from an hypothetical first round of implementation.

Conclusions
Acceptability Innovative approaches such as a PCT or CT with
revenue recycling or rebates may be acceptable. Good design can improve acceptability – key
issues for PCT are the initial allocation of permits; choice in disposal; limits on purchases and lifespan and management.
Preferred use of revenues for tax is either to provide a threshold exemption or measures to support behavioural change.
It is critical to remember that in the early years of a PCT many would benefit financially.
Conclusions
Behavioural response A willingness to do the easy carbon reduction
actions A reluctance to invest in unfamiliar energy
provision A real reluctance to give up international flights Hypothetical implementation: 10 to 13% reduction
in emissions With respect to the theoretical argument that PCT
could generate higher savings than a policy that was solely based on a price signal. To date no real evidence to support or refute this
argument.
Conclusions
Future Research Further systematic exploration of preferences for
PCT design with larger samples; Examination of the role of framing and discussion
in influencing response; Simulation of dynamic settings for trading and
behavioural change over time.

References Bird J., Jones N. and Lockwood M., (2009). Political acceptability of personal carbon trading:
Findings from primary research. Institute for Public Policy Research, London. Bristow A.L., Wardman M., Zanni A. and Chintakayala V.P.K. (2010) Public acceptability of
personal carbon trading and carbon tax, Ecological Economics. 69(9) 1824-1837. Capstick S.B. and Lewis A. (2010) Effects of personal carbon allowances on decision-
making: evidence from an experimental simulation, Climate Policy 10(4) 369-384. Capstick S. and Lewis A. (2009) Personal Carbon Allowances: A Pilot Simulation and
Questionnaire. UKERC Report. Energy Saving Trust, 2007. Green barometer: Measuring environmental attitude, April 2007,
London EST. http://www.energysavingtrust.org.uk/uploads/documents/aboutest/Green-Barometer-Web(spread).pdf (accessed 6th March 2009)
Harwatt H., (2008) Tradable Carbon Permits; their potential to reduce CO2 emissions from the transport sector. PhD Thesis, Institute for Transport Studies, University of Leeds.
Howell R. (2008) What can we learn from opinion research and focus groups? Presentation at the workshop Personal carbon trading (PCT) bringing together the research community 27th-28th November 2008, UKERC, Oxford. http://www.ukerc.ac.uk/TheMeetingPlace/Past%20Activities/Activities2008/0811PCT.aspx
Jagers S.C., Löfgren A. and Stripple J. (2010) Attitudes to personal carbon allowances: political trust, fairness and ideology, Climate Policy 10(4) 410-431.
References (2)
Owen L., Edgar L., Prince S. and Doble C., (2008) personal carbon trading: Public Acceptability: A report to the Department for Environment, Food and Rural Affairs. Opinion Leader and Enviros Consulting. Defra London. http://www.defra.gov.uk/environment/climatechange/uk/individual/carbontrading/pdf/pct-public-acceptability.pdf
Parag, Y., Strickland, D. and Capstick, S., (2009) Judge a book by its cover: the impact of policy framing on the willingness to reduce energy consumption. Paper presented at European Conference on Energy Efficiency and Behaviour, Maastricht, 18-20 October
Von Knobelsdorff M. (2008) Public Acceptability of Personal Carbon Trading, Masters Dissertation, University of Cambridge
Wallace A. (2009) Reducing carbon Emissions by Households: The Effects of Footprinting and Personal Allowances. PhD thesis, De Montfort University, Leicester.
Wallace A.A., Irvine K.N., Wright A. and Fleming P.D. (2010) Public attitudes to personal carbon allowances: findings from a mixed method study, Climate Policy 10(4) 385-409.
YouGov, (2006a). Daily Telegraph Survey Results http://www.yougov.co.uk/extranets/ygarchives/content/pdf/TEL060101021_1.pdf (accessed 6th march 2009).
YouGov (2006b) Carbon, prepared by YouGov plc on behalf of RSA. Zanni, A. M. and Bristow, A. L., (2009) Exploring the potential impact of personal carbon trading
and carbon tax schemes on personal transport and domestic energy usage. Paper presented at 17th Annual Conference of the European Association of Environmental and Resource Economists, Amsterdam, The Netherlands, 24-27 June.