Embed Size (px)
Citation preview
Personal and confidential. All logos and product images are the property of their respective companies.
Steve HollandDivision CEO – BEST CROSSMARK
• Who CROSSMARK is
• Joint problem in Manufacturing and Retail
• How CROSSMARK understands the issue
• How CROSSMARK solved the issue
• Questions
Overview
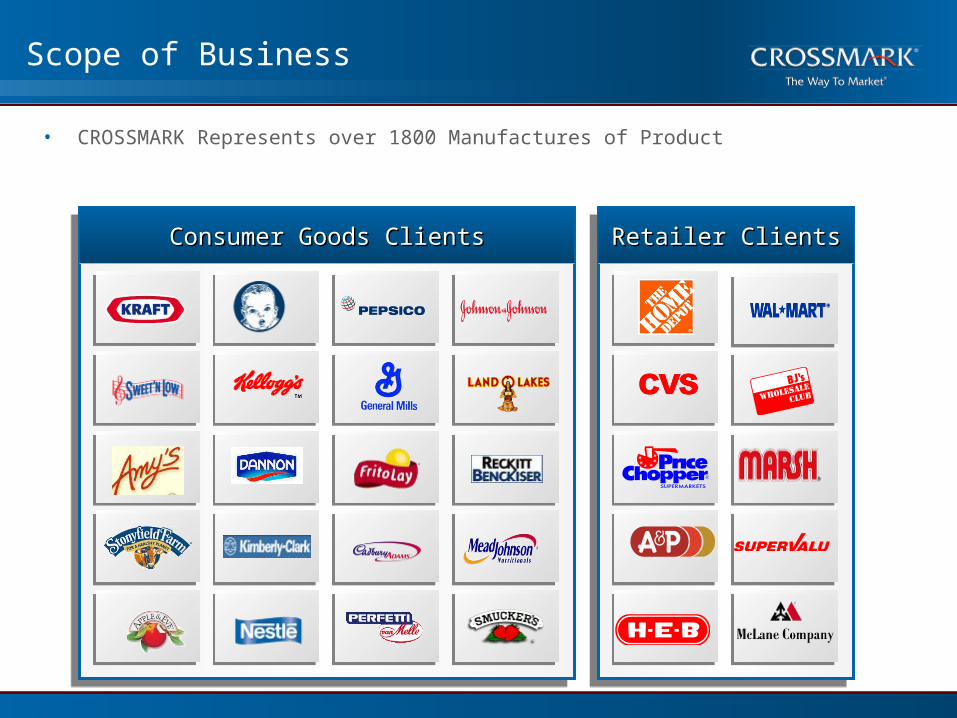
Scope of Business
• CROSSMARK Represents over 1800 Manufactures of Product
Consumer Goods Clients Retailer ClientsConsumer Goods ClientsConsumer Goods Clients Retailer ClientsRetailer Clients
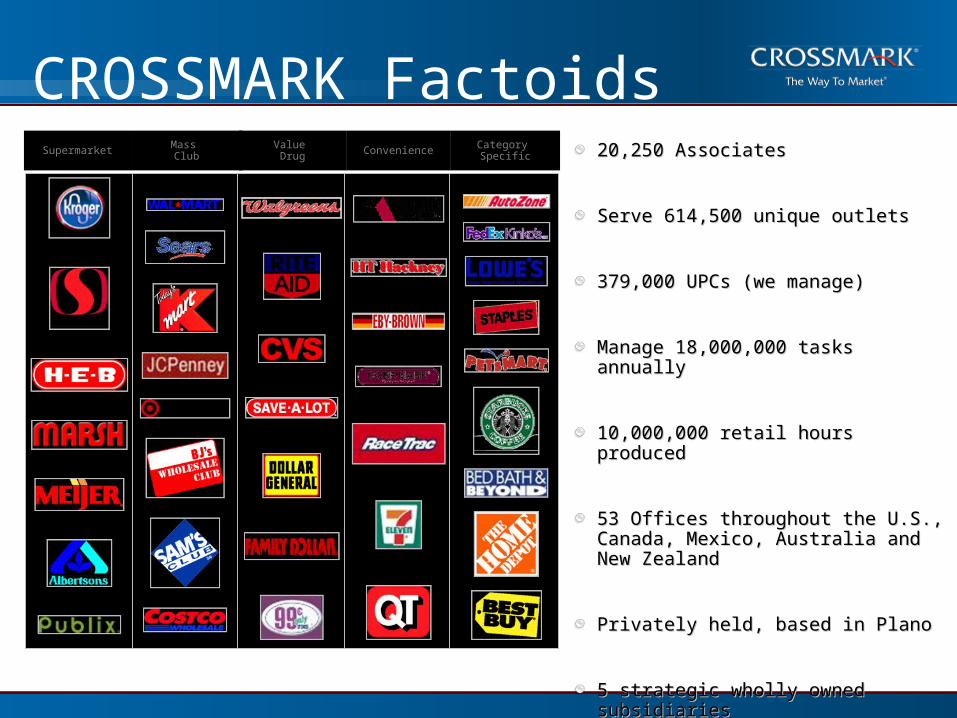
CROSSMARK Factoids20,250 Associates 20,250 Associates
Serve 614,500 unique outletsServe 614,500 unique outlets
379,000 UPCs (we manage)379,000 UPCs (we manage)
Manage 18,000,000 tasks annuallyManage 18,000,000 tasks annually
10,000,000 retail hours produced10,000,000 retail hours produced
53 Offices throughout the U.S., 53 Offices throughout the U.S., Canada, Mexico, Australia and New Canada, Mexico, Australia and New ZealandZealand
Privately held, based in PlanoPrivately held, based in Plano
5 strategic wholly owned subsidiaries5 strategic wholly owned subsidiaries
Category SpecificConvenienceValue
DrugMass ClubSupermarket
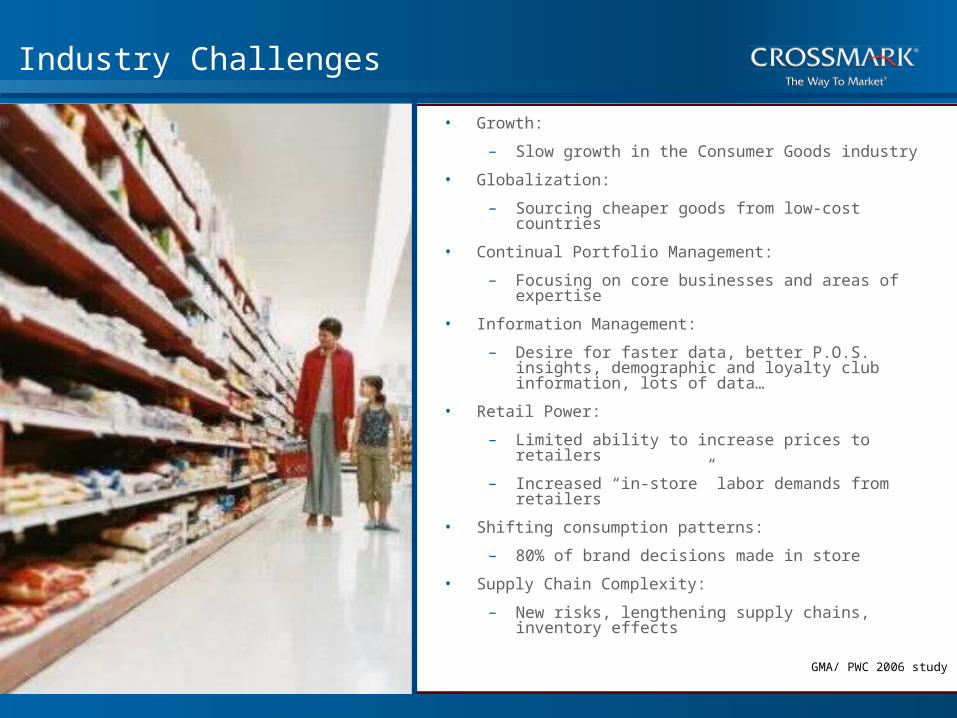
Industry Challenges
• Growth:
– Slow growth in the Consumer Goods industry
• Globalization:
– Sourcing cheaper goods from low-cost countries
• Continual Portfolio Management:
– Focusing on core businesses and areas of expertise
• Information Management:
– Desire for faster data, better P.O.S. insights, demographic and loyalty club information, lots of data…
• Retail Power:
– Limited ability to increase prices to retailers
– Increased “in-store” labor demands from retailers
• Shifting consumption patterns:
– 80% of brand decisions made in store
• Supply Chain Complexity:
– New risks, lengthening supply chains, inventory effects
GMA/ PWC 2006 study
6
What does CROSSMARK need?
1) A way to achieve the cost of doing business
2) A way to create consistency in reporting
3) A way to create a more sophisticated analytic offering
4) A way to enable enable Account Executives with marketplace data
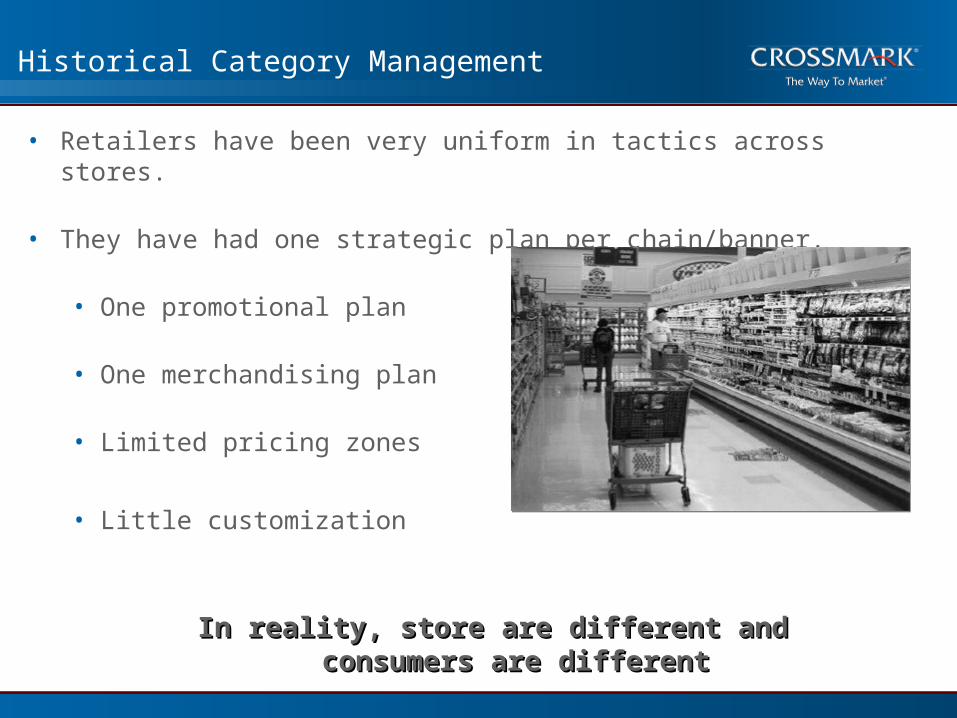
Historical Category Management
• Retailers have been very uniform in tactics across stores.
• They have had one strategic plan per chain/banner.
• One promotional plan
• One merchandising plan
• Limited pricing zones
• Little customization
In reality, store are different and In reality, store are different and consumers are differentconsumers are different
• Success for retailers now hinges on their ability to cater to local differences
• Smart retailers are starting to customize their offerings to local markets, rolling out different types of stores, product lines, and alternative approaches to pricing, marketing, staffing, and customer service.
• Retailers are moving from standardization to localization.
Retailer Situation
Source: Darrell K. Rigby and Vijay Vishwanath Harvard Business Review
What is CROSSMARK StoreView?
• CROSSMARK StoreView is the latest technology around Store Level data
• This database is custom to CROSSMARK
– Scanner facts such as dollars and units as well as causal facts like base and incremental drive detailed analytics
– Additional insights such as the Relative Threat Index (RTI) are unique to CROSSMARK, measuring the effect of demographics and actual sales by store, by week
• CROSSMARK StoreView gives the client a comprehensive look into in-store conditions
StoreView
It’s all about the store
• CROSSMARK StoreView and Homescan allow the client to understand how shoppers purchase in stores
• Insights into the shopping environment give the retailer invaluable information
• Tactics tailored to the store driven on consumer trends create bankable results
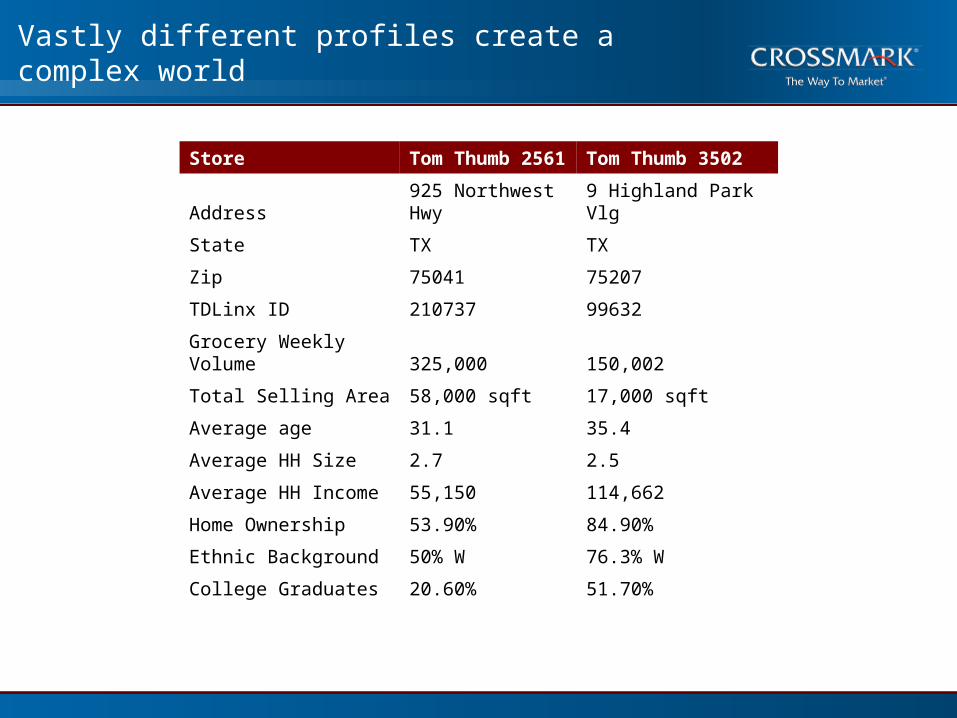
Store Tom Thumb 2561 Tom Thumb 3502
Address925 Northwest Hwy 9 Highland Park Vlg
State TX TX
Zip 75041 75207
TDLinx ID 210737 99632
Grocery Weekly Volume 325,000 150,002
Total Selling Area 58,000 sqft 17,000 sqft
Average age 31.1 35.4
Average HH Size 2.7 2.5
Average HH Income 55,150 114,662
Home Ownership 53.90% 84.90%
Ethnic Background 50% W 76.3% W
College Graduates 20.60% 51.70%
Vastly different profiles create a complex world
12
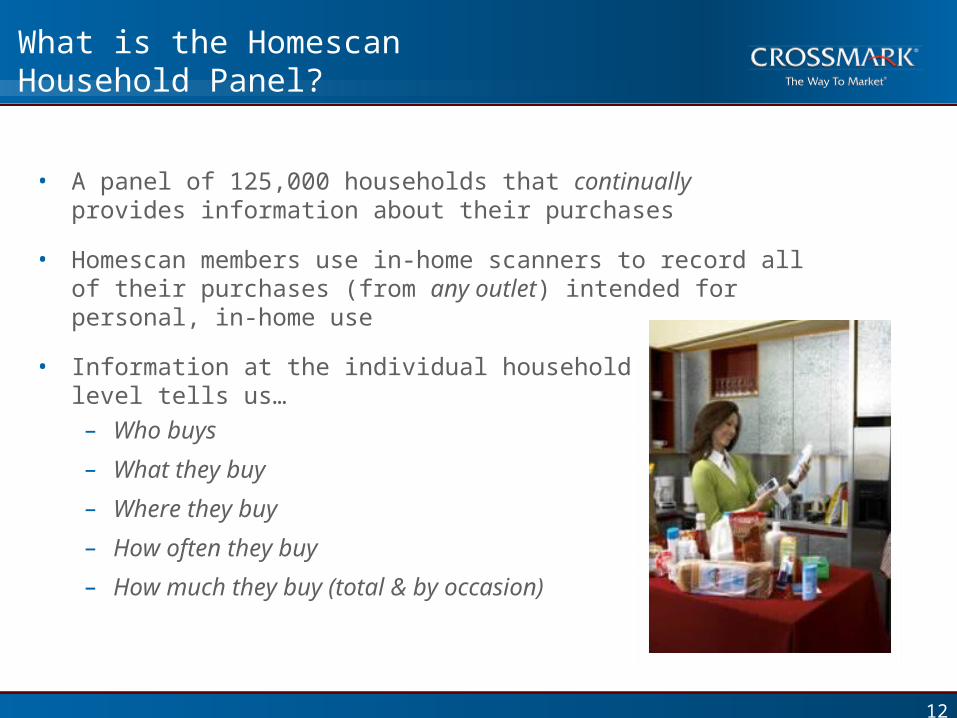
What is the Homescan Household Panel?
• A panel of 125,000 households that continually provides information about their purchases
• Homescan members use in-home scanners to record all of their purchases (from any outlet) intended for personal, in-home use
• Information at the individual household level tells us…– Who buys
– What they buy
– Where they buy
– How often they buy
– How much they buy (total & by occasion)
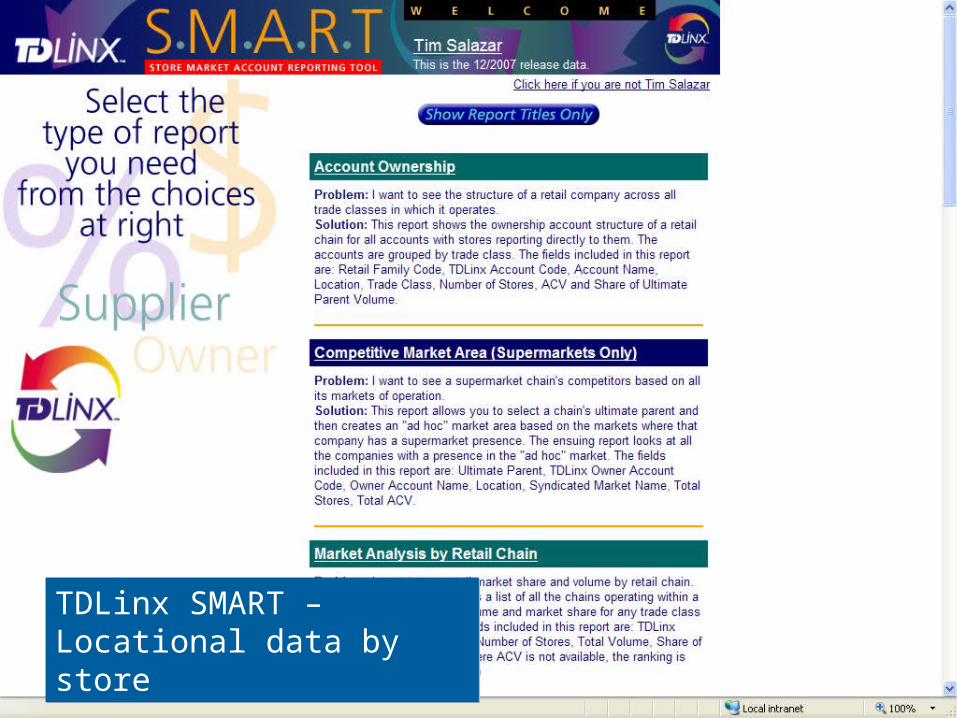
TDLinx SMART – Locational data by storeTDLinx SMART – Locational data by store
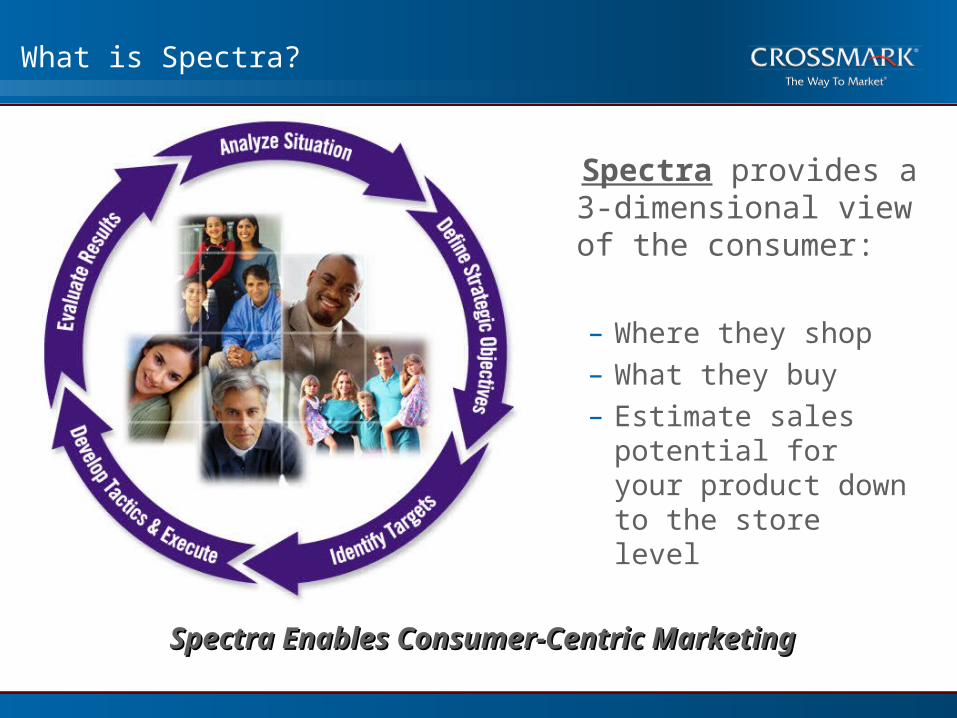
What is Spectra?
Spectra provides a 3-dimensional view of the consumer:
– Where they shop– What they buy– Estimate sales
potential for your product down to the store level
Spectra Enables Consumer-Centric MarketingSpectra Enables Consumer-Centric Marketing
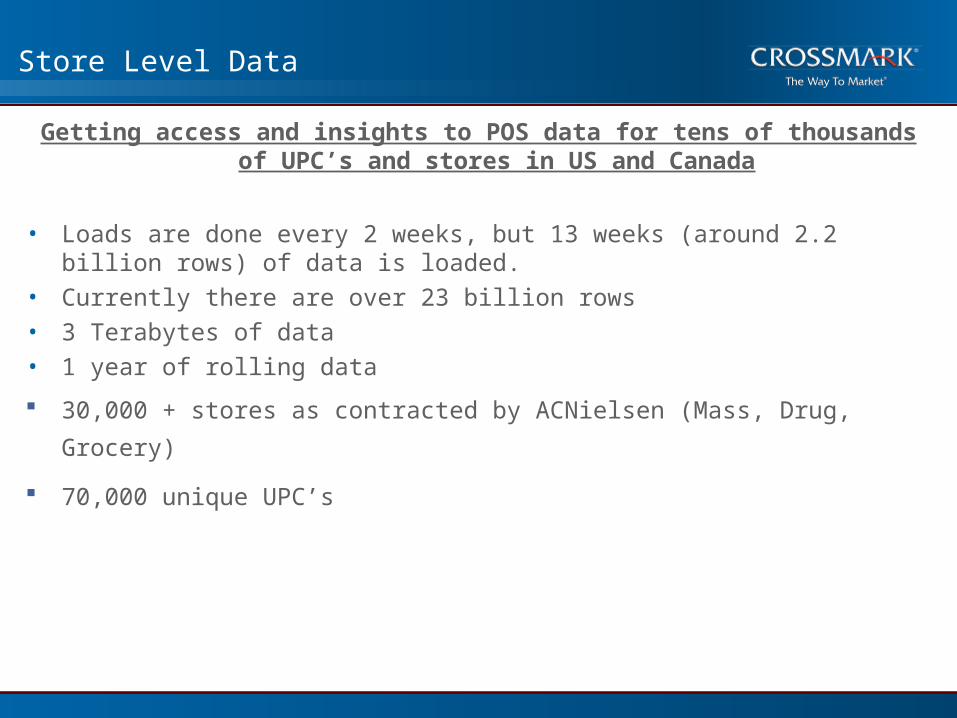
Store Level Data
Getting access and insights to POS data for tens of thousands of UPC’s and stores in US and Canada
• Loads are done every 2 weeks, but 13 weeks (around 2.2 billion rows) of data is loaded.
• Currently there are over 23 billion rows• 3 Terabytes of data• 1 year of rolling data
30,000 + stores as contracted by ACNielsen (Mass, Drug, Grocery)
70,000 unique UPC’s
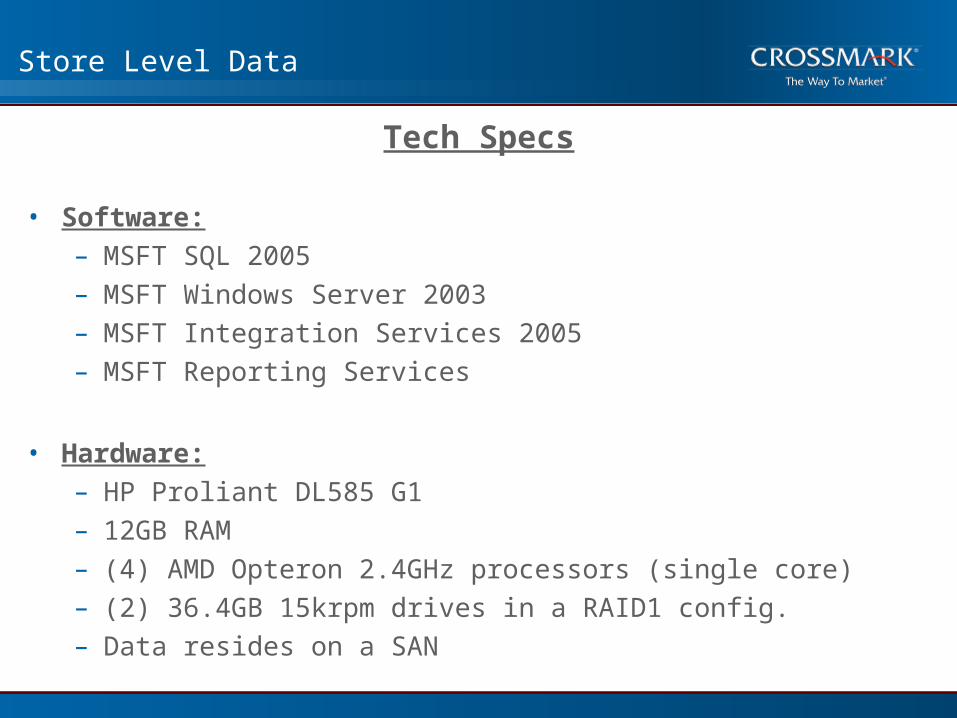
Store Level Data
Tech Specs
• Software:– MSFT SQL 2005– MSFT Windows Server 2003– MSFT Integration Services 2005– MSFT Reporting Services
• Hardware:– HP Proliant DL585 G1– 12GB RAM– (4) AMD Opteron 2.4GHz processors (single core)– (2) 36.4GB 15krpm drives in a RAID1 config.– Data resides on a SAN
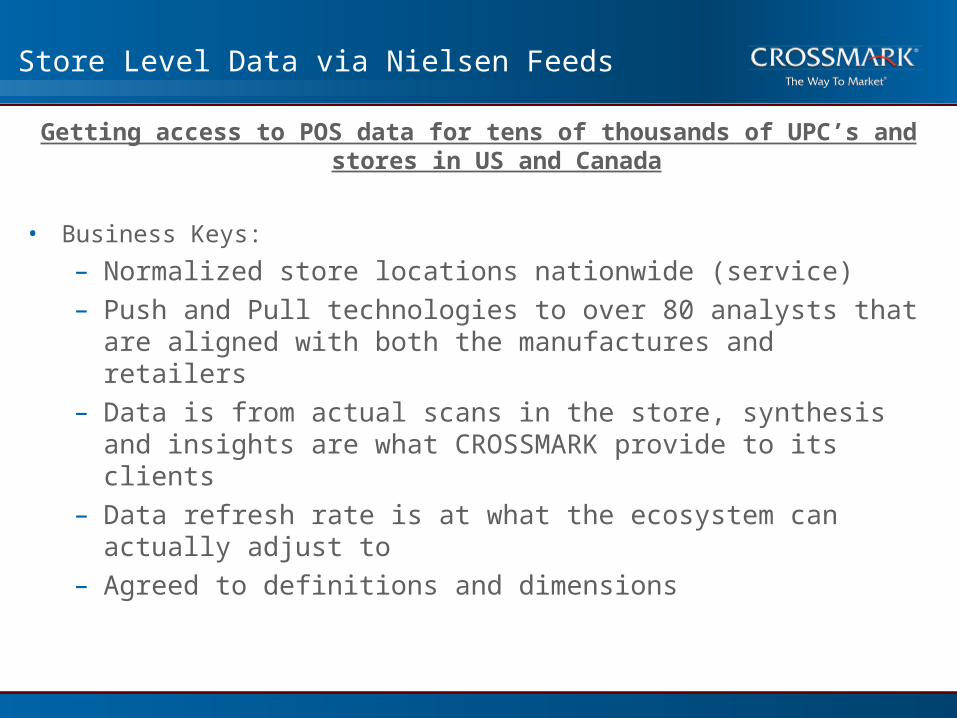
Store Level Data via Nielsen Feeds
Getting access to POS data for tens of thousands of UPC’s and stores in US and Canada
• Business Keys:
– Normalized store locations nationwide (service)– Push and Pull technologies to over 80 analysts that are
aligned with both the manufactures and retailers – Data is from actual scans in the store, synthesis and insights
are what CROSSMARK provide to its clients– Data refresh rate is at what the ecosystem can actually
adjust to– Agreed to definitions and dimensions
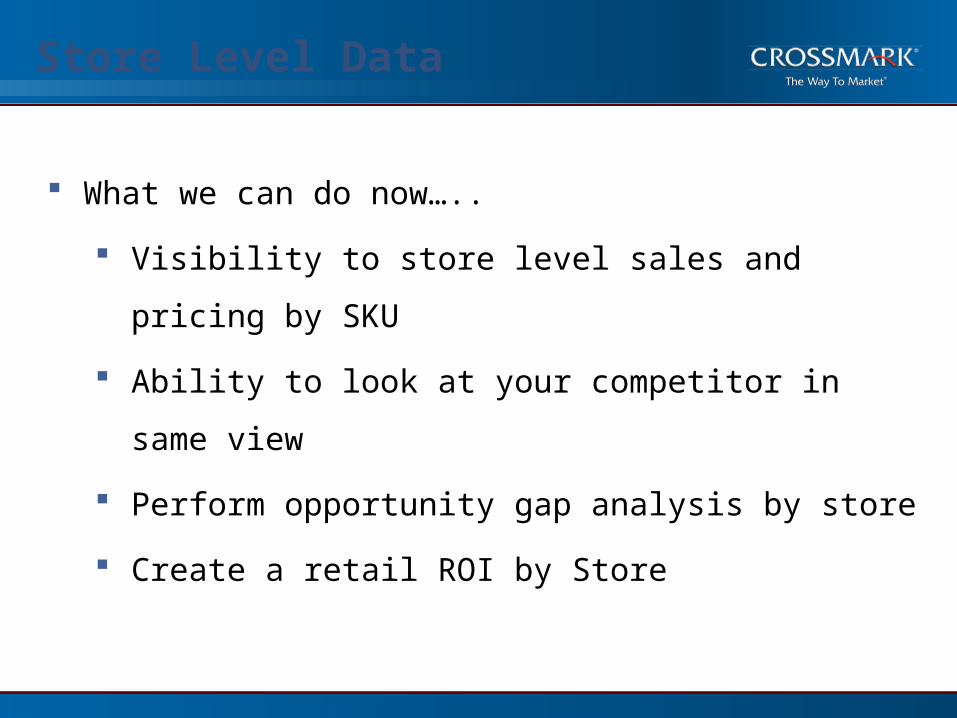
Store Level Data
What we can do now…..
Visibility to store level sales and pricing by SKU
Ability to look at your competitor in same view
Perform opportunity gap analysis by store
Create a retail ROI by Store
19All logos and product images are the property of their respective companies
Questions ????Questions ????