Embed Size (px)
Citation preview
University of Washington • School of Medicine • Department of Family MedicineBox 354982 • Seattle WA 98195-4982 • phone: (206) 685-0402 • fax: (206) 616-4768 • http://depts.washington.edu/uwrhrc/
The WWAMI RHRC receives its core funding from the Health Resources and Services Administration’s Office of Rural Health Policy.
Policy Brief • September 2009
Persistent Primary Care Health Professional Shortage Areas (HPSAs) and Health Care Access in Rural America
Mark P. Doescher, Meredith A. Fordyce, Susan M. Skillman, J. Elizabeth Jackson, Roger A. Rosenblatt
IssuesCongress passed the Health Professions Educational Assistance Act of 1976 to address the crisis in primary care supply in rural and inner-city locations of the United States. This legislation created primary care Health Professional Service Areas (HPSAs), which help states and communities increase their primary care supply through eligibility for loan repayment, technical assistance, increased reimbursement through Medicare, Federally Qualified Health Center (FQHC), and Rural Health Clinic designation. This study examines the degree to which persistence of primary care HPSA designation in rural counties is associated with lower population socioeconomic status and deficiencies in access to health care services.
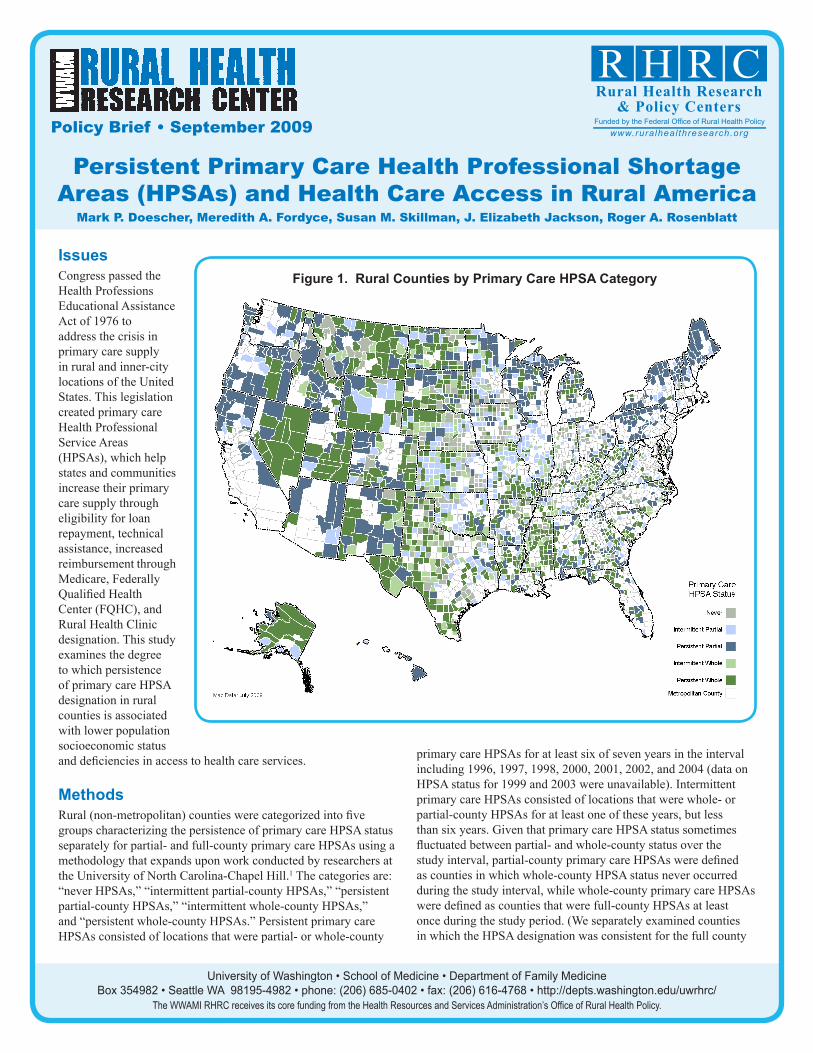
MethodsRural (non-metropolitan) counties were categorized into five groups characterizing the persistence of primary care HPSA status separately for partial- and full-county primary care HPSAs using a methodology that expands upon work conducted by researchers at the University of North Carolina-Chapel Hill.1 The categories are: “never HPSAs,” “intermittent partial-county HPSAs,” “persistent partial-county HPSAs,” “intermittent whole-county HPSAs,” and “persistent whole-county HPSAs.” Persistent primary care HPSAs consisted of locations that were partial- or whole-county
primary care HPSAs for at least six of seven years in the interval including 1996, 1997, 1998, 2000, 2001, 2002, and 2004 (data on HPSA status for 1999 and 2003 were unavailable). Intermittent primary care HPSAs consisted of locations that were whole- or partial-county HPSAs for at least one of these years, but less than six years. Given that primary care HPSA status sometimes fluctuated between partial- and whole-county status over the study interval, partial-county primary care HPSAs were defined as counties in which whole-county HPSA status never occurred during the study interval, while whole-county primary care HPSAs were defined as counties that were full-county HPSAs at least once during the study period. (We separately examined counties in which the HPSA designation was consistent for the full county
Figure 1. Rural Counties by Primary Care HPSA Category

Policy Brief • September 2009, continued
and counties in which the designation fluctuated between partial- and full-county status. These groups were combined because their sociodemographic profiles were nearly identical. Additional information regarding the classification scheme is available upon request.)
American Medical Association and American Osteopathic Association Masterfile data from 2005 and 2004 Census estimates were used to identify the per capita supply of clinically active, non-resident, non-federally employed physicians aged 74 or younger whose primary care specialty was family medicine/general practice, general internal medicine, general pediatrics, or obstetrics-gynecology. Data from the 2004-5 Behavioral Risk Factor Surveillance System (BRFSS), an annual survey of U.S. adults, were used to examine several measures of health care access.2 Rural county characteristics were identified using 2004 Economic Research Service (ERS) policy type county typology codes.3 County HPSA status came from HRSA Area Resource Files.
EvidenceDistribution of Counties by Primary Care HPSA Categoryn Of 2,051 U.S. rural counties in 2005, 1,743 (85%) were primary care HPSAs at least once during the study interval. There were 308 (15.0% of all rural counties) “never” HPSAs, 370 (18.0%) “intermittent partial-county” HPSAs, 490 (23.9%) “persistent partial-county” HPSAs, 195 (9.5%) “intermittent whole-county” HPSAs, and 688 (33.5%) “persistent whole-county” HPSAs. Figure 1 presents a map of U.S. rural counties by these five primary care HPSA categories.
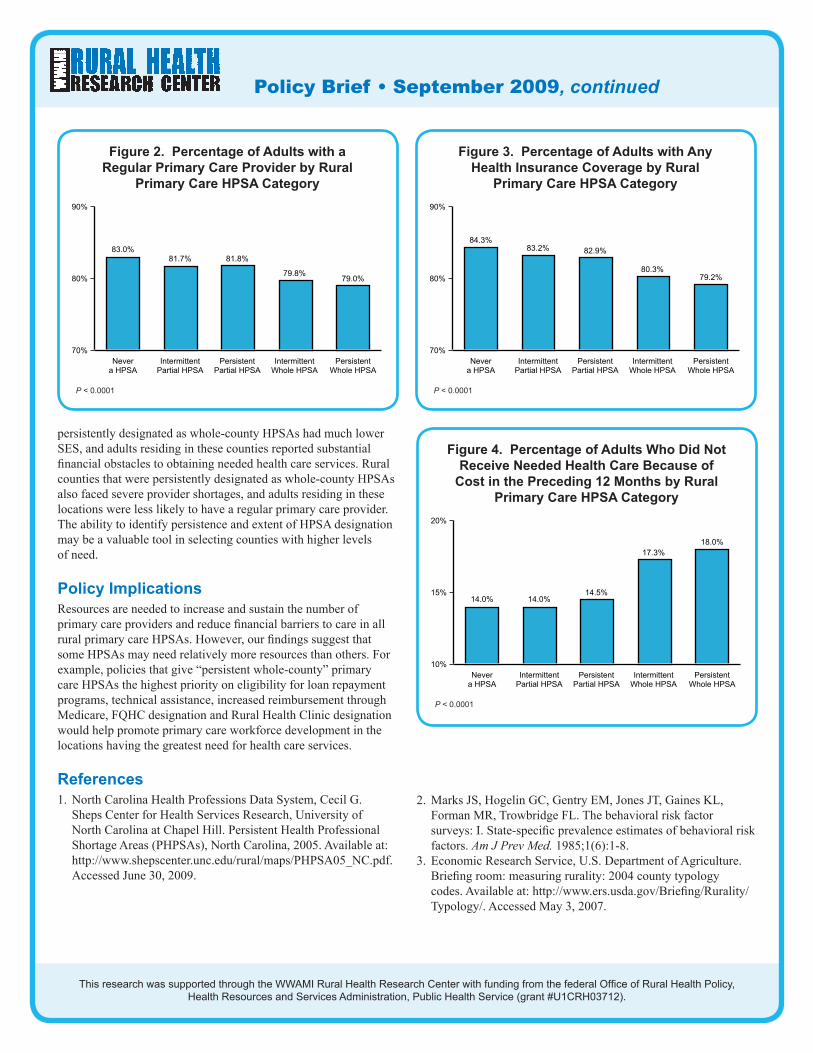
Socioeconomic Profile of Counties by Primary Care HPSA Categoryn A socioeconomic gradient occurred in which socioeconomic status was lowest in “persistent whole-county” primary care HPSAs, while counties never receiving a HPSA designation had the highest socioeconomic status (Table 1). n A racial/ethnic gradient was also observed in which minorities made up the highest percentage of the population in “persistent whole-county” HPSAs, while the fewest minority group members lived in counties never receiving HPSA designation (Table 1). n Population density was lowest in counties receiving a whole-county HPSA designation (Table 1).Access to Health Care by Primary Care HPSA Categoryn Primary care physician supply was lowest in rural counties receiving a whole-county HPSA designation (Table 2).n The percentage of U.S. rural adults with a regular primary care provider was lowest in whole-county primary care HPSAs (Figure 2). n Rural adults in whole-county primary care HPSAs were least likely to have health insurance coverage (Figure 3).n Rural adults in whole-county primary care HPSAs were the most likely to forego needed health care because of its cost (Figure 4).
ConclusionsThis five-level classification of rural counties measuring partial- vs. whole-county persistence of primary care HPSA designation stratifies rural populations by socioeconomic status, race/ethnicity, primary care supply, health insurance uptake and access to needed health care services. Those U.S. rural counties that were
Table 2. Rural Primary Care HPSA Category and Primary Care Physician Supply
County Characteristics Never Intermittent
Partial County
Persistent Partial County
Intermittent Whole County
Persistent Whole County
n = 308 (15.0%) n = 370 (18.0%) n = 490 (23.9%) n = 195 (9.5%) n = 688 (33.5%)
Primary care physicians per 100,000 population
72.3 68.1 69.6 45.1 39.3
Table 1. Characteristics of Rural Counties by Primary Care HPSA Category
County Characteristics Never Intermittent
Partial County
Persistent Partial County
Intermittent Whole County
Persistent Whole County
n = 308 (15.0%) n = 370 (18.0%) n = 490 (23.9%) n = 195 (9.5%) n = 688 (33.5%)
Persistent poverty county 5.8% 7.6% 12.7% 20.0% 28.1%
Low education county 12.0% 15.1% 18.0% 28.2% 38.2%
Low employment county 4.5% 9.2% 18.0% 21.0% 31.8%
Proportion non-white race/ethnicity 11.4% 13.8% 14.4% 16.4% 21.6%
Proportion aged 65 and older 15.1% 15.1% 15.1% 15.8% 14.7%
Population loss county 26.6% 25.7% 17.3% 40.5% 27.6%
Population density 65.1/sq.mi. 67.0/sq.mi. 47.3/sq.mi. 24.7/sq.mi. 24.2/sq.mi.
Policy Brief • September 2009, continued
This research was supported through the WWAMI Rural Health Research Center with funding from the federal Office of Rural Health Policy, Health Resources and Services Administration, Public Health Service (grant #U1CRH03712).
persistently designated as whole-county HPSAs had much lower SES, and adults residing in these counties reported substantial financial obstacles to obtaining needed health care services. Rural counties that were persistently designated as whole-county HPSAs also faced severe provider shortages, and adults residing in these locations were less likely to have a regular primary care provider. The ability to identify persistence and extent of HPSA designation may be a valuable tool in selecting counties with higher levels of need.
Policy ImplicationsResources are needed to increase and sustain the number of primary care providers and reduce financial barriers to care in all rural primary care HPSAs. However, our findings suggest that some HPSAs may need relatively more resources than others. For example, policies that give “persistent whole-county” primary care HPSAs the highest priority on eligibility for loan repayment programs, technical assistance, increased reimbursement through Medicare, FQHC designation and Rural Health Clinic designation would help promote primary care workforce development in the locations having the greatest need for health care services.
References1. North Carolina Health Professions Data System, Cecil G.
Sheps Center for Health Services Research, University of North Carolina at Chapel Hill. Persistent Health Professional Shortage Areas (PHPSAs), North Carolina, 2005. Available at: http://www.shepscenter.unc.edu/rural/maps/PHPSA05_NC.pdf. Accessed June 30, 2009.
2. Marks JS, Hogelin GC, Gentry EM, Jones JT, Gaines KL, Forman MR, Trowbridge FL. The behavioral risk factor surveys: I. State-specific prevalence estimates of behavioral risk factors. Am J Prev Med. 1985;1(6):1-8.
3. Economic Research Service, U.S. Department of Agriculture. Briefing room: measuring rurality: 2004 county typology codes. Available at: http://www.ers.usda.gov/Briefing/Rurality/Typology/. Accessed May 3, 2007.
Figure 2. Percentage of Adults with a Regular Primary Care Provider by Rural
Primary Care HPSA Category
Never
a HPSA
Intermittent
Partial HPSA
Persistent
Partial HPSA
Intermittent
Whole HPSA
Persistent
Whole HPSA
70%
80%
90%
83.0%
81.7% 81.8%
79.8%79.0%
P < 0.0001
Figure 3. Percentage of Adults with Any Health Insurance Coverage by Rural
Primary Care HPSA Category
Never
a HPSA
Intermittent
Partial HPSA
Persistent
Partial HPSA
Intermittent
Whole HPSA
Persistent
Whole HPSA
70%
80%
90%
84.3%
83.2% 82.9%
80.3%
79.2%
P < 0.0001
Figure 4. Percentage of Adults Who Did Not Receive Needed Health Care Because of
Cost in the Preceding 12 Months by Rural Primary Care HPSA Category
Never
a HPSA
Intermittent
Partial HPSA
Persistent
Partial HPSA
Intermittent
Whole HPSA
Persistent
Whole HPSA
10%
15%
20%
14.0% 14.0%14.5%
17.3%
18.0%
P < 0.0001