Embed Size (px)
Citation preview

Persistent Organic Pollutants in Feed and Rainbow Trout from
Selected Trout Hatcheries
April 2006
Publication No. 06-03-017

This report is available on the Department of Ecology home page on the World Wide Web at www.ecy.wa.gov/biblio/0603017.html
Data for this project are available at Ecology’s Environmental Information Management (EIM) website at www.ecy.wa.gov/eim/index.htm. Search User Study ID, DSER0015. Ecology’s Project Code for this study is 05-056.
For a printed copy of this report, contact:
Department of Ecology Publications Distributions Office
Address: PO Box 47600, Olympia WA 98504-7600 E-mail: [email protected] Phone: (360) 407-7472
Refer to Publication Number 06-03-017
Any use of product or firm names in this publication is for descriptive purposes only and does not imply endorsement by the author or the Department of Ecology. If you need this publication in an alternate format, call Joan LeTourneau at (360) 407-6764. Persons with hearing loss can call 711 for Washington Relay Service. Persons with a speech disability can call 877-833-6341.

Persistent Organic Pollutants in Feed and Rainbow Trout from
Selected Trout Hatcheries
by Dave Serdar, Kristin Kinney,
Myrna Mandjikov, and Dolores Montgomery
Washington State Department of Ecology Environmental Assessment Program Olympia, Washington 98504-7710
in cooperation with
Washington Department of Fish and Wildlife
Fish Program, Hatcheries Division Olympia, Washington 98501-1091
April 2006
Waterbody numbers: Statewide

This page is purposely left blank for duplex printing

Page 1
Table of Contents
Page
List of Figures and Tables....................................................................................................2
Abstract ................................................................................................................................3
Acknowledgements..............................................................................................................4
Introduction..........................................................................................................................5 Study Description...........................................................................................................5
Methods................................................................................................................................7 Study Design..................................................................................................................7 Sampling Procedures ...................................................................................................10 Laboratory Analysis and Data Quality ........................................................................10
Sample Preparation..............................................................................................10 Data Quality.........................................................................................................11 Data Analysis.......................................................................................................12
Results................................................................................................................................13 Field Observations .......................................................................................................13 Contaminants in Feed and Fish....................................................................................13
PCBs, DDT, and PBDEs .....................................................................................13 Dioxins and Furans..............................................................................................18 Other Chlorinated Pesticides ...............................................................................19
Discussion..........................................................................................................................21 Feed Ingredients and Residue Tolerances....................................................................21 Depuration/Uptake of Contaminants in Lakes.............................................................24 Comparison of Tissue Concentrations to Applicable Criteria .....................................24
Conclusions........................................................................................................................31
Recommendations..............................................................................................................32
References..........................................................................................................................33
Appendices.........................................................................................................................35 Appendix A – Glossary of Acronyms and Units .........................................................35 Appendix B – Target Analytes and Reporting Limits .................................................36 Appendix C – Complete Results of Lipid and Contaminant Analysis ........................37
Page 2
List of Figures and Tables
Page Figures
Figure 1. Locations of Hatcheries and Lakes Sampled for the 2005 Study of
Persistent Organic Pollutants in Hatchery Feed and Hatchery Fish....................7
Figure 2. Mean Concentrations of ΣPCBs, ΣDDT, ΣPBDE, and Percent Lipid in Hatchery Feed, Hatchery Rainbow Trout, and Planted Rainbow Trout ...........16
Figure 3. Detection Frequency of Chlorinated Pesticides and Range of Detected Concentrations...................................................................................................20
Figure 4. Cumulative Frequency Distribution of ΣPCB Concentrations in Fillet Tissue of Rainbow Trout, Cutthroat Trout, and Brown Trout from Washington Lakes and Streams ........................................................................27
Figure 5. Cumulative Frequency Distribution of 4,4’-DDE Concentrations in Fillet Tissue of Rainbow Trout, Cutthroat Trout, and Brown Trout from Washington Lakes and Streams ........................................................................28
Figure 6. Cumulative Frequency Distribution of Dieldrin Concentrations in Fillet Tissue of Rainbow Trout, Cutthroat Trout, and Brown Trout from Washington Lakes and Streams. .......................................................................29
Tables Table 1. Feed Analyzed from WDFW Hatcheries..............................................................8
Table 2. Lakes Sampled and 2005 Rainbow Trout Plants ..................................................9
Table 3. Length and Weight of Rainbow Trout Collected from Hatcheries and Lakes ...14
Table 4. Lipid, ΣPCB, ΣDDT, and ΣPBDE Concentrations in Feed and Rainbow Trout Fillet Tissue. ..............................................................................................15
Table 5. Spearman Ranked Correlation Matrix of Major Variables in Feed and Tissue Samples....................................................................................................17
Table 6. TEQ Concentrations in Four Feed and Rainbow Trout Samples and Percent TEQ Contribution by Congener .............................................................18
Table 7. Contaminant Concentrations in Various Hatchery and Commercial Aquaculture Feeds and Applicable Regulations .................................................22
Table 8. National Toxics Rule Criteria Compared to Contaminant Residues in Hatchery and Planted Rainbow Trout Fillet........................................................26

Page 3
Abstract During 2005, persistent organic pollutants (POPs) were analyzed in fish feed and catchable rainbow trout from ten Washington Department of Fish and Wildlife (WDFW) hatcheries and the fish purchased by WDFW from one private hatchery operator. Fish originating from the same hatchery populations were also sampled approximately 2½ months following planting into unpolluted lakes in order to assess contaminant depuration or uptake. All feed and tissue (fillet) samples were analyzed for a variety of chlorinated pesticides, polychlorinated biphenyls (PCBs), a select group of polybrominated diphenyl ethers (PBDEs), and lipid content. A subset of feed and tissue samples was also analyzed for polychlorinated dioxins and furans (PCDD/Fs).
Feed samples had the following mean wet weight concentrations: ΣPCBs1 – 13.8 ng/g, ΣDDT – 8.2 ng/g, ΣPBDEs – <0.25 ng/g, PCDD/F toxic equivalent – 0.75 pg/g. Fish tissue samples had the following respective mean wet weight concentrations in hatchery and planted rainbow trout: ΣPCBs – 13.0 and 3.1 ng/g, ΣDDT – 3.9 and 8.8 ng/g, ΣPBDEs – 0.66 ng/g for both. PCDD/F toxic equivalent averaged 0.032 pg/g in hatchery fish but was not analyzed in trout collected from lakes. Other pesticides found in feed (f), hatchery fish (h), and planted fish (p) were: DDMU (f,h,p), dieldrin (f,h,p), hexachlorobenzene (f,h,p), pentachloroanisole (f,h,p), trans-nonachlor (f,h), cis-chlordane (f,h), trans-chlordane (f), methoxychlor (f), and toxaphene (f). Results suggest that some portion of POP concentrations in trout from unpolluted waters may originate from hatcheries. In addition, some catchable trout contain POP concentrations above regulatory criteria when they are planted in lakes.
1 Σ = Total

Page 4
Acknowledgements The authors would like to thank the following individuals for their contributions: Staff with the Washington Department of Fish and Wildlife:
• John Kerwin, Hatchery Division Manager, helped conceive and develop this project
• Managers and staff of the trout hatcheries provided samples and answered our inquiries
• District biologists provided valuable suggestions and information on lakes and their trout populations
• Jeff Korth and Patrick Verhey helped collect fish in Warden Lake
• John Sneva aged the specimens
• John Kerwin and Sandie O’Neill reviewed the report Staff with the Washington State Department of Ecology:
• Karin Feddersen contracted and reviewed the dioxin/furan analysis
• Dean Momohara conducted the lipid analysis
• Will White and Pam Covey handled and tracked samples
• Paul Anderson, Randy Coots, Casey Deligeannis, Brandee Era-Miller, Brandi Lubliner, Brenda Nipp, Brian Reese, Kirk Sinclair, and Trevor Swanson assisted with the collection and processing of fish samples
• Dale Norton and Art Johnson reviewed the report
• Carol Norsen and Joan LeTourneau edited and formatted the sampling plan and final report, respectively
Other contributors:
• Corey Bray assisted with fish collection
• Dave McBride, Washington State Department of Health, provided useful comments

Page 5
Introduction Recent reports have indicated that commercially farmed salmon, hatchery-raised trout, and the feed used to grow them may contain polychlorinated biphenyls (PCBs) and other persistent organic pollutants (POPs). For instance, Hites et al. (2004) showed that salmon raised in net-pens had substantially higher PCBs than those caught wild, presumably due to PCB-contaminated feed. Carline et al. (2004) found that concentrations of PCBs in hatchery rainbow trout (Oncorhynchus mykiss) fillets were correlated to concentrations in feed, and nearly all the body burden was due to PCBs in the diet. Other investigations have revealed detectable concentrations of dioxins, dieldrin, and endrin as well as PCBs in hatchery broodstock salmon and trout (Millard et al., 2004). In Pennsylvania, PCB contamination of edible tissues accumulated through dietary uptake in hatcheries exceeded thresholds for issuance of consumption advisories (Carline et al., 2004). Currently there is no statewide program in Washington to evaluate toxic chemicals in hatchery feed or hatchery fish. At the same time, low levels of POPs in fish from lakes and streams across the state are being detected at an increasing rate (e.g., Seiders 2003; Seiders and Kinney, 2004) due to increased sampling coverage and better analytical detection limits. These waterbodies are often added to the list of impaired waters as required by the federal Clean Water Act section 303(d), and subsequently require a plan to control or clean up the contaminants. Many of the POPs found in fish tissue (e.g., PCBs, dioxins) are ubiquitous environmental contaminants and may be found globally through atmospheric deposition, historical releases, or food-web cycling. Fish may accumulate low concentrations of these chemicals through one or more of these pathways, although it is nearly impossible to distinguish and quantify these diffuse sources, and control and clean-up is often unrealistic. Due to recent data, however, contamination stemming from hatcheries is now considered a possible source of POPs in fish.
Study Description Catchable rainbow trout – fish approximately six inches or more released into lakes and streams just prior to the opening of fishing season – were sampled from ten Washington Department of Fish and Wildlife (WDFW) hatcheries. Approximately 2½ months following planting, samples from un-mixed hatchery populations were sampled from stocked lakes. All feed and tissue (fillet) samples were analyzed for a variety of chlorinated pesticides, PCB aroclors, a select group of polybrominated diphenyl ethers (PBDEs), and lipid content. A subset of feed and tissue samples was also analyzed for polychlorinated dioxins and furans (PCDD/Fs). Specific project objectives were to:
• Measure concentrations of POPs in catchable rainbow trout released to lakes by WDFW.
• Measure concentrations of POPs in feed used to raise catchable rainbow trout in WDFW hatcheries to assess the correlation between diet and contaminant burdens in fish tissue.
• Estimate the degree of contaminant depuration or uptake in catchable rainbow trout following their release into lakes.

Page 6
This page is purposely left blank for duplex printing

Page 7
Methods
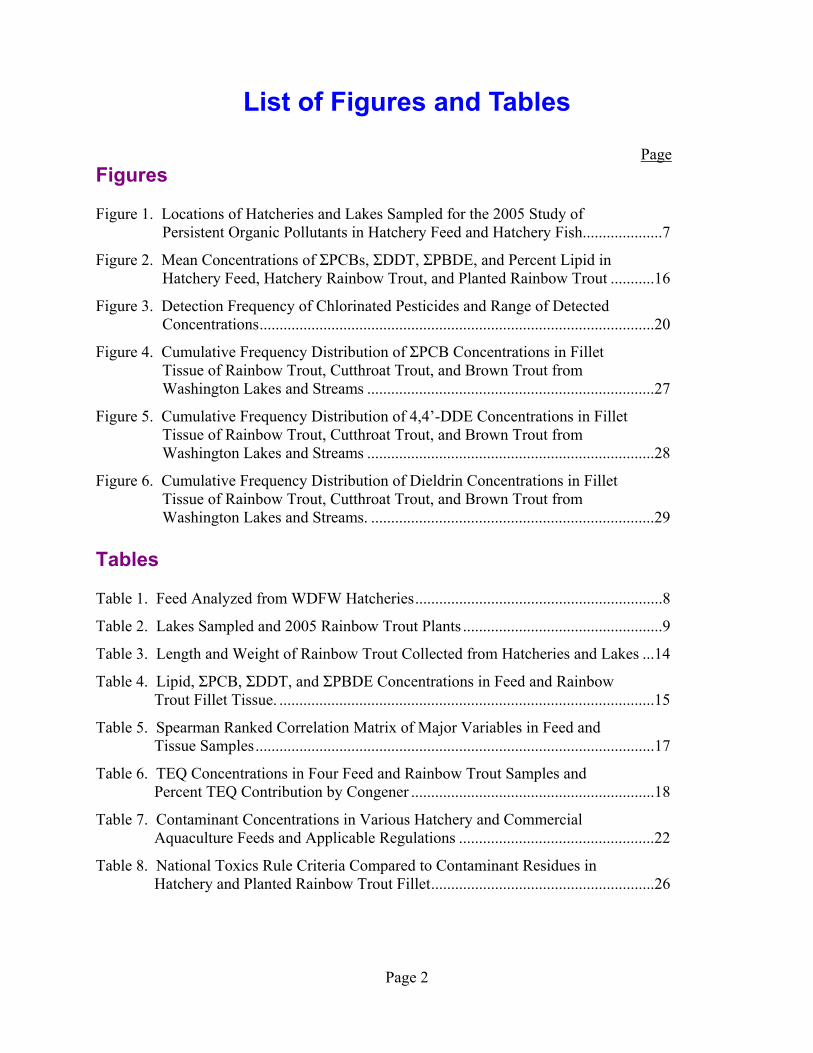
Study Design Fish feed and catchable rainbow trout were sampled from ten WDFW hatcheries during March 29 - April 5, 2005. Hatchery selection was made based on consultation with John Kerwin, Hatchery Division Manager with the WDFW Fish Program. Figure 1 shows locations of hatcheries. All ten hatcheries use well or spring water for hatching and rearing, although Tucannon River water is used in the final six-month rearing phase at the Tucannon Hatchery. Vancouver and Puyallup Hatchery personnel have also observed surface runoff entering hatcheries during rainy periods, but the extent of the exposure to fish is minor. POPs are much less likely to be present in groundwater and surface water due to their low solubility and immobility in soils.
��
� �
���
��
��
�
��
���
�
��
�0 50 100
Miles
Legend
� Hatcheries
� Lakes
Molson Lake
Ford
Chelan
TucannonDonnie Lake
Vancouver
Mossyrock
South Lewis County Park Pond
North Lake
Lone Lake
Arlington
Chapman Lake
Spokane
Fan Lake
Lacamas Lake
Warden Lake
Columbia BasinPuyallupSummit Lake
Eells Springs
Figure 1. Locations of Hatcheries and Lakes Sampled for the 2005 Study of Persistent Organic Pollutants in Hatchery Feed and Hatchery Fish.

Page 8
Hatchery personnel were interviewed about the feed used, schedule for changes in feed size and type, weight growth obtained using the sampled feed, hatchery water source, planting schedules, and other pertinent information related to the project. Feed samples consisted of material being fed to the trout at the time of sampling. In most cases, fish had been on the feed sampled for at least four months during which they had gained 50% - 80% of their mass (Table 1). Table 1. Feed Analyzed from WDFW Hatcheries.
Hatchery Feed Sampled Pellet Size (mm) Manufacturer Period of
use Weight Gain
Arlington Rangen 3.2 Rangen, Inc. Buhl, ID 6 mo. 76% Chelan Silver Cup Trout 3.0 Nelson & Sons, Inc., Murray, UT 6 mo. 76% Columbia Basin Silver Cup Fish Feed 3.2 Nelson & Sons, Inc., Murray, UT 6 mo. 80% Eells Springs Rangen 4.0 Rangen, Inc. Buhl, ID 4 mo.(a) 56% Ford Orient 4.0 Skretting, Vancouver, B.C. na 50% Mossyrock Silver Cup Salmon 3.0 Nelson & Sons, Inc., Murray, UT 10 mo. na Puyallup EWOS Vita 3.0 EWOS, Surrey, B.C. na na Spokane Silver Cup Fish Feed 3.2 Nelson & Sons, Inc., Murray, UT na 78% Tucannon EWOS Pacific 3.0 EWOS, Surrey, B.C. 1 mo.(b) 70% (c) Vancouver Rangen 4.0 Rangen, Inc. Buhl, ID 6 mo. 82%
(a) fish fed Rangen since fry stage (b) fish fed EWOS 2.0 for preceding 4 months, and EWOS 1.2 for 2 months prior to that (c) weight gain during diet of EWOS 1.2, EWOS 2.0, and EWOS 3.0 na - not available Ten rainbow trout specimens from each hatchery were randomly selected for sampling. They were from the general catchable populations which were in the process of being planted or were planned to be stocked within the subsequent weeks. Ten triploid rainbow trout from Troutlodge, a private facility that supplies trout to WDFW, were provided by WDFW staff. Triploid trout are fish with three sets of chromosomes produced by pressure-treating the newly dividing fertilized eggs. Since they are sterile, more energy is used for somatic growth than gamete production, and the resulting triploid trout is larger than diploid fish of the same age. No feed samples or post-plant fish associated with Troutlodge were sampled for this study. Lakes selected for sampling were based on the following criteria:
1. No known contaminant sources and low potential for appreciable contamination
2. Little or no natural rainbow trout production
3. Rainbow trout originating from a single hatchery planted between late-March and mid-April, 2005
4. Geographically dispersed to reflect a variety of ecosystem types, water chemistry, aquatic environments, and regions of the state containing differing preponderance of land use types.

Page 9
Few of the approximately 380 lakes stocked annually with catchable trout have any contaminant data. Therefore, criterion 1 was assumed to be met unless a potential contaminant source was obvious. District WDFW biologists were interviewed to satisfy criterion 2. Criterion 3 was the most difficult to meet due to the common practice of multiple plantings of fish from different hatcheries. Lakes are also often planted at various intervals throughout the spring, which would yield uncertainties in fish residence periods; these lakes were avoided. Planting reports provided weekly by WDFW were reviewed in order to find lakes with single hatchery plants and fish residence times of approximately 2½ months. Criterion 4 was easily satisfied due to the geographic separation of the hatcheries and their associated lakes. Table 2 lists lakes where rainbow trout were sampled and their hatcheries of origin. Table 2. Lakes Sampled and 2005 Rainbow Trout Plants.
Lake County Area (hect.)
Mean Depth
(meters)
2005 Stock Date
Number Mean
Weight (grams)
Hatchery
30-Mar 4,060 114 Arlington Lone Island 41 2.7 18-Apr 593* 649 Troutlodge
Molson Okanogan 9.3 1.8 12-Apr 4,160 142 Chelan
15-Mar 12,723 116 18-Mar 11,596 108 Warden Grant 81 8.2
5-Apr 685 123 Columbia Basin
28-Mar 400 1,746 29-Mar 402 1,681 14-Apr 10,048 142 15-Apr 646 825 22-Apr 15,097 138 25-Apr 9,810 153
Summit Thurston 214 16
26-Apr 5,056 142
Eells Springs
Fan Pend Oreille 32 7.6 22-Mar 3,021 86 Ford
S. Lewis Co. Park Pond Lewis 4.5 2.7 14-Apr 3,043 134 Mossyrock
North King 23 4.3 20-Apr 8,500 114 Puyallup
Chapman Spokane 61 20 15-Mar 5,925 91 Spokane
Donnie Columbia 0.4 0.9 14-Apr 420 108 Tucannon
7-Mar 2,000 227 8-Apr 3,000 267 Lacamas Clark 129 7.3
26-Apr 4,000 197 Vancouver
*Triploid fish

Page 10
Sampling Procedures Hatchery feed and pre-plant catchable rainbow trout samples were collected with assistance of hatchery staff. Fish averaged 235 mm total length and 152 gm in weight (excluding Troutlodge samples). Feed samples were placed directly in 1-liter organics-free glass jars with Teflon lid liners and certificates of analysis. Fish from hatcheries were killed with a blow to the skull, double-wrapped in aluminum foil, sealed in zip-lock polyethylene bags, and transported on ice to Ecology headquarters where they were weighed and measured prior to being stored frozen at –20○ C. Rainbow trout from lakes were collected by hook-and-line or electrofishing. Following capture, fish were observed for signs confirming previous hatchery residence. Specimens were then killed with a blow to the skull, weighed to the nearest gram and measured to the nearest millimeter, assigned a sample number, double-wrapped in aluminum foil, placed in zip-lock polyethylene bags, and transported on ice to Ecology headquarters where they were stored frozen at –20○ C. Rainbow trout collected from lakes averaged 270 mm total length and 211 gm in weight. When ready for processing, fish were partially thawed then scales were removed for aging by WDFW. Composite samples of homogenate tissue were prepared by methods described by EPA and the Washington State Toxics Monitoring Program (EPA, 2000; Seiders, 2003). Briefly, fish were scaled, skin-on fillets removed, and equal mass aliquots of tissue were homogenized with three passes through a Kitchen-Aid food processor for each composite. Homogenates were placed in a 4-oz organics-free glass jar with Teflon lid liner and certificate of analysis and stored frozen. All resection was done with non-corrosive stainless steel implements on a clean aluminum foil surface. Persons preparing samples wore non-talc polyethylene or nitrile gloves changed between samples. Resection and homogenizing equipment was cleaned using Liquinox® detergent and hot tap water, followed by rinses with deionized water, pesticide grade acetone, and pesticide grade hexane, then air-dried in a fume hood before use.
Laboratory Analysis and Data Quality Sample Preparation Feed Feed samples were first Soxhlet extracted using 1:1 methylene chloride/hexane, then solvent exchanged into hexane and adjusted to 10 ml. Extracts were split, half for PCB/chlorinated pesticide and half for PBDE and lipid analysis. Extracts for PCB and chlorinated pesticide analysis were eluted through 2 gm micro Florisil® columns first with 100% hexane and collected as the “0% Florisil fraction”, followed by elution with 1:1 hexane/preserved diethyl ether, collected as the “50% Florisil fraction”. When the

Page 11
“0% Florisil fractions” were solvent-reduced, the remaining extracts were as much as 50% lipids, unsuitable for gas chromatography (GC) analysis, and were therefore added to the “50% Florisil fraction”. The combined extracts were then back-extracted with acetonitrile to remove lipids and re-eluted through 2 gm micro Florisil® columns with 100% hexane (“0% Florisil fraction”) and 1:1 hexane/preserved diethyl ether (“50% Florisil fraction”). Each fraction was solvent-exchanged to iso-octane and concentrated to 1 ml. One-half of the “50% Florisil fraction” and the “0% Florisil fraction” were treated with concentrated sulfuric acid prior to analysis. The remainder of the “50% fraction” was analyzed without acid treatment. Fish Tissue Tissue samples were first Soxhlet extracted using 1:1 methylene chloride/hexane, then solvent exchanged into hexane and adjusted to 10 ml. Extracts were split, half for PCB/chlorinated pesticide and half for PBDE and lipid analysis. Extracts for some PCB analyses (sample nos. 05248100 – 05248109) were eluted through 2 gm micro Florisil® columns with 100% hexane, solvent-exchanged to iso-octane, and concentrated to 1 ml. Extracts were treated with concentrated sulfuric acid prior to analysis. For chlorinated pesticide analysis and some PCB analyses (sample nos. 05144080 – 05144090), extracts were eluted through 2 gm micro Florisil® columns with 100% hexane and collected as the “0% Florisil fractions”, followed by elution with 1:1 hexane/preserved diethyl ether. The hexane/ether fractions were adjusted to 5 ml and back-extracted with acetonitrile to remove lipids and re-eluted through 2 gm micro Florisil® columns with 1:1 hexane/preserved diethyl ether, and collected as the “50% Florisil fraction”. Each fraction was solvent-exchanged to iso-octane and concentrated to 1 ml. One-half of the “50% Florisil fraction” and the “0% Florisil fraction” were treated with concentrated sulfuric acid prior to analysis. The remainder of the “50% fraction” was analyzed without acid treatment. Analyses for PCBs, chlorinated pesticides, and PBDEs were conducted at the Manchester Environmental Laboratory (MEL) using dual column GC/ECD. Sample preparation and analysis methods were modifications of EPA SW-846 Methods 3540, 3620, and 8081/8082. Samples for PCDDs/PCDFs were analyzed at Pacific Rim Laboratories, Inc. (Surrey, B.C.) using high resolution GC/MS isotope dilution methodology of EPA Method 1613B. Percent lipid was analyzed gravimetrically at MEL. The complete list of analytes is in Appendix B. Data Quality Overall quality of the data was fair. Precision for Aroclor analysis was 11% relative percent difference. Analysis was also performed with a high degree of precision for DDT compounds (14%), other chlorinated pesticides (17%), PBDEs (17%), and PCDD/Fs (13%).
Page 12
One standard reference material was analyzed along with feed and tissue; NIST 1974b – Organics in Frozen Mussel Tissue (https://srmors.nist.gov/tables/view_table.cfm?table=109-2.htm). Chlorinated pesticide analytes, including DDT compounds, were only 67% of certified concentrations on average. Total PCBs were 82% of the reference concentration. These results indicate a possible low bias for these analyte groups. Data Analysis PCB, DDT, PBDE, and lipid concentrations were compared between hatchery and lake rainbow trout using the Wilcoxon signed-rank test, a non-parametric equivalent of the paired t-test (Zar, 1984). Spearmann ranked correlations among contaminant groups and sample types were done using SYSTAT 9.01 software program (SPSS, 1998). Non-detected values were treated as zero for statistical tests to avoid misinterpretation of comparisons between hatchery tissue samples and the lake tissue samples, which had different detection limits for the same analytes. Non-detects were also treated as zero for samples analyzed in duplicate. Therefore, values presented as the mean of duplicate analyses may be biased low. The complete set of chemistry data is in Appendix C.

Page 13
Results
Field Observations Physical observations of rainbow trout collected from lakes indicated that they originated from hatcheries sampled earlier in the year. Most specimens had gnawed pectoral fins, or dorsal and caudal fin erosion. Scale annuli patterns also indicated fish were from the year’s stock of catchables (John Sneva, WDFW, written communication, 8/10/2005). This physical evidence, coupled with local knowledge from WDFW District Biologists and WDFW plant records, supports the conclusion that the trout had been raised as catchables from known hatcheries. Rainbow trout collected from lakes in June were larger on average than just prior to their release from hatcheries (Table 3). Increases in total length averaged 15%, and weight gain was 39% on average. Mean condition factors in hatchery and planted trout were 1.11 and 1.02, respectively. Condition factors fell below 1.0 in half the lakes, suggesting food supply was limited. Gut contents were not examined, but aside from the fin erosion mentioned previously, the fish collected from lakes appeared healthy and took bait and lures readily in most cases.
Contaminants in Feed and Fish PCBs, DDT, and PBDEs Most feed and fish tissue samples contained measurable concentrations of PCBs (Table 4). Aroclor-1254 was the most commonly detected, followed by 1260, 1242, and 1248; none of the other Aroclors were detected. All samples contained DDT compounds, with 4,4’-DDE comprising 74% of the ΣDDT on average. All but one of the tissue samples contained low levels of PBDEs; none of the feed samples had detectable PBDEs. PBDE-47 was the most common congener detected, followed by 99, 71/100, and 138/209. Mean concentrations of lipids in feed were high (16.8%) compared to tissue. This high fat diet resulted in high lipid levels in hatchery rainbow trout fillet tissue (mean of 3.2%). Although the catchable rainbow trout increased in size following planting, it appears that muscle lipid was depleted to meet their energy requirements, with an average 60% decrease in lipid content (1.2%).

Page 14
Table 3. Length and Weight of Rainbow Trout Collected from Hatcheries and Lakes.
Hatchery/Lake 2005
Collection Date
N Total Length (mm, mean ± SD)
Weight (gm, mean ± SD)
Condition Factor (mean ± SD)
Arlington Hatchery 29-Mar 10 245 ± 16 165 ± 34 1.11 ± 0.09 Lone Lake 16-Jun 10 306 ± 12 334 ± 37 1.17 ± 0.06 Chelan Hatchery 5-Apr 10 253 ± 16 178 ± 37 1.08 ± 0.11 Molson Lake 13-Jun 10 296 ± 20 303 ± 59 1.16 ± 0.08 Columbia Basin Hatchery 5-Apr 10 230 ± 15 140 ± 31 1.15 ± 0.08 Warden Lake 9-Jun 10 251 ± 10 147 ± 23 0.93 ± 0.08 Eells Springs Hatchery 1-Apr 10 230 ± 8 142 ± 19 1.16 ± 0.07 Summit Lake 13-Jun 7 259 ± 13 160 ± 16 0.92 ± 0.12 Ford Hatchery 4-Apr 10 197 ± 15 83 ± 15 1.09 ± 0.06 Fan Lake 14-Jun 8 290 ± 14 271 ± 47 1.11 ± 0.15 Mossyrock Hatchery 5-Apr 10 260 ± 14 190 ± 31 1.08 ± 0.06 S. Lewis Co. Park Pond 14-Jun 8 259 ± 10 176 ± 24 1.01 ± 0.07 Puyallup Hatchery 1-Apr 10 218 ± 20 111 ± 31 1.04 ± 0.11 North Lake 13-Jun 10 245 ± 12 141 ± 21 0.96 ± 0.08 Spokane Hatchery 4-Apr 10 210 ± 13 98 ± 21 1.04 ± 0.08 Chapman Lake 15-Jun 4 243 ± 10 125 ± 13 0.87 ± 0.04 Tucannon Hatchery 4-Apr 10 206 ± 18 108 ± 30 1.21 ± 0.06 Donnie Lake 16-Jun 10 254 ± 19 145 ± 33 0.87 ± 0.07 Vancouver Hatchery 5-Apr 10 298 ± 24 303 ± 91 1.12 ± 0.10 Lacamas Lake 17-Jun 9 285 ± 14 249 ± 37 1.07 ± 0.06 Troutlodge Hatchery 4-Apr 10 374 ± 22 678 ± 133 1.29 ± 0.19
Condition Factor = (W[g] x 100/L[cm]3) N = number SD = standard deviation

Page 15
Table 4. Lipid, ΣPCB, ΣDDT, and ΣPBDE Concentrations in Feed and Rainbow Trout Fillet Tissue (ng/g, ww).
Sample Type/Location % Lipid ΣPCB ΣDDT ΣPBDE
Hatchery Feed Arlington 18.19 13.8 6.3 U(0.25-1.2) Chelan 13.75 34.8 9.4 U(0.25-1.2) Columbia Basin 14.47 11.6 6.3 U(0.24-1.2) Eells Spring 12.70 12.5 5.9 U(0.24-1.2) Ford* 25.85 U(2.5) 3.7 U(0.25-1.2) Mossyrock 19.64 27.6 11.0 U(0.25-1.2) Puyallup* 16.14 U(2.5) 6.6 U(0.25-1.2) Spokane 15.79 16.4 5.9 U(0.25-1.2) Tucannon 15.01 8.2 21 U(0.25-1.2) Vancouver 16.08 13.3 5.8 U(0.25-1.2) Hatchery Rainbows Arlington 3.97 12.1 4.8 0.64 Chelan 3.05 67 4.1 1.09 J Columbia Basin 4.10 18.5 6.5 0.90 J Eells Spring* 2.42 U(2.4) 2.7 0.52 Ford 2.35 U(2.5) 2.5 0.24 J Mossyrock 2.69 15.8 3.9 0.89 J Puyallup 3.07 U(2.3) 2.4 0.24 Spokane 2.48 11.7 2.9 1.10 J Tucannon 3.69 U(2.4) 5.3 0.27 Vancouver* 4.00 4.8 4.0 0.71 J Troutlodge 5.39 14.4 5.7 0.84 J Planted Rainbows Lone Lake* 1.67 U(4.8) 1.9 0.96 J Molson Lake 2.05 8.6 5.8 U(0.49-2.4) Warden Lake 0.61 U(4.9) 3.7 0.46 J Summit Lake* 0.40 5.0 3.2 0.56 Fan Lake 2.66 U(5.0) 57 0.40 J South Lewis Co. Park Pond 0.77 5.9 2.4 1.33 J North Lake 0.65 U(4.9) 2.9 1.23 J Chapman Lake 0.44 11.8 5.0 1.01 NJ Donnie Lake 1.29 U(5.0) 3.6 0.25 J Lacamas Lake 1.50 U(5.0) 3.0 0.42 J ΣPCB = the sum of detected Aroclors ΣDDT = the sum of detected 4,4’ and 2,4’ homologues of DDD, DDE, and DDT ΣPBDE = the sum of detected PBDE congeners analyzed Detected concentrations in bold * Samples analyzed in duplicate. Results shown are mean of laboratory analyses. U - The analyte was not detected at or above the reported result J - The analyte was positively identified. The associated numerical value is an estimate. NJ - There is evidence that the analyte is present. The associated numerical result is an estimate.

Page 16
Lipid catabolism in muscle and consequent contaminant mobilization may explain higher mean ΣPCB in hatchery fish compared to fish from lakes (13 and 3.1 ng/g, respectively; Figure 2). Differences between contaminant concentrations in hatchery and planted rainbow trout appear to be regulated by more than lipid decreases, however. Mean ΣDDT concentrations in tissue were higher in lakes (8.8 ng/g) compared to tissues from hatchery fish (3.9 ng/g), although concentrations were nearly identical when the outlier from Fan Lake was removed.
0
5
10
15
20
PCB DDT PBDE Lipid
Con
c. (n
g/g
ww
)
0
5
10
15
20
Lipi
ds (%
)
Hatchery Feed Hatchery RBT Planted RBT
Feed ND
Figure 2. Mean (SE) Concentrations of ΣPCBs, ΣDDT, ΣPBDE, and Percent Lipid in Hatchery Feed, Hatchery Rainbow Trout, and Planted Rainbow Trout. Neither ΣPCB nor ΣDDT were significantly different in hatchery fish compared to planted fish (Wilcoxon signed-rank test, α=0.05). There was also no significant difference in PBDEs between groups, although this was not surprising since mean concentrations were identical (0.66 ng/g, respectively). PCBs tended to be highest in hatchery fish whose food had comparatively high PCB concentrations. For example, the Chelan Hatchery had high ΣPCB in both feed and fish, while Ford and Puyallup Hatcheries had no detectable PCBs in either feed or fish. However, this pattern was not true for ΣDDT and ΣPBDE in hatchery samples.

Page 17
To examine possible relationships among sample types and contaminants, a ranked correlation analysis was performed on major variables in hatchery and lake samples (Table 5). There were no strong correlations between contaminants in hatchery fish and their lake counterparts. With the exception of lipids and ΣDDT in hatchery fish, lipids were not highly correlated with ΣPCB, ΣDDT, or ΣPBDE, a somewhat surprising finding but lending support to the notion that factors other than lipid may be the primary determinants in contaminant residue levels, particularly for DDT compounds and PBDEs. Table 5. Spearman Ranked Correlation Matrix of Major Variables in Feed and Tissue Samples.
Hatch. Feed Lipid
Hatch. Feed ΣPCB
-0.182
Hatch. Feed ΣPCB
Hatch. Feed ΣDDT
-0.159
0.226
Hatch. Feed ΣDDT
Hatch. Fish Lipid
-0.139
-0.012
0.256
Hatch. Fish Lipid
Hatch. Fish ΣPCB
-0.156
0.753
0.280
0.356
Hatch. Fish ΣPCB
Hatch. Fish ΣDDT
-0.333
0.280
0.402
0.721
0.563
Hatch. Fish ΣDDT
Hatch. Fish
ΣPBDE
-0.365
0.817
0.086
0.170
0.822
0.426
Hatch. Fish
ΣPBDE
Planted Fish Lipid
0.467
0.030
-0.030
0.042
0.125
0.127
-0.213
Planted Fish Lipid
Planted Fish ΣPCB
-0.307
0.753
0.131
-0.519
0.405
-0.171
0.685
-0.294
Planted Fish ΣPCB
Planted Fish ΣDDT
-0.285
-0.109
-0.293
-0.382
0.019
-0.042
0.182
0.176
0.246
Planted Fish ΣDDT
Planted Fish
ΣPBDE
0.382
0.103
0.055
-0.103
-0.006
-0.394
0.043
-0.539
0.184
-0.636
Spearman correlation coefficients ≥|0.500| in bold

Page 18
Dioxins and Furans Four samples each of hatchery feed and rainbow trout tissue were analyzed for 2,3,7,8-substituted PCDDs and PCDFs (Table 6). Toxic equivalents (TEQs) were calculated using toxic equivalency factors (TEFs) proposed by Van den Berg et al., 1998. Table 6. TEQ Concentrations (pg/g, ww) in Four Feed and Rainbow Trout Samples and Percent TEQ Contribution by Congener.
Vancouver Mossyrock Ford* Spokane
Hatchery Feed TEQ 0.562 1.226 0.028 1.194
2,3,7,8-TCDD 33% 30% 0% 16% 1,2,3,7,8-PeCDD 38% 44% 0% 53% 1,2,3,4,7,8-HxCDD 0% 0% 0% 0% 1,2,3,6,7,8-HxCDD 4% 4% 0% 4% 1,2,3,7,8,9-HxCDD 0% 3% 0% 3% 1,2,3,4,6,7,8-HpCDD 2% 1% 18% 1% OCDD 0% 0% 1% 0% 2,3,7,8-TCDF 9% 7% 71% 12% 1,2,3,7,8-PeCDF 2% 2% 10% 1% 2,3,4,7,8-PeCDF 11% 9% 0% 10% 1,2,3,4,7,8-HxCDF 0% 0% 0% 0% 1,2,3,6,7,8-HxCDF 0% 0% 0% 0% 2,3,4,6,7,8-HxCDF 0% 0% 0% 0% 1,2,3,7,8,9-HxCDF 0% 0% 0% 0% 1,2,3,4,6,7,8-HpCDF 0% 0% 0% 0% 1,2,3,4,7,8,9-HpCDF 0% 0% 0% 0% OCDF 0% 0% 0% 0% Hatchery Rainbows
TEQ 0.053 0.041 0.012 0.024 2,3,7,8-TCDD 0% 0% 0% 0% 1,2,3,7,8-PeCDD 0% 0% 0% 0% 1,2,3,4,7,8-HxCDD 0% 0% 0% 0% 1,2,3,6,7,8-HxCDD 0% 0% 0% 0% 1,2,3,7,8,9-HxCDD 0% 0% 0% 0% 1,2,3,4,6,7,8-HpCDD 0% 0% 0% 0% OCDD 0% 0% 0% 0% 2,3,7,8-TCDF 35% 68% 35% 68% 1,2,3,7,8-PeCDF 11% 17% 0% 0% 2,3,4,7,8-PeCDF 39% 0% 0% 0% 1,2,3,4,7,8-HxCDF 13% 12% 56% 28% 1,2,3,6,7,8-HxCDF 0% 0% 0% 0% 2,3,4,6,7,8-HxCDF 0% 0% 0% 0% 1,2,3,7,8,9-HxCDF 0% 0% 0% 0% 1,2,3,4,6,7,8-HpCDF 2% 2% 9% 3% 1,2,3,4,7,8,9-HpCDF 0% 0% 0% 0% OCDF 0% 0% 0% 0%
* Samples analyzed in duplicate. Results shown are mean of laboratory analyses.

Page 19
TEQs were much higher in hatchery feed compared to rainbow trout, with the exception of Ford Hatchery feed which had a TEQ up to 40 times lower than the other hatcheries. Like other contaminants, it appears that TEQ concentrations were not determined primarily by lipid content. Congeners contributing to TEQ were markedly different between high and low TEQ samples, with tetra- and penta-substituted dioxin congeners providing approximately 70% of the toxicity. In contrast, the Ford feed sample had none of these congeners detected. Congener patterns were even more distinct when feed and fish tissue samples were compared. None of the tissue samples contained detectable concentrations of PCDDs. Most of the toxicity in tissue samples was derived from tetra-, penta-, and hexa-substituted furan congeners. Other Chlorinated Pesticides In addition to DDT compounds, nine chlorinated pesticides or breakdown products were detected in feed samples, six were detected in hatchery rainbow trout, and four were found in trout collected from lakes (Figure 3). DDMU, like its parent DDT, was detected in all hatchery feed samples. Although DDMU was much higher in Fan Lake trout (4.4 ng/g) compared to other lakes, feed from the originating hatchery (Ford) had the lowest concentration (0.2 ng/g), and Ford Hatchery rainbow trout did not have a detectable DDMU concentration. Dieldrin had an unusual detection pattern among samples; it was detected in only 10% (Mossyrock, one of ten) feed samples, and 20% of lake fish tissue samples, but was found in 70% of the hatchery tissue samples. It should be noted, however, that detection limits for dieldrin in feed samples were approximately three-to-five times higher than in tissue samples (see Appendix C). Hexachlorobenzene was found in only one sample from planted rainbow trout (Summit Lake, 0.7 ng/g) but not in fish from the original population at Eells Springs Hatchery. The comparatively high concentration and lack of apparent link to the hatchery suggests these fish may have accumulated hexachlorobenzene from a local source in Summit Lake. Pentachloroanisole, a degradation product of pentachlorophenol, was the only additional compound detected in planted rainbow tissue. Concentration of pentachloroanisole doubled in Lacamas Lake fish compared with the original hatchery population, suggesting a possible local source. Tucannon hatchery rainbows also apparently accumulated pentachloroanisole from the hatchery feed, although residues in the hatchery fish did not persist while the fish were in a (Donnie) lake environment. Nonachlor and cis-chlordane, two components of commercial-grade chlordane, were found in at least half of the hatchery feed and fish samples. Another chlordane component, trans-chlordane, was found in 40% of feed samples. Two other chlorinated pesticides, toxaphene and methoxychlor, were found in 30% and 20% of feed samples, respectively.

Page 20
Detection Frequency (%)
0 20 40 60 80 100 Range of Conc.
(ng/g ww) 0.2* - 3.9 DDMU 0.52 - 0.9 4.4 3.8 Dieldrin 0.31* - 0.88 0.55 - 0.76 0.05* - 0.31 Hexachlorobenzene 0.10 - 0.23 0.72* 0.11 - 0.15 Pentachloroanisole 0.10* - 0.21 0.47
0.15 - 1.2 Trans-Nonachlor 0.094 - 0.45
ND
0.22* 1.2 Cis-Chlordane 0.17 - 0.31
ND 0.19 - 1.1
Trans-Chlordane (Gamma)
ND ND
Toxaphene 1.8* - 3.9
ND ND
Methoxychlor 2.2 - 4.4*
ND ND
Hatchery
Feed Hatchery
RBT Planted
RBT * Average of Lab Duplicate Results
Figure 3. Detection Frequency of Chlorinated Pesticides (Excluding DDT Compounds) and Range of Detected Concentrations.

Page 21
Discussion
Feed Ingredients and Residue Tolerances The four brands of feed analyzed during the present 2005 survey have a wide range of contaminant levels. Rainbow trout collected at hatcheries gained approximately 50-80% of their final weight on these feeds, and may have gained most of their initial weight on starter feeds with similar ingredients. Feed sack labels obtained at the time of sampling indicated that minimum amounts of crude protein (40-45%) were similar among feeds, as were maximum amounts of crude fiber (1.5-5%) and ash (9-12%). Crude fat was the other major component, constituting 10-24% of the weight which generally showed good agreement with lipid analysis in the present study (r2=0.64). In terms of contaminant residues, the origin of the lipids in the feed is probably a much greater concern than their percent by weight. All of the feeds sampled advertise fish oil as a major ingredient which is likely to be the major source of PCBs, chlorinated pesticides, PBDEs, PCDD/Fs, and other lipophilic contaminants (Jacobs et al., 2002). The exact source of the fish oil and fish meal, as well as other major ingredients in hatchery feed (wheat flour, soybean oil, blood meal, feather meal, and poultry by-product), may change from batch to batch, depending on the availability and cost of the raw products. Fishmeal may derive largely from anchovy, menhaden, capelin, and herring, and fish oil is a by-product of the fishmeal manufacturing industry. The negative correlation between lipids and major contaminants in feed is another indication that the source of fish oil is probably a more important determinant in contaminant residues than lipid content by weight. However, contaminant concentrations in feed apparently play a large role in accumulation by fish, probably due to the high rate of weight conversion from feed to fish (>80%). This is demonstrated by the strong correlation between ΣPCB in hatchery feed and hatchery fish (r=0.75), and a weaker yet positive correlation for ΣDDT (r=0.40). In the case of the Tucannon hatchery, where the fish are raised in water from the Tucannon River for six months prior to stocking, fish weight gain actually exceeded the weight of feed provided (conversion of 163%) due to availability of natural prey items. The only domestic regulation concerning POP contaminants is a federal PCB residue tolerance of 2,000 ng/g for feed components of animal origin (21 CFR 109.30). The Canadian Food Inspection Agency has an “actionable level” of 2,000 ng/g for PCBs, but it only applies to fish oil destined for animal feed (CFIA, 2003). In 2001, the European Union (EU) established maximum tolerable levels of PCDD/F TEQs in fish in various fish products and feeds. The maximum levels for fish feed and fish oil for use other than direct human consumption is 2.25 and 6.0 pg TEQ/g, respectively (Directive 2001/102/EC).

Page 22
Table 7 shows a summary of major contaminants in hatchery feeds and commercial aquaculture feeds for salmonids. Care should be used interpreting the available data since information on the intended species is often not included. For instance, feed for commercial salmon aquaculture typically contains higher fish oil content than trout feed, and some species, such as catfish and tilapia, may be fed entirely vegetable-based feeds. Table 7. Contaminant Concentrations in Various Hatchery and Commercial Aquaculture Feeds and Applicable Regulations (mean concentrations unless otherwise noted).
Source ΣPCB (ng/g ww)
ΣDDT (ng/g ww)
ΣPBDE (ng/g ww)
Dioxin TEQ (pg/g ww)
Lipid (%) Ref.
Contaminant Levels in Feed
Feeds from 6 manufacturers used in 11 USF&WS National Fish Hatcheries
1.94* 11.33 nr 0.227 16.7 Maule et al., 2006
Mean of 8 commercial salmon aquaculture feeds from Scottish sources
105 12.1 5.1 nr 28.8 Jacobs et al., 2002
Mean of fish feed/fishmeal samples originating from Canada (n=14), U.S. (n=7), Iceland (n=1), Peru (n=1), and Russia (n=1)
Can.–30.7† U.S.–16.5† Ice.–12.1† Peru–0.6† Rus.–12.7†
Can.–21.1 U.S.–23.3 Ice.– <7 Peru–nr Rus.–nr
nr
Can.–1.0 U.S.–1.1 Ice.–0.23 Peru–ND Rus.–0.22
nr CFIA, 2006
Feed from the 2 largest global suppliers for commercial salmon aquaculture; 9 samples from North and South America and 4 samples from Europe
15 (approx. Amer.
median)
60 (approx. Eur.
median)
nr nr
1 (approx. Amer.
median)
4 (approx. Eur.
median)
nr Hites et al., 2004
Confidential nr nr nr 1.21 nr Hermann et al., 2004
WDFW trout hatchery feed 13.8 8.2 ND (<0.25) 0.75 16.8 present study,
2005 Regulatory Levels in Feed
U.S. Food and Drug Admin. 2,000 ne ne ne ne 21 CFR 109.30(a)(6)
European Union ne ne ne 2.25 ne Directive 2001/102/EC 21
*sum of 14 dioxin-like congeners †sum of 72 congeners nr - not reported ND – not detected ne - not established

Page 23
Maule et al. (2006) analyzed numerous batches of feeds used at eleven U.S. Fish and Wildlife Service (USF&WS) National Fish Hatcheries. They found a lower mean dioxin TEQ and ΣPCB than reported here, although the ΣPCB was derived from only 14 dioxin-like PCB congeners. Interestingly, the bulk of the dioxin TEQ was derived from 2,3,7,8-TCDD and 1,2,3,7,8-PeCDD similar to the feed samples analyzed for the present survey. ΣDDT and percent lipid contents were similar between the two studies. Comparison of contaminants in feed and salmon fillet from commercial aquaculture operations showed ΣPCB, ΣDDT, and ΣPBDE higher in feed compared to fish tissue at similar proportions to those reported here (Jacobs et al., 2002). Although the mean ΣDDT was similar to results for the present study, ΣPCB was an order of magnitude higher. The feeds, which were from Scottish sources, had much higher lipids (mean of 28.8%) than found here (mean of 16.8%). Hites et al. (2004) reported ΣPCB and dioxin TEQ levels approximately four-fold higher in commercial salmon aquaculture feeds from Europe compared to North and South America. Like other results, the Hites et al. (2004) study found POP concentrations slightly higher in feed compared to fish, on average, but lipid concentrations were not given. The Canadian Food Inspection Agency (CFIA) analyzed 24 samples originating primarily from Canada and the U.S., but also from Iceland, Peru, and Russia, although little additional information is provided about the samples (CFIA, 2006). ΣPCB for U.S., Icelandic, and Russian samples were similar to those reported here, while Canadian feed had about twice the concentration on average. DDT levels were about twice the levels reported in other samples, while the dioxin TEQs tended to be within ranges reported by other investigators. The only reported PBDE analysis of feed was done in the Jacobs et al. (2002) study which found ΣPBDE averaging 20 times the analytical reporting limits for the present study. PBDE-47 was the predominant congener found and, although not found in WDFW hatchery feeds, it was the major congener in rainbow trout from hatcheries and lakes and is one of the most abundant congeners found in Washington freshwater fish (Johnson and Olson, 2001). None of the average POP concentrations reported in these studies violated residue tolerances from the applicable regulations, with the exception of the European median dioxin TEQ reported by Hites et al. (2004). A study by Herrmann et al. (2004), designed specifically to look at compliance with EU standards, found a mean concentration of dioxin TEQ about one-half the EU residue tolerance. However, 95th percentile values for both fish feed (2.71 pg/g) and fish oil (6.30 pg/g) exceeded the dioxin TEQ standards.

Page 24
Depuration/Uptake of Contaminants in Lakes One of the underlying goals of this study was to determine if lakes act as purifying environments or if hatchery fish stocked in lakes accumulate additional contaminants. Cursory inspection of the data suggests depuration occurs for PCBs and chlorinated pesticides other than DDT compounds, and no differences are seen for ΣDDT (with the Fan Lake outlier removed) and ΣPBDE. Although pairwise comparisons show no statistical differences between ΣPCB in hatchery and lake rainbow trout, mean ΣPCB in hatchery fish are substantially higher, even when the outlier from Chelan Hatchery (67 ng/g) is removed. Part of the decrease in ΣPCB may be the significant decrease in lipid content of the planted fish. It is a well-known fact that PCB concentrations are often positively correlated with lipid in tissue. Lipid metabolism, and in particular lipid catabolysis, to meet energy requirements may mobilize lipids from muscle to high lipid organs such as the liver, kidney, and brain, thus decreasing muscle PCB concentrations (Jørgensen et al., 2002). Gamete production is another mechanism for transfer of PCBs due to loss of muscle lipids, although it is unlikely that the fish examined had reached sexual maturity. As mentioned previously, the absence of a strong correlation between lipids and ΣPCB suggests PCB concentrations are controlled by factors other than the percentage of lipid. One possible explanation for altered PCB concentrations is that some lakes allow PCBs to be shed from muscle tissue while others increase the PCB accumulated by fish. Molson, Warden, South Lewis County Park, and Lone lakes received fish with the highest ΣPCB, and all four lakes had the greatest depuration. Increases in ΣPCB only occurred where concentrations were low-to-moderate in hatchery fish (with the exception of the very small increase in Spokane Hatchery-Chapman Lake fish), suggesting net accumulation only occurs when PCB concentrations in tissue are initially low. ΣDDT concentrations were low in muscle tissue of hatchery rainbow trout precluding an opportunity to observe substantial depuration. As many lakes had increased levels of ΣDDT as had decreases, all small changes with the exception of Fan Lake. Fan Lake is a medium-sized (32 hectare) lake approximately 20 miles north of Spokane, situated in a small drainage basin (1,600 hectares). It is one of the lowermost in a chain of lakes along the West Branch of the Little Spokane River. Since the Fan Lake basin is relatively undeveloped and the lake is connected to other lakes only through its outlet, it appears unlikely that high ΣDDT accumulating in Fan Lake rainbow trout is a result of basin-wide or area-wide contamination.
Comparison of Tissue Concentrations to Applicable Criteria Criteria to protect human health from harmful pollutants in ingested water and fish were issued to Washington State in EPA’s 1992 National Toxics Rule (NTR, 40 CFR 131.36). The human health-based criteria, if met, will generally ensure that public health concerns do not arise, and that fish advisories are not needed. Sampling of either water or edible fish tissue may be conducted to assess compliance with the NTR criteria (Ecology, 1992), but tissue is generally

Page 25
preferred because POPs are often found at concentrations in water below reasonably available laboratory detection limits. It should be recognized that POPs exceeding the NTR criteria in fish tissue do not necessarily signal the need for a fish consumption advisory, nor does it imply the existence of a public health concern. Assessment of risks to the fishing public and consumption advice is carried out by the Washington State Department of Health (DOH), often based on data collected by Ecology and WDFW. While DOH supports Ecology’s use of the NTR criteria for identifying potentially contaminated waters and for developing source controls to keep water quality at or below criteria, it does not use the NTR criteria to establish fish advisories. Instead, DOH evaluates contaminants in fish tissue using established risk assessment paradigms. These include tools for:
1. Analysis of risks – calculating allowable meal limits based on known contaminant concentrations, estimates of exposure in specific groups or populations.
2. Risk management – e.g., reduction in contaminants through preparation and cooking techniques, known health benefits from fish consumption, contaminant concentrations or health risks associated with replacement foods, and cultural importance of fish.
3. Risk communication – the outreach component of a fish advisory or a conclusion that an advisory is unnecessary.
Table 8 shows NTR criteria for chemicals analyzed in the present 2005 survey compared to concentrations in rainbow trout. NTR criteria have not been established either for PBDEs or for some of the chlorinated pesticides analyzed here. There are 15 instances where contaminants in rainbow trout exceed NTR criteria. Most of the exceedances are for ΣPCB (three lakes and six hatcheries), followed by dieldrin (one lake and four hatcheries) and 4,4’-DDE (one lake). In all, seven of the eleven hatchery samples (including Troutlodge) exceeded NTR criteria for at least one chemical, and five of the ten planted fish samples exceeded the criteria. When criteria are not met, the waterbody is considered impaired and placed on the federal Clean Water Act section 303(d) list and may require a Total Maximum Daily Load (TMDL) study to address the impairment. TMDLs identify the sources of a pollutant and allocate pollutant loads among sources in order to bring the waterbody in compliance with standards. One of the questions this study sought to answer is whether contaminants accumulated by fish in hatcheries could contribute, in whole or in part, to the water quality impairment of a waterbody and its consequent addition to the 303(d) list. This question was not intended to be directed at the lakes analyzed in the present survey. Instead, at issue is whether hatchery-derived contamination is worthy of inquiry by investigators who are conducting surveys on individual lakes and streams where the source of contamination is uncertain and where waterbodies may be considered for 303(d) listing.

Page 26
Table 8. National Toxics Rule Criteria Compared to Contaminant Residues in Hatchery and Planted Rainbow Trout Fillet (ng/g ww except pg/g ww for 2,3,7,8-TCDD).
Contaminant Criterion Concentrations in present study
No. of Criterion Exceedances
Location(s) of Criterion Exceedance
ΣPCB 5.3 4.85 - 67 9
Chapman Lake Molson Lake
South Lewis Co. Park Pond Chelan Hatchery
Columbia Basin Hatchery Mossyrock Hatchery
Troutlodge Arlington Hatchery Spokane Hatchery
4,4'-DDT 32 0.14 - 1.9 4,4'-DDE 32 1.9 - 45 1 Fan Lake 4,4'-DDD 45 0.29 - 9.6 2,3,7,8-TCDD 0.07 0.011 - 0.053 Aldrin 0.65 ND
Dieldrin 0.65 0.32 - 0.88 5
Warden Lake Mossyrock Hatchery Spokane Hatchery Arlington Hatchery
Eells Springs Hatchery Endrin 3,216 ND Endrin Aldehyde 3,216 ND alpha-BHC 1.7 ND beta-BHC 1.6 ND gamma-BHC (Lindane) 8.2 ND Chlordane (total) 8.3 ND Endosulfan I 540 ND Endosulfan II 540 ND Endosulfan Sulfate 540 ND Heptachlor 2.4 ND Heptachlor Epoxide 1.2 ND Hexachlorobenzene 6.7 0.10 - 0.73 Toxaphene 9.8 ND
ND - not detected To examine this question on a statewide basis, results of the present survey were compared to all of the data on contaminants in tissue in Washington. In order to provide a suitably comparable data set, data that met the following conditions were extracted from Ecology’s Environmental Information Management (EIM) database; 1) samples analyzed since 1998, 2) results only for rainbow trout, brown trout, and cutthroat trout since these are the primary resident species raised to catchable size at WDFW hatcheries, and 3) fillet data only. Only results for ΣPCB, 4,4’-DDE, and dieldrin were selected since these were the contaminants found here that exceeded NTR criteria. Waterbodies known to have large sources of these chemicals (e.g., Spokane River for PCBs, Yakima River for 4,4’-DDE and dieldrin) were removed.

Page 27
Figure 4 shows the cumulative distribution of all ΣPCB data for fish in Washington using the selection process previously described. Sixty percent of the 46 samples exceed the NTR criterion, and approximately 50% of samples statewide had concentrations that fall into the range of detectable ΣPCB concentrations in hatchery rainbow trout, excluding the Chelan Hatchery sample. One hundred percent of samples fall into the hatchery ΣPCB range when all of the hatchery rainbows are considered.
1
10
100
0 20 40 60 80 100Cumulative Frequency (%)
ΣPC
B C
onc.
(ng/
g w
w)
Chelan Hatchery RBT
Hatchery RBT
NTR Criterion (5.3 ng/g)
non-detect level
Figure 4. Cumulative Frequency Distribution of ΣPCB Concentrations in Fillet Tissue of Rainbow Trout (RBT), Cutthroat Trout, and Brown Trout from Washington Lakes and Streams. (Open circles represent data from lakes sampled in the present survey. Solid gray lines bound the range of detected ΣPCB concentrations in hatchery fish. Dashed line is the NTR criterion for ΣPCBs.)

Page 28
Only two of the 38 trout samples (5%) exceed the NTR criterion for 4,4’-DDE, including the Fan Lake result found in the present survey (Figure 5). Approximately 40% of the samples are within the hatchery fish range, with more than 70% falling below the maximum 4,4’-DDE level in hatchery rainbows.
0.1
1
10
100
0 20 40 60 80 100Cumulative Frequency (%)
4,4'
-DD
E C
onc.
(ng/
g w
w)
Hatchery RBT
NTR Criterion (32 ng/g)
non-detect level
Figure 5. Cumulative Frequency Distribution of 4,4’-DDE Concentrations in Fillet Tissue of Rainbow Trout (RBT), Cutthroat Trout, and Brown Trout from Washington Lakes and Streams. (Open circles represent data from lakes sampled in the present survey. Solid gray lines bound the range of detected 4,4’-DDE concentrations in hatchery fish. Dashed line is the NTR criterion for 4,4’-DDE.)

Page 29
None of the 38 samples screened from the EIM database had detectable levels of dieldrin; North Lake and Warden Lake are the only “unpolluted” sites where dieldrin has been detected in common trout species (Figure 6). Dieldrin in Warden Lake rainbow trout (0.76 ng/g) exceeds the NTR criterion (0.65 ng/g).
0.1
0.3
0.5
0.7
0.9
0 20 40 60 80 100Cumulative Frequency (%)
Die
ldrin
Con
c. (n
g/g
ww
)
Hatchery RBT
NTR Criterion (0.65 ng/g)
non-detect level
Figure 6. Cumulative Frequency Distribution of Dieldrin Concentrations in Fillet Tissue of Rainbow Trout (RBT), Cutthroat Trout, and Brown Trout from Washington Lakes and Streams. (Open circles represent data from lakes sampled in the present survey. Solid gray lines bound the range of detected dieldrin concentrations in hatchery fish. Dashed line is the NTR criterion for dieldrin.)

Page 30
There are several inferences that may be drawn from these comparisons to screened data. One supposition is that some portion of POPs found in trout is derived from burdens obtained at a hatchery, although this presumes that the fish were planted. However, there is no concomitant information on the origin of the fish used for these comparisons. The extent of hatchery-derived POPs remaining in planted fish is variable and appears to depend largely on the amount of time lapsed since stocking. Trout caught around the time of opening day – typically mid-to-late April – will have contaminant concentrations nearly identical to concentrations found in fish just prior to their removal from hatcheries. It appears that as the fishing season progresses, the concentrations in fillet tissue generally decrease, particularly for PCBs and some chlorinated pesticides, although this is a pattern which is less consistent for DDT compounds and PBDEs. Unfortunately, the planted cohorts that were sampled for each hatchery-planted pair could not be sampled further to track fillet concentrations during subsequent periods. One of the implications of these results, particularly from the practical standpoint of a regulatory agency, is that waterbodies may be included on the 303(d) list due to contamination stemming from hatcheries. Taken further, 303(d) listed waters often require a TMDL to assess contaminant sources. Sources considered for TMDLs are typically point sources (e.g., piped effluent) and nonpoint sources (e.g., agricultural and urban runoff, atmospheric deposition) which normally occur in the vicinity of the impaired waterbody. However, no known TMDLs in Washington have included hatchery fish as a contaminant source. For PCBs, and to a lesser extent dieldrin, hatchery fish may contribute to impairment and, in some cases, may cause the bulk of impairment. Therefore, TMDL investigators may want to consider including hatchery fish as contaminant sources among other sources.

Page 31
Conclusions Rainbow trout acquire low-to moderate concentrations of persistent organic pollutants (POPs) while residing at Washington Department of Fish and Wildlife (WDFW) hatcheries. Feed used to raise rainbow trout to catchable size (≥6”) contains concentrations of PCBs, DDT compounds, PCDD/Fs, and several additional chlorinated pesticides at higher wet-weight concentrations than in fillet tissue of the fish specimens analyzed, suggesting that the POP accumulation pathway is primarily through the feed. This is consistent with findings of other aquacultural studies, although other possible pathways of contaminant accumulation were not examined for this study. Low levels of PBDEs were also present in rainbow trout tissue, but were not detected in trout feed. Fish feed is high in lipids and shows variable amounts of contaminants, but POP concentrations were not correlated with the percent lipid in feed samples. This suggests the source of lipids, largely derived from marine oil, is an important determinant in POP concentrations. The positive correlation between feed and fish ΣPCB and between feed and fish ΣDDT supports the conclusion that feed is the primary contaminant source to hatchery fish. WDFW trout hatchery feed has POP concentrations similar or lower than feeds analyzed in other studies, and appears to have much lower PCB concentrations than feeds used in commercial salmon aquaculture. It appears that fillet tissue concentrations of some POPs, particularly PCBs, decrease following stocking in lakes, although this finding is inconclusive. ΣDDT concentrations may increase in the lake environment even as fillet lipid concentrations decrease significantly. Fish from only one location – Fan Lake in Pend Oreille County – showed a substantial increase in contaminants (DDT compounds) following residence in the wild. In the 21 rainbow trout fillet samples analyzed (11 from hatcheries including Troutlodge and 10 from lakes), there are 15 instances where contaminants exceed (do not meet) regulatory criteria. Most of the exceedances are for ΣPCB (three lakes and six hatcheries), followed by dieldrin (one lake and four hatcheries) and 4,4’-DDE (one lake). Considering the POP levels in catchable rainbow trout just prior to planting, it appears likely that at least part of the contaminant burden is hatchery-derived, with the notable exception of DDT compounds in Fan Lake as described previously. Based on comparisons between waterbodies in Washington State and POP data reported here, it is possible that trout caught in “unpolluted” lakes and streams contain contaminants originating from WDFW hatcheries. It is also possible that some listings for impaired waters, particularly listings for PCBs, may be due to hatchery-contaminated fish. Therefore, Total Maximum Daily Load (TMDL) project managers may want to consider hatchery fish as a source of contaminant loads.

Page 32
Recommendations Based on results of this 2005 study, it is recommended that fish feed and trout fillet tissue sampling be expanded to include all 26 WDFW hatcheries raising catchable trout. Samples should be analyzed for the persistent organic pollutants (POPs) in the present study, with PCDD/F analysis included for all samples. Water in hatcheries should also be sampled where contaminant levels in fish are exceptionally high. Any water sampling should be performed using semi-permeable membrane devices or other methods to achieve low detection limits for POPs. More data are needed to assess depuration or accumulation of contaminants in catchable trout following planting in lakes. Ideally, fish could be sampled during several periods to better track trends in contaminant levels over time. Whole fish analysis should also be considered along with fillet sampling, to determine if contaminant burdens are conserved in fish following mobilization of lipids in muscle tissue. A review of the current 303(d) list should be conducted to identify cases where tissue data used to assess impairment may have come from WDFW catchable trout plants. TMDL project managers should consider the implications of hatchery fish as a possible source of contaminants to waterbodies being assessed.

Page 33
References Carline, R.F., P.M. Barry, and H.G. Ketola, 2004. Dietary Uptake of Polychlorinated Biphenyls
(PCBs) by Rainbow Trout. North American Journal of Aquaculture 66:91-99. CFIA, 2003. Polychlorinated Biphenyls (PCBs) in Marine Oils. Canadian Food Inspection
Agency, Animal Health and Products Division, Nepean, Ontario. Memorandum T-3-109. CFIA, 2006. Summary Report of Contaminant Results in Fish Feed, Fish Meal, and Fish Oil.
Canadian Food Inspection Agency. Accessed 1/17/2006 at www.inspection.gc.ca/english/anima/feebet/dioxe.shtml.
Code of Federal Regulations (CFR), Title 21, Chapter 1, Part 109 – Unavoidable Contaminants
in Food for Human Consumption and Food-Packaging Materials, §109.30 – Tolerances for polychlorinated biphenyls (PCB’s).
Code of Federal Regulations (CFR), Title 40, Chapter 1, Part 131 – Water Quality Standards,
§131.36 Toxics criteria for those states not complying with Clean Water Act section 303(c)(2)(B).
Council of the European Union, Council Directive 2001/102/EC of 27 November 2001
amending Council Directive 1999/29/EC on undesirable substances and products in animal nutrition.
Ecology, 1992. Assessment of Water Quality for the Section 303(d) List. Washington State
Department of Ecology, Water Quality Program, Olympia, WA. WQP Policy 1-11. www.ecy.wa.gov/programs/wq/303d/2002/303d_policy_final.pdf
EPA, 2000. Guidance for Assessing Chemical Contaminant Data for Use in Fish Advisories -
Volume 1: Fish Sampling and Analysis, Third Edition. U.S. Environmental Protection Agency, Office of Water, Washington, D.C. EPA 823-B-00-007.
Hermann, T., C. Collingro, and O. Paepke, 2004. PCDDs/PCDFs and Dioxin-like PCBs in Fish,
Fish Products, and Fish Feed. Dioxin 2004: 24th International Symposium on Halogenated Environmental Organic Pollutants and Persistent Organic Pollutants (POPs), September 6-10, 2004, Berlin.
Hites, R.A., J.A. Foran, D.O. Carpenter, N.C. Hamilton, B.A. Knuth, and S.J. Schwager, 2004.
Global Assessment of Organic Contaminants in Farmed Salmon. Science 303:226-229. Jacobs, M.N., A. Covaci, and P. Schepens, 2002. Investigation of Selected Persistent Organic
Pollutants in Farmed Atlantic Salmon (Salmo salar), Salmon Aquaculture Feed, and Fish Oil Components of the Feed. Environmental Science and Technology 36:2797-2805.

Page 34
Johnson, A. and N. Olson, 2001. Analysis and Occurrence of Polybrominated Diphenyl Ethers in Washington State Freshwater Fish. Archives of Environmental Toxicology and Chemistry 41:339-344. Pub. No. 01-03-033. www.ecy.wa.gov/biblio/0103033.html
Jørgensen, E.H., M.M. Vijayan, N. Aluru, and A.G. Maule, 2002. Fasting Modifies Aroclor
1254 Impact on Plasma Cortisol, Glucose, and Lactate Response to a Handling Disturbance in Arctic Charr. Comparative Biochemistry and Physiology, C 132:235-245.
Maule, A.G., A. Gannam, and J. Davis, 2006. A Survey of Chemical Constituents in National
Fish Hatchery Fish Feed. U.S. Geological Survey, Columbia River Research Laboratory, Cook, WA.
Millard, M.J., J.G. Geiger, D. Kuzmeskus, W. Archaumbault, and T.J. Kubiak, 2004.
Contaminant Loads in Broodstock Fish in the Region 5 National Fish Hatchery System. United States Fish & Wildlife Service Informational Bulletin.
Seiders, K., 2003. Washington State Toxics Monitoring Program: Toxic Contaminants in
Fish Tissue and Surface Water in Freshwater Environments, 2001. Washington State Department of Ecology, Olympia, WA. Pub. No. 03-02-012. www.ecy.wa.gov/biblio/0302012.html
Seiders, K. and K. Kinney, 2004. Washington State Toxics Monitoring Program: Toxic
Contaminants in Fish Tissue and Surface Water in Freshwater Environments, 2002. Washington State Department of Ecology, Olympia, WA. Pub. No. 04-03-040. www.ecy.wa.gov/biblio/0403040.html
SPSS, Inc., 1998. SYSTAT Version 9.01. Van den Berg, M., L.Birnbaum, A.T.C. Bosveld, B. Brunstrőm, P. Cook, M. Feeley, P. Giesy,
A. Hanberg, R. Hasegawa, S.W. Kennedy, T. Kubiak, J.C. Larsen, F.X.R. van Leeuwan, A.K.D. Liem, C. Nolt, R.E. Peterson, L. Poellinger, S. Safe, D. Schrenk, D. Tillitt, M. Tysklind, M. Younes, F. Wærn, and T. Zacharewski, 1998. Toxic Equivalency Factors (TEFs) for PCBs, PCDDs, and PCDFs for Humans and Wildlife. Environmental Health Perspectives 106:775-792.
Zar, J.H., 1984. Biostatistical Analysis. Second Edition. Prentice Hall, Englewood Cliffs, NJ.

Page 35
Appendices
Appendix A – Glossary of Acronyms and Units 303(d) – Section 303(d) of the federal Clean Water Act CFIA – Canadian Food Inspection Agency DDD – 1,1-dichloro-2,2-bis(p-chlorophenyl)ethane DDE – 1,1-dichloro-2,2-bis(p-chlorophenyl)ethylene DDT – 1,1,1-trichloro-2,2-bis(p-chlorophenyl)ethane DOH – Washington State Department of Health ECD – electron capture detector Ecology – Washington State Department of Ecology EIM – Environmental Information Management EPA – U.S. Environmental Protection Agency EU – European Union GC – gas chromatography MEL – Manchester Environmental Laboratory MS – mass spectrometry NIST – National Institute of Standards and Technology NTR – National Toxics Rule PBDE – polybrominated diphenyl ether PCB – polychlorinated biphenyl PCDD – polychlorinated dibenzo-p-dioxin PCDF – polychlorinated dibenzofuran POP – persistent organic pollutant SRM – standard reference material TEF – toxic equivalency factor TEQ – toxic equivalent TMDL – total maximum daily load (water cleanup plan) USF&WS – U.S. Fish and Wildlife Service WDFW – Washington Department of Fish and Wildlife ww – wet weight Σ – sum of Units of measurement ng/g – nanograms per gram (parts per billion) pg/g – picograms per gram (parts per trillion)

Page 36
Appendix B – Target Analytes and Reporting Limits Table B. Target Analytes and Reporting Limits
Analyte
Reporting Limit
(ng/g ww) Analyte
Reporting Limit
(ng/g ww)
Analyte
Reporting Limit
(pg/g ww)
PCBs Chlorinated Pesticides PCDDs/PCDFs Aroclor-1016 2.3 – 5.0 2,4'-DDE 0.47 – 1.0 2,3,7,8-TCDD 0.03 – 0.05 Aroclor-1221 2.3 – 5.0 2,4'-DDD 0.47 – 1.0 1,2,3,7,8-PeCDD 0.07 – 0.11 Aroclor-1232 2.3 – 5.0 2,4'-DDT 0.47 – 1.0 1,2,3,4,7,8-HxCDD 0.05 – 0.2 Aroclor-1242 2.3 – 5.0 4,4'-DDT 0.47 – 1.0 1,2,3,6,7,8-HxCDD 0.05 – 0.2 Aroclor-1248 2.3 – 5.0 4,4'-DDE 0.47 – 1.0 1,2,3,7,8,9-HxCDD 0.05 – 0.2 Aroclor-1254 2.3 – 5.0 4,4'-DDD 0.47 – 1.0 1,2,3,4,6,7,8-HpCDD 0.05 – 0.2 Aroclor-1260 2.3 – 5.0 DDMU 0.47 – 1.0 OCDD 0.36
Aldrin 0.47 – 1.0 2,3,7,8-TCDF 0.03 – 0.05 PBDEs Dieldrin 0.47 – 10 1,2,3,7,8-PeCDF 0.06 – 0.1 PBDE-47 0.23 – 0.65 Endrin 0.96 – 10 2,3,4,7,8-PeCDF 0.04 – 0.12 PBDE-66 0.25 – 0.50 Endrin Aldehyde 0.96 – 10 1,2,3,4,7,8-HxCDF 0.2 PBDE-71 0.25 – 0.50 Endrin Ketone 0.96 – 10 1,2,3,6,7,8-HxCDF 0.05 – 0.1 PBDE-99 0.25 – 0.50 alpha-BHC 0.47 – 1.0 2,3,4,6,7,8-HxCDF 0.05 – 0.2 PBDE-100 0.25 – 0.50 beta-BHC 0.47 – 1.0 1,2,3,7,8,9-HxCDF 0.05 – 0.2 PBDE-138 0.25 – 0.50 gamma-BHC (Lindane) 0.47 – 1.0 1,2,3,4,6,7,8-HpCDF 0.05 – 0.2 PBDE-153 0.25 – 0.50 delta-BHC 0.47 – 1.0 1,2,3,4,7,8,9-HpCDF 0.05 – 0.2 PBDE-154 0.25 – 0.50 cis-Chlordane (alpha) 0.47 – 1.0 OCDF 0.21 – 0.23 PBDE-183 0.25 – 0.50 trans-Chlordane (gamma) 0.47 – 1.0 PBDE-190 0.25 – 0.50 Oxychlordane 0.47 – 1.0 PBDE-209 1.2 – 6.2 Chlordane (technical) 0.98 – 5.0 Chlorpyriphos 0.96 – 10 Dacthal (DCPA) 0.96 – 10 Endosulfan I 0.96 – 10 Endosulfan II 0.96 – 10 Endosulfan Sulfate 0.96 – 10 Heptachlor 0.47 – 1.0 Heptachlor Epoxide 0.96 – 10 Hexachlorobenzene 0.47 – 1.0 Methoxychlor 0.47 – 1.0 Mirex 0.47 – 1.0 cis-Nonachlor 0.47 – 1.0 trans-Nonachlor 0.47 – 1.0 Pentachloroanisole 0.47 – 1.0 Toxaphene 0.98 – 10

Page 37
Appendix C – Complete Results of Lipid and Contaminant Analysis Table C-1. Complete Results of Percent Lipids and PCB Aroclor Analysis of Feed and Fish Tissue Samples (ng/g ww)
Sample Number
Lipids (%)
PCB-aroclor 1016
PCB-aroclor 1221
PCB-aroclor 1232
PCB-aroclor 1242
PCB-aroclor 1248
PCB-aroclor 1254
PCB-aroclor 1260
PCB-aroclor 1262
PCB-aroclor 1268
Hatchery Feed
Arlington 5144102 18.19 2.5 UJ 2.5 UJ 2.5 UJ 2.7 J 5.5 UJ 8.1 J 3 J 2.5 UJ 2.5 UJ Chelan 5144096 13.75 2.5 U 2.5 U 2.5 U 5 UJ 8 NJ 18 8.8 2.5 U 2.5 U Columbia Basin 5144098 14.47 2.4 UJ 2.4 UJ 2.4 UJ 2.4 UJ 4.7 UJ 7.6 J 4 J 2.4 UJ 2.4 UJ Eells Spring 5144103 12.7 2.4 UJ 2.4 UJ 2.4 UJ 2.6 J 4.6 UJ 6.9 J 3 J 2.4 UJ 2.4 UJ Ford 5144099 25.75 2.5 UJ 2.5 UJ 2.5 UJ 2.5 UJ 2.5 UJ 2.5 UJ 2.5 UJ 2.5 UJ 2.5 UJ Ford-Dup 5144099-Dup 25.95 2.5 U 2.5 U 2.5 U 2.5 U 2.5 U 2.5 U 2.5 U 2.5 U 2.5 U Mossyrock 5144097 19.64 2.5 UJ 2.5 UJ 2.5 UJ 3.8 J 10 UJ 16 J 7.8 J 2.5 UJ 2.5 UJ Puyallup 5144104 15.75 2.5 UJ 2.5 UJ 2.5 UJ 2.5 UJ 2.5 UJ 2.5 UJ 2.5 UJ 2.5 UJ 2.5 UJ Puyallup-Dup 5144104-Dup 16.52 2.5 U 2.5 U 2.5 U 2.5 U 2.5 U 2.5 U 2.5 U 2.5 U 2.5 U Spokane 5144100 15.79 2.5 UJ 2.5 UJ 2.5 UJ 2.8 J 6.1 UJ 9.3 J 4.3 J 2.5 UJ 2.5 UJ Tucannon 5144101 15.01 2.5 UJ 2.5 UJ 2.5 UJ 2.5 UJ 2.8 J 5.4 NJ 2.5 UJ 2.5 UJ 2.5 UJ Vancouver 5144095 16.08 2.5 UJ 2.5 UJ 2.5 UJ 2.6 J 5.5 UJ 7.7 NJ 3 J 2.5 UJ 2.5 UJ
Hatchery Rainbows
Arlington 5144087 3.97 2.5 U 2.5 U 2.5 U 2.1 J 3.5 UJ 6.5 NJ 3.5 J 2.5 U 2.5 U Chelan 5144081 3.05 2.4 U 2.4 U 2.4 U 8.5 UJ 20 NJ 47 3.4 UJ 2.4 U 2.4 U Columbia Basin 5144083 4.1 2.5 U 2.5 U 2.5 U 2.5 U 3.5 J 9 6 3.6 UJ 2.5 U Eells Spring 5144088 2.7 2.5 U 2.5 U 2.5 U 2.5 U 2.5 U 2.5 U 2.5 U 2.5 U 2.5 U Eells Spring-Dup 5144088-Dup 2.13 2.4 U 2.4 U 2.4 U 2.4 U 2.4 U 2.4 U 2.4 U 2.4 U 2.4 U Ford 5144084 2.35 2.5 U 2.5 U 2.5 U 2.5 U 2.5 U 2.5 U 2.5 U 2.5 U 2.5 U Mossyrock 5144082 2.69 2.4 U 2.4 U 2.4 U 2.4 U 4.8 UJ 9 J 6.8 J 2.4 U 2.4 U Puyallup 5144089 3.07 2.3 U 2.3 U 2.3 U 2.3 U 2.3 U 2.3 U 2.3 U 2.3 U 2.3 U Spokane 5144085 2.48 2.5 U 2.5 U 2.5 U 2.5 U 2.6 J 5.2 NJ 3.9 J 2.5 U 2.5 U Troutlodge 5144090 5.39 2.4 U 2.4 U 2.4 U 2.6 J 5.6 UJ 7.9 3.9 J 2.4 U 2.4 U Tucannon 5144086 3.69 2.4 U 2.4 U 2.4 U 2.4 U 2.4 U 2.4 U 2.4 U 2.4 U 2.4 U Vancouver 5144080 4.86 2.5 U 2.5 U 2.5 U 2.5 U 3.2 NJ 3.6 NJ 2.9 NJ 2.5 U 2.5 U Vancouver-Dup 5144080-Dup 3.14 2.5 U 2.5 U 2.5 U 2.5 U 2.5 U 2.5 U 2.5 U 2.5 U 2.5 U

Page 38
Table C-1 (cont’d). Complete Results of Percent Lipids and PCB Aroclor Analysis of Feed and Fish Tissue Samples (ng/g ww)
Sample Number
Lipids (%)
PCB-aroclor 1016
PCB-aroclor 1221
PCB-aroclor 1232
PCB-aroclor 1242
PCB-aroclor 1248
PCB-aroclor 1254
PCB-aroclor 1260
PCB-aroclor 1262
PCB-aroclor 1268
Planted Rainbows
Chapman Lake 5248102 0.44 5 U 5 U 5 U 5 U 5 U 6.7 J 5.1 J 5 U 5 U Donnie Lake 5248103 1.29 5 U 5 U 5 U 5 U 5 U 5 U 5 U 5 U 5 U Fan Lake 5248104 2.66 5 U 5 U 5 U 5 U 5 U 5 U 5 U 5 U 5 U Lacamas Lake 5248100 1.5 5 U 5 U 5 U 5 U 5 U 5 U 5 U 5 U 5 U Lone Lake 5248108 1.63 4.9 U 4.9 U 4.9 U 4.9 U 4.9 U 4.9 U 4.9 U 4.9 U 4.9 U Lone Lake-Dup 5248108-Dup 1.71 4.8 U 4.8 U 4.8 U 4.8 U 4.8 U 4.8 U 4.8 U 4.8 U 4.8 U Molson Lake 5248101 2.05 4.9 U 4.9 U 4.9 U 4.9 U 4.9 U 8.6 J 4.9 U 4.9 U 4.9 U North Lake 5248106 0.65 4.9 U 4.9 U 4.9 U 4.9 U 4.9 U 4.9 U 4.9 U 4.9 U 4.9 U South Lewis Co. Park Pond 5248105 0.77 4.9 U 4.9 U 4.9 U 4.9 U 4.9 U 5.9 J 4.9 U 4.9 U 4.9 U Summit Lake 5248109 0.35 4.8 U 4.8 U 4.8 U 4.8 U 4.8 U 4.7 J 4.8 U 4.8 U 4.8 U Summit Lake-Dup 5248109-Dup 0.45 5.0 U 5.0 U 5.0 U 5.0 U 5.0 U 5.2 J 5.0 U 5.0 U 5.0 U Warden Lake 5248107 0.61 4.9 U 4.9 U 4.9 U 4.9 U 4.9 U 4.9 U 4.9 U 4.9 U 4.9 U
U - Analyte was not detected at or above the reported result UJ - Analyte was not detected at or above the reported estimated result J - Analyte was positively identified. The associated numerical result is an estimate NJ - There is evidence that the analyte is present. The associated numerical result is an estimate Dup - Duplicate

Page 39
Table C-2. Complete Results of DDT Analysis of Feed and Fish Tissue Samples (ng/g ww)
Sample Number 2,4'-DDD 2,4'-DDE 2,4'-DDT 4,4'-DDD 4,4'-DDE 4,4'-DDT
Hatchery Feed
Arlington 5144102 0.37 J 0.49 U 0.49 U 2.3 2.8 0.78 NJ Chelan 5144096 0.57 UJ 0.5 U 0.5 U 3.1 4.8 1.5 Columbia Basin 5144098 0.28 J 0.49 U 0.49 U 1.4 4.4 0.21 J Eells Spring 5144103 0.38 J 0.48 U 0.48 U 2 2.8 0.72 J Ford 5144099 0.12 J 0.5 U 0.12 J 0.61 2.3 0.31 J Ford- Dup 5144099-Dup 0.17 J 0.5 U 0.13 J 0.86 2.4 0.38 J Mossyrock 5144097 0.43 J 0.5 U 0.5 U 3.4 6 1.2 NJ Puyallup 5144104 0.32 J 0.5 U 0.15 J 1.2 4.3 0.49 J Puyallup-Dup 5144104-Dup 0.3 J 0.49 U 0.15 J 1.4 4.3 NJ 0.55 Spokane 5144100 0.2 J 0.5 U 0.5 U 0.77 4.2 0.7 NJ Tucannon 5144101 0.85 0.5 U 0.16 J 4.4 15 0.7 J Vancouver 5144095 0.43 J 0.5 U 0.5 U 2.1 2.6 0.69 J
Hatchery Rainbows
Arlington 5144087 0.12 J 0.49 U 0.49 U 0.84 3.8 0.49 U Chelan 5144081 0.49 U 0.49 U 0.49 U 0.7 2.8 0.6 NJ Columbia Basin 5144083 0.5 U 0.61 UJ 0.5 U 1.8 3.9 0.77 NJ Eells Spring 5144088 0.1 J 0.5 U 0.5 U 0.55 1.8 0.25 J Eells Spring-Dup 5144088-Dup 0.49 U 0.49 U 0.49 U 0.5 1.9 0.24 J Ford 5144084 0.49 U 0.49 U 0.49 U 0.33 J 2.2 0.49 U Mossyrock 5144082 0.48 U 0.48 U 0.48 U 0.91 2.7 0.24 NJ Puyallup 5144089 0.47 U 0.47 U 0.47 U 0.29 J 2 0.14 J Spokane 5144085 0.49 U 0.49 U 0.49 U 0.52 2.2 0.2 J Troutlodge 5144090 0.15 J 0.49 U 0.49 U 1.5 3.4 0.65 J Tucannon 5144086 0.49 U 0.49 U 0.49 U 0.52 4.6 0.18 J Vancouver 5144080 0.5 U 0.5 U 0.5 U 0.7 4 0.26 J Vancouver-Dup 5144080-Dup 0.12 J 0.5 U 0.5 U 0.59 2.1 0.27 J
Planted Rainbows
Chapman Lake 5248102 1 U 1 U 1 U 1 U 5.1 1 U Donnie Lake 5248103 1 U 1 U 1 U 1 U 3.6 1 U Fan Lake 5248104 1 U 1 U 1 U 9.6 J 45 1.9 J Lacamas Lake 5248100 1 U 1 U 1 U 1 U 3.0 1 U Lone Lake 5248108 0.98 U 0.98 U 0.98 U 0.98 U 1.9 J 0.98 U Lone Lake-Dup 5248108-Dup 0.97 U 0.97 U 0.97 U 0.97 U 1.9 J 0.97 U Molson Lake 5248101 0.98 U 0.98 U 0.98 U 0.98 U 5.8 0.98 U North Lake 5248106 0.97 U 0.97 U 0.97 U 0.97 U 2.9 0.97 U South Lewis Co. Park Pond 5248105 0.96 U 0.98 U 0.98 U 0.96 U 2.4 0.96 UJ Summit Lake 5248109 0.96 U 0.96 U 0.96 U 0.96 U 3.0 0.96 U Summit Lake-Dup 5248109-Dup 1.0 U 1.0 U 1.0 U 1.0 U 3.3 1.0 U Warden Lake 5248107 0.97 U 0.97 U 0.97 U 0.97 U 3.7 0.97 U
U - Analyte was not detected at or above the reported result UJ - Analyte was not detected at or above the reported estimated result J - Analyte was positively identified. The associated numerical result is an estimate NJ - There is evidence that the analyte is present. The associated numerical result is an estimate

Page 40
Table C-3. Complete Results of PBDE Analysis of Feed and Fish Tissue Samples (ng/g ww)
Sample Number PBDE-047 PBDE-066 PBDE-071 PBDE-099 PBDE-100 PBDE-138
Hatchery Feed
Arlington 5144102 0.25 UJ 0.25 UJ 0.25 UJ 0.25 UJ 0.25 UJ 0.25 UJ Chelan 5144096 0.25 UJ 0.25 UJ 0.25 UJ 0.25 UJ 0.25 UJ 0.25 UJ Columbia Basin 5144098 0.24 UJ 0.24 UJ 0.24 UJ 0.24 UJ 0.24 UJ 0.24 UJ Eells Spring 5144103 0.24 UJ 0.24 UJ 0.24 UJ 0.24 UJ 0.24 UJ 0.24 UJ Ford 5144099 0.25 UJ 0.25 UJ 0.25 UJ 0.25 UJ 0.25 UJ 0.25 UJ Ford-Dup 5144099-Dup 0.25 UJ 0.25 UJ 0.25 UJ 0.25 UJ 0.25 UJ 0.25 UJ Mossyrock 5144097 0.25 UJ 0.25 UJ 0.25 UJ 0.25 UJ 0.25 UJ 0.25 UJ Puyallup 5144104 0.25 U 0.25 U 0.25 U 0.25 U 0.25 U 0.25 U Puyallup-Dup 5144104-Dup 0.25 U 0.25 U 0.25 U 0.25 U 0.25 U 0.25 U Spokane 5144100 0.25 UJ 0.25 UJ 0.25 UJ 0.25 UJ 0.25 UJ 0.25 UJ Tucannon 5144101 0.25 UJ 0.25 UJ 0.25 UJ 0.25 UJ 0.25 UJ 0.25 UJ Vancouver 5144095 0.25 UJ 0.25 UJ 0.25 UJ 0.25 UJ 0.25 UJ 0.25 UJ
Hatchery Rainbows
Arlington 5144087 0.64 0.24 U 0.24 U 0.24 U 0.24 U 0.24 U Chelan 5144081 0.95 0.24 U 0.14 J 0.24 U 0.24 U 0.24 U Columbia Basin 5144083 0.65 J 0.25 U 0.16 J 0.089 NJ 0.25 U 0.25 U Eells Spring 5144088 0.55 0.25 U 0.25 U 0.25 U 0.25 U 0.25 U Eells Spring-Dup 5144088-Dup 0.49 0.24 U 0.24 U 0.24 U 0.24 U 0.24 U Ford 5144084 0.24 J 0.25 U 0.25 U 0.25 U 0.25 U 0.25 U Mossyrock 5144082 0.73 0.24 U 0.16 J 0.24 U 0.24 U 0.24 U Puyallup 5144089 0.24 0.23 U 0.23 U 0.23 U 0.23 U 0.23 U Spokane 5144085 0.55 0.25 U 0.25 U 0.25 U 0.11 J 0.1 J Troutlodge 5144090 0.62 0.24 U 0.15 J 0.07 J 0.24 U 0.24 U Tucannon 5144086 0.27 0.24 U 0.24 U 0.24 U 0.24 U 0.24 U Vancouver 5144080 0.72 0.25 U 0.13 J 0.25 U 0.25 U 0.25 U Vancouver-Dup 5144080-Dup 0.56 0.25 U 0.25 U 0.25 U 0.25 U 0.25 U
Planted Rainbows
Chapman Lake 5248102 0.91 0.5 U 0.5 U 0.1 NJ 0.5 U 0.5 U Donnie Lake 5248103 0.25 J 0.5 U 0.5 U 0.5 U 0.5 U 0.5 U Fan Lake 5248104 0.4 J 0.5 U 0.5 U 0.5 U 0.5 U 0.5 U Lacamas Lake 5248100 0.29 J 0.5 U 0.5 U 0.5 U 0.13 J 0.5 U Lone Lake 5248108 0.65 0.49 U 0.49 U 0.24 J 0.15 J 0.49 U Lone Lake-Dup 5248108-Dup 0.54 0.48 U 0.48 U 0.13 J 0.20 J 0.48 U Molson Lake 5248101 0.49 UJ 0.49 UJ 0.49 UJ 0.49 UJ 0.49 UJ 0.49 UJ North Lake 5248106 0.78 0.48 U 0.48 U 0.29 J 0.16 J 0.48 U South Lewis Co. Park Pond 5248105 1 0.49 U 0.49 U 0.33 J 0.49 U 0.49 U Summit Lake 5248109 0.87 0.48 U 0.48 U 0.12 J 0.14 J 0.48 U Summit Lake-Dup 5248109-Dup 0.65 U 0.50 U 0.50 U 0.50 U 0.50 U 0.50 U Warden Lake 5248107 0.46 J 0.48 U 0.48 U 0.48 U 0.48 U 0.48 U

Page 41
Table C-3 (cont’d). Complete Results of PBDE Analysis of Feed and Fish Tissue Samples (ng/g ww)
Sample Number PBDE-153 PBDE-154 PBDE-183 PBDE-190 PBDE-209
Hatchery Feed Arlington 5144102 0.25 UJ 0.25 UJ 0.25 UJ 0.25 UJ 1.2 UJ Chelan 5144096 0.25 UJ 0.25 UJ 0.25 UJ 0.25 UJ 1.2 UJ Columbia Basin 5144098 0.24 UJ 0.24 UJ 0.24 UJ 0.24 UJ 1.2 UJ Eells Spring 5144103 0.24 UJ 0.24 UJ 0.24 UJ 0.24 UJ 1.2 UJ Ford 5144099 0.25 UJ 0.25 UJ 0.25 UJ 0.25 UJ 1.2 UJ Ford-Dup 5144099-Dup 0.25 UJ 0.25 UJ 0.25 UJ 0.25 UJ 1.2 UJ Mossyrock 5144097 0.25 UJ 0.25 UJ 0.25 UJ 0.25 UJ 1.2 UJ Puyallup 5144104 0.25 U 0.25 U 0.25 U 0.25 U 1.2 U Puyallup-Dup 5144104-Dup 0.25 U 0.25 U 0.25 U 0.25 U 1.2 U Spokane 5144100 0.25 UJ 0.25 UJ 0.25 UJ 0.25 UJ 1.2 UJ Tucannon 5144101 0.25 UJ 0.25 UJ 0.25 UJ 0.25 UJ 1.2 UJ Vancouver 5144095 0.25 UJ 0.25 UJ 0.25 UJ 0.25 UJ 1.2 UJ
Hatchery Rainbows
Arlington 5144087 0.24 U 0.24 U 0.24 U 0.24 U 3.1 U Chelan 5144081 0.24 U 0.24 U 0.24 U 0.24 U 3 U Columbia Basin 5144083 0.25 U 0.25 U 0.25 U 0.25 U 3.1 U Eells Spring 5144088 0.25 U 0.25 U 0.25 U 0.25 U 3.1 U Eells Spring-Dup 5144088-Dup 0.24 U 0.24 U 0.24 U 0.24 U 3.0 U Ford 5144084 0.25 U 0.25 U 0.25 U 0.25 U 3.1 U Mossyrock 5144082 0.24 U 0.24 U 0.24 U 0.24 U 3 U Puyallup 5144089 0.23 U 0.23 U 0.23 U 0.23 U 2.9 U Spokane 5144085 0.25 U 0.25 U 0.25 U 0.25 U 0.34 J Troutlodge 5144090 0.24 U 0.24 U 0.24 U 0.24 U 3 U Tucannon 5144086 0.24 U 0.24 U 0.24 U 0.24 U 3 U Vancouver 5144080 0.25 U 0.25 U 0.25 U 0.25 U 3.1 U Vancouver-Dup 5144080-Dup 0.25 U 0.25 U 0.25 U 0.25 U 3.1 U
Planted Rainbows Chapman Lake 5248102 0.5 U 0.5 U 0.5 U 0.5 U 6.2 U Donnie Lake 5248103 0.5 U 0.5 U 0.5 U 0.5 U 6.2 U Fan Lake 5248104 0.5 U 0.5 U 0.5 U 0.5 U 6.2 U Lacamas Lake 5248100 0.5 U 0.5 U 0.5 U 0.5 U 6.2 U Lone Lake 5248108 0.49 U 0.49 U 0.49 U 0.49 U 6.1 U Lone Lake-Dup 5248108-Dup 0.48 U 0.48 U 0.48 U 0.48 U 6.0 U Molson Lake 5248101 0.49 UJ 0.49 UJ 0.49 UJ 0.49 UJ 2.4 UJ North Lake 5248106 0.48 U 0.48 U 0.48 U 0.48 U 6.1 U South Lewis Co. Park Pond 5248105 0.49 U 0.49 U 0.49 U 0.49 U 6.1 U Summit Lake 5248109 0.48 U 0.48 U 0.48 U 0.48 U 6 U Summit Lake-Dup 5248109-Dup 0.50 U 0.50 U 0.50 U 0.50 U 6.2 U Warden Lake 5248107 0.48 U 0.48 U 0.48 U 0.48 U 6.1 U
U - Analyte was not detected at or above the reported result UJ - Analyte was not detected at or above the reported estimated result J - Analyte was positively identified. The associated numerical result is an estimate

Page 42
Table C-4. Complete Results of PCDD/F Analysis of Feed Samples (pg/g ww)
Vancouver Hatchery Mossyrock Hatchery Ford Hatchery Ford Hatchery Spokane Hatchery Sample Number TEF Sample
05144105 TEQ Sample 05144106 TEQ Sample
05144107 TEQ Sample 05144107-Dup TEQ Sample
05144108 TEQ
2,3,7,8-TCDF 0.1 0.525 0.0525 0.798 0.0798 0.182 0.0182 0.222 0.0222 1.4 0.14
1,2,3,7,8-PeCDF 0.05 0.251 J 0.01255 0.591 0.02955 0.1 UJ 0 0.115 J 0.00575 0.218 J 0.0109
2,3,4,7,8-PeCDF 0.5 0.126 J 0.063 0.226 J 0.113 0.12 UJ 0 0.12 UJ 0 0.246 J 0.123
1,2,3,4,7,8-HxCDF 0.1 0.2 UJ 0 0.2 UJ 0 0.2 UJ 0 0.2 UJ 0 0.2 UJ 0
1,2,3,6,7,8-HxCDF 0.1 0.1 UJ 0 0.1 UJ 0 0.1 UJ 0 0.1 UJ 0 0.1 UJ 0
2,3,4,6,7,8-HxCDF 0.1 0.2 UJ 0 0.2 UJ 0 0.2 UJ 0 0.2 UJ 0 0.2 UJ 0
1,2,3,7,8,9-HxCDF 0.1 0.2 UJ 0 0.2 UJ 0 0.2 UJ 0 0.2 UJ 0 0.2 UJ 0
1,2,3,4,6,7,8-HpCDF 0.01 0.2 UJ 0 0.207 J 0.00207 0.2 UJ 0 0.2 UJ 0 0.2 UJ 0
1,2,3,4,7,8,9-HpCDF 0.01 0.2 UJ 0 0.2 UJ 0 0.2 UJ 0 0.2 UJ 0 0.2 UJ 0
OCDF 0.0001 0.404 J 0.00004 0.403 J 0.00004 0.32 J 0.00003 0.344 J 0.00003 0.377 J 0.00004
2,3,7,8-TCDD 1 0.186 0.186 0.367 0.367 0.05 UJ 0 0.05 UJ 0 0.192 0.192
1,2,3,7,8-PeCDD 1 0.215 J 0.215 0.534 0.534 0.11 UJ 0 0.11 UJ 0 0.637 0.637
1,2,3,4,7,8-HxCDD 0.1 0.2 UJ 0 0.2 UJ 0 0.2 UJ 0 0.2 UJ 0 0.2 UJ 0
1,2,3,6,7,8-HxCDD 0.1 0.235 J 0.0235 0.494 0.0494 0.2 UJ 0 0.2 UJ 0 0.437 0.0437
1,2,3,7,8,9-HxCDD 0.1 0.2 UJ 0 0.333 0.0333 0.2 UJ 0 0.2 UJ 0 0.339 0.0339
1,2,3,4,6,7,8-HpCDD 0.01 0.857 0.00857 1.6 0.016 0.524 0.00524 0.474 0.00474 1.25 0.0125
OCDD 0.0001 8.14 0.00081 16.5 0.00165 3.38 0.00034 3.3 0.00033 11.5 0.00115
TEQ total 0.56197 1.22581 0.02381 0.03305 1.19419
TEF - Toxicity Equivalence Factor from Van den Berg et al., 1998 TEQ - Toxic Equivalent UJ - The analyte was not detected at or above the reported estimated result J - The analyte was positively identified. The associated numerical value is an estimate

Page 43
Table C-5. Complete Results of PCDD/F Analysis of Rainbow Trout Tissue Samples (pg/g ww)
Vancouver Hatchery Mossyrock Hatchery Ford Hatchery Ford Hatchery Spokane Hatchery Sample Number TEF Sample
05144092 TEQ Sample 05144093 TEQ Sample
05144091 TEQ Sample 05144091-Dup TEQ Sample
05144094 TEQ
2,3,7,8-TCDF 0.1 0.187 0.0187 0.282 0.0282 0.037 J 0.0037 0.042 J 0.0042 0.163 0.0163
1,2,3,7,8-PeCDF 0.05 0.111 J 0.00555 0.143 J 0.00715 0.06 UJ 0 0.06 UJ 0 0.06 UJ 0
2,3,4,7,8-PeCDF 0.5 0.041 J 0.0205 0.04 UJ 0 0.04 UJ 0 0.04 UJ 0 0.04 UJ 0
1,2,3,4,7,8-HxCDF 0.1 0.07 J 0.007 0.051 J 0.0051 0.075 J 0.0075 0.053 J 0.0053 0.067 J 0.0067
1,2,3,6,7,8-HxCDF 0.1 0.05 UJ 0 0.05 UJ 0 0.05 UJ 0 0.05 UJ 0 0.05 UJ 0
2,3,4,6,7,8-HxCDF 0.1 0.06 UJ 0 0.06 UJ 0 0.06 UJ 0 0.06 UJ 0 0.06 UJ 0
1,2,3,7,8,9-HxCDF 0.1 0.06 UJ 0 0.06 UJ 0 0.06 UJ 0 0.06 UJ 0 0.06 UJ 0
1,2,3,4,6,7,8-HpCDF 0.01 0.095 J 0.00095 0.078 J 0.00078 0.094 J 0.00094 0.105 J 0.00105 0.082 J 0.00082
1,2,3,4,7,8,9-HpCDF 0.01 0.05 UJ 0 0.05 UJ 0 0.05 UJ 0 0.05 UJ 0 0.05 UJ 0
OCDF 0.0001 0.31 J 0.00003 0.225 J 0.00002 0.313 J 0.00003 0.289 J 0.00003 0.336 J 0.00003
2,3,7,8-TCDD 1 0.03 UJ 0 0.03 UJ 0 0.03 UJ 0 0.03 UJ 0 0.03 UJ 0
1,2,3,7,8-PeCDD 1 0.07 UJ 0 0.07 UJ 0 0.07 UJ 0 0.07 UJ 0 0.07 UJ 0
1,2,3,4,7,8-HxCDD 0.1 0.10000 UJ 0 0.10000 UJ 0 0.10000 UJ 0 0.10000 UJ 0 0.10000 UJ 0
1,2,3,6,7,8-HxCDD 0.1 0.08 UJ 0 0.08 UJ 0 0.08 UJ 0 0.08 UJ 0 0.08 UJ 0
1,2,3,7,8,9-HxCDD 0.1 0.05 UJ 0 0.05 UJ 0 0.05 UJ 0 0.05 UJ 0 0.05 UJ 0
1,2,3,4,6,7,8-HpCDD 0.01 0.08 UJ 0 0.08 UJ 0 0.08 UJ 0 0.08 UJ 0 0.08 UJ 0
OCDD 0.0001 0.36 UJ 0 0.36 UJ 0 0.36 UJ 0 0.36 UJ 0 0.36 UJ 0
TEQ total 0.05273 0.04125 0.01217 0.01058 0.02385
TEF - Toxicity Equivalence Factor from Van den Berg et al., 1998 TEQ - Toxic Equivalent UJ - The analyte was not detected at or above the reported estimated result J - The analyte was positively identified. The associated numerical value is an estimate

Page 44
Table C-5. Complete Results of Chlorinated Pesticide (Excluding DDT Compounds) Analysis of Feed and Fish Tissue Samples (ng/g ww)
Sample Number Aldrin Alpha-BHC Beta-BHC Chlordane Chlor-
pyriphos cis-
Chlordane
Hatchery Feed
Arlington 5144102 0.49 UJ 0.49 U 0.49 U 2.5 U 2.5 UJ 0.52
Chelan 5144096 0.5 UJ 0.5 U 0.5 U 2.5 U 2.5 U 0.5 U
Columbia Basin 5144098 0.49 UJ 0.49 U 0.49 U 2.4 U 2.4 U 0.68 NJ
Eells Spring 5144103 0.48 UJ 0.48 U 0.48 U 2.4 U 2.4 UJ 0.47 NJ
Ford 5144099 0.5 UJ 0.5 U 0.5 U 2.5 U 2.5 U 0.19 J
Ford-Dup 5144099-Dup 0.50 UJ 0.50 U 0.50 U 2.5 U 2.5 UJ 0.25 J
Mossyrock 5144097 0.5 UJ 0.5 U 0.5 U 2.5 U 2.5 U 1.2 NJ
Puyallup 5144104 0.5 UJ 0.5 U 0.5 U 2.5 U 10 UJ 0.5 U
Puyallup-Dup 5144104-Dup 0.49 UJ 0.49 U 0.49 U 2.5 U 9.9 UJ 0.49 U
Spokane 5144100 0.5 UJ 0.5 U 0.5 U 2.5 U 2.5 UJ 0.39 NJ
Tucannon 5144101 0.5 UJ 0.5 U 0.5 U 2.5 U 2.5 UJ 0.5 U
Vancouver 5144095 0.5 UJ 0.5 U 0.5 U 2.5 U 2.5 U 0.52
Hatchery Rainbows
Arlington 5144087 0.49 UJ 0.49 U 0.49 U 2.5 U 2.5 U 0.24 NJ
Chelan 5144081 0.49 UJ 0.49 U 0.49 U 2.4 U 2.4 U 0.49 U
Columbia Basin 5144083 0.5 UJ 0.5 U 0.5 U 2.5 U 2.5 U 0.25 NJ
Eells Spring 5144088 0.5 UJ 0.5 U 0.5 U 2.5 U 2.5 U 0.5 U
Eells Spring-Dup 5144088-Dup 0.49 UJ 0.49 U 0.49 U 2.4 U 2.4 U 0.49 U
Ford 5144084 0.49 UJ 0.49 U 0.49 U 2.5 U 2.5 U 0.49 U
Mossyrock 5144082 0.48 UJ 0.48 U 0.48 U 2.4 U 2.4 U 0.31 NJ
Puyallup 5144089 0.47 UJ 0.47 U 0.47 U 2.3 U 2.3 U 0.47 U
Spokane 5144085 0.49 UJ 0.49 U 0.49 U 2.5 U 2.5 U 0.49 U
Troutlodge 5144090 0.49 UJ 0.49 U 0.49 U 2.4 U 1.2 J 0.44 NJ
Tucannon 5144086 0.49 UJ 0.49 U 0.49 U 2.4 U 2.4 U 0.17 J
Vancouver 5144080 0.5 UJ 0.5 U 0.5 U 2.5 U 2.5 U 0.2 NJ
Vancouver-Dup 5144080-Dup 0.50 UJ 0.50 U 0.50 U 2.5 U 2.5 U 0.17 NJ
Planted Rainbows
Chapman Lake 5248102 1 UJ 1 UJ 1 U 5 U 4 U 1 U
Donnie Lake 5248103 1 UJ 1 UJ 1 U 5 U 4 U 1 U
Fan Lake 5248104 1 UJ 1 UJ 1 U 5 U 4 U 1 U
Lacamas Lake 5248100 1 UJ 1 UJ 1 U 5 U 4 U 1 U
Lone Lake 5248108 0.98 UJ 0.98 UJ 0.98 U 0.98 U 3.9 U 0.98 U
Lone Lake-Dup 5248108-Dup 0.97 UJ 0.97 UJ 0.97 U 4.8 U 3.9 U 0.97 U
Molson Lake 5248101 0.98 UJ 0.98 UJ 0.98 U 4.9 U 3.9 U 0.98 U
North Lake 5248106 0.97 UJ 0.97 UJ 0.97 U 4.9 U 3.9 U 0.97 U
South Lewis Co. Park Pond 5248105 0.98 UJ 0.96 UJ 0.96 U 2.4 U 0.96 U 0.96 UJ
Summit Lake 5248109 0.96 UJ 0.96 UJ 0.96 U 4.8 U 3.8 U 0.96 U
Summit Lake-Dup 5248109-Dup 1.0 UJ 1.0 UJ 1.0 U 5.0 U 4.0 U 1.0 U
Warden Lake 5248107 0.97 UJ 0.97 UJ 0.97 U 4.9 U 3.9 U 0.97 U

Page 45
Table C-5 (cont’d). Complete Results of Chlorinated Pesticide (Excluding DDT Compounds) Analysis of Feed and Fish Tissue Samples (ng/g ww)
Sample Number cis-Nonachlor Dacthal
(DCPA) DDMU Delta-BHC Dieldrin
Hatchery Feed
Arlington 5144102 0.49 U 2.5 UJ 0.69 NJ 0.49 UJ 2.5 UJ
Chelan 5144096 0.5 U 2.5 U 1.5 NJ 0.5 UJ 2.5 U
Columbia Basin 5144098 0.49 U 2.4 UJ 0.73 NJ 0.49 UJ 2.4 UJ
Eells Spring 5144103 0.48 U 2.4 UJ 0.58 NJ 0.48 UJ 2.4 UJ
Ford 5144099 0.5 U 2.5 UJ 0.4 NJ 0.5 UJ 2.5 UJ
Ford-Dup 5144099-Dup 0.50 U 2.5 UJ 0.50 U 0.50 UJ 2.5 UJ
Mossyrock 5144097 0.5 U 2.5 U 1.2 NJ 0.5 UJ 3.8 NJ
Puyallup 5144104 0.5 U 10 UJ 1.1 NJ 0.5 UJ 10 UJ
Puyallup-Dup 5144104-Dup 0.49 U 0.49 UJ 1.0 NJ 0.49 UJ 9.9 UJ
Spokane 5144100 0.5 U 2.5 UJ 0.85 NJ 0.5 UJ 2.5 UJ
Tucannon 5144101 0.5 U 2.5 UJ 3.9 NJ 0.5 UJ 2.5 UJ
Vancouver 5144095 0.5 U 2.5 U 0.6 NJ 0.5 UJ 2.5 U
Hatchery Rainbows
Arlington 5144087 0.49 U 2.5 U 0.9 NJ 0.49 UJ 0.77 J
Chelan 5144081 0.49 U 2.4 U 0.52 NJ 0.49 UJ 0.58 NJ
Columbia Basin 5144083 0.5 U 2.5 U 0.63 NJ 0.5 UJ 0.5 J
Eells Spring 5144088 0.5 U 2.5 U 0.5 U 0.5 UJ 0.75 J
Eells Spring-Dup 5144088-Dup 0.49 U 2.4 U 0.49 U 0.49 UJ 0.63 NJ
Ford 5144084 0.49 U 2.5 U 0.49 U 0.49 UJ 0.49 UJ
Mossyrock 5144082 0.48 U 2.4 U 0.48 U 0.48 UJ 0.88 NJ
Puyallup 5144089 0.47 U 2.3 U 0.47 U 0.47 UJ 0.47 UJ
Spokane 5144085 0.49 U 2.5 U 0.49 U 0.49 UJ 0.78 J
Troutlodge 5144090 0.49 U 2.4 U 0.49 NJ 0.49 UJ 0.75 J
Tucannon 5144086 0.49 U 2.4 U 0.62 0.49 UJ 0.49 UJ
Vancouver 5144080 0.5 U 2.5 U 0.5 U 0.5 UJ 0.33 NJ
Vancouver-Dup 5144080-Dup 0.50 U 2.5 U 0.50 U 0.50 UJ 0.30 J
Planted Rainbows
Chapman Lake 5248102 1.0 U 4.0 U 1.0 U 1.0 UJ 0.79 UJ
Donnie Lake 5248103 1.0 U 4.0 U 1.0 U 1.0 UJ 0.79 UJ
Fan Lake 5248104 1.0 U 4.0 U 4.4 1.0 UJ 0.80 UJ
Lacamas Lake 5248100 1.0 U 4.0 U 1.0 U 1.0 UJ 0.80 UJ
Lone Lake 5248108 0.98 U 3.9 U 0.98 U 0.98 UJ 0.78 UJ
Lone Lake-Dup 5248108-Dup 0.97 U 3.9 U 0.97 U 0.97 UJ 0.78 UJ
Molson Lake 5248101 0.98 U 3.9 U 0.98 U 0.98 UJ 0.78 UJ
North Lake 5248106 0.97 U 3.9 U 0.97 U 0.97 UJ 0.55 NJ
South Lewis Co. Park Pond 5248105 0.96 U 0.96 U 0.98 U 0.96 U 0.96 U
Summit Lake 5248109 0.96 U 3.8 U 0.96 U 0.96 UJ 0.77 UJ
Summit Lake-Dup 5248109-Dup 1.0 U 4.0 U 1.0 U 1.0 UJ 0.80 UJ
Warden Lake 5248107 0.97 U 3.9 U 0.97 U 0.97 UJ 0.76 NJ

Page 46
Table C-5 (cont’d). Complete Results of Chlorinated Pesticide (Excluding DDT Compounds) Analysis of Feed and Fish Tissue Samples (ng/g ww)
Sample Number
Endo- sulfan I
Endo- sulfan II
Endo- sulfan Sulfate
Endrin Endrin Aldehyde
Endrin Ketone
Hatchery Feed
Arlington 5144102 2.5 UJ 2.5 UJ REJ 2.5 UJ REJ REJ
Chelan 5144096 2.5 U 2.5 UJ REJ 2.5 U REJ REJ
Columbia Basin 5144098 2.4 UJ 2.4 UJ REJ 2.4 UJ REJ REJ
Eells Spring 5144103 2.4 UJ 2.4 UJ REJ 2.4 UJ REJ REJ
Ford 5144099 2.5 UJ 2.5 UJ REJ 2.5 UJ REJ REJ
Ford-Dup 5144099-Dup 2.5 UJ 2.5 UJ REJ 2.5 UJ REJ REJ
Mossyrock 5144097 2.5 U 2.5 UJ REJ 2.5 U REJ REJ
Puyallup 5144104 10 UJ 10 UJ 10 UJ 10 UJ 10 UJ 10 UJ
Puyallup-Dup 5144104-Dup 9.9 UJ 9.9 UJ 9.9 UJ 9.9 UJ 9.9 UJ 9.9 UJ
Spokane 5144100 2.5 UJ 2.5 UJ REJ 2.5 UJ REJ REJ
Tucannon 5144101 2.5 UJ 2.5 UJ REJ 2.5 UJ REJ REJ
Vancouver 5144095 2.5 U 2.5 UJ REJ 2.5 U REJ REJ
Hatchery Rainbows
Arlington 5144087 2.5 U 2.5 UJ REJ 2.5 U REJ REJ
Chelan 5144081 2.4 U 2.4 UJ REJ 2.4 U REJ REJ
Columbia Basin 5144083 2.5 U 2.5 UJ REJ 2.5 U REJ REJ
Eells Spring 5144088 2.5 U 2.5 UJ REJ 2.5 U REJ REJ
Eells Spring-Dup 5144088-Dup 2.4 U 2.4 UJ REJ 2.4 U REJ REJ
Ford 5144084 2.5 U 2.5 UJ REJ 2.5 U REJ REJ
Mossyrock 5144082 2.4 U 2.4 UJ REJ 2.4 U REJ REJ
Puyallup 5144089 2.3 U 2.3 UJ REJ 2.3 U REJ REJ
Spokane 5144085 2.5 U 2.5 UJ REJ 2.5 U REJ REJ
Troutlodge 5144090 2.4 U 2.4 UJ REJ 2.4 U REJ REJ
Tucannon 5144086 2.4 U 2.4 UJ REJ 2.4 U REJ REJ
Vancouver 5144080 2.5 U 2.5 UJ REJ 2.5 U REJ REJ
Vancouver-Dup 5144080-Dup 2.5 U 2.5 UJ REJ 2.5 U REJ REJ
Planted Rainbows
Chapman Lake 5248102 4.0 U 4.0 U 4.0 UJ 4.0 U 4.0 UJ 4.0 U
Donnie Lake 5248103 4.0 U 4.0 U 4.0 UJ 4.0 U 4.0 UJ 4.0 U
Fan Lake 5248104 4.0 U 4.0 U 4.0 UJ 4.0 U 4.0 UJ 4.0 U
Lacamas Lake 5248100 4.0 U 4.0 U 4.0 UJ 4.0 U 4.0 UJ 4.0 U
Lone Lake 5248108 3.9 U 3.9 U 3.9 UJ 3.9 U 3.9 UJ 3.9 U
Lone Lake-Dup 5248108-Dup 3.9 U 3.9 U 3.9 UJ 3.9 U 3.9 UJ 3.9 U
Molson Lake 5248101 3.9 U 3.9 U 3.9 UJ 3.9 U 3.9 UJ 3.9 U
North Lake 5248106 3.9 U 3.9 U 3.9 UJ 3.9 U 3.9 UJ 3.9 U
South Lewis Co. Park Pond 5248105 0.96 U 0.96 U 0.96 UJ 0.96 U 0.96 UJ 0.96 U
Summit Lake 5248109 3.8 U 3.8 U 3.8 UJ 3.8 U 3.8 UJ 3.8 U
Summit Lake-Dup 5248109-Dup 4.0 U 4.0 U 4.0 UJ 4.0 U 4.0 UJ 4.0 U
Warden Lake 5248107 3.9 U 3.9 U 3.9 UJ 3.9 U 3.9 UJ 3.9 U

Page 47
Table C-5 (cont’d). Complete Results of Chlorinated Pesticide (Excluding DDT Compounds) Analysis of Feed and Fish Tissue Samples (ng/g ww)
Sample Number Heptachlor Heptachlor
Epoxide Hexachloro
-benzene Lindane Methoxy- chlor Mirex
Hatchery Feed
Arlington 5144102 0.49 U 2.5 UJ 0.16 J 0.49 U 2.5 UJ 0.49 UJ
Chelan 5144096 0.5 U 2.5 U 0.31 J 0.5 U 2.5 UJ 0.5 UJ
Columbia Basin 5144098 0.49 U 2.4 UJ 0.49 UJ 0.49 U 2.4 UJ 0.49 UJ
Eells Spring 5144103 0.48 U 2.4 UJ 0.15 J 0.48 U 2.4 UJ 0.48 UJ
Ford 5144099 0.5 U 2.5 UJ 0.16 J 0.5 U 2.5 UJ 0.5 UJ
Ford-Dup 5144099-Dup 0.50 U 2.5 UJ 0.19 J 0.50 U 2.5 UJ 0.50 UJ
Mossyrock 5144097 0.5 U 2.5 U 0.3 J 0.5 U 2.2 J 0.5 UJ
Puyallup 5144104 0.5 U 10 UJ 0.5 UJ 0.5 U 4.9 J 0.5 UJ
Puyallup-Dup 5144104-Dup 0.49 U 9.9 UJ 0.10 J 0.49 U 4.0 J 0.49 UJ
Spokane 5144100 0.5 U 2.5 UJ 0.12 J 0.5 U 2.5 UJ 0.5 UJ
Tucannon 5144101 0.5 U 2.5 UJ 0.16 J 0.5 U 2.5 UJ 0.5 UJ
Vancouver 5144095 0.5 U 2.5 U 0.17 J 0.5 U 2.5 UJ 0.5 UJ
Hatchery Rainbows
Arlington 5144087 0.49 U 0.49 U 0.23 J 0.49 U 2.5 U 0.49 U
Chelan 5144081 0.49 U 0.49 U 0.49 U 0.49 U 2.4 U 0.49 U
Columbia Basin 5144083 0.5 U 0.5 U 0.5 U 0.5 U 2.5 U 0.5 U
Eells Spring 5144088 0.5 U 0.5 U 0.5 U 0.5 U 2.5 U 0.5 U
Eells Spring-Dup 5144088-Dup 0.49 U 0.49 U 0.49 U 0.49 U 2.4 U 0.49 U
Ford 5144084 0.49 U 0.49 U 0.49 U 0.49 U 2.5 U 0.49 U
Mossyrock 5144082 0.48 U 0.48 U 0.48 U 0.48 U 2.4 U 0.48 U
Puyallup 5144089 0.47 U 0.47 U 0.47 U 0.47 U 2.3 U 0.47 U
Spokane 5144085 0.49 U 0.49 U 0.1 J 0.49 U 2.5 U 0.49 U
Troutlodge 5144090 0.49 U 0.49 U 0.49 U 0.49 U 2.4 U 0.49 U
Tucannon 5144086 0.49 U 0.49 U 0.49 U 0.49 U 2.4 U 0.49 U
Vancouver 5144080 0.5 U 0.5 U 0.3 NJ 0.5 U 2.5 U 0.5 U
Vancouver-Dup 5144080-Dup 0.50 U 0.50 U 0.50 U 0.50 U 2.5 U 0.50 U
Planted Rainbows
Chapman Lake 5248102 1 U 0.79 UJ 1 U 1 U 4 U 1 U
Donnie Lake 5248103 1 U 0.79 UJ 1 U 1 U 4 U 1 U
Fan Lake 5248104 1 U 0.8 UJ 1 U 1 U 4 U 1 U
Lacamas Lake 5248100 1 U 0.8 UJ 1 U 1 U 4 U 1 U
Lone Lake 5248108 0.98 U 0.78 UJ 0.98 U 0.98 U 3.9 U 0.98 U
Lone Lake-Dup 5248108-Dup 0.97 U 0.78 UJ 0.97 U 0.97 U 3.9 U 0.97 U
Molson Lake 5248101 0.98 U 0.78 UJ 0.98 U 0.98 U 3.9 U 0.98 U
North Lake 5248106 0.97 U 0.78 UJ 0.97 U 0.97 U 3.9 U 0.97 U
South Lewis Co. Park Pond 5248105 0.98 U 0.96 U 0.98 U 0.96 U 0.96 U 0.98 U
Summit Lake 5248109 0.96 U 0.77 UJ 0.69 J 0.96 U 3.8 U 0.96 U
Summit Lake-Dup 5248109-Dup 1.0 U 0.80 UJ 0.76 J 1.0 U 4.0 U 1.0 U
Warden Lake 5248107 0.97 U 0.78 UJ 0.97 U 0.97 U 3.9 U 0.97 U

Page 48
Table C-5 (cont’d). Complete Results of Chlorinated Pesticide (Excluding DDT Compounds) Analysis of Feed and Fish Tissue Samples (ng/g ww)
Sample Number Oxychlordane Pentachloro
-anisole Toxaphene trans-Chlordane
trans-Nonachlor
Hatchery Feed
Arlington 5144102 0.49 U 0.49 UJ 4.9 U 0.49 U 0.68 Chelan 5144096 0.5 U 0.5 UJ 5 U 1.1 NJ 1.1 NJ Columbia Basin 5144098 0.49 U 0.49 UJ 3.9 NJ 0.2 J 0.7 Eells Spring 5144103 0.48 U 0.48 UJ 4.8 U 0.19 J 0.44 J Ford 5144099 0.5 U 0.5 UJ 5 U 0.5 U 0.15 J Ford-Dup 5144099-Dup 0.50 U 0.50 UJ 5.0 U 0.50 U 0.16 J Mossyrock 5144097 0.5 U 0.15 J 5 U 0.2 NJ 1.2 Puyallup 5144104 0.5 U 0.5 UJ 3.6 J 0.5 U 0.5 U Puyallup-Dup 5144104-Dup 0.49 U 0.49 UJ 4.9 U 0.49 U 0.49 U Spokane 5144100 0.5 U 0.5 UJ 2.6 J 0.5 U 0.8 Tucannon 5144101 0.5 U 0.11 J 5 U 0.5 U 0.3 J Vancouver 5144095 0.5 U 0.5 UJ 5 U 0.5 U 0.77 J
Hatchery Rainbows
Arlington 5144087 0.49 U 0.49 U 4.9 U 0.49 U 0.27 J Chelan 5144081 0.49 U 0.49 U 4.9 U 0.49 U 0.42 J Columbia Basin 5144083 0.5 U 0.5 U 5 U 0.5 U 0.45 J Eells Spring 5144088 0.5 U 0.5 U 5 U 0.5 U 0.2 J Eells Spring-Dup 5144088-Dup 0.49 U 0.49 U 4.9 U 0.49 U 0.17 J Ford 5144084 0.49 U 0.49 U 4.9 U 0.49 U 0.49 U Mossyrock 5144082 0.48 U 0.48 U 4.8 U 0.48 U 0.3 NJ Puyallup 5144089 0.47 U 0.47 U 4.7 U 0.47 U 0.094 J Spokane 5144085 0.49 U 0.49 U 4.9 U 0.49 U 0.49 U Troutlodge 5144090 0.49 U 0.49 U 4.9 U 0.49 U 0.57 J Tucannon 5144086 0.49 U 0.18 J 4.9 U 0.49 U 0.12 NJ Vancouver 5144080 0.5 U 0.21 J 5 U 0.5 U 0.3 J Vancouver-Dup 5144080-Dup 0.50 U 0.50 U 5.0 U 0.50 U 0.20 J
Planted Rainbows
Chapman Lake 5248102 1 U 1 U 9.9 U 1 U 1 U Donnie Lake 5248103 1 U 1 U 9.9 U 1 U 1 U Fan Lake 5248104 1 U 1 U 10 U 1 U 1 U Lacamas Lake 5248100 1 U 0.47 J 10 U 1 U 1 U Lone Lake 5248108 0.98 U 0.98 U 0.98 U 0.98 U 0.98 U Lone Lake-Dup 5248108-Dup 0.97 U 0.97 U 9.7 U 0.97 U 0.97 U Molson Lake 5248101 0.98 U 0.98 U 9.8 U 0.98 U 0.98 U North Lake 5248106 0.97 U 0.97 U 9.7 U 0.97 U 0.97 U South Lewis Co. Park Pond 5248105 0.96 U 0.96 U 9.6 U 0.96 U 0.98 U Summit Lake 5248109 0.96 U 0.96 U 9.6 U 0.96 U 0.96 U Summit Lake-Dup 5248109-Dup 1.0 U 1.0 U 10 U 1.0 U 1.0 U Warden Lake 5248107 0.97 U 0.97 U 9.7 U 0.97 U 0.97 U
Dup – Duplicate U - Analyte was not detected at or above the reported result UJ - Analyte was not detected at or above the reported estimated result J - Analyte was positively identified. The associated numerical result is an estimate NJ - There is evidence that the analyte is present. The associated numerical result is an estimate REJ - Data are unusable for all purposes