Embed Size (px)
Citation preview
Persistent Organic Pollutants and Vitamins in
Northern Fur Seals (Callorhinus ursinus) Collected
from St. Paul Island, Alaska as Part of the Alaska
Marine Mammal Tissue Archival Project
John Kucklick, Jessica Reiner, Michele Schantz, Jennifer Keller, Jennifer
Hoguet, Catherine Rimmer, Tamika Ragland, Rebecca Pugh, Amanda
Moors, Jody Rhoderick, Jennifer Ness, Danielle Peterson, Paul Becker
http://dx.doi.org/10.6028/NIST.IR.7958
NISTIR 7958
NISTIR 7958
Persistent Organic Pollutants and Vitamins in
Northern Fur Seals (Callorhinus ursinus) Collected
from St. Paul Island, Alaska as Part of the Alaska
Marine Mammal Tissue Archival Project
John Kucklick, Jessica Reiner, Michele Schantz, Jennifer Keller, Jennifer
Hoguet, Catherine Rimmer, Tamika Ragland, Rebecca Pugh, Amanda
Moors, Jody Rhoderick, Jennifer Ness, Danielle Peterson, Paul Becker
August 2013
U.S. Department of Commerce Rebecca Blank, Acting Secretary
National Institute of Standards and Technology
Patrick D. Gallagher, Director
ABSTRACT
Liver and blubber samples from 50 juvenile male northern fur seals (Callorhinus ursinus) were
collected on St. Paul Island from four different seal rookeries between 1987 and 2007. Samples
were analyzed for vitamins and for both legacy and current‐use persistent organic pollutants
(POPs). The resultant data set provides information on how concentrations of the two groups
of POPs are changing with time in the northern fur seal population. Legacy POPs determined
included polychlorinated biphenyl congeners (PCBs), dichlorodiphenyltrichloroethane (DDT)
and metabolites, chlorobenzenes, toxaphene, chlordane‐related compounds, and mirex. With
the exception of mirex, all legacy compounds showed statistically significant declines with
sampling year consistent with trends observed in marine mammals from other northern areas
such as the Canadian Arctic. Overall, concentrations of legacy POPs are similar to levels seen in
seal samples from other areas of the North Pacific Ocean and the Bering Sea and are
considerably lower (factor of 10 or greater) than observed in marine mammals from temperate
regions of the United States. The current‐use brominated flame retardants, polybrominated
diphenyl ether (PBDE) and hexabromocyclododecane (HBCD), showed exponential increases
with sampling year although PBDE concentrations may be reaching a plateau. Likewise,
perfluorinated alkyl acids (PFAAs) also show exponential increases with sampling year indicating
continued release and incorporation into the North Pacific food web. Concentrations of retinol
and ‐ and ‐tocopherol (vitamin E) in liver were not related to POP concentrations, year of
sampling, or the rookery where the seal sample originated. POP concentrations do not appear
to influence vitamin concentrations as observed in other wildlife studies. Further monitoring of
northern fur seals is warranted because of increasing concentrations of current‐use POPs and
declining northern fur seal populations.
Introduction
The monitoring of marine mammals from northern regions for temporal and spatial changes in
persistent organic pollutant (POP) concentrations has provided important information often
driving regulatory action on chemical production and use. For instance, the detection of
temporal increases in polybrominated diphenyl ethers (PBDEs) in ringed seals and the initial
detection of perfluorooctane sulfonate (PFOS) in polar bears in Canada helped fuel the eventual
phasing‐out of these chemicals in North America (Ikonomou et al., 2002; Kannan et al., 2001).
Recent monitoring of marine mammals from Arctic and sub‐Arctic regions have identified new
compounds, such as the flame retardant hexabromocyclododecane (HBCD), that are in current
use and are being considered for phase‐out (de Wit et al., 2010).
Detecting time trends of POPs in marine mammals requires samples collected at multiple time
points, generally over several decades, and stored in proper conditions. To address this need,
specimen banks were established in several countries including the US, Canada, Denmark,
Scandinavia, and Japan to collect and archive marine mammal tissues in order to detect
pollutant temporal trends (Becker et al., 2006). In the US, the National Institute of Standards
and Technology (NIST) maintains the Marine Environmental Specimen Bank (Marine ESB)
consisting of several different marine mammal tissue collections (Becker and Wise, 2006). One
of these collections, the Alaska Marine Mammal Tissue Archival Project (AMMTAP), is ideal for
assessing temporal changes of POPs in marine mammal populations. The AMMTAP collection
spans from 1987 to the present day and contains liver, kidney and blubber samples obtained
only from freshly dead animals using sampling protocols designed to reduce the likelihood of
accidental sample contamination. Samples are processed in the field and then shipped to the
NIST Marine ESB at liquid nitrogen vapor‐phase temperatures (‐150 °C) prior to permanent
storage in liquid nitrogen vapor‐phase freezers located in a clean room facility. The AMMTAP
collection presently contains over 5,000 samples from 710 animals from 18 species of
cetaceans, pinnipeds, and fissipeds collected from a variety of maritime regions in Alaska.
The objective of the present work was to use samples from the AMMTAP collection to assess
temporal trends of POPs in northern fur seals (Callorhinus ursinus) occurring at summer
rookeries in the Bering Sea (Table 1; Figure 1). Temporal trend data for both legacy persistent
organic pollutants (legacy POPs), such as polychlorinated biphenyls (PCBs), and current or
recently used POPs, such as the polybrominated diphenyl ethers (PBDEs), are needed from this
region. Such data would provide a better understanding of POP concentrations trends in
species from northern climates in response to climate change and source reductions mandated
in the Stockholm Convention or other management activities (Riget et al., 2010). Fur seals are
also consumed as food at the St. Paul Island collection site; therefore, understanding human
exposure to current‐use and legacy POPs was therefore also a motivation for this project.
Vitamins were determined in samples as vitamin levels have been linked to POP concentrations
in other work.
The Northern Fur Seal
The northern fur seal (NFS) is an otariid (externally eared) seal that has a wide geographic range
in the North Pacific Ocean extending from Japan and Northern California northward to the
Bering Sea (Gentry, 1997). The NFS tends to be smaller than most other species of otariid seals
and weighs up of 250 kg. Adults are sexually dimorphic with mature males being much larger
than females. The seals are polygynous and have established large breeding colonies
(rookeries) at several locations in the Bering Sea, including at St. Paul in the Pribilof Islands (Fig.
1). Dominant males compete for harems of females while younger males gather in groups on
or near their natal beaches. These younger immature males (2 to 3 years old) are harvested for
food (and historically for pelts) at some locations, such as St. Paul Island. Breeding and pupping
occur in the summer with peak pupping occurring typically during the first two weeks of July.
Females raise a single pup and forage in local waters between feedings. When not on
rookeries, NFSs are pelagic in the northern North Pacific Ocean. Animals using the St. Paul
Island rookeries (Fig. 1), mainly subsist on pollock, sand lance, and squid (Antonelis et al., 1997).
Pup production on St. Paul Island has declined nearly three‐fold since the early 1970s, possibly
as a result of declining forage fish availability due to climate change or from competition with
commercial fisheries (Towell and Ream, 2006).
Persistent Organic Pollutants
Persistent organic pollutants can be categorized as either legacy or current‐use. Legacy POPs
are those that have been banned or phased‐out from use in North America or were part of the
original “dirty dozen” compounds specified in the Stockholm Convention (see www.pops.int).
Legacy POPs include the PCBs, DDTs, chlordanes, toxaphene, hexachlorobenzene (HCB), aldrin,
endrin, dieldrin, heptachlor, and mirex that were measured in this study in addition to
polychlorinated dioxins and furans that were not determined in this work (Table 1). In 2009
and 2011, ‐, ‐ and ‐hexachlorocyclohexane (HCH), pentachlorobenzene, perfluorooctane sulfonate (PFOS), endosulfan, and PBDEs, all measured in this study, were added to the
Stockholm Convention POPs list. Chlorodecone (Kepone) and hexabromobiphenyl, which were
not measured in the present work, are also on the Stockholm POPs list. Non‐legacy POPs
include those that still have some limited production or are still in wide‐spread use, the
perfluoro alkyl acids (PFAAs), PBDEs, and HBCDs fall into this category. In general, levels of
these compounds are increasing in Arctic and nearby regions (de Wit et al., 2010; de Wit and
Muir, 2010; Hoguet et al., 2013; Reiner et al., 2011).
There has been keen interest in determining both temporal and spatial trends of POPs in the
Arctic and nearby environs such as the Bering Sea and North Pacific Ocean to understand
concentration trajectories or possible toxic effects in marine food webs. Both of these ocean
basins are believed to be major receptors of POP emissions and are proximate to Asia where
legacy POPs are either still in use or where use has only recently been curtailed. Consequently,
temporal trends of POPs in these regions are of interest. In addition, the accumulation of POPs
in marine mammals such as polar bears, dolphins, and seals has been linked to toxic effects
including suppressed immune function and endocrine disruption (Beckmen et al., 2003; Lahvis
et al., 1995; Letcher et al., 2010). Determining POP concentrations in northern fur seals was
therby important to place their contaminant burdens in perspective to burdens in marine

mammals where levels are linked to toxic effects. From a human health perspective, Native
Alaskans frequently rely on marine mammals for subsistence thus placing humans in a similar
trophic position as marine mammals. Therefore, understanding human exposure to POPs was
an additional motivation for this study.
There have been two prior investigations of POPs in northern fur seals. Beckman et al.
(Beckmen et al., 2003) collected blood and milk samples from NFS mother/pup pairs on St. Paul
Island and examined the relationship between blood POP concentration and immune response.
Primiparous females had higher POP concentrations and mounted weaker immune response
following vaccination than multiparous females. The results suggest an effect of higher POP
levels in blood leading to decreased immune response in NFS (Beckmen et al., 2003; Beckmen
et al., 1999). Temporal trends of POPs in NFS have been reported in blubber from mature
female fur seals collected from 1971 through 2008 off of the Sanriku Coast in Japan (Kajiwara et
al., 2004). Significant declines were observed for PCBs from 1975 onward. PBDEs accumulation
mirrored PBDE usage in Japan during that time span with concentrations increasing until 1994
and then declining in more recent years. HCB did not show significant declines. Aside from this
work, there have been no studies documenting temporal trends of POPs in NFSs highlighting
the need for the present work.
Materials and Methods
Samples
Samples of liver and blubber were collected opportunistically from two to three year old male
fur seals after they were taken during subsistence hunts on Saint Paul Island, Alaska (Figure 1
and Table 2). Samples were collected from 50 seals in 1987 (n=5), 1990 (n=10), 1997 (n=5),
2000 (n=10), 2006 (n=10), and 2007 (n=10). Data on seal weight, length and blubber thickness
were only available for samples collected prior to 2000.
Blubber and liver samples were processed in the field using established protocols that were
designed to minimize sample contamination (Becker and Wise, 2006). After processing,
samples were placed in liquid nitrogen vapor‐phase shippers and then sent to the NIST Marine
Environmental Specimen Bank (Marine ESB) for storage and later homogenization following
established protocols (Pugh et al., 2007). While in the NIST Marine ESB, samples were stored in
liquid nitrogen vapor‐phase freezers (‐150 °C) in a clean room environment. Samples
designated for analysis and not long term archival were cryogenically homogenized using the
method described elsewhere (Zeisler et al., 1983).
Vitamins
Sample Preparation
QC97LH2, a beluga liver control material, and 49 NFS liver samples were provided by the NIST
Marine ESB. Calibration solutions (n=5) were prepared of the fat‐soluble vitamins A (retinol)
and E (‐tocopherol and ‐tocopherol, respectively) (all concentrations determined
spectrophotometrically). A solution of benzo[a]pyrene‐d12 in methanol (approximately 7 g/g) was prepared and used as the internal standard (IS).
NFS liver samples (approximately 1 g) and a liver quality control sample (QC97LH2)
(approximately 1 g) were gravimetrically weighed into hot block digestion cups. Six milliliters of
a 1:1 (volume fraction) tetrahydrofuran/methanol mixture with 200 mg/g pyrogallol was added
to each sample. The samples were allowed to stir for 15 min. After stirring, 1.2 mL of 50 %
(volume fraction) KOH in methanol was added to the sample. The samples were stirred at 40 °C
for 1 h followed by the addition of 500 µL of acetic acid to neutralize the base and an additional
10 mL of water containing 10 % NaCl (mass fraction).
Liquid‐liquid extraction was performed three times using 10 mL of a 1:1 (volume fraction)
hexane:petroleum ether mixture. The combined extract was evaporated to approximately 20
mL and washed with water. The organic layer was removed, evaporated to dryness, and then
reconstituted in 1 mL of 9:1 (volume fraction) ethanol:ethyl acetate. All of the above steps
were performed in a room with subdued lighting, and when possible, the samples were fully
shielded from the light.
Instrumental method
Analysis was performed on an Agilent 1100 liquid chromatograph (LC) coupled with a Dionex
UltiMate 3000 LC/UV with a Jasco FP‐1520 fluorescence detector. Samples (20 L) were injected onto a Hypersil Green PAH column (250 mm x 4.6 mm i.d., 5 m particles) held at 5 °C.
An isocratic mobile phase consisting of 97 % acetonitrile with 3 % methanol by volume for 50
min was used for the separation. A response factor was calculated for each calibrant injection,
and the average response factor was used for the calculation of retinol and tocopherol
concentrations in the liver samples.
PCB Congeners, DDT compounds, Mirex, Chlorinated Cyclodienes, HCHs, PBDE Congeners,
HCB, and HBCDs
Sample Preparation
Calibrants were prepared by gravimetrically combining the following solutions: Standard
Reference Materials (SRMs) 2261, 2262, 2274, 2275, two additional PCB congener solutions, a
solution of 26 PBDE congeners, a solution of PBDE 209, commercially purchased solutions of
octachlorosytrene (Accustandard, Inc., New Haven, CT), three isomers of HBCDs, and
toxaphene congeners Parlar 26, 32, 50 and 62 (Cambridge Isotope Laboratories, Andover, MA).
Concentrations of components in the non‐SRM solutions used to prepare the calibrants were
not corrected for purity although the stated purities were all >98 %. The six‐point calibration
curve, processed alongside each sample set, contained from approximately 0.05 ng to 230 ng of
each component of interest.
An internal standard (IS) solution in iso‐octane contained the following compounds obtained
from Wellington Laboratories (Guelph, Ontario, Canada), Cambridge Isotope Laboratories,
Accustandard, and Chiron (Trondheim, Norway): 13C‐labeled PCB congeners (28, 52, 77, 126,
169, 118, 153, 180, 194, and 206), 6‐F‐PBDE 47, PBDE 104, 4’‐F‐PBDE 160, 4'‐F‐PBDE 208, 13C‐
labeled PBDE 209, 13C‐labeled pesticides (HCB, trans‐chlordane, trans‐nonachlor, oxychlordane,
4,4'‐DDE, 4,4'‐DDD, 4,4'‐DDT), 13C‐labeled methyl‐triclosan and 13C‐labeled ‐, ‐ and ‐HBCDs. This solution contained approximately 300 ng/g (mass fraction) of each compound.
Blubber samples (~1 g) including subsamples of SRM 1945 Organics in Whale Blubber as a
control sample were extracted using pressurized fluid extraction (PFE; ASE Dionex, Sunnyvale,
CA). Thee samples, FRSL‐187, 808, and 828, were run in duplicate with one analysis in each of
two batches. Cryohomogenized blubber was mixed with diatomaceous earth (Hydromatrix,
Restek, Bellefonte, PA) or sodium sulfate and then packed into stainless steel extraction vessels.
The IS solution was gravimetrically added to the top of each PFE vessel. The mixtures were
extracted using dichloromethane. The cell temperature and pressure were set to 100 °C and
13.8 MPa, respectively, and there were three extraction cycles. Extracts were frozen, and the
residual water was removed. Total extractable organic content (or lipid content) was
determined gravimetrically by subsampling the extract. Solvent volume was reduced to 1 mL
under nitrogen and lipid was removed by size exclusion chromatography column (PLGel 10 m,
100 Å). The resultant fraction was evaporated to 0.5 mL and solvent exchanged to hexane. An
additional step was performed using solid phase extraction cartridges packed with 30 % sulfuric
acid/silica (mass fraction) in order to further clean up the samples and fractionate the more
polar HBCD isomers from the other analytes as described previously (Hoguet et al., 2013).
Fraction One (F1) extracts were solvent exchanged to iso‐octane, evaporated, and transferred
to amber auto sampler vials with a final volume of 0.5 mL. Fraction Two (F2) extracts
containing HBCD isomers were solvent exchanged to iso‐octane then methanol, evaporated,
and transferred to auto sampler vial (ASV) inserts and reduced to a final volume of
approximately 200 μL. FI extracts were analyzed using gas chromatography with mass
spectrometric detection (GC/MS) for the majority of the compounds using two ionization
modes as described below, and F2 extracts were analyzed using liquid chromatography with a
triple quadrupole MS (LC‐MS/MS) for HBCDs.
Instrumental method
GC/MS‐EI for PCB Congeners, DDT‐related compounds, and Mirex
Samples were analyzed using two GC/MS injections, one for the pesticides and one for the PCB
congeners. Both were on an Agilent 6890N GC coupled to an Agilent 5973 MS (Agilent
Technologies, Santa Clara, CA) operated in the electron impact (EI) mode with selected ion
monitoring (SIM). The column used for the first injection was a DB‐XLB (0.25 mm x 60 m x 0.25
m; Agilent Technologies) coupled to a 5 m x 0.25 mm retention gap. Cool‐on‐column
injections of 1 L were done for the pesticide run. The column temperature for the pesticide
run was held for 1 min at 60 °C, ramped to 180 °C at a rate of 40 °C/min, held for 10 min at 180
°C, then ramped to 280 °C at a rate of 2 °C/min, and finally held at 280 °C for 5 min.
The second run, for PCB congeners, utilized the same column as the first injection. Cool‐on‐
column injections of 1 L were done for the PCB run. The column temperature for the PCB run
was held for 1 min at 60 °C, ramped to 180 °C at a rate of 40 °C/min, held for 10 min at 180 °C,
then ramped to 280 °C at a rate of 2 °C/min, and finally held at 280 °C for 46 min.
GC/MS‐NCI for PBDEs, Cyclodienes, HCHs and Chlorobenzenes
The PBDEs, cyclodienes, HCHs, and chlorobenzenes were analyzed using an Agilent 6890 GC and
5975B MS (Agilent Technologies) operated in the negative chemical ionization (NCI) mode with
SIM. Methane was used as the reagent gas. The column used was a 30 m x 0.18 mm x 0.18 m
DB‐5ms (Agilent Technologies) equipped with a 5 m x 0.25 mm retention gap. Sample extracts
(reduced to 0.5 mL) were injected (2 L) using cool on‐column injection. The column
temperature for the NCI run was held for 1 min at 60 °C, ramped to 170 °C at a rate of 25
°C/min, then ramped to 270 °C at a rate of 2 °C/min, next ramped to 325 °C at a rate of 25
°C/min, and finally held at 325 °C for 15 min.
LC‐MS/MS for HBCDs
LC‐MS/MS was used with the electrospray ionization (ESI) source. A 20 µL injection of F2
extracts was made, and HBCD isomers were separated on an Agilent Eclipse Plus C18 column
(3.0 mm x 150 mm x 3.5 µm column) connected to an API 4000 (Applied Biosystems, Foster
City, CA). The solvent program was as follows: solvent A was 2.5 mM ammonium acetate in
12.5 % water in methanol (volume fraction) and solvent B was acetonitrile. Flow was 0.3
mL/min and the following mobile phase gradient was used. Initial conditions began at 90 % A,
ramped to 67 % A by 12 min, and held at 67 % A for 3 min. At 15 min, the solvent was ramped
to 0 % A by 20 min, held for 3 min, and then ramped from 23 min to 28 min to 90 % A and held
for 5 min.
Perfluorinated Alkyl Acids
Sample Preparation
One aliquot of NIST SRM 1946 Lake Superior Fish Tissue and one aliquot of SRM 1947 Lake
Michigan Fish Tissue were run as control materials in this analysis and compared to
concentrations determined previously (Reiner et al., 2012). A calibration series (n = 7) was
prepared from three independent weighings of neat PFAAs in methanol (see Table 3 for list). A
solution of 13C8‐PFOA, 13C9‐PFNA,
13C9‐PFDA, 13C2‐PFUnA,
13C2‐PFDoA, 18O2‐PFBS,
13C4‐PFOS, and 18O2‐PFOSA in the water was used as the IS solution for PFAAs. A methanolic solution of 13C2‐
PFOA was used as the recovery standard.
Samples and calibrants were extracted using the potassium hydroxide (KOH) in methanol
method as described previously (Reiner et al., 2011). Briefly, approximately 0.5 g of each
sample was transferred to a 50 mL polypropylene centrifuge tube using a stainless steel
spatula. MilliQ water (0.5 mL) was added to each sample. The aqueous IS (0.2 mL) was then
gravimetrically added to each sample. The centrifuge tubes were vortexed for 10 sec and
allowed to settle for 20 min. Three milliliters of 0.01 mol/L of KOH in methanol was added to
the samples and sonicated for 30 min. Samples were then centrifuged at 2500 rpm for 5 min,
and the supernatant was transferred to a glass culture tube with a glass pipet. The original
sample tube received an additional 3 mL of 0.01 mol/L of KOH in methanol, and the extraction
procedure was repeated, placing the additional round of supernatant in the glass culture tube
as well. Extracts were evaporated under nitrogen, at 35 oC, to approximately 3 mL and filtered
using a Whatman UniPrep 0.2 m filter (Stanford, ME). Samples were further evaporated to 1
mL (under nitrogen) and 10 mL of 50 % (volume fraction) formic acid (98 %, Fluka; Buchs,
Switzerland) in water was added to each sample. Samples were loaded onto Waters Oasis WAX
SPE columns (3 cc, 60 mg, 30 µm; Milford, MA) on a RapidTrace (Biotage, Uppsala, Sweden)
workstation. The fraction of interest from the SPE column was concentrated under nitrogen to
approximately 0.5 mL. They were spiked with 0.2 mL of the recovery standard, vortexed, and
transferred to ASVs for instrumental analysis.
Instrumental method
The extracts were run using the LC‐MS/MS (Agilent 1100 LC (Palo Alto, CA) interfaced to a
negative electrospray ionization tandem mass spectrometer (API 4000, Applied Biosystems‐
MDS Sciex, Foster City, CA). Samples (5 L) were injected onto a Phenomenex Kinetex 2.6 µ PFP
column (50 mm x 3.0 mm). The solvent gradient given in % by volume (flow rate 0.3 mL/min)
started at 40 % methanol and 60 % 20 mmol/L ammonium acetate in water and then increased
to 65 % methanol by 5 min, held for 5 min, and then increased to 95 % methanol by 12 min, and
held for 3 min, before reverting back to original conditions at 15.5 min with a 14.5 min hold
time. The two most abundant transitions for each PFAA were monitored.
Quantification of Analytes of Interest
Amounts of each compound of interest in the samples were calculated using the slope and y‐
intercept of at least a three point calibration curve that bracketed the peak area ratios
observed in the samples. Concentrations were determined by dividing the calculated analyte
mass by the extracted sample mass. The limits of detection (LOD) were determined as the
maximum value of either the average ng measured in procedural blanks plus 3 times the
standard deviation of the blanks or the lowest calibrant detectable, all divided by the sample
mass. For the PFAAs, final concentrations are corrected for the salt content of the neat
materials, and concentrations are totals including branched and linear isomers.
Statistical methods
Statistical comparisons were performed using JMP 10 (SAS Institute, Cary, NC). POP
concentrations and vitamins were log transformed to provide a normal distribution. Lipid
content did not require log transformation. Comparisons were made by performing multiple
linear regression including the rookery and year as independent variables.
Results and Discussion
Vitamins
Vitamin levels in free‐ranging marine mammals are reflective of many factors (physiological,
biological, and chemical). While vitamins A and E are essential for reproduction, development,
cellular and immune function, little is known about the “normal” levels in wildlife (Simms and
Ross, 2000). This study provides much needed information about the mass fractions of vitamin
A (retinol) and vitamin E (‐ and ‐tocopherol) in one species of marine mammal. Mass
fractions of total retinol (retinol), ‐ and ‐tocopherol are shown for the control material in
Table 4. The relative standard deviation for retinol and tocopherol were less than 10 %, however the relative standard deviation for ‐tocopherol was 30 % indicating higher variability in the measurement of this vitamin. Vitamin concentrations in the NFS liver samples are given
in Table 5 with means by rookery shown in Table 6. Mass fractions of the vitamins in livers
were highest for‐tocopherol with the concentration ranging from below the limit of detection
to 23400 mg/kg in frsl‐54 (median 10300 mg/kg). Log transformed vitamin mass fractions did
not significantly differ among rookeries or year, nor was there a significant statistical
interaction between rookery and year. In other words, vitamin concentrations did not differ
among rookeries or among sampling years in the seals and mass fraction of vitamins exhibited
considerable variability among individual seals. The relative standard deviation of the three
vitamins were 134 %, 43 % and 42 % for retinol, ‐ and ‐ tocopherol, respectively. Since there is no baseline information on the concentrations of retinol, ‐ and ‐ tocopherols in NFS, we can assume that the differences seen in this study is due to feeding/post feeding intervals,
seal condition and prey sources. Vitamin concentrations were also not significantly related to
summed POP concentrations.
Legacy Organochlorine POPs
Since lipid content in tissues is often correlated to concentrations of lipophilic (fat‐soluble)
pollutants such as PCBs and DDTs, lipid content was determined in all NFS blubber samples.
Lipid content ranged from 42.9 % (mass fraction) to 84.3 % with an average value of 68.5 % (SD
= 9.5 %; Table 2). POPs were not correlated to lipid content therefore POP concentrations were
not lipid normalized and are expressed on a wet mass basis.
The quality control of sample analysis for the organochlorine POPs included analyzing four
aliquots of SRM 1945. Results from the analysis of SRM 1945 are shown in Tables 7 and 8.
The mean concentration of the four aliquots was within the uncertainty or within 20 % of the
certified values listed on the Certificate of Analysis except for trans‐chlordane (Table 7). The
reason for the higher trans‐chlordane value relative to the certified value for SRM 1945 (17.8
ng/g (1.7 ng/g SD) vs. 11.8 ng/g ± 0.5 ng/g) may result from the coelution of trans‐chlordane
enantiomers in this study that separated during the certification measurements. Toxaphene
congeners determined in SRM 1945 were between 88 % and 43 % higher than reference values
derived from interlaboratory comparisons and prior analysis of toxaphene congeners by NIST.
The discrepancy is likely due to non‐agreement of stated concentrations of toxaphene
congeners in an earlier lot compared to the lot used for this work. This earlier lot was used by
NIST and was likely used by other laboratories that submitted data to NIST during the
recertification of SRM 1945. Purity was assessed in the most recently used lots of toxaphene
congeners; however concentration values stated by the vendor could not verified. Regardless,
the toxaphene values in this study are internally consistent and are useful to gauge the decline
of toxaphene concentrations in NFS with time.
The average percent difference of values determined in duplicate measurement on the same
homogenized seal blubber ranged from 14 % for pesticides determined by GC‐MS/NCI to 2.5 %
for PCBs determined by GC‐MS/EI.
Concentration values for legacy POPs are given in Tables 9 and 10 and summarized in Tables 11
and 12. Median concentrations of legacy POPs were highest for PCBs at 1540 ng/g (range 558 ng/g to 2210 ng/g) and lowest for the ClBz at 2.93 ng/g (range 1.37 ng/g to 7.54 ng/g). DDTs concentrations in NFS were highly variable ranging from 223 ng/g to 83200 ng/g (Tables 10 and
11). The variability in DDT concentrations was partially driven by a significant (p<0.001) decline with year of sampling (Figure 2), but among colony differences in DDTs irrespective of year were not significantly different however colonies were not sampled all years (Table 2 and
Figure 3). While concentrations generally declined with year of sampling, there was a
significant (P<0.001) and nearly 3‐fold increase in DDT concentration from 2006 until 2007
(from 464 ng /g (207 ng/g) to 1230 ng/g (590 ng/g) (mean (1SD)). This may be due to
differences in forage location that appears to be colony dependent (Call et al., 2008) or possibly
differences in dispersal during the non‐breeding season. An annual difference of this
magnitude in global sources of DDT between these two years seems unlikely. Other POPs also
showed significant declines with year (log concentration versus year) including ClBzs (P<0.001), HCH (P<0.001), Chlor, and Tox. PCB and mirex concentrations did not
significantly decline with year.
There are few other seal data from this region of the north Pacific to compare to POP
concentrations seen in this study. The majority of seal data are from regions further north and
east of the study site, primarily in the Canadian Arctic (Riget et al., 2010). The two most
relevant studies to this work with regard to location and compounds measured were studies
conducted on ringed seals from Alaska (Kucklick et al., 2006) and NFS from the northeastern
coast of Honshu, Japan (Kajiwara et al., 2004). Median concentrations of legacy POPs in male
ringed seals collected in 1996 from near Nome, AK in comparison to legacy POPs in NFS from
1997 are shown in Figure 4. Median concentrations of HCHs and PCBs were similar between
the two seal species. DDT in NFSs was approximately twice the concentration observed in
ringed seals while Chlor was about half. Declining trends in chlordane concentration going from east to west have been observed for marine mammals in this region and the further west
sampling location of NFS relative to the ringed seals would be consistent with this trend
(Kucklick et al., 2006). The higher concentration of DDTs in NFS relative to ringed seals suggests an Asian source of DDT to the NFS population.
Concentrations of legacy POPs from adult female NFS collected from the waters of northern
Japan (Kajiwara et al., 2004) are also shown in Figure 4. The concentrations shown are the
average concentrations from collections of seals made in 1994 and 1997 (n=5 female seals each
year). With exception of PCBs, POP concentrations for seals collected from the two locations
(northeast Honshu coast and St. Paul Island) are very similar. While concentrations appear to
be similar between the two locations, it should be noted that the samples from Japan were
from reproductively mature female seals that have lower blubber concentrations than the
juvenile male NFS seals examined in this study. Hickie et al. (Hickie et al., 2005) showed that
adult female ringed seal PCB concentrations are reduced to about half of juvenile male
concentrations. Extending this observation in ringed seals to the NFS, one would expect to see
POPs in juvenile male NFS from coastal Japan at levels twice those observed at St. Paul Island.
Current‐use POPs
Current‐use POPs include the PBDE and HBCD flame retardants, as well as the PFAAs. Quality
control of the measurement of PFAAs included the analysis of two aliquots of SRM 1946
Organics in Lake Superior Fish Tissue and two additional aliquots of SRM 1947 Organics in Lake
Michigan Fish Tissue. With the exception of perfluorooctane sulfonate (PFOS), most PFAAs
were below the limits of detection (Table 13). Mean PFOS values determined in the control
samples were 2.07 ng/g (range 1.84 ng/g to 2.29 ng/g) and 6.15 ng/g (range 5.42 ng/g to 6.88
ng/g) for SRMs 1946 and 1947, respectively compared to certified values of 2.07 ng/g ± 0.08
ng/g and 6.15 ng/g ± 0.39 ng/g, respectively. PBDEs determined in SRM 1945 Organics in
Whale Blubber were within <20% of certified values (Table 7). ‐HBCD in SRM 1945 averaged
6.1 ng/g (0.60 ng/g SD).
Concentrations of the PFAAs in NFS livers are given in Table 3. Concentrations of individual
PFAAs that were detected were generally in the single ng/g to tens of ng/g range with
concentrations being highest in the odd‐chain PFAAs. This is unlike PFAA compound profiles
seen in aquatic mammals from temperate or subtropical latitudes where profiles are
dominated by PFOS (Houde et al., 2006). The pattern observed in the present work is typical
for Arctic and subarctic marine mammals and has recently been reported in beluga whales from
relatively nearby coastal Alaska and Cook Inlet (Reiner et al., 2011). However, in that study
PFOSA dominated in male beluga whales along with PFOS and PFUnA. The magnitude of
concentrations was fairly similar to this work with detectable values generally averaging in the
ng/g to tens of ng/g range per compound. Total PFAAs increased significantly (log PFAA vs. year; r2 =0.53) and nearly four‐fold in seals from 1987 until 2007 which was similar in
magnitude to that observed in beluga whales from Alaska (Reiner et al., 2011). There was no
significant difference in PFAA values among rookeries; however, rookery concentration was
highly dependent on year of sampling.
Brominated flame retardant concentrations in NFS are given in Table 14 and summarized in
Tables 11 and 12. PBDEs were detected in all samples and HBCDs were detected in 48 of 50
samples. Both PBDEs and HBCDs concentrations ranged nearly three orders of magnitude
with the lowest concentrations generally observed in seals collected during the early years of
sampling. As with the perfluorinated compounds, both classes of brominated flame retardants
showed dramatic and significant (r2 = 0.52 and 0.53 for PBDEs and HBCDs, respectively) increases with sampling year (Figure 2). Similar increases in PBDEs have been reported in
ringed seals from the Canadian Arctic (Ikonomou et al., 2002) and more recently in beluga
whales from Alaska (Hoguet et al., 2013). In the current study, there was however a decline in
ƩPBDE concentrations between 2006 and 2007 suggesting that PBDE concentrations may be
plateauing in NFS in response to phasing out the use of PBDE mixtures in the northern
hemisphere. PBDE 47 dominated the PBDE profile in samples comprising on average 61 % (10
% SD) of total PBDEs. This fraction was consistent among all sampling events suggesting little
change in the PBDE profile in the NFS forage fish during the sampling period.
The ƩHBCDs were dominated by ‐HBCD as seen in other studies (Hoguet et al., 2013). ‐HBCD was detected in eight samples although the concentrations were less than 1 ng/g wet mass.
The exponential increase in HBCD observed here is similar to what was recently reported for
beluga whales from Cook Inlet, AK and from the Chukchi Sea, AK (Hoguet et al., 2013). HBCD is
still used in North America although this mixture has been recognized by the Stockholm
Convention as a candidate for removal from use. The inclusion of HBCD as a POP has sparked
debate as the biomagnification potential for this compound is not as high as the legacy POPs.
Despite its lower bioaccumulation potential, concentrations in NFS are increasing although the
rate of increase with time is half that observed in Alaska beluga whales (slopes 0.12/year versus
0.26/year).
Conclusions
Results from this study demonstrate the utility of using archived samples as a source for
understanding both geographic and temporal patterns of persistent organic pollutants. The
concentrations of POPs in NFS are considerably lower than those observed in other marine
mammals from the lower 48 United States; however, the concentrations may still be of concern
to animal health as suggested in prior studies. Fortunately, with the exception of mirex, the
concentrations of legacy POPs are declining with time in NFS highlighting the success of efforts
aimed at curbing POP emissions in the Pacific Region. Current use POPs, however, are
increasing in concentration in NFS and continued monitoring of NFS for contaminants is
therefore warranted. Based on suggestions from this dataset and other work, PBDEs
concentrations have likely peaked and are now declining. This is not true for PFAAs or HBCDs
which continue to increase both in this study and the recent work on beluga whales. Archival
of NFS tissues should be continued as the population of this animal in the Northern Pacific
appears to be declining, and information on contaminants will help in ruling out or ruling in
causes for declines. Continued sampling also extends the timeline for monitoring and samples
taken now may be useful for identifying trends in the next generation of POPs. When the
AMMTAP collection was begun in the late 1980s, legacy POPs were well‐known; however,
PBDEs, PFAAs, and HBCDs were unrecognized as POPs at that time.
Acknowledgements: The following are acknowledged for their support of AMMTAP work at St.
Paul Island over the years: the Aleut Community of St. Paul Island ‐ Phillip A. Zavadil, Aquilina D.
Lestenkof, Pamela Lestenkof, Pat Kozloff, and Darleen Melovidov, and from the NMFS Alaska
Regional Office – Mike Williams and Steve Zimmerman. A special acknowledgment goes to
Terry Spraker, DVM, Colorado State University, who provided special aid at St. Paul in obtaining
all of the specimens used in this study. The collection and banking of NFS specimens was also
supported by funding from U.S. Department of Interior’s Minerals Management Service, U.S.
Geological Survey Biological Resources Division, and National Marine Fisheries Service Office of
Protected Resource’s Marine Mammal Health and Stranding Response Program National
Marine Mammal Tissue Bank (Teresa K. Rowles, Program Manager).
Disclaimer: Certain commercial equipment, instruments, or materials are identified in this
paper to specify adequately the experimental procedure. Such identification does not imply
recommendation or endorsement by the National Institute of Standards and Technology, nor
does it imply that the materials or equipment identified are necessarily the best available for
the purpose.
Literature Cited:
Antonelis GA, Sinclair EH, Ream RR, Robson BW. Inter‐island variation in the diet of female northern fur seals (Callorhinus ursinus) in the Bering Sea. J. Zool. Lond. 1997; 242: 435‐451.
Becker PR, Gunter EW, Schluter C, Shibata Y, Wise SA. Environmental specimen banking. J. Environ. Monitoring 2006; 8: 776‐778.
Becker PR, Wise SA. The US National Biomonitoring Specimen Bank and the Marine Environmental Specimen Bank. JEnviron. Monitoring 2006; 8: 795‐799.
Beckmen KB, Blake JE, Ylitalo GM, Stott JL, O'Hara TM. Organochlorine contaminant exposure and associations with hematological and humoral immune functional assays with dam age as a factor in free‐ranging northern fur seal pups (Callorhinus ursinus). Mar. Pollut. Bull. 2003; 46: 594‐606.
Beckmen KB, Ylitalo GM, Towell RG, Krahn MM, O'Hara TM, Blake JE. Factors affecting organochlorine contaminant concentrations in milk and blood of northern fur seal (Callorhinus ursinus) dams and pups from St. George Island, Alaska. Sci. Total Environ. 1999; 231: 183‐200.
Call KA, Ream RR, Johnson D, Sterling JT, Towell RG. Foraging route tactics and site fidelity of adult female northern fur seal (Callorhinus ursinus) around the Pribilof Islands. Deep Sea Res Part II: Topical Studies in Oceanogr. 2008; 55: 1883‐1896.
de Wit CA, Herzke D, Vorkamp K. Brominated flame retardants in the Arctic environment‐‐trends and new candidates. Sci. Total Environ. 2010; 408: 2885‐2918.
de Wit CA, Muir D. Levels and trends of new contaminants, temporal trends of legacy contaminants and effects of contaminants in the Arctic: preface. Sci. Total Environ. 2010; 408: 2851
Gentry R. Behavior and Ecology of the Northern Fur Seal. Princeton, New Jersey: Princeton University Press, 1997.
Hickie BE, Muir DC, Addison RF, Hoekstra PF. Development and application of bioaccumulation models to assess persistent organic pollutant temporal trends in arctic ringed seal (Phoca hispida) populations. Sci. Total Environ. 2005; 351‐352: 413‐426.
Hoguet J, Keller J, Reiner J, Kucklick J, Bryan C, Moors A, Pugh R, Becker PR. Spatial and temporal trends of persistent organic pollutants and mercury in beluga whales (Delphinapterus leucas) from Alaska. Sci. Total Environ 2013; 449:285‐294.
Houde M, Bujas TAD, Small J, Wells RS, Fair PA, Bossart GD, Solomon KR, Muir DCG. Biomagnification of Perfluoroalkyl Compounds in the Bottlenose Dolphin (Tursiops truncatus) Food Web. Environ. Sci. Technol. 2006; 40: 4138‐4144.
Ikonomou MG, Rayne S, Addison RF. Exponential Increases of the Brominated Flame Retardants, Polybrominated Diphenyl Ethers, in the Canadian Arctic from 1981 to 2000. Environ. Sci. Technol. 2002; 36: 1886‐1892.
Kajiwara N, Ueno D, Takahashi A, Baba N, Tanabe S. Polybrominated diphenyl ethers and organochlorines in archived northern fur seal samples from the Pacific coast of Japan, 1972‐1998. Environ. Sci. Technol. 2004; 38: 3804‐3819.
Kannan K, Franson JC, Bowerman WW, Hansen KJ, Jones PD, Giesy JP. Perfluorooctane sulfonate in fish‐eating water birds including bald eagles and albatrosses. Environ. Sci. Technol. 2001; 35: 3065‐3070.
Kucklick JR, Krahn MM, Becker PR, Porter BJ, Schantz MM, York GS, O'Hara TM, Wise SA. Persistent organic pollutants in Alaskan ringed seal (Phoca hispida) and walrus (Odobenus rosmarus) blubber. J. Environ. Monitoring 2006; 8: 848‐854.
Lahvis GP, Wells RS, Kuehl DW, Stewart JL, Rhinehart HL, Via CS. Decreased lymphocyte responses in free‐ranging bottlenose dolphins (Tursiops truncatus) are associated with increased concentrations of PCBs and DDT in peripheral blood. Environ. Health Perspect. 1995; 103: 67‐72.
Letcher RJ, Bustnes JO, Dietz R, Jenssen BM, Jorgensen EH, Sonne C, Verreault J, Vijayan MM, Gabrielsen GW. Exposure and effects assessment of persistent organohalogen contaminants in arctic wildlife and fish. Sci. Total Environ. 2010; 408: 2995‐3043.
Pugh RS, Ellisor MB, Moors AJ, Porter BJ, Becker PR. Marine Environmental Specimen Bank: Clean Room and Specimen Bank Protocols. NIST Internal Report 7389. National Institute of Standards and Technology, Gaithersburg, Maryland, USA. 2007.
Reiner JL, O'Connell SG, Butt CM, Mabury SA, Small JM, De Silva AO, Muir DC, Delinsky AD, Strynar MJ, Lindstrom AB, Reagen WK, Malinsky M, Schafer S, Kwadijk CJ, Schantz MM, Keller JM. Determination of perfluorinated alkyl acid concentrations in biological standard reference materials. Anal. Bioanal. Chem. 2012; 404: 2683‐92.
Reiner JL, O'Connell SG, Moors AJ, Kucklick JR, Becker PR, Keller JM. Spatial and temporal trends of perfluorinated compounds in Beluga Whales (Delphinapterus leucas) from Alaska. Environ Sci Technol 2011; 45: 8129‐8136.
Riget F, Bignert A, Braune B, Stow J, Wilson S. Temporal trends of legacy POPs in Arctic biota, an update. Sci. Total Environ. 2010; 408: 2874‐2884.
Simms W, Ross PS. Vitamin A physiology and its application as a biomarker of contaminant‐related toxicity in marine mammals: A review. Toxicol. Industrial Health 2000; 16: 291‐302.
Towell RG, Ream RR. Decline in northern fur seal (Callorhinus ursinus) pub production on the Pribilof Islands. Marine Mammal Sci. 2006; 22: 486‐491.
Zeisler R, Langland JK, Harrison SH. Cryogenic homogenization procedures for biological tissues. Anal. Chem. 983; 55: 2434‐2461.
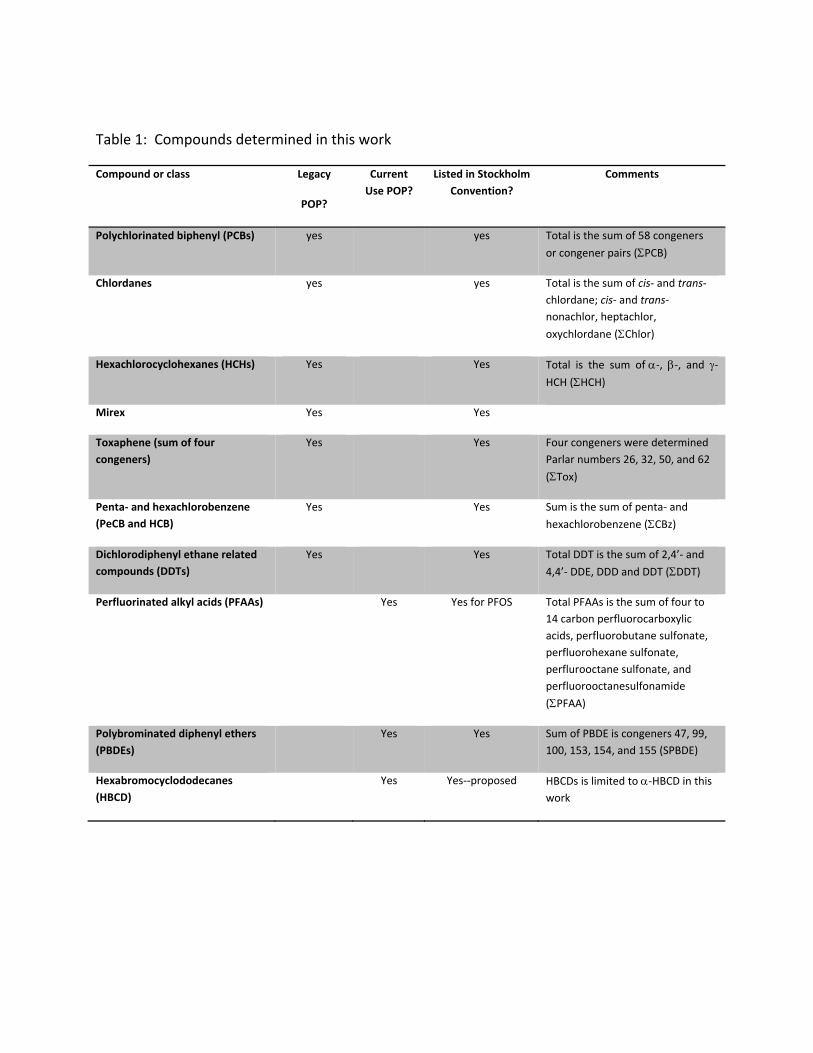
Table 1: Compounds determined in this work
Compound or class Legacy
POP?
Current
Use POP?
Listed in Stockholm
Convention?
Comments
Polychlorinated biphenyl (PCBs) yes yes Total is the sum of 58 congeners
or congener pairs (PCB)
Chlordanes yes yes Total is the sum of cis‐ and trans‐
chlordane; cis‐ and trans‐
nonachlor, heptachlor,
oxychlordane (Chlor)
Hexachlorocyclohexanes (HCHs) Yes Yes Total is the sum of‐, ‐, and ‐HCH (HCH)
Mirex Yes Yes
Toxaphene (sum of four
congeners)
Yes Yes Four congeners were determined
Parlar numbers 26, 32, 50, and 62
(Tox)
Penta‐ and hexachlorobenzene
(PeCB and HCB)
Yes Yes Sum is the sum of penta‐ and
hexachlorobenzene (CBz)
Dichlorodiphenyl ethane related
compounds (DDTs)
Yes Yes Total DDT is the sum of 2,4’‐ and
4,4’‐ DDE, DDD and DDT (DDT)
Perfluorinated alkyl acids (PFAAs) Yes Yes for PFOS Total PFAAs is the sum of four to
14 carbon perfluorocarboxylic
acids, perfluorobutane sulfonate,
perfluorohexane sulfonate,
perflurooctane sulfonate, and
perfluorooctanesulfonamide
(PFAA)
Polybrominated diphenyl ethers
(PBDEs)
Yes Yes Sum of PBDE is congeners 47, 99,
100, 153, 154, and 155 (SPBDE)
Hexabromocyclododecanes
(HBCD)
Yes Yes‐‐proposed HBCDs is limited to ‐HBCD in this work
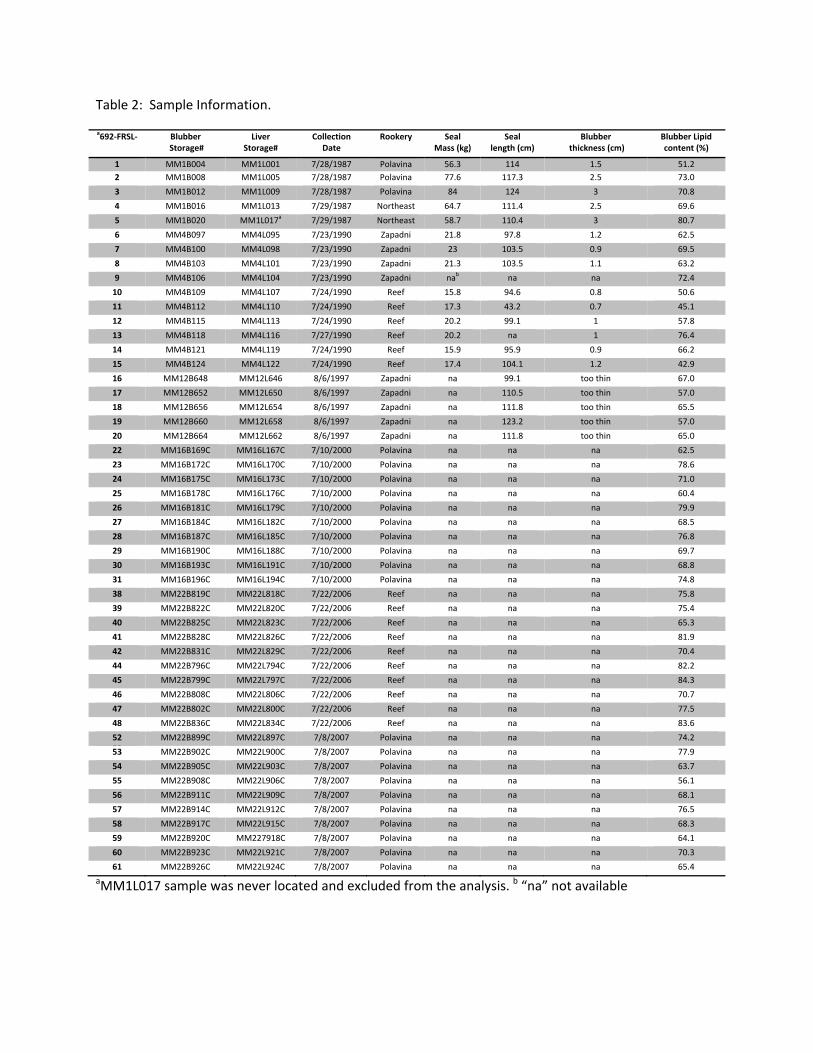
Table 2: Sample Information.
a692‐FRSL‐ Blubber Storage#
Liver Storage#
Collection Date
Rookery Seal Mass (kg)
Seal length (cm)
Blubber thickness (cm)
Blubber Lipid content (%)
1 MM1B004 MM1L001 7/28/1987 Polavina 56.3 114 1.5 51.2
2 MM1B008 MM1L005 7/28/1987 Polavina 77.6 117.3 2.5 73.0
3 MM1B012 MM1L009 7/28/1987 Polavina 84 124 3 70.8
4 MM1B016 MM1L013 7/29/1987 Northeast 64.7 111.4 2.5 69.6
5 MM1B020 MM1L017a 7/29/1987 Northeast 58.7 110.4 3 80.7
6 MM4B097 MM4L095 7/23/1990 Zapadni 21.8 97.8 1.2 62.5
7 MM4B100 MM4L098 7/23/1990 Zapadni 23 103.5 0.9 69.5
8 MM4B103 MM4L101 7/23/1990 Zapadni 21.3 103.5 1.1 63.2
9 MM4B106 MM4L104 7/23/1990 Zapadni nab na na 72.4
10 MM4B109 MM4L107 7/24/1990 Reef 15.8 94.6 0.8 50.6
11 MM4B112 MM4L110 7/24/1990 Reef 17.3 43.2 0.7 45.1
12 MM4B115 MM4L113 7/24/1990 Reef 20.2 99.1 1 57.8
13 MM4B118 MM4L116 7/27/1990 Reef 20.2 na 1 76.4
14 MM4B121 MM4L119 7/24/1990 Reef 15.9 95.9 0.9 66.2
15 MM4B124 MM4L122 7/24/1990 Reef 17.4 104.1 1.2 42.9
16 MM12B648 MM12L646 8/6/1997 Zapadni na 99.1 too thin 67.0
17 MM12B652 MM12L650 8/6/1997 Zapadni na 110.5 too thin 57.0
18 MM12B656 MM12L654 8/6/1997 Zapadni na 111.8 too thin 65.5
19 MM12B660 MM12L658 8/6/1997 Zapadni na 123.2 too thin 57.0
20 MM12B664 MM12L662 8/6/1997 Zapadni na 111.8 too thin 65.0
22 MM16B169C MM16L167C 7/10/2000 Polavina na na na 62.5
23 MM16B172C MM16L170C 7/10/2000 Polavina na na na 78.6
24 MM16B175C MM16L173C 7/10/2000 Polavina na na na 71.0
25 MM16B178C MM16L176C 7/10/2000 Polavina na na na 60.4
26 MM16B181C MM16L179C 7/10/2000 Polavina na na na 79.9
27 MM16B184C MM16L182C 7/10/2000 Polavina na na na 68.5
28 MM16B187C MM16L185C 7/10/2000 Polavina na na na 76.8
29 MM16B190C MM16L188C 7/10/2000 Polavina na na na 69.7
30 MM16B193C MM16L191C 7/10/2000 Polavina na na na 68.8
31 MM16B196C MM16L194C 7/10/2000 Polavina na na na 74.8
38 MM22B819C MM22L818C 7/22/2006 Reef na na na 75.8
39 MM22B822C MM22L820C 7/22/2006 Reef na na na 75.4
40 MM22B825C MM22L823C 7/22/2006 Reef na na na 65.3
41 MM22B828C MM22L826C 7/22/2006 Reef na na na 81.9
42 MM22B831C MM22L829C 7/22/2006 Reef na na na 70.4
44 MM22B796C MM22L794C 7/22/2006 Reef na na na 82.2
45 MM22B799C MM22L797C 7/22/2006 Reef na na na 84.3
46 MM22B808C MM22L806C 7/22/2006 Reef na na na 70.7
47 MM22B802C MM22L800C 7/22/2006 Reef na na na 77.5
48 MM22B836C MM22L834C 7/22/2006 Reef na na na 83.6
52 52
MM22B899C MM22L897C 7/8/2007 Polavina na na na 74.2
53 MM22B902C MM22L900C 7/8/2007 Polavina na na na 77.9
54 MM22B905C MM22L903C 7/8/2007 Polavina na na na 63.7
55 MM22B908C MM22L906C 7/8/2007 Polavina na na na 56.1
56 MM22B911C MM22L909C 7/8/2007 Polavina na na na 68.1
57 MM22B914C MM22L912C 7/8/2007 Polavina na na na 76.5
58 MM22B917C MM22L915C 7/8/2007 Polavina na na na 68.3
59 MM22B920C MM227918C 7/8/2007 Polavina na na na 64.1
60 MM22B923C MM22L921C 7/8/2007 Polavina na na na 70.3
61 MM22B926C MM22L924C 7/8/2007 Polavina na na na 65.4
aMM1L017 sample was never located and excluded from the analysis. b “na” not available
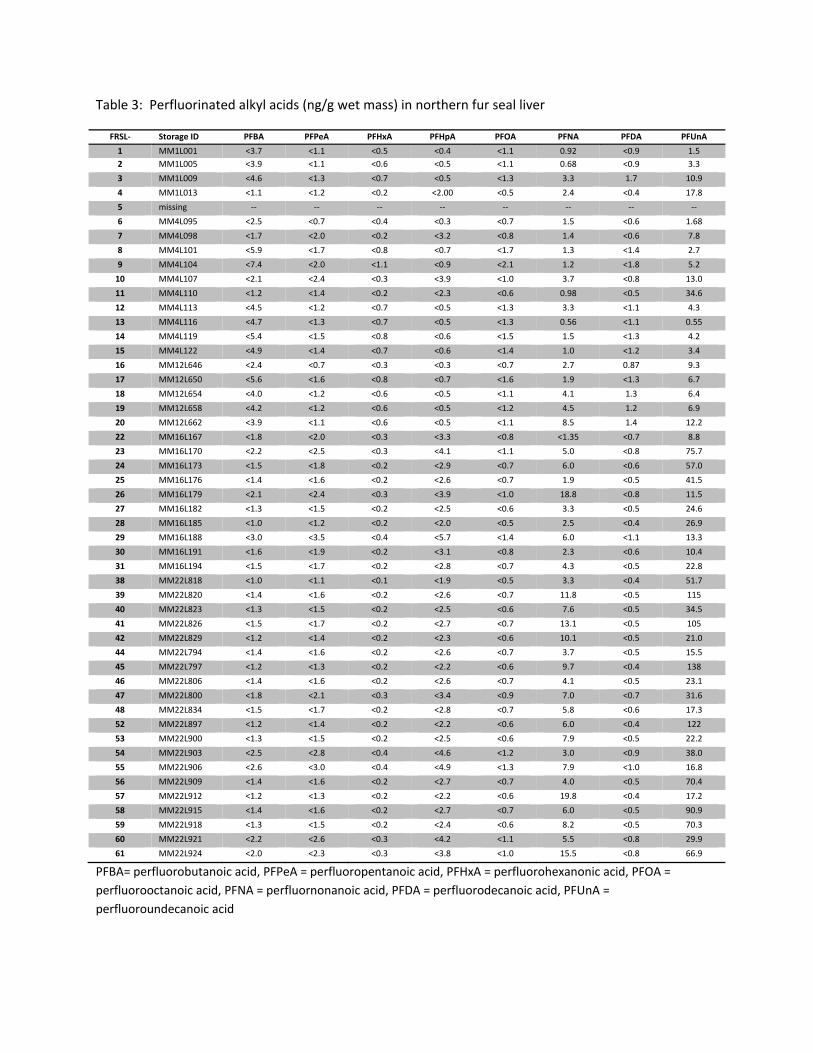
Table 3: Perfluorinated alkyl acids (ng/g wet mass) in northern fur seal liver
FRSL‐ Storage ID PFBA PFPeA PFHxA PFHpA PFOA PFNA PFDA PFUnA
1 MM1L001 <3.7 <1.1 <0.5 <0.4 <1.1 0.92 <0.9 1.5
2 MM1L005 <3.9 <1.1 <0.6 <0.5 <1.1 0.68 <0.9 3.3
3 MM1L009 <4.6 <1.3 <0.7 <0.5 <1.3 3.3 1.7 10.9
4 MM1L013 <1.1 <1.2 <0.2 <2.00 <0.5 2.4 <0.4 17.8
5 missing ‐‐ ‐‐ ‐‐ ‐‐ ‐‐ ‐‐ ‐‐ ‐‐
6 MM4L095 <2.5 <0.7 <0.4 <0.3 <0.7 1.5 <0.6 1.68
7 MM4L098 <1.7 <2.0 <0.2 <3.2 <0.8 1.4 <0.6 7.8
8 MM4L101 <5.9 <1.7 <0.8 <0.7 <1.7 1.3 <1.4 2.7
9 MM4L104 <7.4 <2.0 <1.1 <0.9 <2.1 1.2 <1.8 5.2
10 MM4L107 <2.1 <2.4 <0.3 <3.9 <1.0 3.7 <0.8 13.0
11 MM4L110 <1.2 <1.4 <0.2 <2.3 <0.6 0.98 <0.5 34.6
12 MM4L113 <4.5 <1.2 <0.7 <0.5 <1.3 3.3 <1.1 4.3
13 MM4L116 <4.7 <1.3 <0.7 <0.5 <1.3 0.56 <1.1 0.55
14 MM4L119 <5.4 <1.5 <0.8 <0.6 <1.5 1.5 <1.3 4.2
15 MM4L122 <4.9 <1.4 <0.7 <0.6 <1.4 1.0 <1.2 3.4
16 MM12L646 <2.4 <0.7 <0.3 <0.3 <0.7 2.7 0.87 9.3
17 MM12L650 <5.6 <1.6 <0.8 <0.7 <1.6 1.9 <1.3 6.7
18 MM12L654 <4.0 <1.2 <0.6 <0.5 <1.1 4.1 1.3 6.4
19 MM12L658 <4.2 <1.2 <0.6 <0.5 <1.2 4.5 1.2 6.9
20 MM12L662 <3.9 <1.1 <0.6 <0.5 <1.1 8.5 1.4 12.2
22 MM16L167 <1.8 <2.0 <0.3 <3.3 <0.8 <1.35 <0.7 8.8
23 MM16L170 <2.2 <2.5 <0.3 <4.1 <1.1 5.0 <0.8 75.7
24 MM16L173 <1.5 <1.8 <0.2 <2.9 <0.7 6.0 <0.6 57.0
25 MM16L176 <1.4 <1.6 <0.2 <2.6 <0.7 1.9 <0.5 41.5
26 MM16L179 <2.1 <2.4 <0.3 <3.9 <1.0 18.8 <0.8 11.5
27 MM16L182 <1.3 <1.5 <0.2 <2.5 <0.6 3.3 <0.5 24.6
28 MM16L185 <1.0 <1.2 <0.2 <2.0 <0.5 2.5 <0.4 26.9
29 MM16L188 <3.0 <3.5 <0.4 <5.7 <1.4 6.0 <1.1 13.3
30 MM16L191 <1.6 <1.9 <0.2 <3.1 <0.8 2.3 <0.6 10.4
31 MM16L194 <1.5 <1.7 <0.2 <2.8 <0.7 4.3 <0.5 22.8
38 MM22L818 <1.0 <1.1 <0.1 <1.9 <0.5 3.3 <0.4 51.7
39 MM22L820 <1.4 <1.6 <0.2 <2.6 <0.7 11.8 <0.5 115
40 MM22L823 <1.3 <1.5 <0.2 <2.5 <0.6 7.6 <0.5 34.5
41 MM22L826 <1.5 <1.7 <0.2 <2.7 <0.7 13.1 <0.5 105
42 MM22L829 <1.2 <1.4 <0.2 <2.3 <0.6 10.1 <0.5 21.0
44 MM22L794 <1.4 <1.6 <0.2 <2.6 <0.7 3.7 <0.5 15.5
45 MM22L797 <1.2 <1.3 <0.2 <2.2 <0.6 9.7 <0.4 138
46 MM22L806 <1.4 <1.6 <0.2 <2.6 <0.7 4.1 <0.5 23.1
47 MM22L800 <1.8 <2.1 <0.3 <3.4 <0.9 7.0 <0.7 31.6
48 MM22L834 <1.5 <1.7 <0.2 <2.8 <0.7 5.8 <0.6 17.3
52 MM22L897 <1.2 <1.4 <0.2 <2.2 <0.6 6.0 <0.4 122
53 MM22L900 <1.3 <1.5 <0.2 <2.5 <0.6 7.9 <0.5 22.2
54 MM22L903 <2.5 <2.8 <0.4 <4.6 <1.2 3.0 <0.9 38.0
55 MM22L906 <2.6 <3.0 <0.4 <4.9 <1.3 7.9 <1.0 16.8
56 MM22L909 <1.4 <1.6 <0.2 <2.7 <0.7 4.0 <0.5 70.4
57 MM22L912 <1.2 <1.3 <0.2 <2.2 <0.6 19.8 <0.4 17.2
58 MM22L915 <1.4 <1.6 <0.2 <2.7 <0.7 6.0 <0.5 90.9
59 MM22L918 <1.3 <1.5 <0.2 <2.4 <0.6 8.2 <0.5 70.3
60 MM22L921 <2.2 <2.6 <0.3 <4.2 <1.1 5.5 <0.8 29.9
61 MM22L924 <2.0 <2.3 <0.3 <3.8 <1.0 15.5 <0.8 66.9
PFBA= perfluorobutanoic acid, PFPeA = perfluoropentanoic acid, PFHxA = perfluorohexanonic acid, PFOA =
perfluorooctanoic acid, PFNA = perfluornonanoic acid, PFDA = perfluorodecanoic acid, PFUnA =
perfluoroundecanoic acid
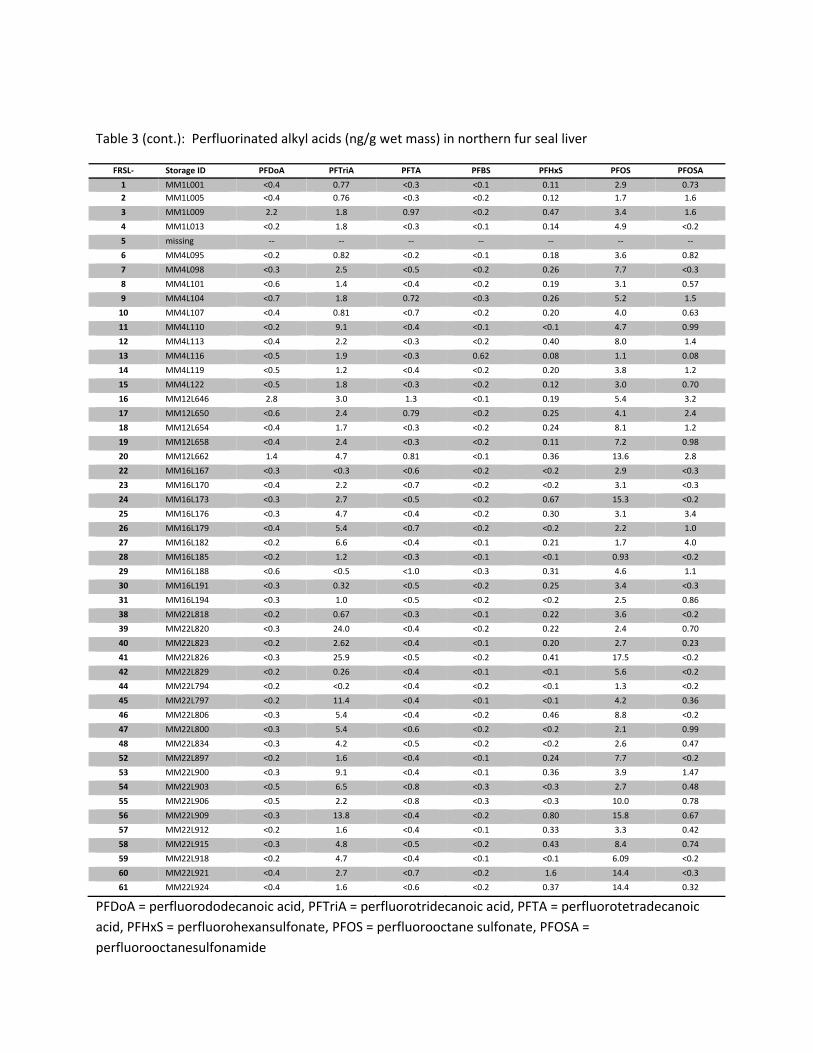
Table 3 (cont.): Perfluorinated alkyl acids (ng/g wet mass) in northern fur seal liver
FRSL‐ Storage ID PFDoA PFTriA PFTA PFBS PFHxS PFOS PFOSA
1 MM1L001 <0.4 0.77 <0.3 <0.1 0.11 2.9 0.73
2 MM1L005 <0.4 0.76 <0.3 <0.2 0.12 1.7 1.6
3 MM1L009 2.2 1.8 0.97 <0.2 0.47 3.4 1.6
4 MM1L013 <0.2 1.8 <0.3 <0.1 0.14 4.9 <0.2
5 missing ‐‐ ‐‐ ‐‐ ‐‐ ‐‐ ‐‐ ‐‐
6 MM4L095 <0.2 0.82 <0.2 <0.1 0.18 3.6 0.82
7 MM4L098 <0.3 2.5 <0.5 <0.2 0.26 7.7 <0.3
8 MM4L101 <0.6 1.4 <0.4 <0.2 0.19 3.1 0.57
9 MM4L104 <0.7 1.8 0.72 <0.3 0.26 5.2 1.5
10 MM4L107 <0.4 0.81 <0.7 <0.2 0.20 4.0 0.63
11 MM4L110 <0.2 9.1 <0.4 <0.1 <0.1 4.7 0.99
12 MM4L113 <0.4 2.2 <0.3 <0.2 0.40 8.0 1.4
13 MM4L116 <0.5 1.9 <0.3 0.62 0.08 1.1 0.08
14 MM4L119 <0.5 1.2 <0.4 <0.2 0.20 3.8 1.2
15 MM4L122 <0.5 1.8 <0.3 <0.2 0.12 3.0 0.70
16 MM12L646 2.8 3.0 1.3 <0.1 0.19 5.4 3.2
17 MM12L650 <0.6 2.4 0.79 <0.2 0.25 4.1 2.4
18 MM12L654 <0.4 1.7 <0.3 <0.2 0.24 8.1 1.2
19 MM12L658 <0.4 2.4 <0.3 <0.2 0.11 7.2 0.98
20 MM12L662 1.4 4.7 0.81 <0.1 0.36 13.6 2.8
22 MM16L167 <0.3 <0.3 <0.6 <0.2 <0.2 2.9 <0.3
23 MM16L170 <0.4 2.2 <0.7 <0.2 <0.2 3.1 <0.3
24 MM16L173 <0.3 2.7 <0.5 <0.2 0.67 15.3 <0.2
25 MM16L176 <0.3 4.7 <0.4 <0.2 0.30 3.1 3.4
26 MM16L179 <0.4 5.4 <0.7 <0.2 <0.2 2.2 1.0
27 MM16L182 <0.2 6.6 <0.4 <0.1 0.21 1.7 4.0
28 MM16L185 <0.2 1.2 <0.3 <0.1 <0.1 0.93 <0.2
29 MM16L188 <0.6 <0.5 <1.0 <0.3 0.31 4.6 1.1
30 MM16L191 <0.3 0.32 <0.5 <0.2 0.25 3.4 <0.3
31 MM16L194 <0.3 1.0 <0.5 <0.2 <0.2 2.5 0.86
38 MM22L818 <0.2 0.67 <0.3 <0.1 0.22 3.6 <0.2
39 MM22L820 <0.3 24.0 <0.4 <0.2 0.22 2.4 0.70
40 MM22L823 <0.2 2.62 <0.4 <0.1 0.20 2.7 0.23
41 MM22L826 <0.3 25.9 <0.5 <0.2 0.41 17.5 <0.2
42 MM22L829 <0.2 0.26 <0.4 <0.1 <0.1 5.6 <0.2
44 MM22L794 <0.2 <0.2 <0.4 <0.2 <0.1 1.3 <0.2
45 MM22L797 <0.2 11.4 <0.4 <0.1 <0.1 4.2 0.36
46 MM22L806 <0.3 5.4 <0.4 <0.2 0.46 8.8 <0.2
47 MM22L800 <0.3 5.4 <0.6 <0.2 <0.2 2.1 0.99
48 MM22L834 <0.3 4.2 <0.5 <0.2 <0.2 2.6 0.47
52 MM22L897 <0.2 1.6 <0.4 <0.1 0.24 7.7 <0.2
53 MM22L900 <0.3 9.1 <0.4 <0.1 0.36 3.9 1.47
54 MM22L903 <0.5 6.5 <0.8 <0.3 <0.3 2.7 0.48
55 MM22L906 <0.5 2.2 <0.8 <0.3 <0.3 10.0 0.78
56 MM22L909 <0.3 13.8 <0.4 <0.2 0.80 15.8 0.67
57 MM22L912 <0.2 1.6 <0.4 <0.1 0.33 3.3 0.42
58 MM22L915 <0.3 4.8 <0.5 <0.2 0.43 8.4 0.74
59 MM22L918 <0.2 4.7 <0.4 <0.1 <0.1 6.09 <0.2
60 MM22L921 <0.4 2.7 <0.7 <0.2 1.6 14.4 <0.3
61 MM22L924 <0.4 1.6 <0.6 <0.2 0.37 14.4 0.32
PFDoA = perfluorododecanoic acid, PFTriA = perfluorotridecanoic acid, PFTA = perfluorotetradecanoic
acid, PFHxS = perfluorohexansulfonate, PFOS = perfluorooctane sulfonate, PFOSA =
perfluorooctanesulfonamide
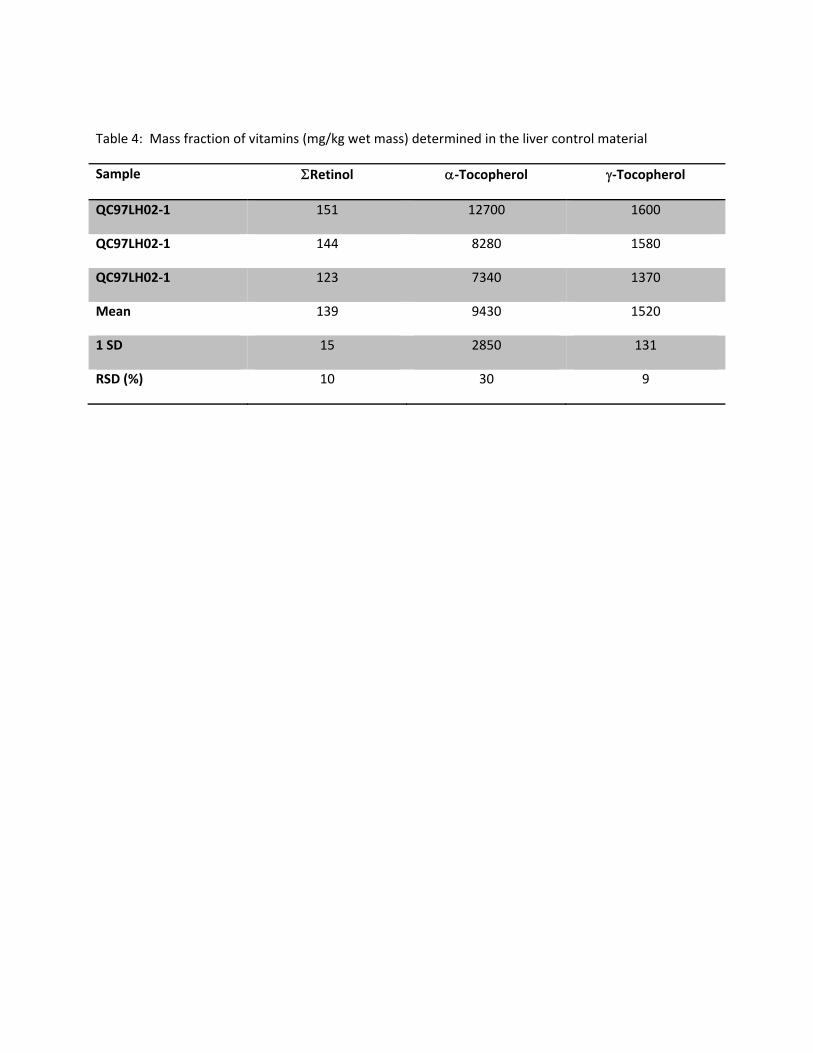
Table 4: Mass fraction of vitamins (mg/kg wet mass) determined in the liver control material
Sample Retinol ‐Tocopherol ‐Tocopherol
QC97LH02‐1 151 12700 1600
QC97LH02‐1 144 8280 1580
QC97LH02‐1 123 7340 1370
Mean 139 9430 1520
1 SD 15 2850 131
RSD (%) 10 30 9
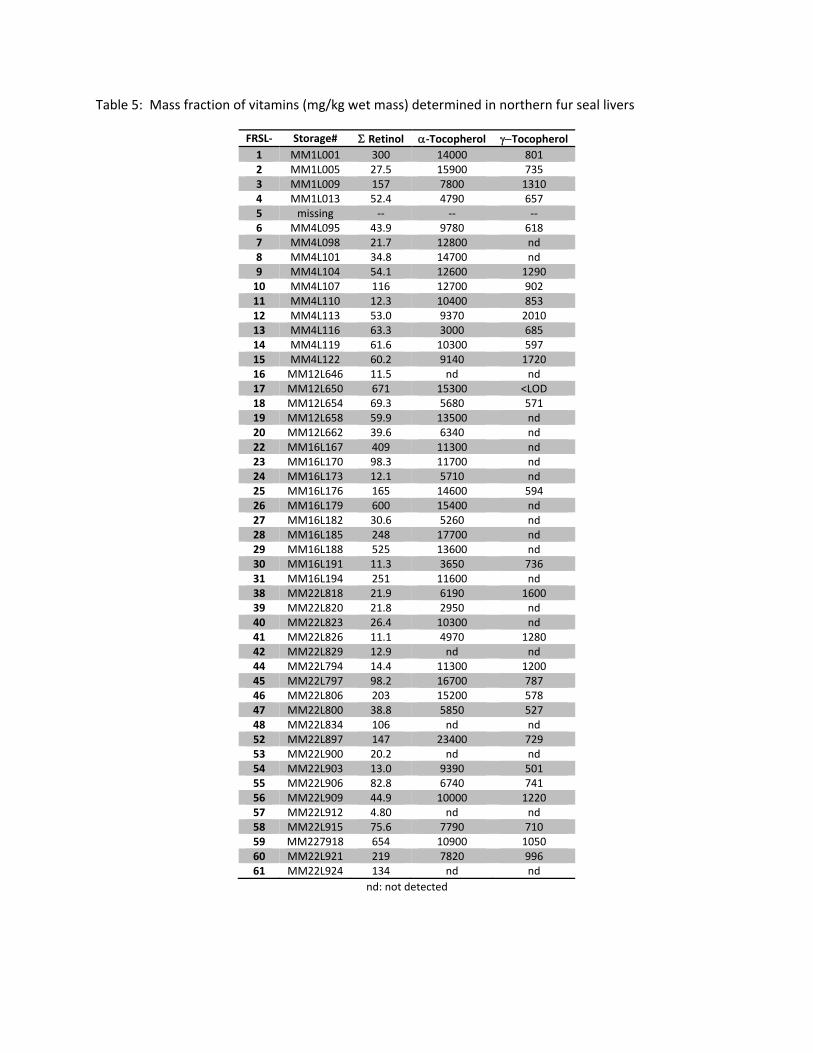
Table 5: Mass fraction of vitamins (mg/kg wet mass) determined in northern fur seal livers
FRSL‐ Storage# Retinol ‐Tocopherol Tocopherol 1 MM1L001 300 14000 801 2 MM1L005 27.5 15900 735 3 MM1L009 157 7800 1310 4 MM1L013 52.4 4790 657 5 missing ‐‐ ‐‐ ‐‐ 6 MM4L095 43.9 9780 618 7 MM4L098 21.7 12800 nd 8 MM4L101 34.8 14700 nd 9 MM4L104 54.1 12600 1290 10 MM4L107 116 12700 902 11 MM4L110 12.3 10400 853 12 MM4L113 53.0 9370 2010 13 MM4L116 63.3 3000 685 14 MM4L119 61.6 10300 597 15 MM4L122 60.2 9140 1720 16 MM12L646 11.5 nd nd 17 MM12L650 671 15300 <LOD 18 MM12L654 69.3 5680 571 19 MM12L658 59.9 13500 nd 20 MM12L662 39.6 6340 nd 22 MM16L167 409 11300 nd 23 MM16L170 98.3 11700 nd 24 MM16L173 12.1 5710 nd 25 MM16L176 165 14600 594 26 MM16L179 600 15400 nd 27 MM16L182 30.6 5260 nd 28 MM16L185 248 17700 nd 29 MM16L188 525 13600 nd 30 MM16L191 11.3 3650 736 31 MM16L194 251 11600 nd 38 MM22L818 21.9 6190 1600 39 MM22L820 21.8 2950 nd 40 MM22L823 26.4 10300 nd 41 MM22L826 11.1 4970 1280 42 MM22L829 12.9 nd nd 44 MM22L794 14.4 11300 1200 45 MM22L797 98.2 16700 787 46 MM22L806 203 15200 578 47 MM22L800 38.8 5850 527 48 MM22L834 106 nd nd 52 MM22L897 147 23400 729 53 MM22L900 20.2 nd nd 54 MM22L903 13.0 9390 501 55 MM22L906 82.8 6740 741 56 MM22L909 44.9 10000 1220 57 MM22L912 4.80 nd nd 58 MM22L915 75.6 7790 710 59 MM227918 654 10900 1050 60 MM22L921 219 7820 996 61 MM22L924 134 nd nd
nd: not detected
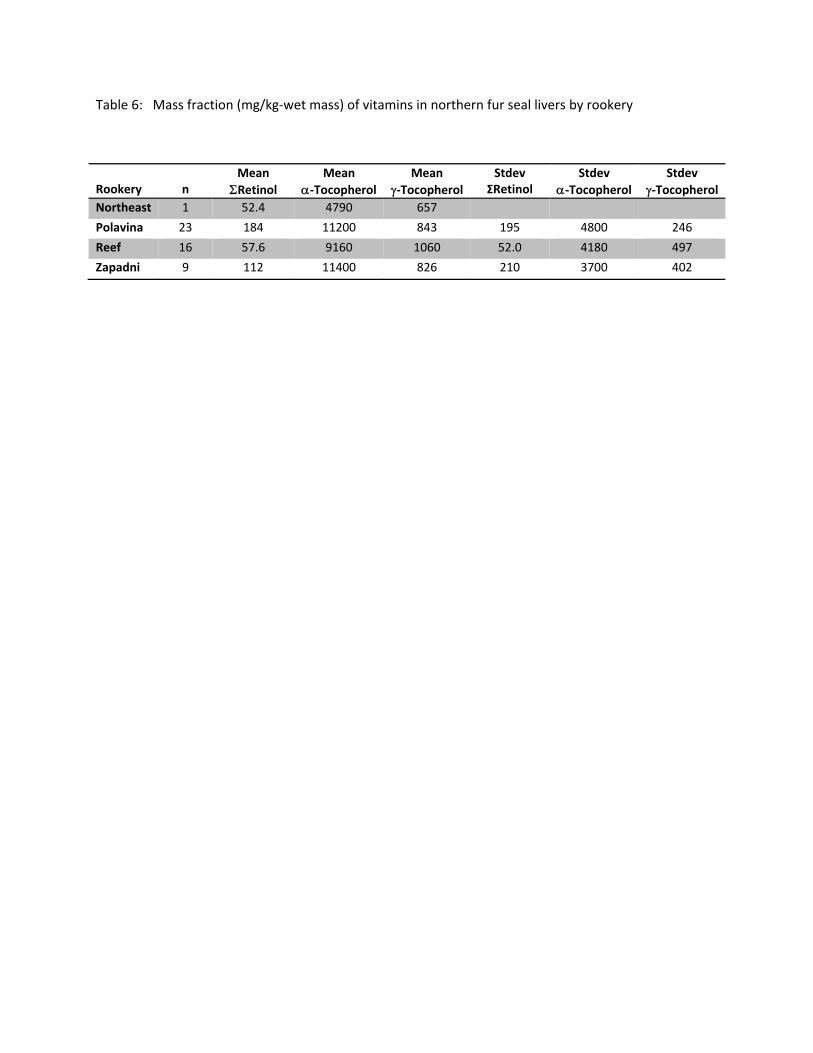
Table 6: Mass fraction (mg/kg‐wet mass) of vitamins in northern fur seal livers by rookery
Rookery
n
Mean
Retinol Mean
‐Tocopherol Mean
‐Tocopherol Stdev
ƩRetinol Stdev
‐Tocopherol Stdev
‐Tocopherol Northeast 1 52.4 4790 657
Polavina 23 184 11200 843 195 4800 246
Reef 16 57.6 9160 1060 52.0 4180 497
Zapadni 9 112 11400 826 210 3700 402
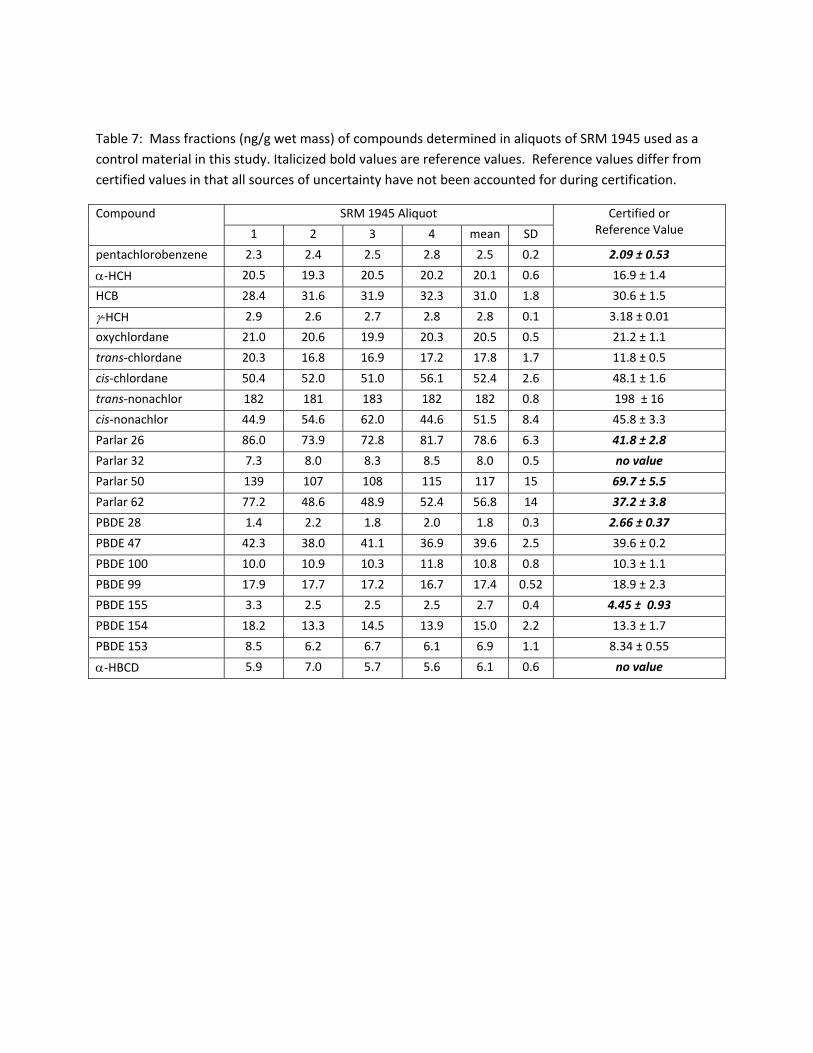
Table 7: Mass fractions (ng/g wet mass) of compounds determined in aliquots of SRM 1945 used as a
control material in this study. Italicized bold values are reference values. Reference values differ from
certified values in that all sources of uncertainty have not been accounted for during certification.
Compound SRM 1945 Aliquot Certified orReference Value 1 2 3 4 mean SD
pentachlorobenzene 2.3 2.4 2.5 2.8 2.5 0.2 2.09 ± 0.53
‐HCH 20.5 19.3 20.5 20.2 20.1 0.6 16.9 ± 1.4
HCB 28.4 31.6 31.9 32.3 31.0 1.8 30.6 ± 1.5
‐HCH 2.9 2.6 2.7 2.8 2.8 0.1 3.18 ± 0.01
oxychlordane 21.0 20.6 19.9 20.3 20.5 0.5 21.2 ± 1.1
trans‐chlordane 20.3 16.8 16.9 17.2 17.8 1.7 11.8 ± 0.5
cis‐chlordane 50.4 52.0 51.0 56.1 52.4 2.6 48.1 ± 1.6
trans‐nonachlor 182 181 183 182 182 0.8 198 ± 16
cis‐nonachlor 44.9 54.6 62.0 44.6 51.5 8.4 45.8 ± 3.3
Parlar 26 86.0 73.9 72.8 81.7 78.6 6.3 41.8 ± 2.8
Parlar 32 7.3 8.0 8.3 8.5 8.0 0.5 no value
Parlar 50 139 107 108 115 117 15 69.7 ± 5.5
Parlar 62 77.2 48.6 48.9 52.4 56.8 14 37.2 ± 3.8
PBDE 28 1.4 2.2 1.8 2.0 1.8 0.3 2.66 ± 0.37
PBDE 47 42.3 38.0 41.1 36.9 39.6 2.5 39.6 ± 0.2
PBDE 100 10.0 10.9 10.3 11.8 10.8 0.8 10.3 ± 1.1
PBDE 99 17.9 17.7 17.2 16.7 17.4 0.52 18.9 ± 2.3
PBDE 155 3.3 2.5 2.5 2.5 2.7 0.4 4.45 ± 0.93
PBDE 154 18.2 13.3 14.5 13.9 15.0 2.2 13.3 ± 1.7
PBDE 153 8.5 6.2 6.7 6.1 6.9 1.1 8.34 ± 0.55
‐HBCD 5.9 7.0 5.7 5.6 6.1 0.6 no value
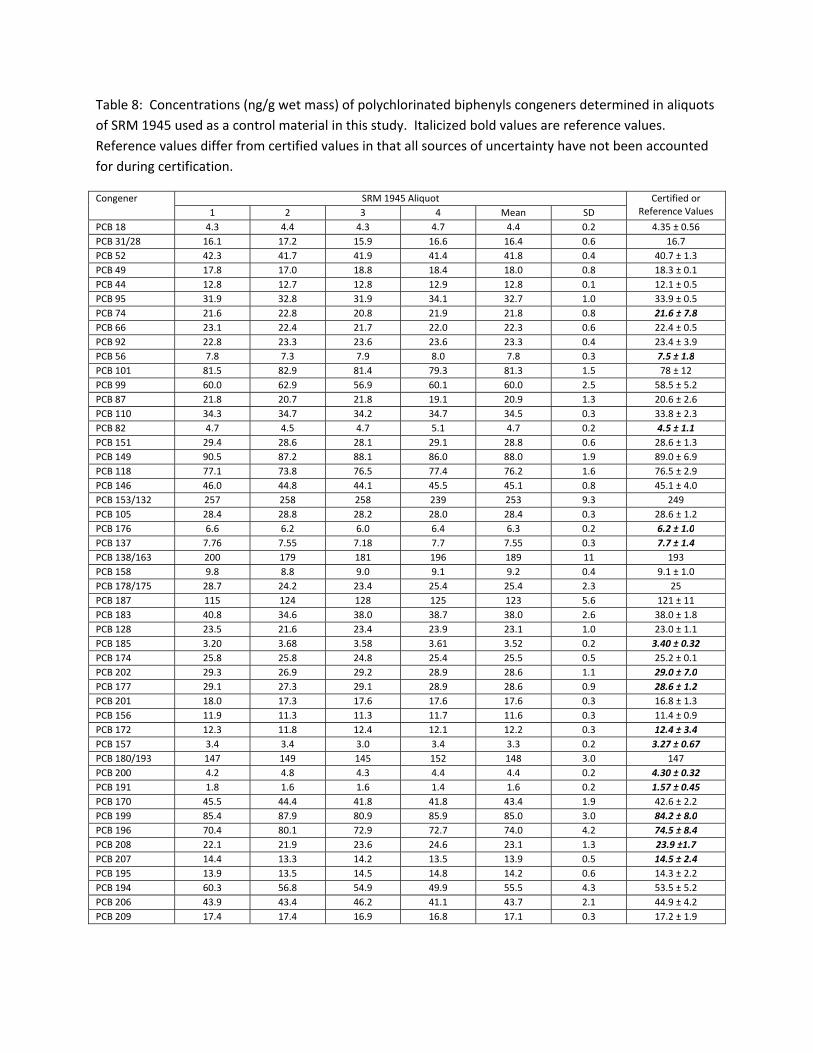
Table 8: Concentrations (ng/g wet mass) of polychlorinated biphenyls congeners determined in aliquots
of SRM 1945 used as a control material in this study. Italicized bold values are reference values.
Reference values differ from certified values in that all sources of uncertainty have not been accounted
for during certification.
Congener SRM 1945 Aliquot Certified orReference Values 1 2 3 4 Mean SD
PCB 18 4.3 4.4 4.3 4.7 4.4 0.2 4.35 ± 0.56
PCB 31/28 16.1 17.2 15.9 16.6 16.4 0.6 16.7
PCB 52 42.3 41.7 41.9 41.4 41.8 0.4 40.7 ± 1.3
PCB 49 17.8 17.0 18.8 18.4 18.0 0.8 18.3 ± 0.1
PCB 44 12.8 12.7 12.8 12.9 12.8 0.1 12.1 ± 0.5
PCB 95 31.9 32.8 31.9 34.1 32.7 1.0 33.9 ± 0.5
PCB 74 21.6 22.8 20.8 21.9 21.8 0.8 21.6 ± 7.8
PCB 66 23.1 22.4 21.7 22.0 22.3 0.6 22.4 ± 0.5
PCB 92 22.8 23.3 23.6 23.6 23.3 0.4 23.4 ± 3.9
PCB 56 7.8 7.3 7.9 8.0 7.8 0.3 7.5 ± 1.8
PCB 101 81.5 82.9 81.4 79.3 81.3 1.5 78 ± 12
PCB 99 60.0 62.9 56.9 60.1 60.0 2.5 58.5 ± 5.2
PCB 87 21.8 20.7 21.8 19.1 20.9 1.3 20.6 ± 2.6
PCB 110 34.3 34.7 34.2 34.7 34.5 0.3 33.8 ± 2.3
PCB 82 4.7 4.5 4.7 5.1 4.7 0.2 4.5 ± 1.1
PCB 151 29.4 28.6 28.1 29.1 28.8 0.6 28.6 ± 1.3
PCB 149 90.5 87.2 88.1 86.0 88.0 1.9 89.0 ± 6.9
PCB 118 77.1 73.8 76.5 77.4 76.2 1.6 76.5 ± 2.9
PCB 146 46.0 44.8 44.1 45.5 45.1 0.8 45.1 ± 4.0
PCB 153/132 257 258 258 239 253 9.3 249
PCB 105 28.4 28.8 28.2 28.0 28.4 0.3 28.6 ± 1.2
PCB 176 6.6 6.2 6.0 6.4 6.3 0.2 6.2 ± 1.0
PCB 137 7.76 7.55 7.18 7.7 7.55 0.3 7.7 ± 1.4
PCB 138/163 200 179 181 196 189 11 193
PCB 158 9.8 8.8 9.0 9.1 9.2 0.4 9.1 ± 1.0
PCB 178/175 28.7 24.2 23.4 25.4 25.4 2.3 25
PCB 187 115 124 128 125 123 5.6 121 ± 11
PCB 183 40.8 34.6 38.0 38.7 38.0 2.6 38.0 ± 1.8
PCB 128 23.5 21.6 23.4 23.9 23.1 1.0 23.0 ± 1.1
PCB 185 3.20 3.68 3.58 3.61 3.52 0.2 3.40 ± 0.32
PCB 174 25.8 25.8 24.8 25.4 25.5 0.5 25.2 ± 0.1
PCB 202 29.3 26.9 29.2 28.9 28.6 1.1 29.0 ± 7.0
PCB 177 29.1 27.3 29.1 28.9 28.6 0.9 28.6 ± 1.2
PCB 201 18.0 17.3 17.6 17.6 17.6 0.3 16.8 ± 1.3
PCB 156 11.9 11.3 11.3 11.7 11.6 0.3 11.4 ± 0.9
PCB 172 12.3 11.8 12.4 12.1 12.2 0.3 12.4 ± 3.4
PCB 157 3.4 3.4 3.0 3.4 3.3 0.2 3.27 ± 0.67
PCB 180/193 147 149 145 152 148 3.0 147
PCB 200 4.2 4.8 4.3 4.4 4.4 0.2 4.30 ± 0.32
PCB 191 1.8 1.6 1.6 1.4 1.6 0.2 1.57 ± 0.45
PCB 170 45.5 44.4 41.8 41.8 43.4 1.9 42.6 ± 2.2
PCB 199 85.4 87.9 80.9 85.9 85.0 3.0 84.2 ± 8.0
PCB 196 70.4 80.1 72.9 72.7 74.0 4.2 74.5 ± 8.4
PCB 208 22.1 21.9 23.6 24.6 23.1 1.3 23.9 ±1.7
PCB 207 14.4 13.3 14.2 13.5 13.9 0.5 14.5 ± 2.4
PCB 195 13.9 13.5 14.5 14.8 14.2 0.6 14.3 ± 2.2
PCB 194 60.3 56.8 54.9 49.9 55.5 4.3 53.5 ± 5.2
PCB 206 43.9 43.4 46.2 41.1 43.7 2.1 44.9 ± 4.2
PCB 209 17.4 17.4 16.9 16.8 17.1 0.3 17.2 ± 1.9
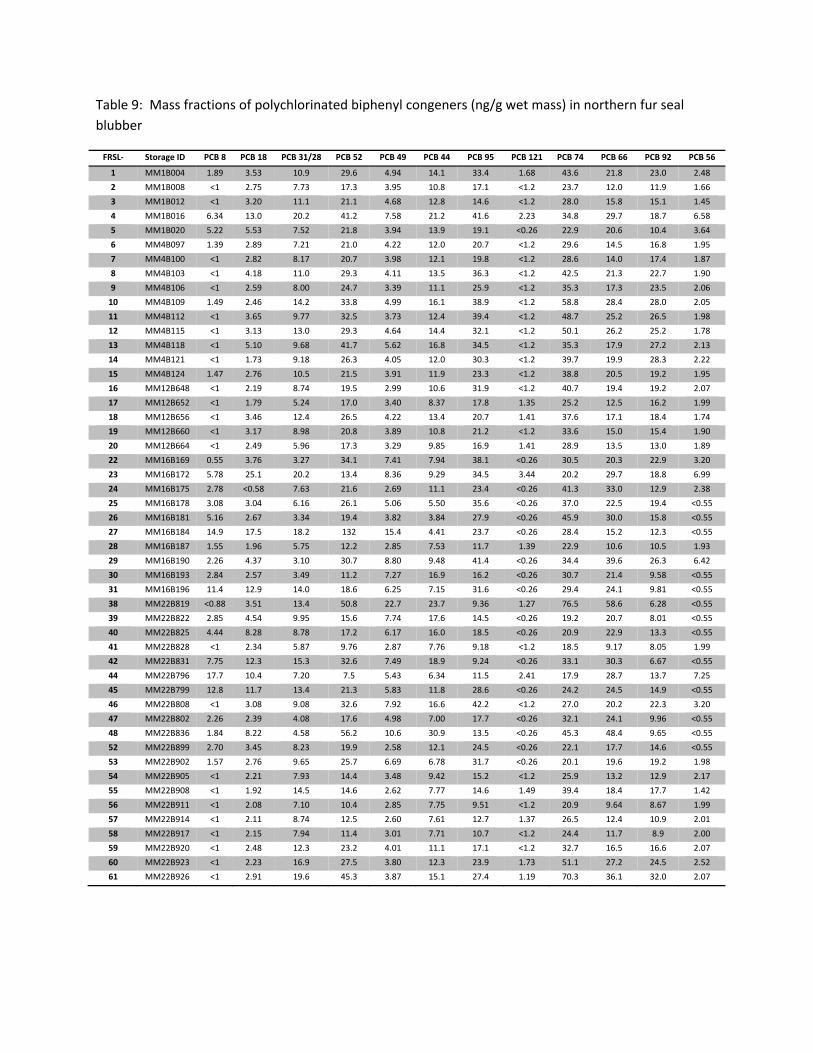
Table 9: Mass fractions of polychlorinated biphenyl congeners (ng/g wet mass) in northern fur seal
blubber
FRSL‐ Storage ID PCB 8 PCB 18 PCB 31/28 PCB 52 PCB 49 PCB 44 PCB 95 PCB 121 PCB 74 PCB 66 PCB 92 PCB 56
1 MM1B004 1.89 3.53 10.9 29.6 4.94 14.1 33.4 1.68 43.6 21.8 23.0 2.48
2 MM1B008 <1 2.75 7.73 17.3 3.95 10.8 17.1 <1.2 23.7 12.0 11.9 1.66
3 MM1B012 <1 3.20 11.1 21.1 4.68 12.8 14.6 <1.2 28.0 15.8 15.1 1.45
4 MM1B016 6.34 13.0 20.2 41.2 7.58 21.2 41.6 2.23 34.8 29.7 18.7 6.58
5 MM1B020 5.22 5.53 7.52 21.8 3.94 13.9 19.1 <0.26 22.9 20.6 10.4 3.64
6 MM4B097 1.39 2.89 7.21 21.0 4.22 12.0 20.7 <1.2 29.6 14.5 16.8 1.95
7 MM4B100 <1 2.82 8.17 20.7 3.98 12.1 19.8 <1.2 28.6 14.0 17.4 1.87
8 MM4B103 <1 4.18 11.0 29.3 4.11 13.5 36.3 <1.2 42.5 21.3 22.7 1.90
9 MM4B106 <1 2.59 8.00 24.7 3.39 11.1 25.9 <1.2 35.3 17.3 23.5 2.06
10 MM4B109 1.49 2.46 14.2 33.8 4.99 16.1 38.9 <1.2 58.8 28.4 28.0 2.05
11 MM4B112 <1 3.65 9.77 32.5 3.73 12.4 39.4 <1.2 48.7 25.2 26.5 1.98
12 MM4B115 <1 3.13 13.0 29.3 4.64 14.4 32.1 <1.2 50.1 26.2 25.2 1.78
13 MM4B118 <1 5.10 9.68 41.7 5.62 16.8 34.5 <1.2 35.3 17.9 27.2 2.13
14 MM4B121 <1 1.73 9.18 26.3 4.05 12.0 30.3 <1.2 39.7 19.9 28.3 2.22
15 MM4B124 1.47 2.76 10.5 21.5 3.91 11.9 23.3 <1.2 38.8 20.5 19.2 1.95
16 MM12B648 <1 2.19 8.74 19.5 2.99 10.6 31.9 <1.2 40.7 19.4 19.2 2.07
17 MM12B652 <1 1.79 5.24 17.0 3.40 8.37 17.8 1.35 25.2 12.5 16.2 1.99
18 MM12B656 <1 3.46 12.4 26.5 4.22 13.4 20.7 1.41 37.6 17.1 18.4 1.74
19 MM12B660 <1 3.17 8.98 20.8 3.89 10.8 21.2 <1.2 33.6 15.0 15.4 1.90
20 MM12B664 <1 2.49 5.96 17.3 3.29 9.85 16.9 1.41 28.9 13.5 13.0 1.89
22 MM16B169 0.55 3.76 3.27 34.1 7.41 7.94 38.1 <0.26 30.5 20.3 22.9 3.20
23 MM16B172 5.78 25.1 20.2 13.4 8.36 9.29 34.5 3.44 20.2 29.7 18.8 6.99
24 MM16B175 2.78 <0.58 7.63 21.6 2.69 11.1 23.4 <0.26 41.3 33.0 12.9 2.38
25 MM16B178 3.08 3.04 6.16 26.1 5.06 5.50 35.6 <0.26 37.0 22.5 19.4 <0.55
26 MM16B181 5.16 2.67 3.34 19.4 3.82 3.84 27.9 <0.26 45.9 30.0 15.8 <0.55
27 MM16B184 14.9 17.5 18.2 132 15.4 4.41 23.7 <0.26 28.4 15.2 12.3 <0.55
28 MM16B187 1.55 1.96 5.75 12.2 2.85 7.53 11.7 1.39 22.9 10.6 10.5 1.93
29 MM16B190 2.26 4.37 3.10 30.7 8.80 9.48 41.4 <0.26 34.4 39.6 26.3 6.42
30 MM16B193 2.84 2.57 3.49 11.2 7.27 16.9 16.2 <0.26 30.7 21.4 9.58 <0.55
31 MM16B196 11.4 12.9 14.0 18.6 6.25 7.15 31.6 <0.26 29.4 24.1 9.81 <0.55
38 MM22B819 <0.88 3.51 13.4 50.8 22.7 23.7 9.36 1.27 76.5 58.6 6.28 <0.55
39 MM22B822 2.85 4.54 9.95 15.6 7.74 17.6 14.5 <0.26 19.2 20.7 8.01 <0.55
40 MM22B825 4.44 8.28 8.78 17.2 6.17 16.0 18.5 <0.26 20.9 22.9 13.3 <0.55
41 MM22B828 <1 2.34 5.87 9.76 2.87 7.76 9.18 <1.2 18.5 9.17 8.05 1.99
42 MM22B831 7.75 12.3 15.3 32.6 7.49 18.9 9.24 <0.26 33.1 30.3 6.67 <0.55
44 MM22B796 17.7 10.4 7.20 7.5 5.43 6.34 11.5 2.41 17.9 28.7 13.7 7.25
45 MM22B799 12.8 11.7 13.4 21.3 5.83 11.8 28.6 <0.26 24.2 24.5 14.9 <0.55
46 MM22B808 <1 3.08 9.08 32.6 7.92 16.6 42.2 <1.2 27.0 20.2 22.3 3.20
47 MM22B802 2.26 2.39 4.08 17.6 4.98 7.00 17.7 <0.26 32.1 24.1 9.96 <0.55
48 MM22B836 1.84 8.22 4.58 56.2 10.6 30.9 13.5 <0.26 45.3 48.4 9.65 <0.55
52 MM22B899 2.70 3.45 8.23 19.9 2.58 12.1 24.5 <0.26 22.1 17.7 14.6 <0.55
53 MM22B902 1.57 2.76 9.65 25.7 6.69 6.78 31.7 <0.26 20.1 19.6 19.2 1.98
54 MM22B905 <1 2.21 7.93 14.4 3.48 9.42 15.2 <1.2 25.9 13.2 12.9 2.17
55 MM22B908 <1 1.92 14.5 14.6 2.62 7.77 14.6 1.49 39.4 18.4 17.7 1.42
56 MM22B911 <1 2.08 7.10 10.4 2.85 7.75 9.51 <1.2 20.9 9.64 8.67 1.99
57 MM22B914 <1 2.11 8.74 12.5 2.60 7.61 12.7 1.37 26.5 12.4 10.9 2.01
58 MM22B917 <1 2.15 7.94 11.4 3.01 7.71 10.7 <1.2 24.4 11.7 8.9 2.00
59 MM22B920 <1 2.48 12.3 23.2 4.01 11.1 17.1 <1.2 32.7 16.5 16.6 2.07
60 MM22B923 <1 2.23 16.9 27.5 3.80 12.3 23.9 1.73 51.1 27.2 24.5 2.52
61 MM22B926 <1 2.91 19.6 45.3 3.87 15.1 27.4 1.19 70.3 36.1 32.0 2.07
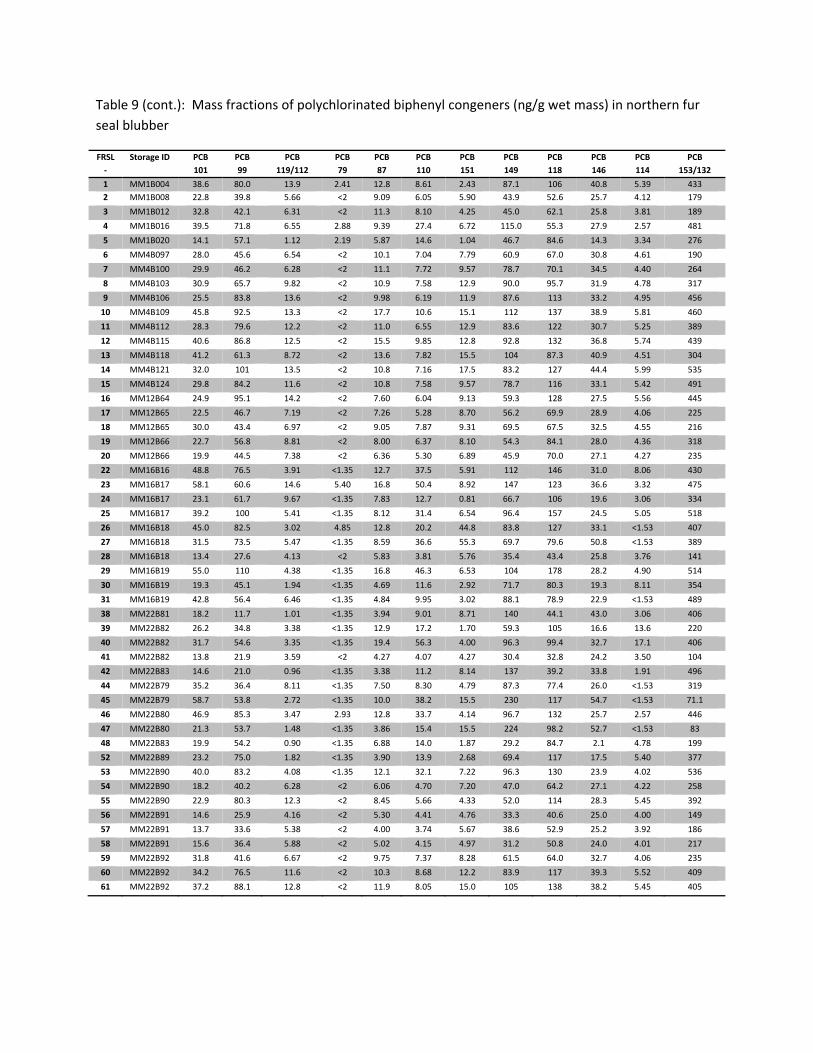
Table 9 (cont.): Mass fractions of polychlorinated biphenyl congeners (ng/g wet mass) in northern fur
seal blubber
FRSL
‐
Storage ID PCB
101
PCB
99
PCB
119/112
PCB
79
PCB
87
PCB
110
PCB
151
PCB
149
PCB
118
PCB
146
PCB
114
PCB
153/132
1 MM1B004 38.6 80.0 13.9 2.41 12.8 8.61 2.43 87.1 106 40.8 5.39 433
2 MM1B008 22.8 39.8 5.66 <2 9.09 6.05 5.90 43.9 52.6 25.7 4.12 179
3 MM1B012 32.8 42.1 6.31 <2 11.3 8.10 4.25 45.0 62.1 25.8 3.81 189
4 MM1B016 39.5 71.8 6.55 2.88 9.39 27.4 6.72 115.0 55.3 27.9 2.57 481
5 MM1B020 14.1 57.1 1.12 2.19 5.87 14.6 1.04 46.7 84.6 14.3 3.34 276
6 MM4B097 28.0 45.6 6.54 <2 10.1 7.04 7.79 60.9 67.0 30.8 4.61 190
7 MM4B100 29.9 46.2 6.28 <2 11.1 7.72 9.57 78.7 70.1 34.5 4.40 264
8 MM4B103 30.9 65.7 9.82 <2 10.9 7.58 12.9 90.0 95.7 31.9 4.78 317
9 MM4B106 25.5 83.8 13.6 <2 9.98 6.19 11.9 87.6 113 33.2 4.95 456
10 MM4B109 45.8 92.5 13.3 <2 17.7 10.6 15.1 112 137 38.9 5.81 460
11 MM4B112 28.3 79.6 12.2 <2 11.0 6.55 12.9 83.6 122 30.7 5.25 389
12 MM4B115 40.6 86.8 12.5 <2 15.5 9.85 12.8 92.8 132 36.8 5.74 439
13 MM4B118 41.2 61.3 8.72 <2 13.6 7.82 15.5 104 87.3 40.9 4.51 304
14 MM4B121 32.0 101 13.5 <2 10.8 7.16 17.5 83.2 127 44.4 5.99 535
15 MM4B124 29.8 84.2 11.6 <2 10.8 7.58 9.57 78.7 116 33.1 5.42 491
16 MM12B64 24.9 95.1 14.2 <2 7.60 6.04 9.13 59.3 128 27.5 5.56 445
17 MM12B65 22.5 46.7 7.19 <2 7.26 5.28 8.70 56.2 69.9 28.9 4.06 225
18 MM12B65 30.0 43.4 6.97 <2 9.05 7.87 9.31 69.5 67.5 32.5 4.55 216
19 MM12B66 22.7 56.8 8.81 <2 8.00 6.37 8.10 54.3 84.1 28.0 4.36 318
20 MM12B66 19.9 44.5 7.38 <2 6.36 5.30 6.89 45.9 70.0 27.1 4.27 235
22 MM16B16 48.8 76.5 3.91 <1.35 12.7 37.5 5.91 112 146 31.0 8.06 430
23 MM16B17 58.1 60.6 14.6 5.40 16.8 50.4 8.92 147 123 36.6 3.32 475
24 MM16B17 23.1 61.7 9.67 <1.35 7.83 12.7 0.81 66.7 106 19.6 3.06 334
25 MM16B17 39.2 100 5.41 <1.35 8.12 31.4 6.54 96.4 157 24.5 5.05 518
26 MM16B18 45.0 82.5 3.02 4.85 12.8 20.2 44.8 83.8 127 33.1 <1.53 407
27 MM16B18 31.5 73.5 5.47 <1.35 8.59 36.6 55.3 69.7 79.6 50.8 <1.53 389
28 MM16B18 13.4 27.6 4.13 <2 5.83 3.81 5.76 35.4 43.4 25.8 3.76 141
29 MM16B19 55.0 110 4.38 <1.35 16.8 46.3 6.53 104 178 28.2 4.90 514
30 MM16B19 19.3 45.1 1.94 <1.35 4.69 11.6 2.92 71.7 80.3 19.3 8.11 354
31 MM16B19 42.8 56.4 6.46 <1.35 4.84 9.95 3.02 88.1 78.9 22.9 <1.53 489
38 MM22B81 18.2 11.7 1.01 <1.35 3.94 9.01 8.71 140 44.1 43.0 3.06 406
39 MM22B82 26.2 34.8 3.38 <1.35 12.9 17.2 1.70 59.3 105 16.6 13.6 220
40 MM22B82 31.7 54.6 3.35 <1.35 19.4 56.3 4.00 96.3 99.4 32.7 17.1 406
41 MM22B82 13.8 21.9 3.59 <2 4.27 4.07 4.27 30.4 32.8 24.2 3.50 104
42 MM22B83 14.6 21.0 0.96 <1.35 3.38 11.2 8.14 137 39.2 33.8 1.91 496
44 MM22B79 35.2 36.4 8.11 <1.35 7.50 8.30 4.79 87.3 77.4 26.0 <1.53 319
45 MM22B79 58.7 53.8 2.72 <1.35 10.0 38.2 15.5 230 117 54.7 <1.53 71.1
46 MM22B80 46.9 85.3 3.47 2.93 12.8 33.7 4.14 96.7 132 25.7 2.57 446
47 MM22B80 21.3 53.7 1.48 <1.35 3.86 15.4 15.5 224 98.2 52.7 <1.53 83
48 MM22B83 19.9 54.2 0.90 <1.35 6.88 14.0 1.87 29.2 84.7 2.1 4.78 199
52 MM22B89 23.2 75.0 1.82 <1.35 3.90 13.9 2.68 69.4 117 17.5 5.40 377
53 MM22B90 40.0 83.2 4.08 <1.35 12.1 32.1 7.22 96.3 130 23.9 4.02 536
54 MM22B90 18.2 40.2 6.28 <2 6.06 4.70 7.20 47.0 64.2 27.1 4.22 258
55 MM22B90 22.9 80.3 12.3 <2 8.45 5.66 4.33 52.0 114 28.3 5.45 392
56 MM22B91 14.6 25.9 4.16 <2 5.30 4.41 4.76 33.3 40.6 25.0 4.00 149
57 MM22B91 13.7 33.6 5.38 <2 4.00 3.74 5.67 38.6 52.9 25.2 3.92 186
58 MM22B91 15.6 36.4 5.88 <2 5.02 4.15 4.97 31.2 50.8 24.0 4.01 217
59 MM22B92 31.8 41.6 6.67 <2 9.75 7.37 8.28 61.5 64.0 32.7 4.06 235
60 MM22B92 34.2 76.5 11.6 <2 10.3 8.68 12.2 83.9 117 39.3 5.52 409
61 MM22B92 37.2 88.1 12.8 <2 11.9 8.05 15.0 105 138 38.2 5.45 405
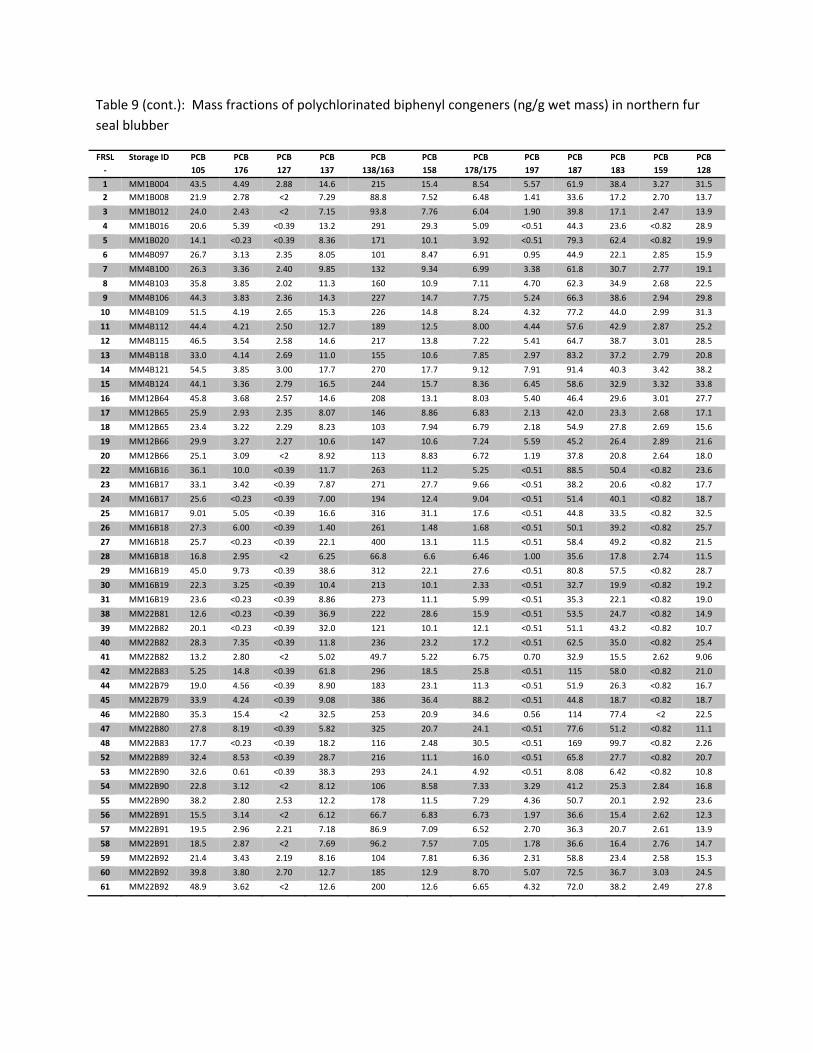
Table 9 (cont.): Mass fractions of polychlorinated biphenyl congeners (ng/g wet mass) in northern fur
seal blubber
FRSL
‐
Storage ID PCB
105
PCB
176
PCB
127
PCB
137
PCB
138/163
PCB
158
PCB
178/175
PCB
197
PCB
187
PCB
183
PCB
159
PCB
128
1 MM1B004 43.5 4.49 2.88 14.6 215 15.4 8.54 5.57 61.9 38.4 3.27 31.5
2 MM1B008 21.9 2.78 <2 7.29 88.8 7.52 6.48 1.41 33.6 17.2 2.70 13.7
3 MM1B012 24.0 2.43 <2 7.15 93.8 7.76 6.04 1.90 39.8 17.1 2.47 13.9
4 MM1B016 20.6 5.39 <0.39 13.2 291 29.3 5.09 <0.51 44.3 23.6 <0.82 28.9
5 MM1B020 14.1 <0.23 <0.39 8.36 171 10.1 3.92 <0.51 79.3 62.4 <0.82 19.9
6 MM4B097 26.7 3.13 2.35 8.05 101 8.47 6.91 0.95 44.9 22.1 2.85 15.9
7 MM4B100 26.3 3.36 2.40 9.85 132 9.34 6.99 3.38 61.8 30.7 2.77 19.1
8 MM4B103 35.8 3.85 2.02 11.3 160 10.9 7.11 4.70 62.3 34.9 2.68 22.5
9 MM4B106 44.3 3.83 2.36 14.3 227 14.7 7.75 5.24 66.3 38.6 2.94 29.8
10 MM4B109 51.5 4.19 2.65 15.3 226 14.8 8.24 4.32 77.2 44.0 2.99 31.3
11 MM4B112 44.4 4.21 2.50 12.7 189 12.5 8.00 4.44 57.6 42.9 2.87 25.2
12 MM4B115 46.5 3.54 2.58 14.6 217 13.8 7.22 5.41 64.7 38.7 3.01 28.5
13 MM4B118 33.0 4.14 2.69 11.0 155 10.6 7.85 2.97 83.2 37.2 2.79 20.8
14 MM4B121 54.5 3.85 3.00 17.7 270 17.7 9.12 7.91 91.4 40.3 3.42 38.2
15 MM4B124 44.1 3.36 2.79 16.5 244 15.7 8.36 6.45 58.6 32.9 3.32 33.8
16 MM12B64 45.8 3.68 2.57 14.6 208 13.1 8.03 5.40 46.4 29.6 3.01 27.7
17 MM12B65 25.9 2.93 2.35 8.07 146 8.86 6.83 2.13 42.0 23.3 2.68 17.1
18 MM12B65 23.4 3.22 2.29 8.23 103 7.94 6.79 2.18 54.9 27.8 2.69 15.6
19 MM12B66 29.9 3.27 2.27 10.6 147 10.6 7.24 5.59 45.2 26.4 2.89 21.6
20 MM12B66 25.1 3.09 <2 8.92 113 8.83 6.72 1.19 37.8 20.8 2.64 18.0
22 MM16B16 36.1 10.0 <0.39 11.7 263 11.2 5.25 <0.51 88.5 50.4 <0.82 23.6
23 MM16B17 33.1 3.42 <0.39 7.87 271 27.7 9.66 <0.51 38.2 20.6 <0.82 17.7
24 MM16B17 25.6 <0.23 <0.39 7.00 194 12.4 9.04 <0.51 51.4 40.1 <0.82 18.7
25 MM16B17 9.01 5.05 <0.39 16.6 316 31.1 17.6 <0.51 44.8 33.5 <0.82 32.5
26 MM16B18 27.3 6.00 <0.39 1.40 261 1.48 1.68 <0.51 50.1 39.2 <0.82 25.7
27 MM16B18 25.7 <0.23 <0.39 22.1 400 13.1 11.5 <0.51 58.4 49.2 <0.82 21.5
28 MM16B18 16.8 2.95 <2 6.25 66.8 6.6 6.46 1.00 35.6 17.8 2.74 11.5
29 MM16B19 45.0 9.73 <0.39 38.6 312 22.1 27.6 <0.51 80.8 57.5 <0.82 28.7
30 MM16B19 22.3 3.25 <0.39 10.4 213 10.1 2.33 <0.51 32.7 19.9 <0.82 19.2
31 MM16B19 23.6 <0.23 <0.39 8.86 273 11.1 5.99 <0.51 35.3 22.1 <0.82 19.0
38 MM22B81 12.6 <0.23 <0.39 36.9 222 28.6 15.9 <0.51 53.5 24.7 <0.82 14.9
39 MM22B82 20.1 <0.23 <0.39 32.0 121 10.1 12.1 <0.51 51.1 43.2 <0.82 10.7
40 MM22B82 28.3 7.35 <0.39 11.8 236 23.2 17.2 <0.51 62.5 35.0 <0.82 25.4
41 MM22B82 13.2 2.80 <2 5.02 49.7 5.22 6.75 0.70 32.9 15.5 2.62 9.06
42 MM22B83 5.25 14.8 <0.39 61.8 296 18.5 25.8 <0.51 115 58.0 <0.82 21.0
44 MM22B79 19.0 4.56 <0.39 8.90 183 23.1 11.3 <0.51 51.9 26.3 <0.82 16.7
45 MM22B79 33.9 4.24 <0.39 9.08 386 36.4 88.2 <0.51 44.8 18.7 <0.82 18.7
46 MM22B80 35.3 15.4 <2 32.5 253 20.9 34.6 0.56 114 77.4 <2 22.5
47 MM22B80 27.8 8.19 <0.39 5.82 325 20.7 24.1 <0.51 77.6 51.2 <0.82 11.1
48 MM22B83 17.7 <0.23 <0.39 18.2 116 2.48 30.5 <0.51 169 99.7 <0.82 2.26
52 MM22B89 32.4 8.53 <0.39 28.7 216 11.1 16.0 <0.51 65.8 27.7 <0.82 20.7
53 MM22B90 32.6 0.61 <0.39 38.3 293 24.1 4.92 <0.51 8.08 6.42 <0.82 10.8
54 MM22B90 22.8 3.12 <2 8.12 106 8.58 7.33 3.29 41.2 25.3 2.84 16.8
55 MM22B90 38.2 2.80 2.53 12.2 178 11.5 7.29 4.36 50.7 20.1 2.92 23.6
56 MM22B91 15.5 3.14 <2 6.12 66.7 6.83 6.73 1.97 36.6 15.4 2.62 12.3
57 MM22B91 19.5 2.96 2.21 7.18 86.9 7.09 6.52 2.70 36.3 20.7 2.61 13.9
58 MM22B91 18.5 2.87 <2 7.69 96.2 7.57 7.05 1.78 36.6 16.4 2.76 14.7
59 MM22B92 21.4 3.43 2.19 8.16 104 7.81 6.36 2.31 58.8 23.4 2.58 15.3
60 MM22B92 39.8 3.80 2.70 12.7 185 12.9 8.70 5.07 72.5 36.7 3.03 24.5
61 MM22B92 48.9 3.62 <2 12.6 200 12.6 6.65 4.32 72.0 38.2 2.49 27.8
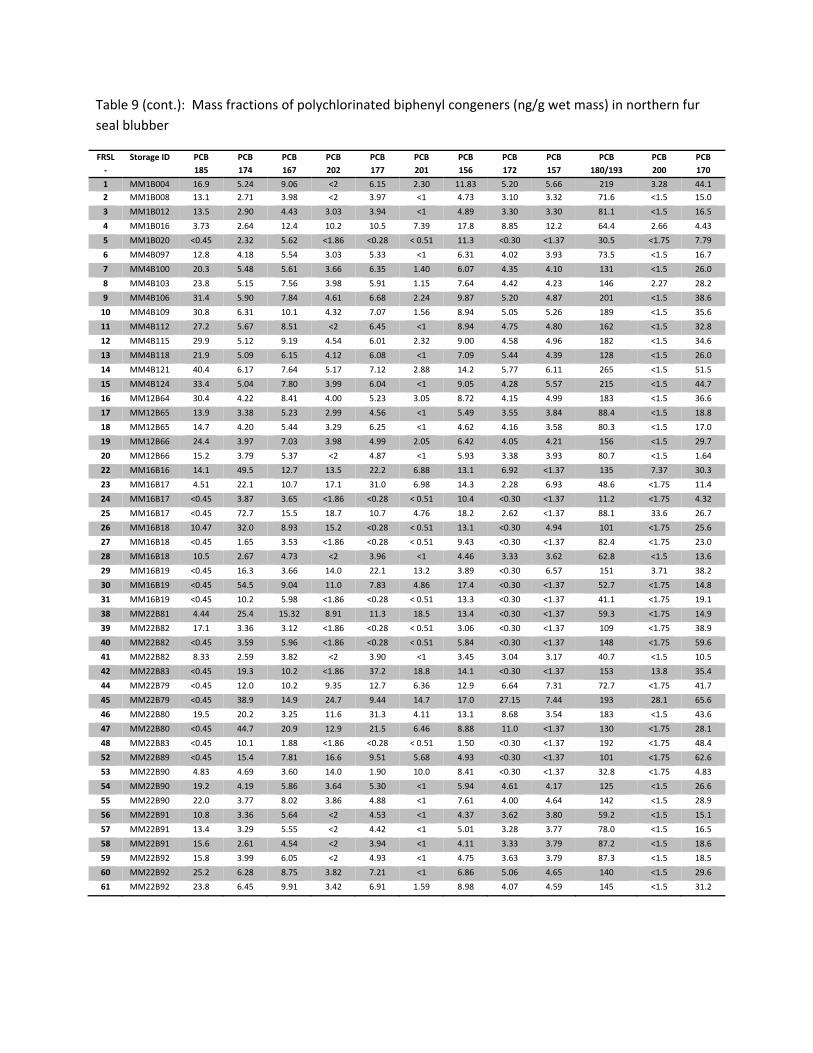
Table 9 (cont.): Mass fractions of polychlorinated biphenyl congeners (ng/g wet mass) in northern fur
seal blubber
FRSL
‐
Storage ID PCB
185
PCB
174
PCB
167
PCB
202
PCB
177
PCB
201
PCB
156
PCB
172
PCB
157
PCB
180/193
PCB
200
PCB
170
1 MM1B004 16.9 5.24 9.06 <2 6.15 2.30 11.83 5.20 5.66 219 3.28 44.1
2 MM1B008 13.1 2.71 3.98 <2 3.97 <1 4.73 3.10 3.32 71.6 <1.5 15.0
3 MM1B012 13.5 2.90 4.43 3.03 3.94 <1 4.89 3.30 3.30 81.1 <1.5 16.5
4 MM1B016 3.73 2.64 12.4 10.2 10.5 7.39 17.8 8.85 12.2 64.4 2.66 4.43
5 MM1B020 <0.45 2.32 5.62 <1.86 <0.28 < 0.51 11.3 <0.30 <1.37 30.5 <1.75 7.79
6 MM4B097 12.8 4.18 5.54 3.03 5.33 <1 6.31 4.02 3.93 73.5 <1.5 16.7
7 MM4B100 20.3 5.48 5.61 3.66 6.35 1.40 6.07 4.35 4.10 131 <1.5 26.0
8 MM4B103 23.8 5.15 7.56 3.98 5.91 1.15 7.64 4.42 4.23 146 2.27 28.2
9 MM4B106 31.4 5.90 7.84 4.61 6.68 2.24 9.87 5.20 4.87 201 <1.5 38.6
10 MM4B109 30.8 6.31 10.1 4.32 7.07 1.56 8.94 5.05 5.26 189 <1.5 35.6
11 MM4B112 27.2 5.67 8.51 <2 6.45 <1 8.94 4.75 4.80 162 <1.5 32.8
12 MM4B115 29.9 5.12 9.19 4.54 6.01 2.32 9.00 4.58 4.96 182 <1.5 34.6
13 MM4B118 21.9 5.09 6.15 4.12 6.08 <1 7.09 5.44 4.39 128 <1.5 26.0
14 MM4B121 40.4 6.17 7.64 5.17 7.12 2.88 14.2 5.77 6.11 265 <1.5 51.5
15 MM4B124 33.4 5.04 7.80 3.99 6.04 <1 9.05 4.28 5.57 215 <1.5 44.7
16 MM12B64 30.4 4.22 8.41 4.00 5.23 3.05 8.72 4.15 4.99 183 <1.5 36.6
17 MM12B65 13.9 3.38 5.23 2.99 4.56 <1 5.49 3.55 3.84 88.4 <1.5 18.8
18 MM12B65 14.7 4.20 5.44 3.29 6.25 <1 4.62 4.16 3.58 80.3 <1.5 17.0
19 MM12B66 24.4 3.97 7.03 3.98 4.99 2.05 6.42 4.05 4.21 156 <1.5 29.7
20 MM12B66 15.2 3.79 5.37 <2 4.87 <1 5.93 3.38 3.93 80.7 <1.5 1.64
22 MM16B16 14.1 49.5 12.7 13.5 22.2 6.88 13.1 6.92 <1.37 135 7.37 30.3
23 MM16B17 4.51 22.1 10.7 17.1 31.0 6.98 14.3 2.28 6.93 48.6 <1.75 11.4
24 MM16B17 <0.45 3.87 3.65 <1.86 <0.28 < 0.51 10.4 <0.30 <1.37 11.2 <1.75 4.32
25 MM16B17 <0.45 72.7 15.5 18.7 10.7 4.76 18.2 2.62 <1.37 88.1 33.6 26.7
26 MM16B18 10.47 32.0 8.93 15.2 <0.28 < 0.51 13.1 <0.30 4.94 101 <1.75 25.6
27 MM16B18 <0.45 1.65 3.53 <1.86 <0.28 < 0.51 9.43 <0.30 <1.37 82.4 <1.75 23.0
28 MM16B18 10.5 2.67 4.73 <2 3.96 <1 4.46 3.33 3.62 62.8 <1.5 13.6
29 MM16B19 <0.45 16.3 3.66 14.0 22.1 13.2 3.89 <0.30 6.57 151 3.71 38.2
30 MM16B19 <0.45 54.5 9.04 11.0 7.83 4.86 17.4 <0.30 <1.37 52.7 <1.75 14.8
31 MM16B19 <0.45 10.2 5.98 <1.86 <0.28 < 0.51 13.3 <0.30 <1.37 41.1 <1.75 19.1
38 MM22B81 4.44 25.4 15.32 8.91 11.3 18.5 13.4 <0.30 <1.37 59.3 <1.75 14.9
39 MM22B82 17.1 3.36 3.12 <1.86 <0.28 < 0.51 3.06 <0.30 <1.37 109 <1.75 38.9
40 MM22B82 <0.45 3.59 5.96 <1.86 <0.28 < 0.51 5.84 <0.30 <1.37 148 <1.75 59.6
41 MM22B82 8.33 2.59 3.82 <2 3.90 <1 3.45 3.04 3.17 40.7 <1.5 10.5
42 MM22B83 <0.45 19.3 10.2 <1.86 37.2 18.8 14.1 <0.30 <1.37 153 13.8 35.4
44 MM22B79 <0.45 12.0 10.2 9.35 12.7 6.36 12.9 6.64 7.31 72.7 <1.75 41.7
45 MM22B79 <0.45 38.9 14.9 24.7 9.44 14.7 17.0 27.15 7.44 193 28.1 65.6
46 MM22B80 19.5 20.2 3.25 11.6 31.3 4.11 13.1 8.68 3.54 183 <1.5 43.6
47 MM22B80 <0.45 44.7 20.9 12.9 21.5 6.46 8.88 11.0 <1.37 130 <1.75 28.1
48 MM22B83 <0.45 10.1 1.88 <1.86 <0.28 < 0.51 1.50 <0.30 <1.37 192 <1.75 48.4
52 MM22B89 <0.45 15.4 7.81 16.6 9.51 5.68 4.93 <0.30 <1.37 101 <1.75 62.6
53 MM22B90 4.83 4.69 3.60 14.0 1.90 10.0 8.41 <0.30 <1.37 32.8 <1.75 4.83
54 MM22B90 19.2 4.19 5.86 3.64 5.30 <1 5.94 4.61 4.17 125 <1.5 26.6
55 MM22B90 22.0 3.77 8.02 3.86 4.88 <1 7.61 4.00 4.64 142 <1.5 28.9
56 MM22B91 10.8 3.36 5.64 <2 4.53 <1 4.37 3.62 3.80 59.2 <1.5 15.1
57 MM22B91 13.4 3.29 5.55 <2 4.42 <1 5.01 3.28 3.77 78.0 <1.5 16.5
58 MM22B91 15.6 2.61 4.54 <2 3.94 <1 4.11 3.33 3.79 87.2 <1.5 18.6
59 MM22B92 15.8 3.99 6.05 <2 4.93 <1 4.75 3.63 3.79 87.3 <1.5 18.5
60 MM22B92 25.2 6.28 8.75 3.82 7.21 <1 6.86 5.06 4.65 140 <1.5 29.6
61 MM22B92 23.8 6.45 9.91 3.42 6.91 1.59 8.98 4.07 4.59 145 <1.5 31.2
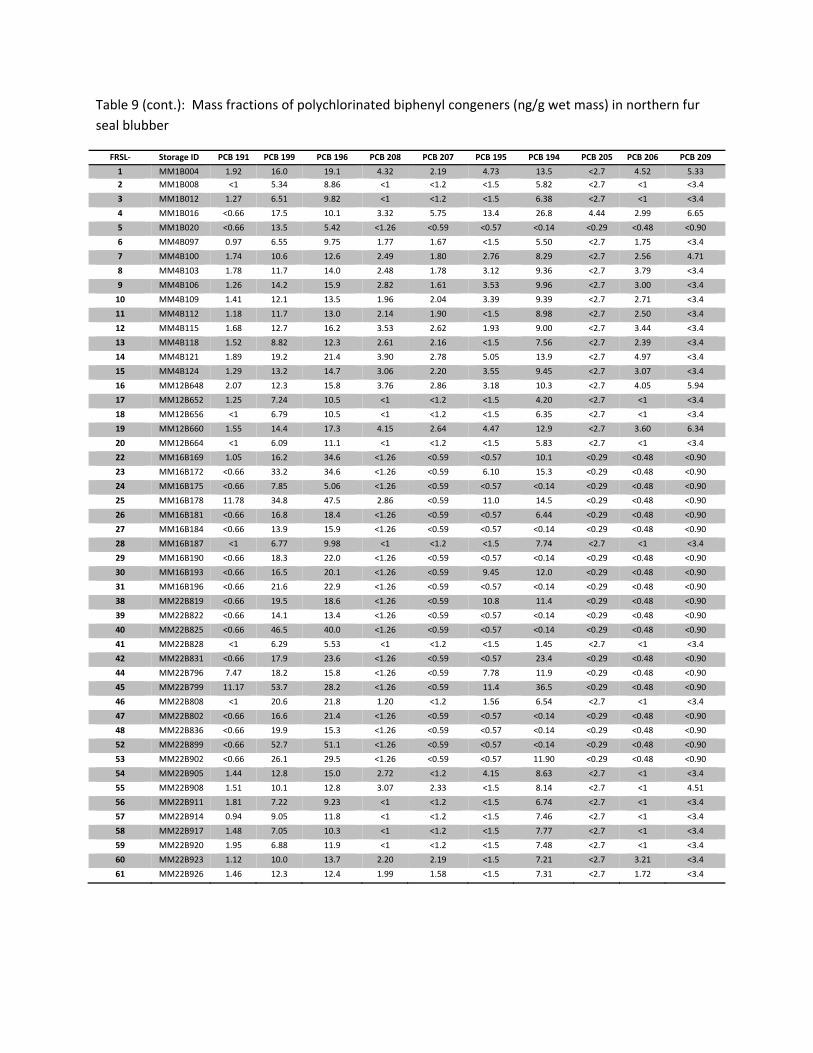
Table 9 (cont.): Mass fractions of polychlorinated biphenyl congeners (ng/g wet mass) in northern fur
seal blubber
FRSL‐ Storage ID PCB 191 PCB 199 PCB 196 PCB 208 PCB 207 PCB 195 PCB 194 PCB 205 PCB 206 PCB 209
1 MM1B004 1.92 16.0 19.1 4.32 2.19 4.73 13.5 <2.7 4.52 5.33
2 MM1B008 <1 5.34 8.86 <1 <1.2 <1.5 5.82 <2.7 <1 <3.4
3 MM1B012 1.27 6.51 9.82 <1 <1.2 <1.5 6.38 <2.7 <1 <3.4
4 MM1B016 <0.66 17.5 10.1 3.32 5.75 13.4 26.8 4.44 2.99 6.65
5 MM1B020 <0.66 13.5 5.42 <1.26 <0.59 <0.57 <0.14 <0.29 <0.48 <0.90
6 MM4B097 0.97 6.55 9.75 1.77 1.67 <1.5 5.50 <2.7 1.75 <3.4
7 MM4B100 1.74 10.6 12.6 2.49 1.80 2.76 8.29 <2.7 2.56 4.71
8 MM4B103 1.78 11.7 14.0 2.48 1.78 3.12 9.36 <2.7 3.79 <3.4
9 MM4B106 1.26 14.2 15.9 2.82 1.61 3.53 9.96 <2.7 3.00 <3.4
10 MM4B109 1.41 12.1 13.5 1.96 2.04 3.39 9.39 <2.7 2.71 <3.4
11 MM4B112 1.18 11.7 13.0 2.14 1.90 <1.5 8.98 <2.7 2.50 <3.4
12 MM4B115 1.68 12.7 16.2 3.53 2.62 1.93 9.00 <2.7 3.44 <3.4
13 MM4B118 1.52 8.82 12.3 2.61 2.16 <1.5 7.56 <2.7 2.39 <3.4
14 MM4B121 1.89 19.2 21.4 3.90 2.78 5.05 13.9 <2.7 4.97 <3.4
15 MM4B124 1.29 13.2 14.7 3.06 2.20 3.55 9.45 <2.7 3.07 <3.4
16 MM12B648 2.07 12.3 15.8 3.76 2.86 3.18 10.3 <2.7 4.05 5.94
17 MM12B652 1.25 7.24 10.5 <1 <1.2 <1.5 4.20 <2.7 <1 <3.4
18 MM12B656 <1 6.79 10.5 <1 <1.2 <1.5 6.35 <2.7 <1 <3.4
19 MM12B660 1.55 14.4 17.3 4.15 2.64 4.47 12.9 <2.7 3.60 6.34
20 MM12B664 <1 6.09 11.1 <1 <1.2 <1.5 5.83 <2.7 <1 <3.4
22 MM16B169 1.05 16.2 34.6 <1.26 <0.59 <0.57 10.1 <0.29 <0.48 <0.90
23 MM16B172 <0.66 33.2 34.6 <1.26 <0.59 6.10 15.3 <0.29 <0.48 <0.90
24 MM16B175 <0.66 7.85 5.06 <1.26 <0.59 <0.57 <0.14 <0.29 <0.48 <0.90
25 MM16B178 11.78 34.8 47.5 2.86 <0.59 11.0 14.5 <0.29 <0.48 <0.90
26 MM16B181 <0.66 16.8 18.4 <1.26 <0.59 <0.57 6.44 <0.29 <0.48 <0.90
27 MM16B184 <0.66 13.9 15.9 <1.26 <0.59 <0.57 <0.14 <0.29 <0.48 <0.90
28 MM16B187 <1 6.77 9.98 <1 <1.2 <1.5 7.74 <2.7 <1 <3.4
29 MM16B190 <0.66 18.3 22.0 <1.26 <0.59 <0.57 <0.14 <0.29 <0.48 <0.90
30 MM16B193 <0.66 16.5 20.1 <1.26 <0.59 9.45 12.0 <0.29 <0.48 <0.90
31 MM16B196 <0.66 21.6 22.9 <1.26 <0.59 <0.57 <0.14 <0.29 <0.48 <0.90
38 MM22B819 <0.66 19.5 18.6 <1.26 <0.59 10.8 11.4 <0.29 <0.48 <0.90
39 MM22B822 <0.66 14.1 13.4 <1.26 <0.59 <0.57 <0.14 <0.29 <0.48 <0.90
40 MM22B825 <0.66 46.5 40.0 <1.26 <0.59 <0.57 <0.14 <0.29 <0.48 <0.90
41 MM22B828 <1 6.29 5.53 <1 <1.2 <1.5 1.45 <2.7 <1 <3.4
42 MM22B831 <0.66 17.9 23.6 <1.26 <0.59 <0.57 23.4 <0.29 <0.48 <0.90
44 MM22B796 7.47 18.2 15.8 <1.26 <0.59 7.78 11.9 <0.29 <0.48 <0.90
45 MM22B799 11.17 53.7 28.2 <1.26 <0.59 11.4 36.5 <0.29 <0.48 <0.90
46 MM22B808 <1 20.6 21.8 1.20 <1.2 1.56 6.54 <2.7 <1 <3.4
47 MM22B802 <0.66 16.6 21.4 <1.26 <0.59 <0.57 <0.14 <0.29 <0.48 <0.90
48 MM22B836 <0.66 19.9 15.3 <1.26 <0.59 <0.57 <0.14 <0.29 <0.48 <0.90
52 MM22B899 <0.66 52.7 51.1 <1.26 <0.59 <0.57 <0.14 <0.29 <0.48 <0.90
53 MM22B902 <0.66 26.1 29.5 <1.26 <0.59 <0.57 11.90 <0.29 <0.48 <0.90
54 MM22B905 1.44 12.8 15.0 2.72 <1.2 4.15 8.63 <2.7 <1 <3.4
55 MM22B908 1.51 10.1 12.8 3.07 2.33 <1.5 8.14 <2.7 <1 4.51
56 MM22B911 1.81 7.22 9.23 <1 <1.2 <1.5 6.74 <2.7 <1 <3.4
57 MM22B914 0.94 9.05 11.8 <1 <1.2 <1.5 7.46 <2.7 <1 <3.4
58 MM22B917 1.48 7.05 10.3 <1 <1.2 <1.5 7.77 <2.7 <1 <3.4
59 MM22B920 1.95 6.88 11.9 <1 <1.2 <1.5 7.48 <2.7 <1 <3.4
60 MM22B923 1.12 10.0 13.7 2.20 2.19 <1.5 7.21 <2.7 3.21 <3.4
61 MM22B926 1.46 12.3 12.4 1.99 1.58 <1.5 7.31 <2.7 1.72 <3.4
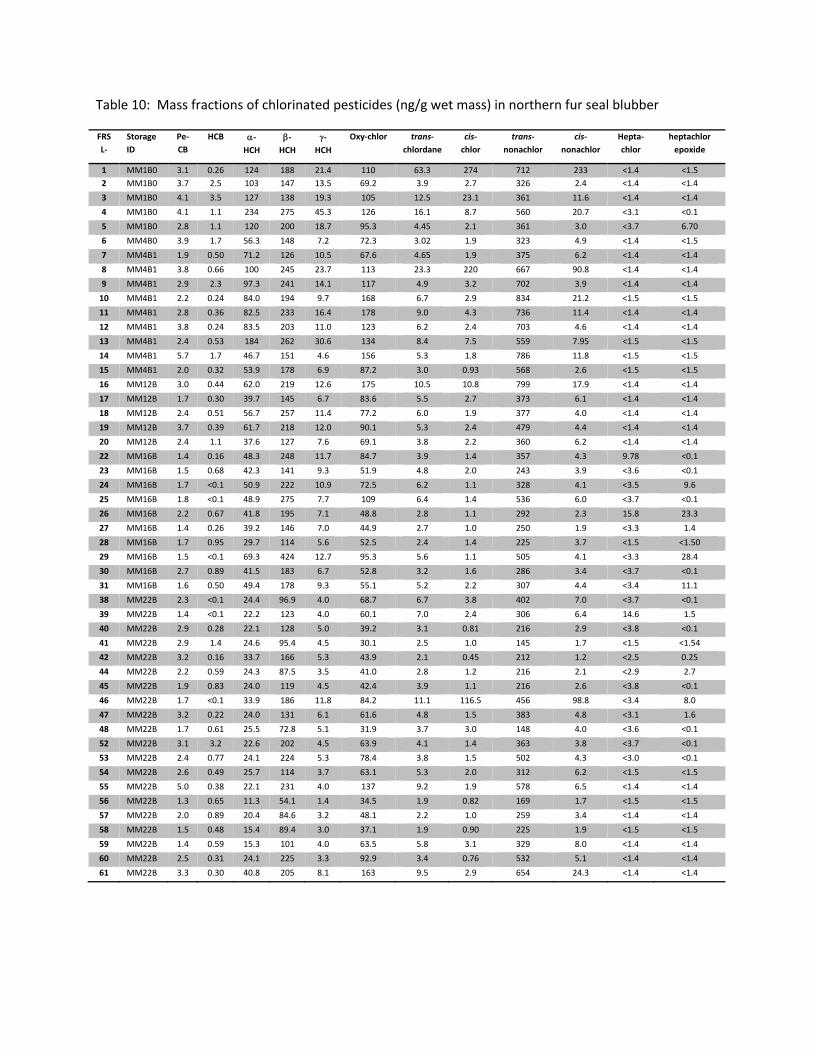
Table 10: Mass fractions of chlorinated pesticides (ng/g wet mass) in northern fur seal blubber
FRS
L‐
Storage
ID
Pe‐
CB
HCB ‐HCH
‐HCH
‐HCH
Oxy‐chlor trans‐
chlordane
cis‐
chlor
trans‐
nonachlor
cis‐
nonachlor
Hepta‐
chlor
heptachlor
epoxide
1 MM1B0 3.1 0.26 124 188 21.4 110 63.3 274 712 233 <1.4 <1.5
2 MM1B0 3.7 2.5 103 147 13.5 69.2 3.9 2.7 326 2.4 <1.4 <1.4
3 MM1B0 4.1 3.5 127 138 19.3 105 12.5 23.1 361 11.6 <1.4 <1.4
4 MM1B0 4.1 1.1 234 275 45.3 126 16.1 8.7 560 20.7 <3.1 <0.1
5 MM1B0 2.8 1.1 120 200 18.7 95.3 4.45 2.1 361 3.0 <3.7 6.70
6 MM4B0 3.9 1.7 56.3 148 7.2 72.3 3.02 1.9 323 4.9 <1.4 <1.5
7 MM4B1 1.9 0.50 71.2 126 10.5 67.6 4.65 1.9 375 6.2 <1.4 <1.4
8 MM4B1 3.8 0.66 100 245 23.7 113 23.3 220 667 90.8 <1.4 <1.4
9 MM4B1 2.9 2.3 97.3 241 14.1 117 4.9 3.2 702 3.9 <1.4 <1.4
10 MM4B1 2.2 0.24 84.0 194 9.7 168 6.7 2.9 834 21.2 <1.5 <1.5
11 MM4B1 2.8 0.36 82.5 233 16.4 178 9.0 4.3 736 11.4 <1.4 <1.4
12 MM4B1 3.8 0.24 83.5 203 11.0 123 6.2 2.4 703 4.6 <1.4 <1.4
13 MM4B1 2.4 0.53 184 262 30.6 134 8.4 7.5 559 7.95 <1.5 <1.5
14 MM4B1 5.7 1.7 46.7 151 4.6 156 5.3 1.8 786 11.8 <1.5 <1.5
15 MM4B1 2.0 0.32 53.9 178 6.9 87.2 3.0 0.93 568 2.6 <1.5 <1.5
16 MM12B 3.0 0.44 62.0 219 12.6 175 10.5 10.8 799 17.9 <1.4 <1.4
17 MM12B 1.7 0.30 39.7 145 6.7 83.6 5.5 2.7 373 6.1 <1.4 <1.4
18 MM12B 2.4 0.51 56.7 257 11.4 77.2 6.0 1.9 377 4.0 <1.4 <1.4
19 MM12B 3.7 0.39 61.7 218 12.0 90.1 5.3 2.4 479 4.4 <1.4 <1.4
20 MM12B 2.4 1.1 37.6 127 7.6 69.1 3.8 2.2 360 6.2 <1.4 <1.4
22 MM16B 1.4 0.16 48.3 248 11.7 84.7 3.9 1.4 357 4.3 9.78 <0.1
23 MM16B 1.5 0.68 42.3 141 9.3 51.9 4.8 2.0 243 3.9 <3.6 <0.1
24 MM16B 1.7 <0.1 50.9 222 10.9 72.5 6.2 1.1 328 4.1 <3.5 9.6
25 MM16B 1.8 <0.1 48.9 275 7.7 109 6.4 1.4 536 6.0 <3.7 <0.1
26 MM16B 2.2 0.67 41.8 195 7.1 48.8 2.8 1.1 292 2.3 15.8 23.3
27 MM16B 1.4 0.26 39.2 146 7.0 44.9 2.7 1.0 250 1.9 <3.3 1.4
28 MM16B 1.7 0.95 29.7 114 5.6 52.5 2.4 1.4 225 3.7 <1.5 <1.50
29 MM16B 1.5 <0.1 69.3 424 12.7 95.3 5.6 1.1 505 4.1 <3.3 28.4
30 MM16B 2.7 0.89 41.5 183 6.7 52.8 3.2 1.6 286 3.4 <3.7 <0.1
31 MM16B 1.6 0.50 49.4 178 9.3 55.1 5.2 2.2 307 4.4 <3.4 11.1
38 MM22B 2.3 <0.1 24.4 96.9 4.0 68.7 6.7 3.8 402 7.0 <3.7 <0.1
39 MM22B 1.4 <0.1 22.2 123 4.0 60.1 7.0 2.4 306 6.4 14.6 1.5
40 MM22B 2.9 0.28 22.1 128 5.0 39.2 3.1 0.81 216 2.9 <3.8 <0.1
41 MM22B 2.9 1.4 24.6 95.4 4.5 30.1 2.5 1.0 145 1.7 <1.5 <1.54
42 MM22B 3.2 0.16 33.7 166 5.3 43.9 2.1 0.45 212 1.2 <2.5 0.25
44 MM22B 2.2 0.59 24.3 87.5 3.5 41.0 2.8 1.2 216 2.1 <2.9 2.7
45 MM22B 1.9 0.83 24.0 119 4.5 42.4 3.9 1.1 216 2.6 <3.8 <0.1
46 MM22B 1.7 <0.1 33.9 186 11.8 84.2 11.1 116.5 456 98.8 <3.4 8.0
47 MM22B 3.2 0.22 24.0 131 6.1 61.6 4.8 1.5 383 4.8 <3.1 1.6
48 MM22B 1.7 0.61 25.5 72.8 5.1 31.9 3.7 3.0 148 4.0 <3.6 <0.1
52 MM22B 3.1 3.2 22.6 202 4.5 63.9 4.1 1.4 363 3.8 <3.7 <0.1
53 MM22B 2.4 0.77 24.1 224 5.3 78.4 3.8 1.5 502 4.3 <3.0 <0.1
54 MM22B 2.6 0.49 25.7 114 3.7 63.1 5.3 2.0 312 6.2 <1.5 <1.5
55 MM22B 5.0 0.38 22.1 231 4.0 137 9.2 1.9 578 6.5 <1.4 <1.4
56 MM22B 1.3 0.65 11.3 54.1 1.4 34.5 1.9 0.82 169 1.7 <1.5 <1.5
57 MM22B 2.0 0.89 20.4 84.6 3.2 48.1 2.2 1.0 259 3.4 <1.4 <1.4
58 MM22B 1.5 0.48 15.4 89.4 3.0 37.1 1.9 0.90 225 1.9 <1.5 <1.5
59 MM22B 1.4 0.59 15.3 101 4.0 63.5 5.8 3.1 329 8.0 <1.4 <1.4
60 MM22B 2.5 0.31 24.1 225 3.3 92.9 3.4 0.76 532 5.1 <1.4 <1.4
61 MM22B 3.3 0.30 40.8 205 8.1 163 9.5 2.9 654 24.3 <1.4 <1.4
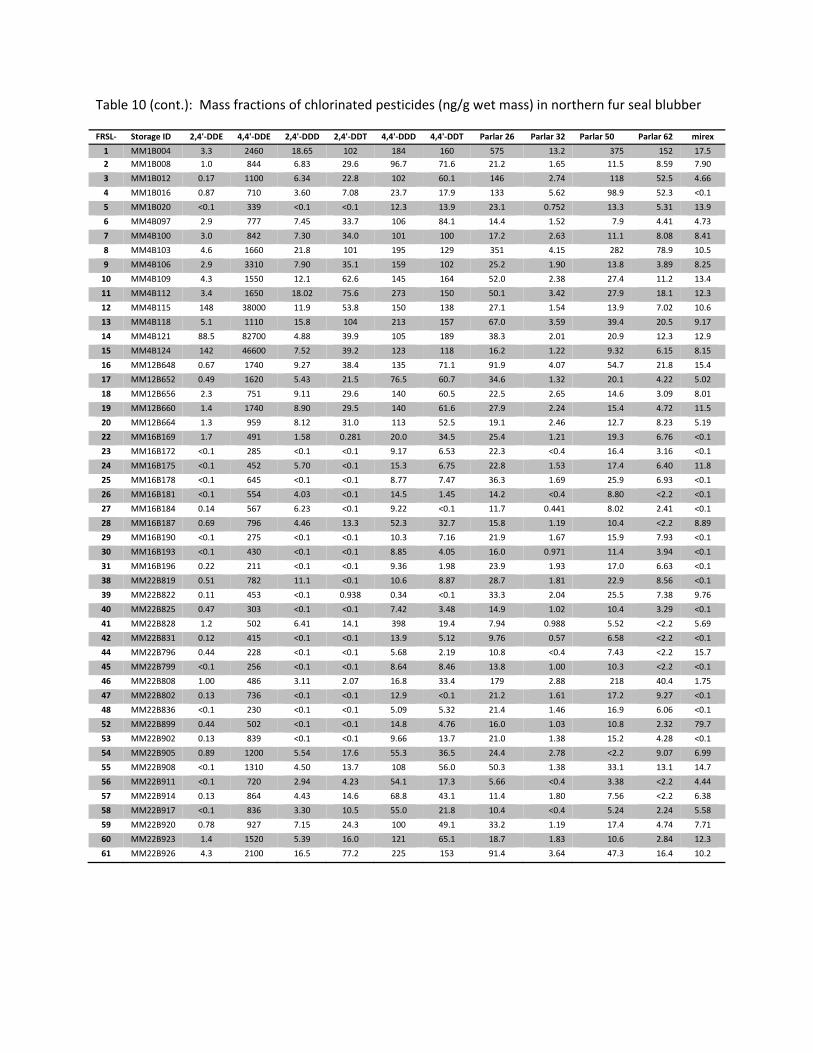
Table 10 (cont.): Mass fractions of chlorinated pesticides (ng/g wet mass) in northern fur seal blubber
FRSL‐ Storage ID 2,4'‐DDE 4,4'‐DDE 2,4'‐DDD 2,4'‐DDT 4,4'‐DDD 4,4'‐DDT Parlar 26 Parlar 32 Parlar 50 Parlar 62 mirex
1 MM1B004 3.3 2460 18.65 102 184 160 575 13.2 375 152 17.5
2 MM1B008 1.0 844 6.83 29.6 96.7 71.6 21.2 1.65 11.5 8.59 7.90
3 MM1B012 0.17 1100 6.34 22.8 102 60.1 146 2.74 118 52.5 4.66
4 MM1B016 0.87 710 3.60 7.08 23.7 17.9 133 5.62 98.9 52.3 <0.1
5 MM1B020 <0.1 339 <0.1 <0.1 12.3 13.9 23.1 0.752 13.3 5.31 13.9
6 MM4B097 2.9 777 7.45 33.7 106 84.1 14.4 1.52 7.9 4.41 4.73
7 MM4B100 3.0 842 7.30 34.0 101 100 17.2 2.63 11.1 8.08 8.41
8 MM4B103 4.6 1660 21.8 101 195 129 351 4.15 282 78.9 10.5
9 MM4B106 2.9 3310 7.90 35.1 159 102 25.2 1.90 13.8 3.89 8.25
10 MM4B109 4.3 1550 12.1 62.6 145 164 52.0 2.38 27.4 11.2 13.4
11 MM4B112 3.4 1650 18.02 75.6 273 150 50.1 3.42 27.9 18.1 12.3
12 MM4B115 148 38000 11.9 53.8 150 138 27.1 1.54 13.9 7.02 10.6
13 MM4B118 5.1 1110 15.8 104 213 157 67.0 3.59 39.4 20.5 9.17
14 MM4B121 88.5 82700 4.88 39.9 105 189 38.3 2.01 20.9 12.3 12.9
15 MM4B124 142 46600 7.52 39.2 123 118 16.2 1.22 9.32 6.15 8.15
16 MM12B648 0.67 1740 9.27 38.4 135 71.1 91.9 4.07 54.7 21.8 15.4
17 MM12B652 0.49 1620 5.43 21.5 76.5 60.7 34.6 1.32 20.1 4.22 5.02
18 MM12B656 2.3 751 9.11 29.6 140 60.5 22.5 2.65 14.6 3.09 8.01
19 MM12B660 1.4 1740 8.90 29.5 140 61.6 27.9 2.24 15.4 4.72 11.5
20 MM12B664 1.3 959 8.12 31.0 113 52.5 19.1 2.46 12.7 8.23 5.19
22 MM16B169 1.7 491 1.58 0.281 20.0 34.5 25.4 1.21 19.3 6.76 <0.1
23 MM16B172 <0.1 285 <0.1 <0.1 9.17 6.53 22.3 <0.4 16.4 3.16 <0.1
24 MM16B175 <0.1 452 5.70 <0.1 15.3 6.75 22.8 1.53 17.4 6.40 11.8
25 MM16B178 <0.1 645 <0.1 <0.1 8.77 7.47 36.3 1.69 25.9 6.93 <0.1
26 MM16B181 <0.1 554 4.03 <0.1 14.5 1.45 14.2 <0.4 8.80 <2.2 <0.1
27 MM16B184 0.14 567 6.23 <0.1 9.22 <0.1 11.7 0.441 8.02 2.41 <0.1
28 MM16B187 0.69 796 4.46 13.3 52.3 32.7 15.8 1.19 10.4 <2.2 8.89
29 MM16B190 <0.1 275 <0.1 <0.1 10.3 7.16 21.9 1.67 15.9 7.93 <0.1
30 MM16B193 <0.1 430 <0.1 <0.1 8.85 4.05 16.0 0.971 11.4 3.94 <0.1
31 MM16B196 0.22 211 <0.1 <0.1 9.36 1.98 23.9 1.93 17.0 6.63 <0.1
38 MM22B819 0.51 782 11.1 <0.1 10.6 8.87 28.7 1.81 22.9 8.56 <0.1
39 MM22B822 0.11 453 <0.1 0.938 0.34 <0.1 33.3 2.04 25.5 7.38 9.76
40 MM22B825 0.47 303 <0.1 <0.1 7.42 3.48 14.9 1.02 10.4 3.29 <0.1
41 MM22B828 1.2 502 6.41 14.1 398 19.4 7.94 0.988 5.52 <2.2 5.69
42 MM22B831 0.12 415 <0.1 <0.1 13.9 5.12 9.76 0.57 6.58 <2.2 <0.1
44 MM22B796 0.44 228 <0.1 <0.1 5.68 2.19 10.8 <0.4 7.43 <2.2 15.7
45 MM22B799 <0.1 256 <0.1 <0.1 8.64 8.46 13.8 1.00 10.3 <2.2 <0.1
46 MM22B808 1.00 486 3.11 2.07 16.8 33.4 179 2.88 218 40.4 1.75
47 MM22B802 0.13 736 <0.1 <0.1 12.9 <0.1 21.2 1.61 17.2 9.27 <0.1
48 MM22B836 <0.1 230 <0.1 <0.1 5.09 5.32 21.4 1.46 16.9 6.06 <0.1
52 MM22B899 0.44 502 <0.1 <0.1 14.8 4.76 16.0 1.03 10.8 2.32 79.7
53 MM22B902 0.13 839 <0.1 <0.1 9.66 13.7 21.0 1.38 15.2 4.28 <0.1
54 MM22B905 0.89 1200 5.54 17.6 55.3 36.5 24.4 2.78 <2.2 9.07 6.99
55 MM22B908 <0.1 1310 4.50 13.7 108 56.0 50.3 1.38 33.1 13.1 14.7
56 MM22B911 <0.1 720 2.94 4.23 54.1 17.3 5.66 <0.4 3.38 <2.2 4.44
57 MM22B914 0.13 864 4.43 14.6 68.8 43.1 11.4 1.80 7.56 <2.2 6.38
58 MM22B917 <0.1 836 3.30 10.5 55.0 21.8 10.4 <0.4 5.24 2.24 5.58
59 MM22B920 0.78 927 7.15 24.3 100 49.1 33.2 1.19 17.4 4.74 7.71
60 MM22B923 1.4 1520 5.39 16.0 121 65.1 18.7 1.83 10.6 2.84 12.3
61 MM22B926 4.3 2100 16.5 77.2 225 153 91.4 3.64 47.3 16.4 10.2
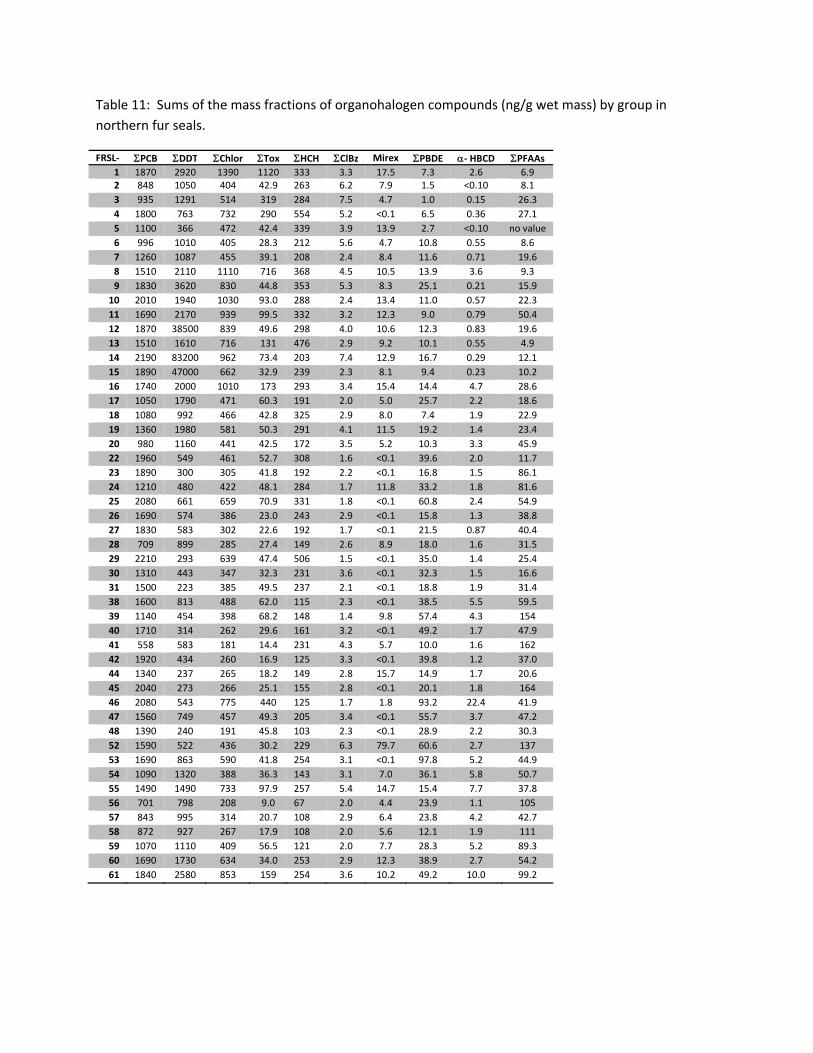
Table 11: Sums of the mass fractions of organohalogen compounds (ng/g wet mass) by group in
northern fur seals.
FRSL‐ PCB DDT Chlor Tox HCH ClBz Mirex PBDE ‐ HBCD PFAAs1 1870 2920 1390 1120 333 3.3 17.5 7.3 2.6 6.92 848 1050 404 42.9 263 6.2 7.9 1.5 <0.10 8.1
3 935 1291 514 319 284 7.5 4.7 1.0 0.15 26.3
4 1800 763 732 290 554 5.2 <0.1 6.5 0.36 27.1
5 1100 366 472 42.4 339 3.9 13.9 2.7 <0.10 no value
6 996 1010 405 28.3 212 5.6 4.7 10.8 0.55 8.6
7 1260 1087 455 39.1 208 2.4 8.4 11.6 0.71 19.6
8 1510 2110 1110 716 368 4.5 10.5 13.9 3.6 9.3
9 1830 3620 830 44.8 353 5.3 8.3 25.1 0.21 15.9
10 2010 1940 1030 93.0 288 2.4 13.4 11.0 0.57 22.3
11 1690 2170 939 99.5 332 3.2 12.3 9.0 0.79 50.4
12 1870 38500 839 49.6 298 4.0 10.6 12.3 0.83 19.6
13 1510 1610 716 131 476 2.9 9.2 10.1 0.55 4.9
14 2190 83200 962 73.4 203 7.4 12.9 16.7 0.29 12.1
15 1890 47000 662 32.9 239 2.3 8.1 9.4 0.23 10.2
16 1740 2000 1010 173 293 3.4 15.4 14.4 4.7 28.6
17 1050 1790 471 60.3 191 2.0 5.0 25.7 2.2 18.6
18 1080 992 466 42.8 325 2.9 8.0 7.4 1.9 22.9
19 1360 1980 581 50.3 291 4.1 11.5 19.2 1.4 23.4
20 980 1160 441 42.5 172 3.5 5.2 10.3 3.3 45.9
22 1960 549 461 52.7 308 1.6 <0.1 39.6 2.0 11.7
23 1890 300 305 41.8 192 2.2 <0.1 16.8 1.5 86.1
24 1210 480 422 48.1 284 1.7 11.8 33.2 1.8 81.6
25 2080 661 659 70.9 331 1.8 <0.1 60.8 2.4 54.9
26 1690 574 386 23.0 243 2.9 <0.1 15.8 1.3 38.8
27 1830 583 302 22.6 192 1.7 <0.1 21.5 0.87 40.4
28 709 899 285 27.4 149 2.6 8.9 18.0 1.6 31.5
29 2210 293 639 47.4 506 1.5 <0.1 35.0 1.4 25.4
30 1310 443 347 32.3 231 3.6 <0.1 32.3 1.5 16.6
31 1500 223 385 49.5 237 2.1 <0.1 18.8 1.9 31.4
38 1600 813 488 62.0 115 2.3 <0.1 38.5 5.5 59.5
39 1140 454 398 68.2 148 1.4 9.8 57.4 4.3 154
40 1710 314 262 29.6 161 3.2 <0.1 49.2 1.7 47.9
41 558 583 181 14.4 231 4.3 5.7 10.0 1.6 162
42 1920 434 260 16.9 125 3.3 <0.1 39.8 1.2 37.0
44 1340 237 265 18.2 149 2.8 15.7 14.9 1.7 20.6
45 2040 273 266 25.1 155 2.8 <0.1 20.1 1.8 164
46 2080 543 775 440 125 1.7 1.8 93.2 22.4 41.9
47 1560 749 457 49.3 205 3.4 <0.1 55.7 3.7 47.2
48 1390 240 191 45.8 103 2.3 <0.1 28.9 2.2 30.3
52 1590 522 436 30.2 229 6.3 79.7 60.6 2.7 137
53 1690 863 590 41.8 254 3.1 <0.1 97.8 5.2 44.9
54 1090 1320 388 36.3 143 3.1 7.0 36.1 5.8 50.7
55 1490 1490 733 97.9 257 5.4 14.7 15.4 7.7 37.8
56 701 798 208 9.0 67 2.0 4.4 23.9 1.1 105
57 843 995 314 20.7 108 2.9 6.4 23.8 4.2 42.7
58 872 927 267 17.9 108 2.0 5.6 12.1 1.9 111
59 1070 1110 409 56.5 121 2.0 7.7 28.3 5.2 89.3
60 1690 1730 634 34.0 253 2.9 12.3 38.9 2.7 54.2
61 1840 2580 853 159 254 3.6 10.2 49.2 10.0 99.2
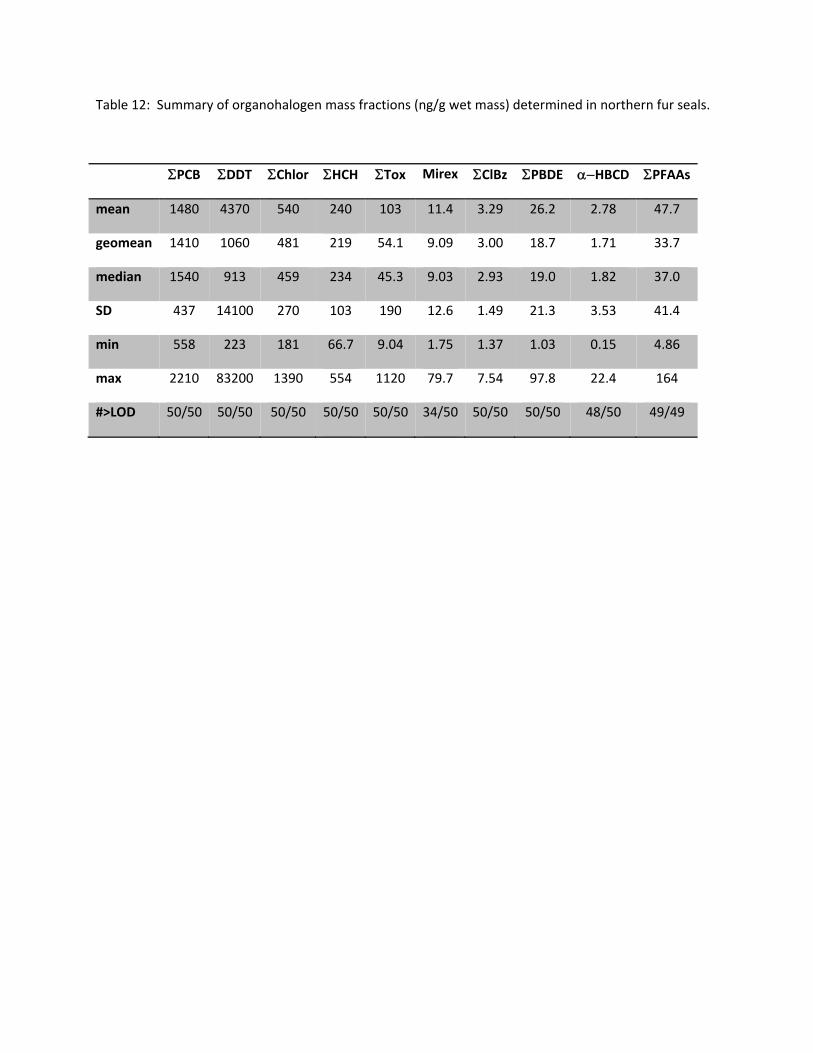
Table 12: Summary of organohalogen mass fractions (ng/g wet mass) determined in northern fur seals.
PCB DDT Chlor HCH Tox Mirex ClBz PBDE HBCD PFAAs
mean 1480 4370 540 240 103 11.4 3.29 26.2 2.78 47.7
geomean 1410 1060 481 219 54.1 9.09 3.00 18.7 1.71 33.7
median 1540 913 459 234 45.3 9.03 2.93 19.0 1.82 37.0
SD 437 14100 270 103 190 12.6 1.49 21.3 3.53 41.4
min 558 223 181 66.7 9.04 1.75 1.37 1.03 0.15 4.86
max 2210 83200 1390 554 1120 79.7 7.54 97.8 22.4 164
#>LOD 50/50 50/50 50/50 50/50 50/50 34/50 50/50 50/50 48/50 49/49
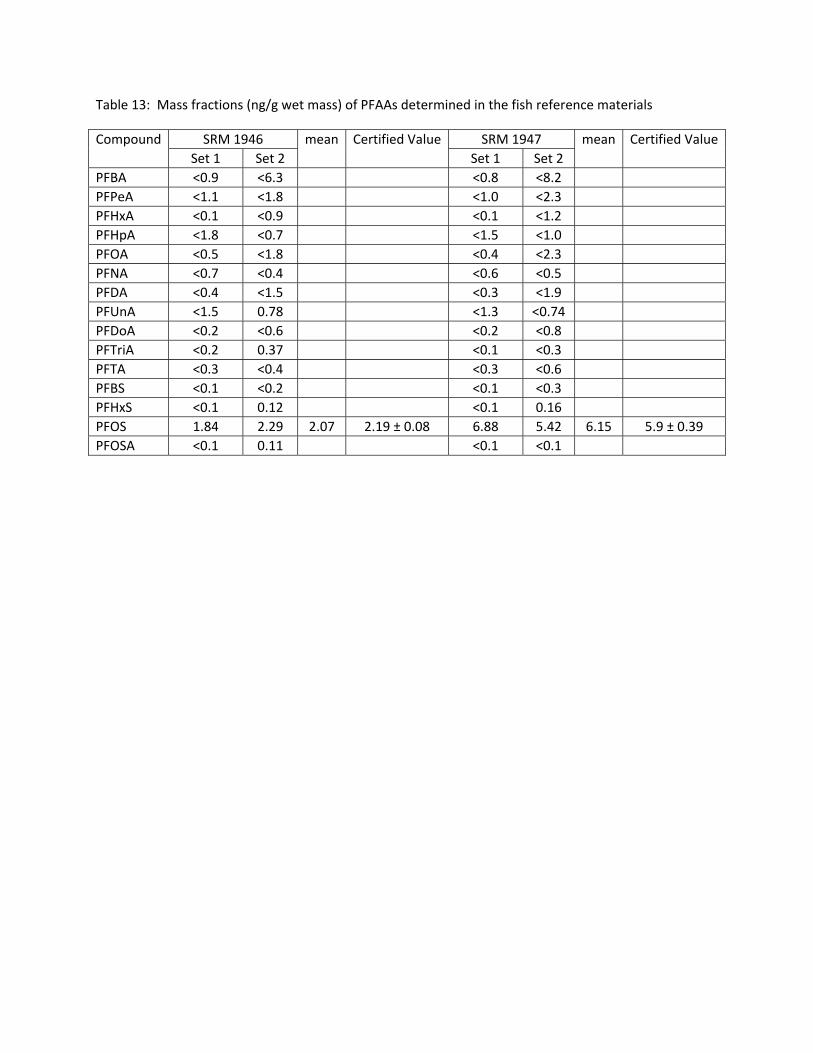
Table 13: Mass fractions (ng/g wet mass) of PFAAs determined in the fish reference materials
Compound SRM 1946 mean Certified Value SRM 1947 mean Certified Value
Set 1 Set 2 Set 1 Set 2
PFBA <0.9 <6.3 <0.8 <8.2
PFPeA <1.1 <1.8 <1.0 <2.3
PFHxA <0.1 <0.9 <0.1 <1.2
PFHpA <1.8 <0.7 <1.5 <1.0
PFOA <0.5 <1.8 <0.4 <2.3
PFNA <0.7 <0.4 <0.6 <0.5
PFDA <0.4 <1.5 <0.3 <1.9
PFUnA <1.5 0.78 <1.3 <0.74
PFDoA <0.2 <0.6 <0.2 <0.8
PFTriA <0.2 0.37 <0.1 <0.3
PFTA <0.3 <0.4 <0.3 <0.6
PFBS <0.1 <0.2 <0.1 <0.3
PFHxS <0.1 0.12 <0.1 0.16
PFOS 1.84 2.29 2.07 2.19 ± 0.08 6.88 5.42 6.15 5.9 ± 0.39
PFOSA <0.1 0.11 <0.1 <0.1
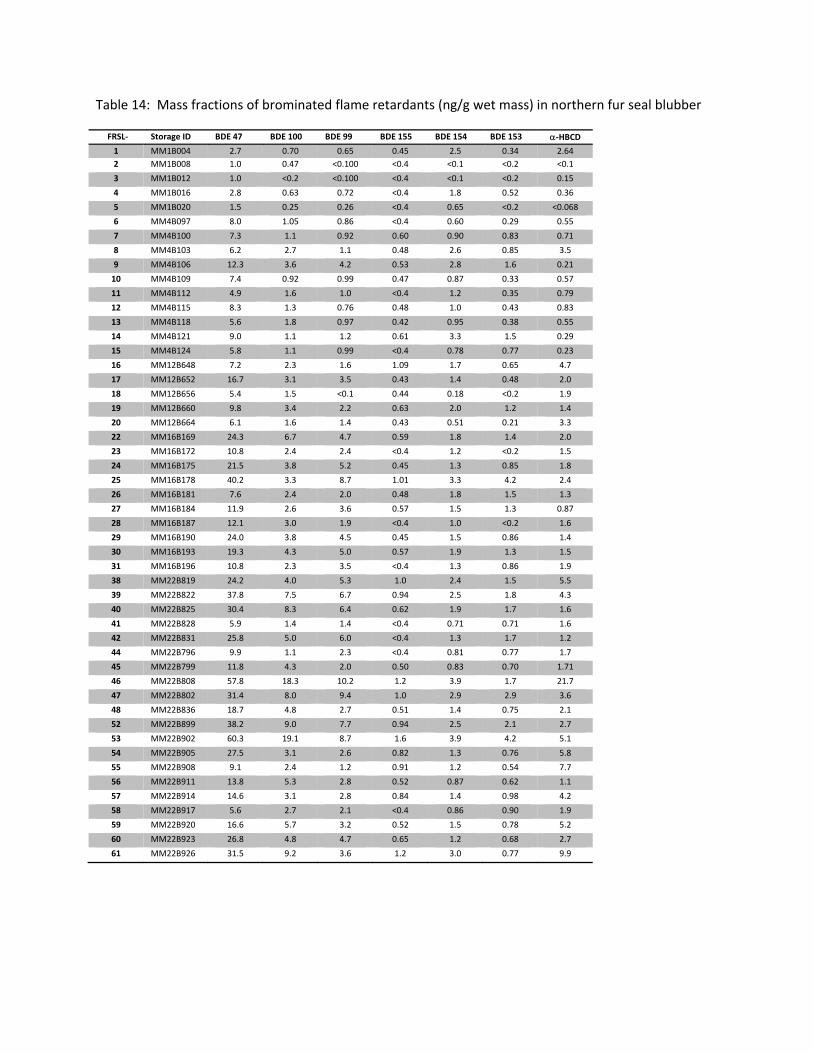
Table 14: Mass fractions of brominated flame retardants (ng/g wet mass) in northern fur seal blubber
FRSL‐ Storage ID BDE 47 BDE 100 BDE 99 BDE 155 BDE 154 BDE 153 ‐HBCD 1 MM1B004 2.7 0.70 0.65 0.45 2.5 0.34 2.64
2 MM1B008 1.0 0.47 <0.100 <0.4 <0.1 <0.2 <0.1
3 MM1B012 1.0 <0.2 <0.100 <0.4 <0.1 <0.2 0.15
4 MM1B016 2.8 0.63 0.72 <0.4 1.8 0.52 0.36
5 MM1B020 1.5 0.25 0.26 <0.4 0.65 <0.2 <0.068
6 MM4B097 8.0 1.05 0.86 <0.4 0.60 0.29 0.55
7 MM4B100 7.3 1.1 0.92 0.60 0.90 0.83 0.71
8 MM4B103 6.2 2.7 1.1 0.48 2.6 0.85 3.5
9 MM4B106 12.3 3.6 4.2 0.53 2.8 1.6 0.21
10 MM4B109 7.4 0.92 0.99 0.47 0.87 0.33 0.57
11 MM4B112 4.9 1.6 1.0 <0.4 1.2 0.35 0.79
12 MM4B115 8.3 1.3 0.76 0.48 1.0 0.43 0.83
13 MM4B118 5.6 1.8 0.97 0.42 0.95 0.38 0.55
14 MM4B121 9.0 1.1 1.2 0.61 3.3 1.5 0.29
15 MM4B124 5.8 1.1 0.99 <0.4 0.78 0.77 0.23
16 MM12B648 7.2 2.3 1.6 1.09 1.7 0.65 4.7
17 MM12B652 16.7 3.1 3.5 0.43 1.4 0.48 2.0
18 MM12B656 5.4 1.5 <0.1 0.44 0.18 <0.2 1.9
19 MM12B660 9.8 3.4 2.2 0.63 2.0 1.2 1.4
20 MM12B664 6.1 1.6 1.4 0.43 0.51 0.21 3.3
22 MM16B169 24.3 6.7 4.7 0.59 1.8 1.4 2.0
23 MM16B172 10.8 2.4 2.4 <0.4 1.2 <0.2 1.5
24 MM16B175 21.5 3.8 5.2 0.45 1.3 0.85 1.8
25 MM16B178 40.2 3.3 8.7 1.01 3.3 4.2 2.4
26 MM16B181 7.6 2.4 2.0 0.48 1.8 1.5 1.3
27 MM16B184 11.9 2.6 3.6 0.57 1.5 1.3 0.87
28 MM16B187 12.1 3.0 1.9 <0.4 1.0 <0.2 1.6
29 MM16B190 24.0 3.8 4.5 0.45 1.5 0.86 1.4
30 MM16B193 19.3 4.3 5.0 0.57 1.9 1.3 1.5
31 MM16B196 10.8 2.3 3.5 <0.4 1.3 0.86 1.9
38 MM22B819 24.2 4.0 5.3 1.0 2.4 1.5 5.5
39 MM22B822 37.8 7.5 6.7 0.94 2.5 1.8 4.3
40 MM22B825 30.4 8.3 6.4 0.62 1.9 1.7 1.6
41 MM22B828 5.9 1.4 1.4 <0.4 0.71 0.71 1.6
42 MM22B831 25.8 5.0 6.0 <0.4 1.3 1.7 1.2
44 MM22B796 9.9 1.1 2.3 <0.4 0.81 0.77 1.7
45 MM22B799 11.8 4.3 2.0 0.50 0.83 0.70 1.71
46 MM22B808 57.8 18.3 10.2 1.2 3.9 1.7 21.7
47 MM22B802 31.4 8.0 9.4 1.0 2.9 2.9 3.6
48 MM22B836 18.7 4.8 2.7 0.51 1.4 0.75 2.1
52 MM22B899 38.2 9.0 7.7 0.94 2.5 2.1 2.7
53 MM22B902 60.3 19.1 8.7 1.6 3.9 4.2 5.1
54 MM22B905 27.5 3.1 2.6 0.82 1.3 0.76 5.8
55 MM22B908 9.1 2.4 1.2 0.91 1.2 0.54 7.7
56 MM22B911 13.8 5.3 2.8 0.52 0.87 0.62 1.1
57 MM22B914 14.6 3.1 2.8 0.84 1.4 0.98 4.2
58 MM22B917 5.6 2.7 2.1 <0.4 0.86 0.90 1.9
59 MM22B920 16.6 5.7 3.2 0.52 1.5 0.78 5.2
60 MM22B923 26.8 4.8 4.7 0.65 1.2 0.68 2.7
61 MM22B926 31.5 9.2 3.6 1.2 3.0 0.77 9.9
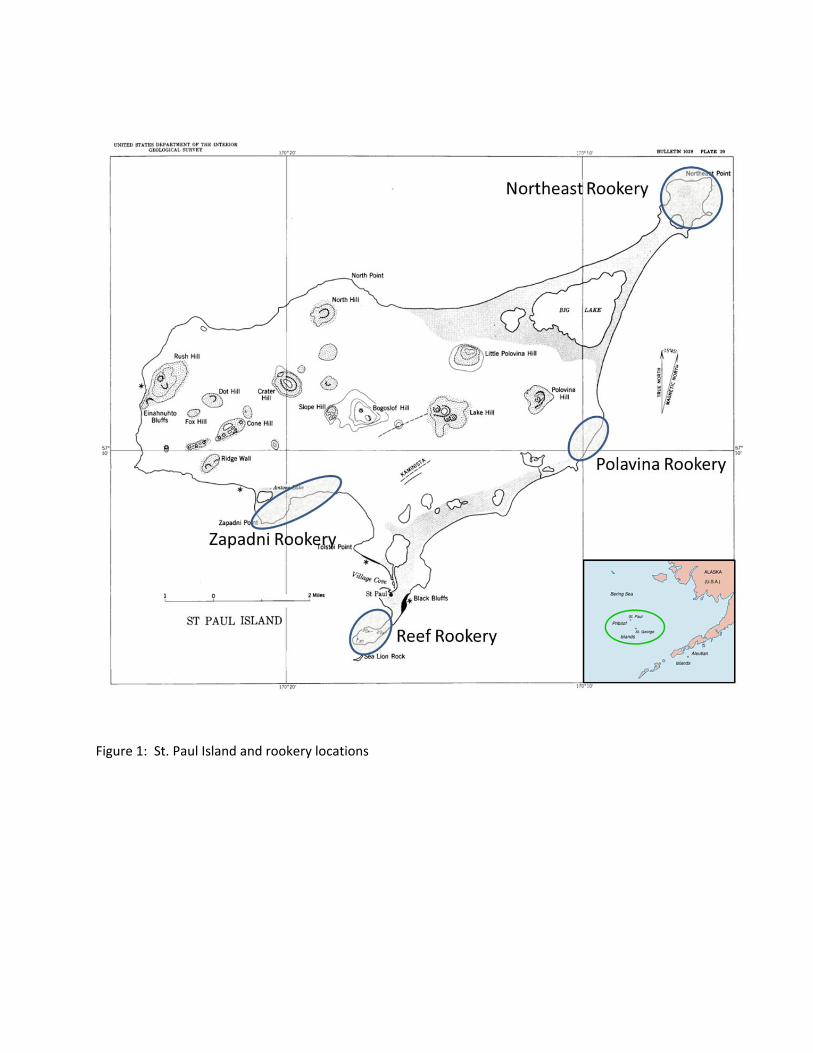
Figure 1: St. Paul Island and rookery locations
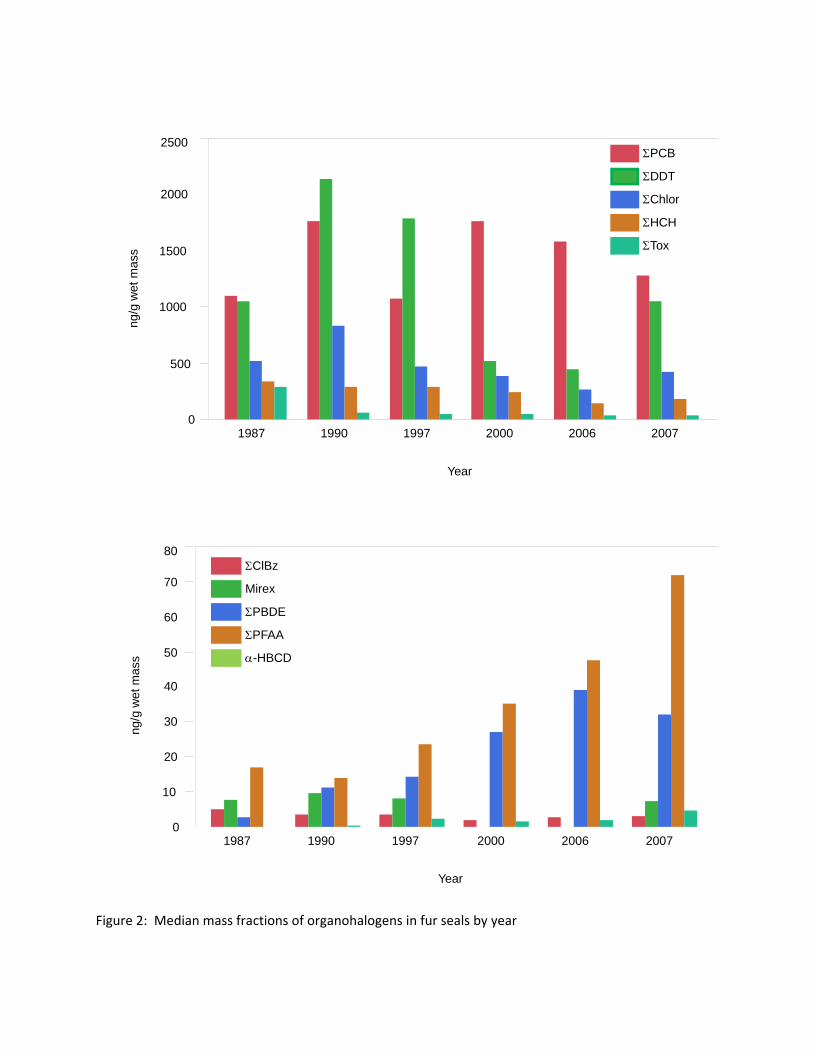
Figure 2: Median mass fractions of organohalogens in fur seals by year
0
500
1000
1500
2000
2500ng
/g w
et m
ass
1987 1990 1997 2000 2006 2007
Year
PCB
DDT
Chlor
HCH
Tox
0
10
20
30
40
50
60
70
80
ng/g
wet
mas
s
1987 1990 1997 2000 2006 2007
Year
ClBz
Mirex
PBDE
PFAA
-HBCD
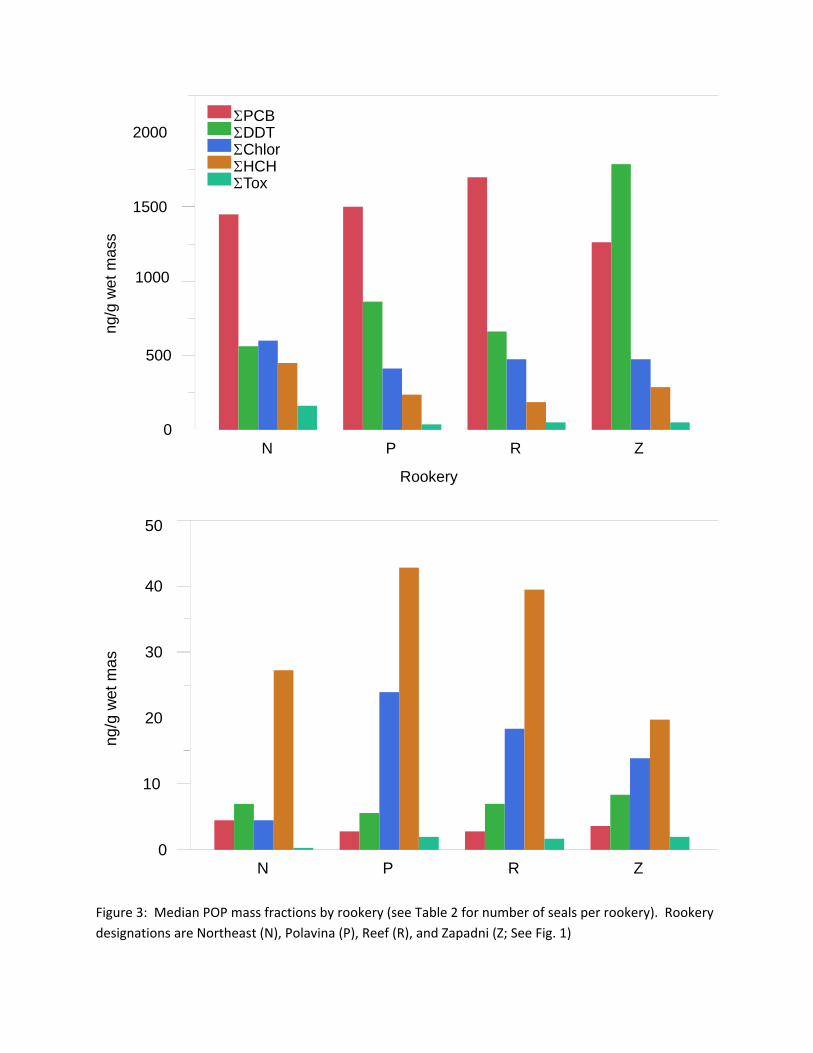
Figure 3: Median POP mass fractions by rookery (see Table 2 for number of seals per rookery). Rookery
designations are Northeast (N), Polavina (P), Reef (R), and Zapadni (Z; See Fig. 1)
0
500
1000
1500
2000
ng/g
wet
mas
s
N P R Z
Rookery
PCBDDTChlorHCHTox
0
10
20
30
40
50
ng/g
wet
mas
N P R Z
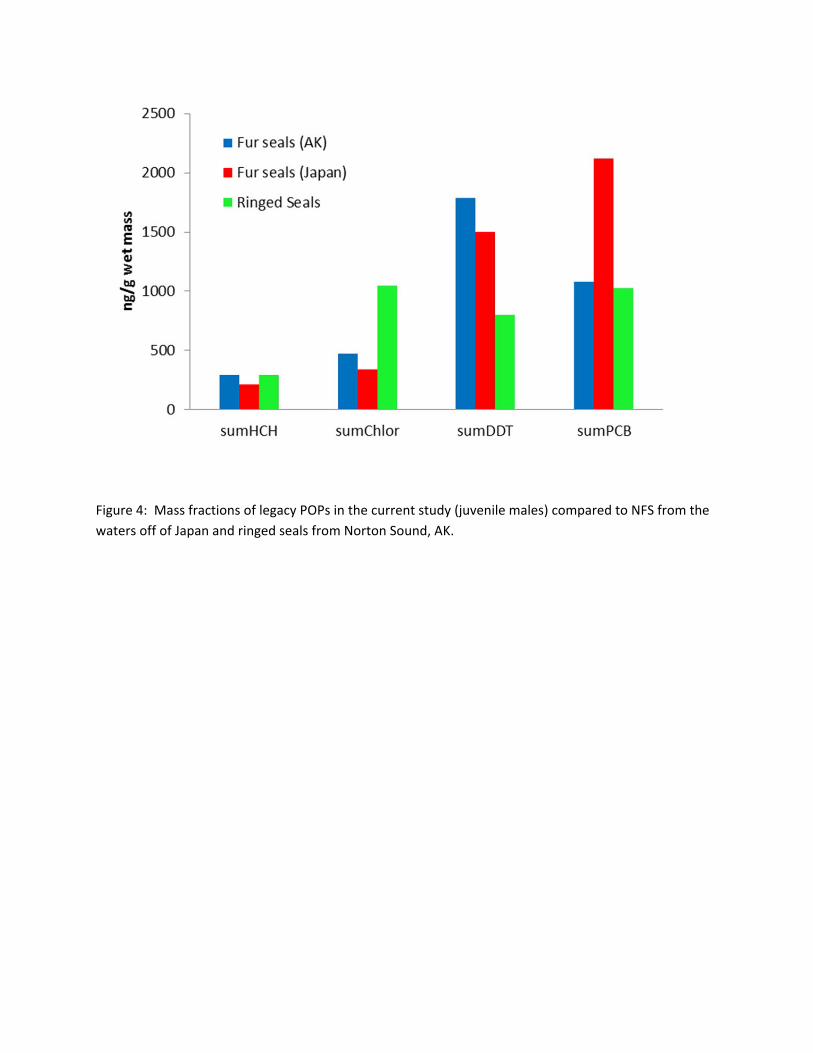
Figure 4: Mass fractions of legacy POPs in the current study (juvenile males) compared to NFS from the
waters off of Japan and ringed seals from Norton Sound, AK.