Embed Size (px)
Citation preview
SDFA
S P E C I A L D I S T R I C T F I N A N C I N G & A D M I N I S T R A T I O N
4 3 7 W . G r a n d A v e . E s c o n d i d o C A 9 2 0 2 5
7 6 0 2 3 3 2 6 3 0 F a x 2 3 3 2 6 3 1
Perris Elementary School District
FEE JUSTIFICATION REPORT FOR
NEW RESIDENTIAL AND COMMERCIAL/INDUSTRIAL DEVELOPMENT
March 30, 2020
Perris Elementary School District 143 East First Street
Perris, CA 92570 Tel: (951) 657-3118 Fax: (951) 940-5115
Contact: Francine Story – Chief Business Official
Table of Contents
i
Executive Summary .................................................................................................................................. iii
Introduction ................................................................................................................................................. 1
Description of the District ........................................................................................................... 1
Synopsis of Growth .................................................................................................................... 1
Legislative History ...................................................................................................................... 1
Reconstruction/Redevelopment ................................................................................................. 2
Methodology ............................................................................................................................... 3
Data Sources ............................................................................................................................. 4
Residential Development ........................................................................................................................... 5
Existing Facilities Capacity and Current Enrollment .................................................................. 5
Future Residential Unit Projections ............................................................................................ 6
Student Generation Rates ......................................................................................................... 7
Students Generated By New Development ............................................................................... 7
School Facilities Required to Serve New Development ............................................................ 8
Estimated School Facilities Costs .............................................................................................. 8
Ancillary Facilities ....................................................................................................................... 9
Total Estimated Cost per Student ............................................................................................ 10
School Facilities Impact per Dwelling Unit ............................................................................... 10
Commercial/Industrial Development ........................................................................................................ 12
School Facilities Impacts from New Commercial and Industrial Development ........................ 12
Estimated Number of Employees per Square Foot ................................................................. 12
Estimated Number of Employees Living & Working within the School District ........................ 13
Estimated Household Rate per Resident Worker .................................................................... 15
School Facilities Costs from New Commercial & Industrial Development ............................... 16
Commercial/Industrial Development Impact ............................................................................ 19
Senior Citizen Housing ............................................................................................................. 19
Conclusions & Statement of Findings ...................................................................................................... 20
Appendices ............................................................................................................................................... 22
Appendix A: SCAG – Residential Development Projections
Appendix B: Student Generation Rate Analysis
Appendix C: Elementary School Facilities Costs
Appendix D: Interim Housing Facilities Costs
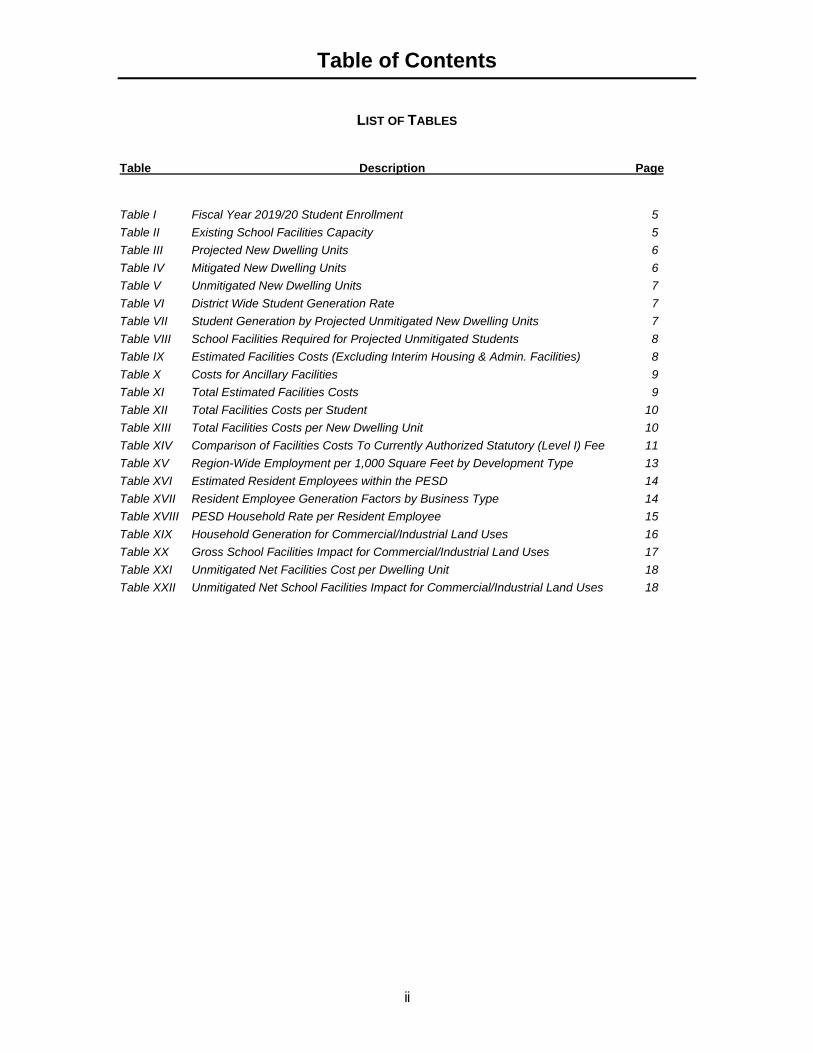
Table of Contents
ii
LIST OF TABLES
Table Description Page
Table I Fiscal Year 2019/20 Student Enrollment 5
Table II Existing School Facilities Capacity 5
Table III Projected New Dwelling Units 6
Table IV Mitigated New Dwelling Units 6
Table V Unmitigated New Dwelling Units 7
Table VI District Wide Student Generation Rate 7
Table VII Student Generation by Projected Unmitigated New Dwelling Units 7
Table VIII School Facilities Required for Projected Unmitigated Students 8
Table IX Estimated Facilities Costs (Excluding Interim Housing & Admin. Facilities) 8
Table X Costs for Ancillary Facilities 9
Table XI Total Estimated Facilities Costs 9
Table XII Total Facilities Costs per Student 10
Table XIII Total Facilities Costs per New Dwelling Unit 10
Table XIV Comparison of Facilities Costs To Currently Authorized Statutory (Level I) Fee 11
Table XV Region-Wide Employment per 1,000 Square Feet by Development Type 13
Table XVI Estimated Resident Employees within the PESD 14
Table XVII Resident Employee Generation Factors by Business Type 14
Table XVIII PESD Household Rate per Resident Employee 15
Table XIX Household Generation for Commercial/Industrial Land Uses 16
Table XX Gross School Facilities Impact for Commercial/Industrial Land Uses 17
Table XXI Unmitigated Net Facilities Cost per Dwelling Unit 18
Table XXII Unmitigated Net School Facilities Impact for Commercial/Industrial Land Uses 18
iii
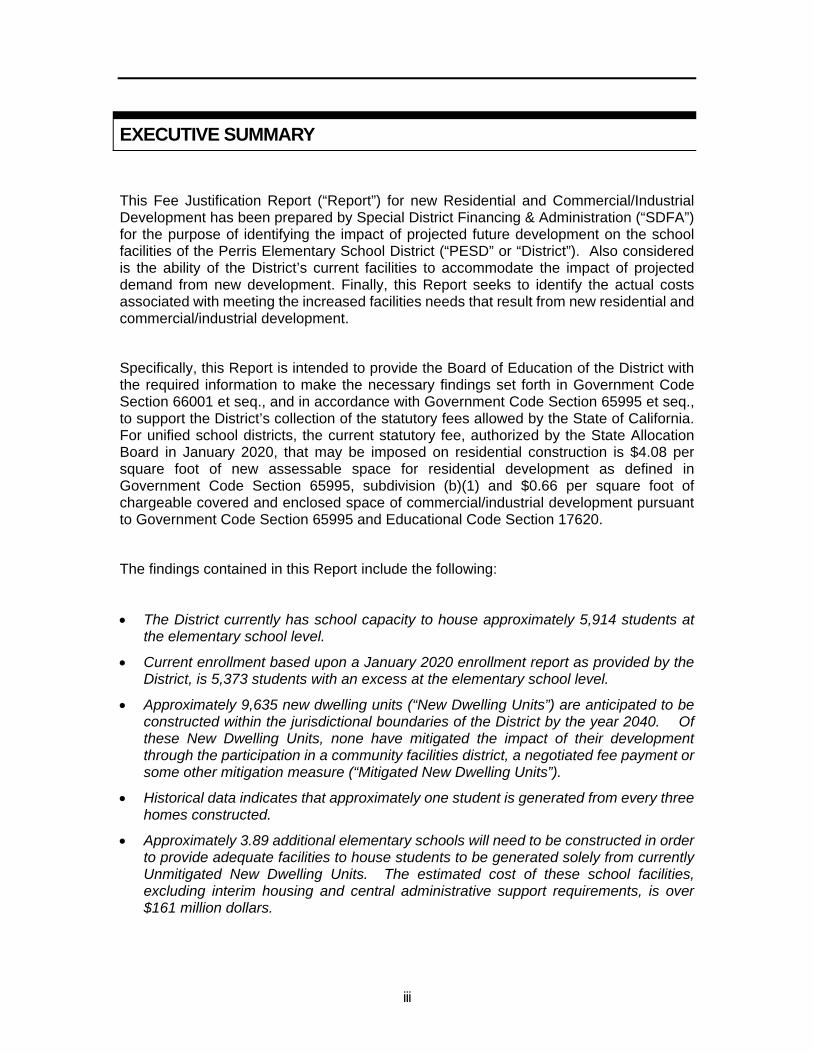
EXECUTIVE SUMMARY
This Fee Justification Report (“Report”) for new Residential and Commercial/Industrial Development has been prepared by Special District Financing & Administration (“SDFA”) for the purpose of identifying the impact of projected future development on the school facilities of the Perris Elementary School District (“PESD” or “District”). Also considered is the ability of the District’s current facilities to accommodate the impact of projected demand from new development. Finally, this Report seeks to identify the actual costs associated with meeting the increased facilities needs that result from new residential and commercial/industrial development.
Specifically, this Report is intended to provide the Board of Education of the District with the required information to make the necessary findings set forth in Government Code Section 66001 et seq., and in accordance with Government Code Section 65995 et seq., to support the District’s collection of the statutory fees allowed by the State of California. For unified school districts, the current statutory fee, authorized by the State Allocation Board in January 2020, that may be imposed on residential construction is $4.08 per square foot of new assessable space for residential development as defined in Government Code Section 65995, subdivision (b)(1) and $0.66 per square foot of chargeable covered and enclosed space of commercial/industrial development pursuant to Government Code Section 65995 and Educational Code Section 17620.
The findings contained in this Report include the following:
The District currently has school capacity to house approximately 5,914 students at the elementary school level.
Current enrollment based upon a January 2020 enrollment report as provided by the District, is 5,373 students with an excess at the elementary school level.
Approximately 9,635 new dwelling units (“New Dwelling Units”) are anticipated to be constructed within the jurisdictional boundaries of the District by the year 2040. Of these New Dwelling Units, none have mitigated the impact of their development through the participation in a community facilities district, a negotiated fee payment or some other mitigation measure (“Mitigated New Dwelling Units”).
Historical data indicates that approximately one student is generated from every three homes constructed.
Approximately 3.89 additional elementary schools will need to be constructed in order to provide adequate facilities to house students to be generated solely from currently Unmitigated New Dwelling Units. The estimated cost of these school facilities, excluding interim housing and central administrative support requirements, is over $161 million dollars.
iv
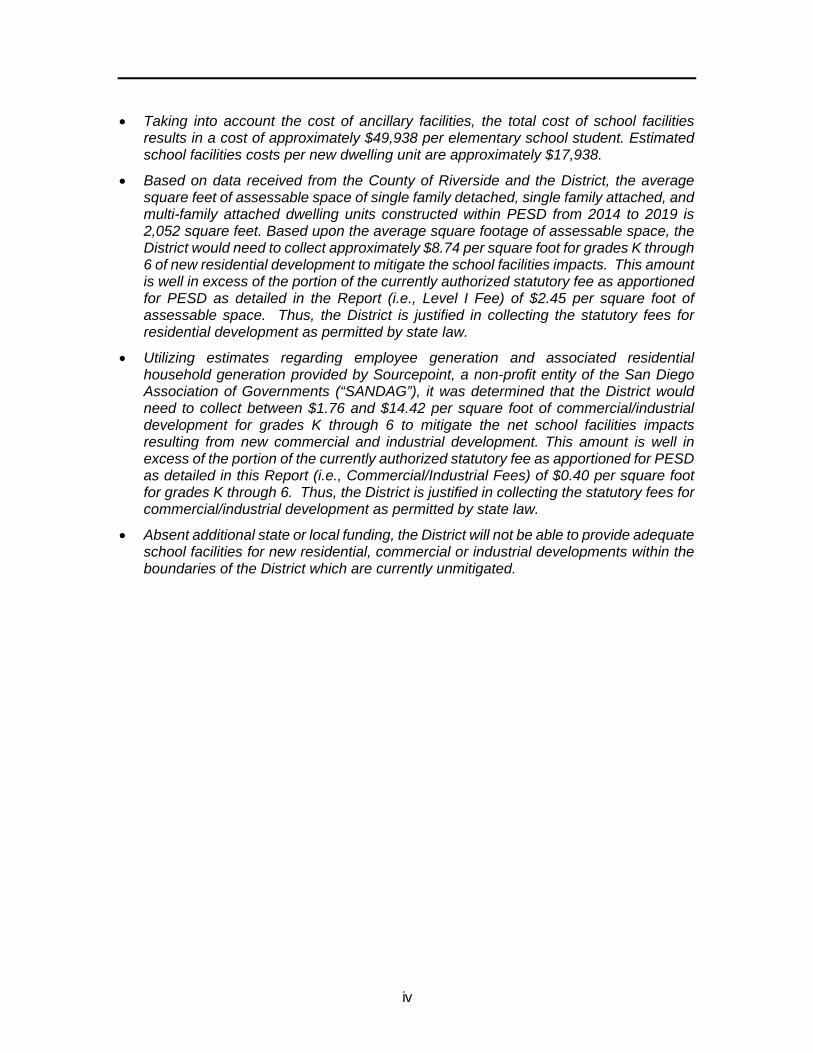
Taking into account the cost of ancillary facilities, the total cost of school facilities results in a cost of approximately $49,938 per elementary school student. Estimated school facilities costs per new dwelling unit are approximately $17,938.
Based on data received from the County of Riverside and the District, the average square feet of assessable space of single family detached, single family attached, and multi-family attached dwelling units constructed within PESD from 2014 to 2019 is 2,052 square feet. Based upon the average square footage of assessable space, the District would need to collect approximately $8.74 per square foot for grades K through 6 of new residential development to mitigate the school facilities impacts. This amount is well in excess of the portion of the currently authorized statutory fee as apportioned for PESD as detailed in the Report (i.e., Level I Fee) of $2.45 per square foot of assessable space. Thus, the District is justified in collecting the statutory fees for residential development as permitted by state law.
Utilizing estimates regarding employee generation and associated residential household generation provided by Sourcepoint, a non-profit entity of the San Diego Association of Governments (“SANDAG”), it was determined that the District would need to collect between $1.76 and $14.42 per square foot of commercial/industrial development for grades K through 6 to mitigate the net school facilities impacts resulting from new commercial and industrial development. This amount is well in excess of the portion of the currently authorized statutory fee as apportioned for PESD as detailed in this Report (i.e., Commercial/Industrial Fees) of $0.40 per square foot for grades K through 6. Thus, the District is justified in collecting the statutory fees for commercial/industrial development as permitted by state law.
Absent additional state or local funding, the District will not be able to provide adequate school facilities for new residential, commercial or industrial developments within the boundaries of the District which are currently unmitigated.
PESD - FEE JUSTIFICATION REPORT
MARCH 30, 2020 1
INTRODUCTION
This section of the Report sets forth the legislative history as well as the methodology employed and the data sources utilized in the analysis of the District’s school facilities impacts. Also included in this section is a brief description of the District.
Description of the District
The Perris Elementary School District was established in 1893 and currently operates one preschool, seven elementary schools and one charter school. The District encompasses approximately 55 square miles and includes portions of the City of Perris, a small portion of the City of Lake Elsinore and some unincorporated regions in Riverside County. The District’s current student enrollment is 5,373.
Synopsis of Growth
During the 1999/00 fiscal year, the CBEDS enrollment figure for the District was 4,496. In 2019/20, the enrollment figure for the District was 5,373. Enrollment during this time has shown an increase of approximately twenty percent (19.51%).
Legislative History
School districts have historically relied upon state funds and local bond measures to provide funding for the acquisition and construction of new school facilities. Prior to the passage of Proposition 13 in 1978, a school district’s share of local property taxes was typically sufficient to build necessary schools to accommodate new development. The rapid increase in real estate prices within California during the 1970’s and 1980’s ensured that revenues would expand as the “ad valorem” tax base grew. However, limitations on the growth of this funding source were significantly constrained by the passage of Proposition 13 which limited annual increases in real estate taxes, except in the case of ownership transfers, to two percent (2%). This action, combined with a compounding need for new construction monies caused significant hardships in many school districts during the early 1980’s.
In 1986 the state legislature attempted to address this funding shortfall through the enactment of Assembly Bill 2926 (“School Fee Legislation”) which provided for the imposition of development fees on new residential and commercial/industrial construction. The School Fee Legislation provides that development fees are to be collected prior to the issuance of a building permit. Furthermore, no city or county is authorized to issue a building permit for new residential or commercial/industrial projects unless it first certifies with the appropriate school district that the developer of the project has complied with the development fee requirement.
Section
One
PESD - FEE JUSTIFICATION REPORT
MARCH 30, 2020 2
Shortly thereafter, AB 1600 (“Mitigation Fee Act”) was enacted by the state legislature, which took effect on January 1, 1989. Government Code Section 66001 et seq. sets forth the requirements for establishing, imposing and increasing development fees initially authorized under AB 2926. Specifically, the Mitigation Fee Act requires that a reasonable relationship or “nexus” exists between the type and the amount of a development fee imposed and the cost of the benefit to be derived from the fee. Specifically, Section 66001 of the Government Code with respect to the imposition of development fees provides, in pertinent part, that any action establishing, increasing, or imposing a fee on new development shall do all of the following:
Identify the purpose of the fee.
Identify the use to which the fee is to be put.
Determine how there is a reasonable relationship between the fee's use and the type of development project on which the fee is imposed.
Determine how there is a reasonable relationship between the need for the public facility and the type of development project on which the fee is imposed.
In June of 2006, Assembly Bill 2751 was passed which added the criteria that a fee is prohibited from including the cost attributable to existing deficiencies in public facilities. In the case of a school district, this would mean that existing capacity deficits could not be added to the facilities funding required from future development. In the following Report, this is demonstrated in the calculations by not including any deficit which would be shown in Table II, if existent, to the School Facilities Required for New Development (Unmitigated) (Table VIII) or to the cost of such school facilities (Tables IX, X and XI).
The development fees currently authorized under Education Code Section 17620 and Government Code 65995 (“Statutory School Fees”) as of January 22, 2020, for unified school districts, are $4.08 per square foot of assessable space for new residential construction (“Level I Fees”) and $0.66 per square foot of new commercial/industrial development (“Commercial/Industrial Fees”). These development fees may next be increased by the SAB in 2022, and every two years thereafter.
Reconstruction/Redevelopment
Reconstruction/Redevelopment means the voluntary demolition of existing residential dwelling units or commercial or industrial construction and the subsequent construction of new residential dwelling units or commercial industrial construction (“Reconstruction”).
The District currently is unaware of any Reconstruction projects. In such a situation, the District may levy Statutory School Fees authorized pursuant to Education Code Section 17620 and Government Code Sections 65995 et seq. ("Statutory School Fees") if there is a nexus established between the fee to be levied and the impact of the new construction in excess of the impact previously existing. In other words, the Statutory School Fees must bear a nexus to the burden caused by the Reconstruction project in terms of a net increase in students generated and the fee to be imposed.
The purpose of this section is to set forth a general policy for the levy of Statutory School Fees on future Reconstruction projects within the District. The District may levy the applicable Statutory
PESD - FEE JUSTIFICATION REPORT
MARCH 30, 2020 3
School Fees if an unmitigated impact exists once an analysis has been done on the impact on school facilities from such new construction and consideration has been given as to the applicability of giving credit for the previously existing impacts.
The analysis will include a review as to whether the Reconstruction project results in an additional impact to the District. This will be analyzed by comparing the impact from potential new students from future construction after having considered the previously existing potential students from the loss of construction as a result of Reconstruction.
Statutory School Fees will be assessed only to the extent of the net actual impact of the school facilities as determined above, but in no event will the Statutory School Fees assessed be greater than the applicable authorized Statutory School Fees. The District will complete a detailed analysis utilizing the above-mentioned criteria to determine the applicability of Statutory School Fees to each Reconstruction project presented to the District.
Methodology
In order to determine the impact of new construction on PESD facilities, the relationship between the new construction and its impact on the demand for school facilities must be identified. For residential development, this determination includes the following:
Projecting the number of future unmitigated residential dwelling units to be constructed
within PESD boundaries.
Calculating a student generation rate (i.e., students expected to be generated from each new home) for each school type (i.e., elementary school).
Determining the number of students to be generated from new development.
Identifying the “per student cost” for new elementary school facilities.
Multiplying the per student costs for elementary school facilities by the student generation rate to determine a cost per dwelling unit.
Dividing the cost per dwelling unit by the average square feet per dwelling unit to determine the impact per square foot of assessable space.
The methodology for determining the impact of new commercial/industrial development is similar. However, instead of determining the number of students to be generated per new dwelling unit, the focus is on the number of households (and corresponding students) generated per employee.
This Report contains findings regarding the impact of commercial/industrial development on the need for school facilities utilizing an approach where student generation is derived from employee densities established for various types of commercial and industrial development.
PESD - FEE JUSTIFICATION REPORT
MARCH 30, 2020 4
Data Sources
The primary information required to establish a nexus between new development and school facilities impacts includes residential housing projections, employment impacts from new commercial/industrial development, student generation rates and facilities cost estimates. Primary information sources regarding future housing projections included Southern California Association of Governments (“SCAG”). Some of the data for determining commercial/industrial impacts was prepared by the San Diego Association of Governments (“SANDAG”), and the U.S. Census Bureau American Community Survey. Data used to calculate student generation rates for this Report was provided by the SCAG and a January 2020 enrollment report as provided by the District. Facilities cost estimates were prepared by the District’s Facilities Department.
PESD - FEE JUSTIFICATION REPORT
MARCH 30, 2020 5
RESIDENTIAL DEVELOPMENT
This section of the Report identifies the school facilities impact from new residential construction.
Existing Facilities Capacity and Current Enrollment
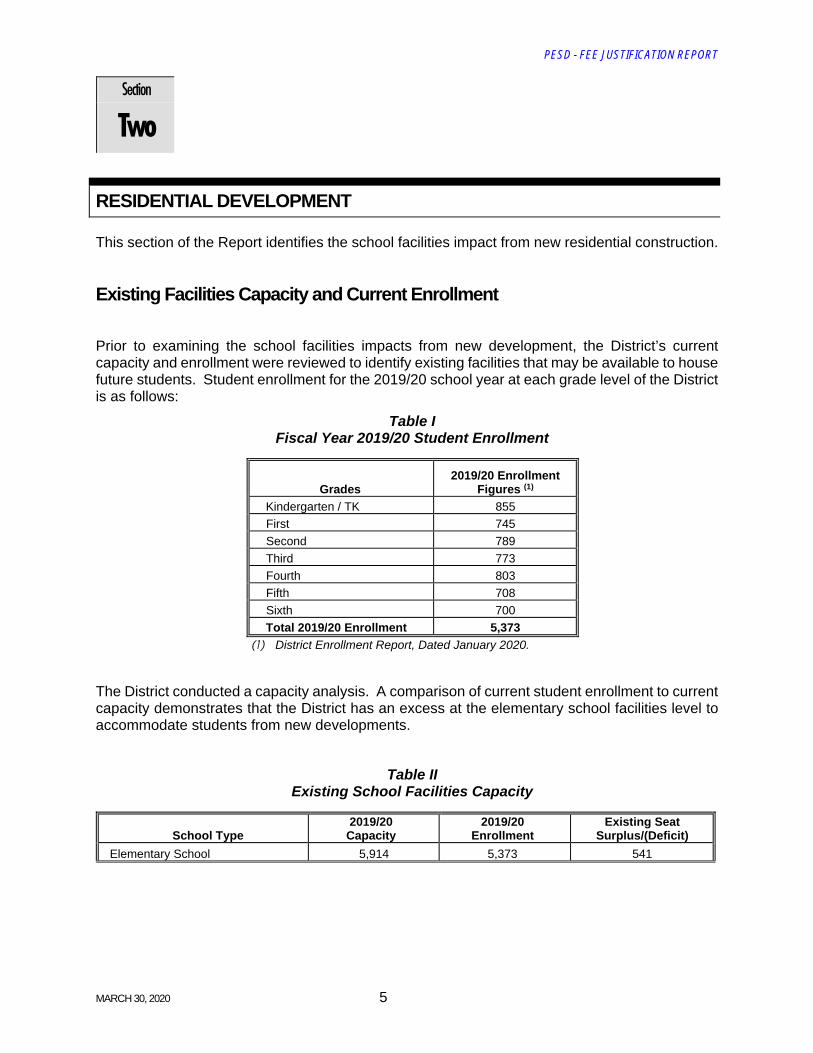
Prior to examining the school facilities impacts from new development, the District’s current capacity and enrollment were reviewed to identify existing facilities that may be available to house future students. Student enrollment for the 2019/20 school year at each grade level of the District is as follows:
Table I Fiscal Year 2019/20 Student Enrollment
Grades
2019/20 Enrollment Figures (1)
Kindergarten / TK 855
First 745
Second 789
Third 773
Fourth 803
Fifth 708
Sixth 700
Total 2019/20 Enrollment 5,373
(1) District Enrollment Report, Dated January 2020.
The District conducted a capacity analysis. A comparison of current student enrollment to current capacity demonstrates that the District has an excess at the elementary school facilities level to accommodate students from new developments.
Table II Existing School Facilities Capacity
School Type
2019/20 Capacity
2019/20 Enrollment
Existing Seat Surplus/(Deficit)
Elementary School 5,914 5,373 541
Section
Two
PESD - FEE JUSTIFICATION REPORT
MARCH 30, 2020 6
Future Residential Unit Projections
New Dwelling Unit Projections
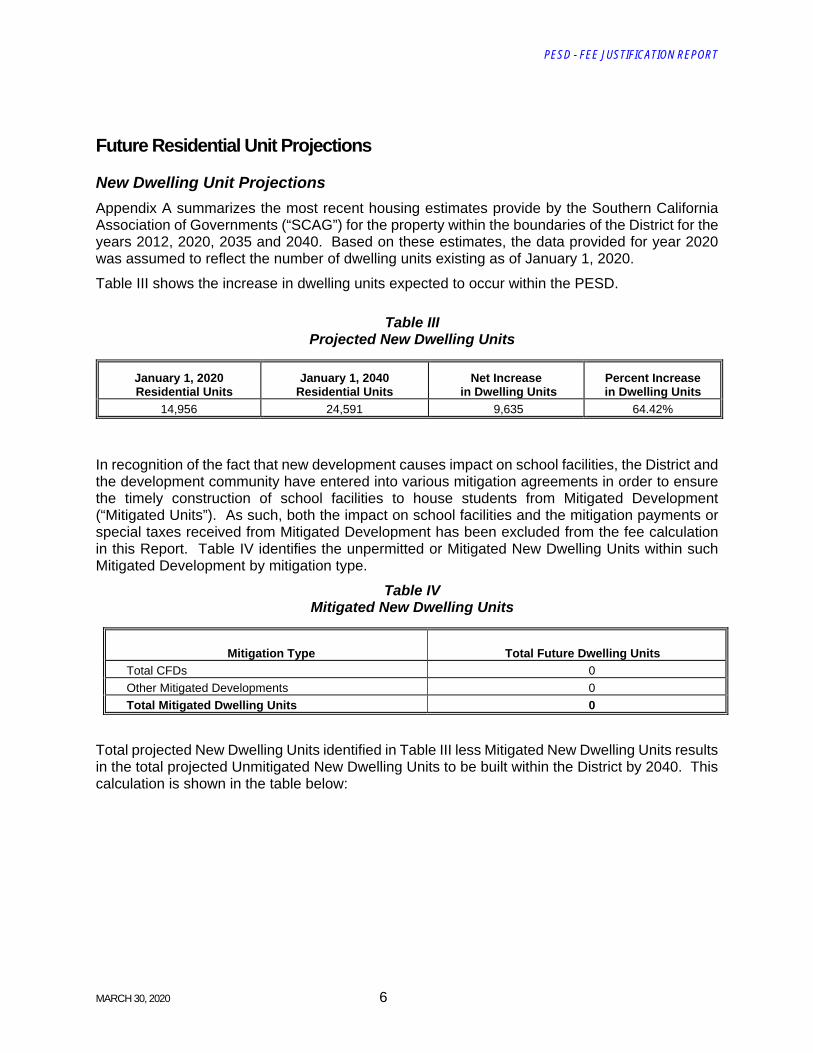
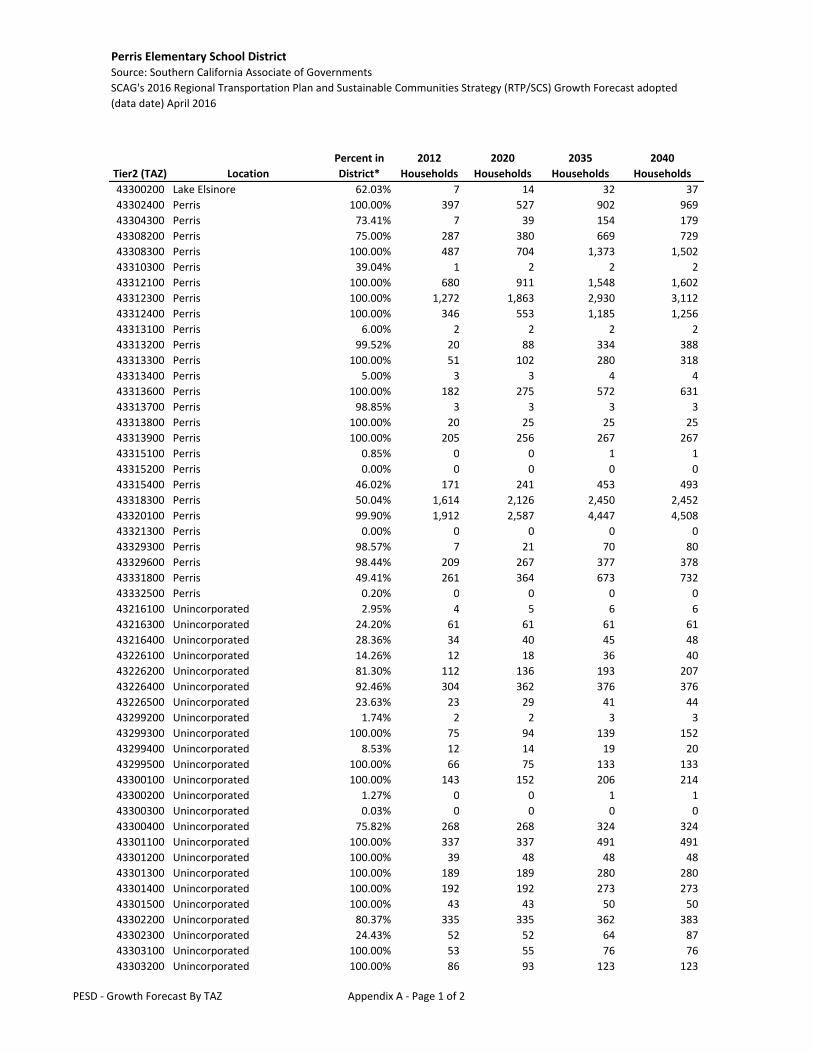
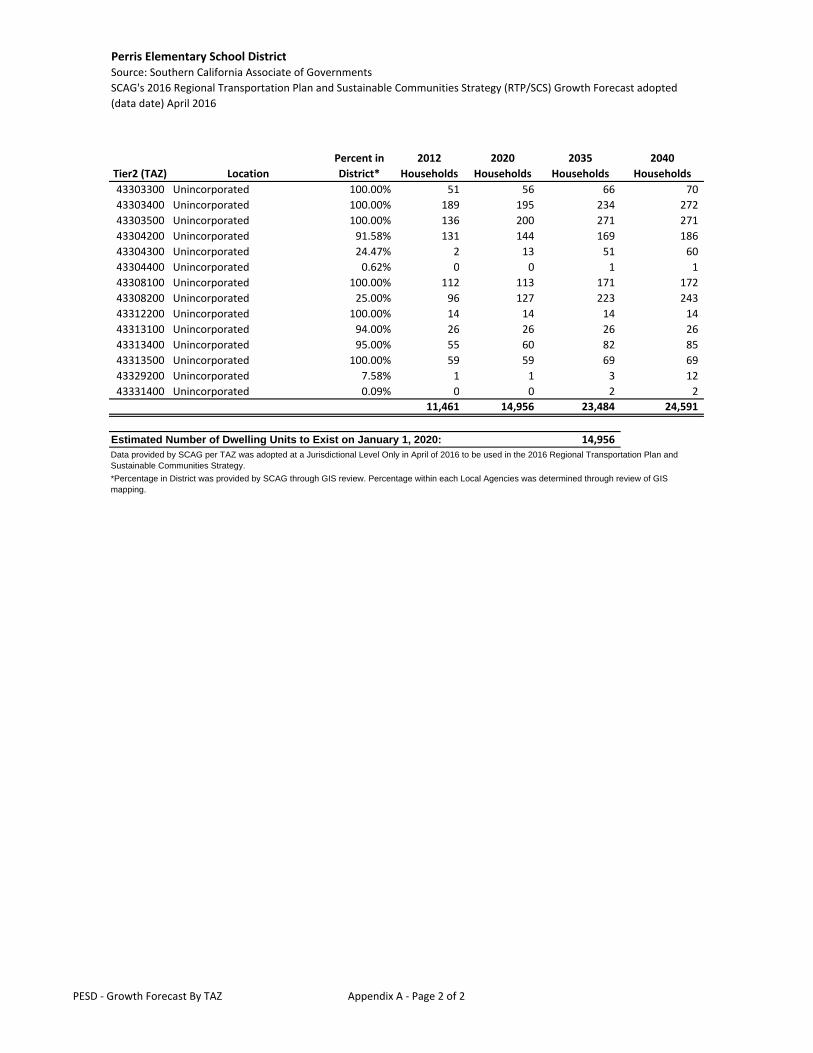
Appendix A summarizes the most recent housing estimates provide by the Southern California Association of Governments (“SCAG”) for the property within the boundaries of the District for the years 2012, 2020, 2035 and 2040. Based on these estimates, the data provided for year 2020 was assumed to reflect the number of dwelling units existing as of January 1, 2020.
Table III shows the increase in dwelling units expected to occur within the PESD.
Table III Projected New Dwelling Units
January 1, 2020 Residential Units
January 1, 2040 Residential Units
Net Increase in Dwelling Units
Percent Increase in Dwelling Units
14,956 24,591 9,635 64.42%
In recognition of the fact that new development causes impact on school facilities, the District and the development community have entered into various mitigation agreements in order to ensure the timely construction of school facilities to house students from Mitigated Development (“Mitigated Units”). As such, both the impact on school facilities and the mitigation payments or special taxes received from Mitigated Development has been excluded from the fee calculation in this Report. Table IV identifies the unpermitted or Mitigated New Dwelling Units within such Mitigated Development by mitigation type.
Table IV Mitigated New Dwelling Units
Mitigation Type Total Future Dwelling Units
Total CFDs 0
Other Mitigated Developments 0
Total Mitigated Dwelling Units 0
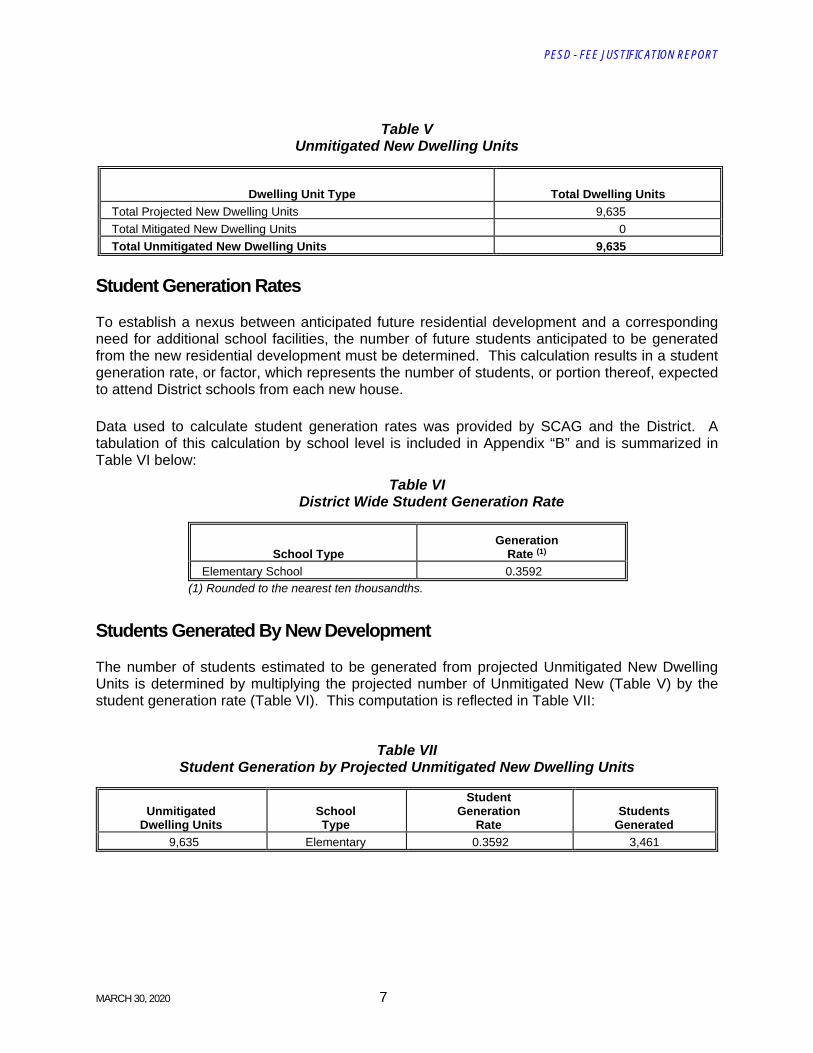
Total projected New Dwelling Units identified in Table III less Mitigated New Dwelling Units results in the total projected Unmitigated New Dwelling Units to be built within the District by 2040. This calculation is shown in the table below:
PESD - FEE JUSTIFICATION REPORT
MARCH 30, 2020 7
Table V Unmitigated New Dwelling Units
Dwelling Unit Type Total Dwelling Units
Total Projected New Dwelling Units 9,635
Total Mitigated New Dwelling Units 0
Total Unmitigated New Dwelling Units 9,635
Student Generation Rates
To establish a nexus between anticipated future residential development and a corresponding need for additional school facilities, the number of future students anticipated to be generated from the new residential development must be determined. This calculation results in a student generation rate, or factor, which represents the number of students, or portion thereof, expected to attend District schools from each new house.
Data used to calculate student generation rates was provided by SCAG and the District. A tabulation of this calculation by school level is included in Appendix “B” and is summarized in Table VI below:
Table VI District Wide Student Generation Rate
School TypeGeneration
Rate (1)
Elementary School 0.3592
(1) Rounded to the nearest ten thousandths.
Students Generated By New Development
The number of students estimated to be generated from projected Unmitigated New Dwelling Units is determined by multiplying the projected number of Unmitigated New (Table V) by the student generation rate (Table VI). This computation is reflected in Table VII:
Table VII Student Generation by Projected Unmitigated New Dwelling Units
Unmitigated
Dwelling Units
School Type
Student Generation
Rate
Students
Generated
9,635 Elementary 0.3592 3,461
PESD - FEE JUSTIFICATION REPORT
MARCH 30, 2020 8
School Facilities Required to Serve New Development
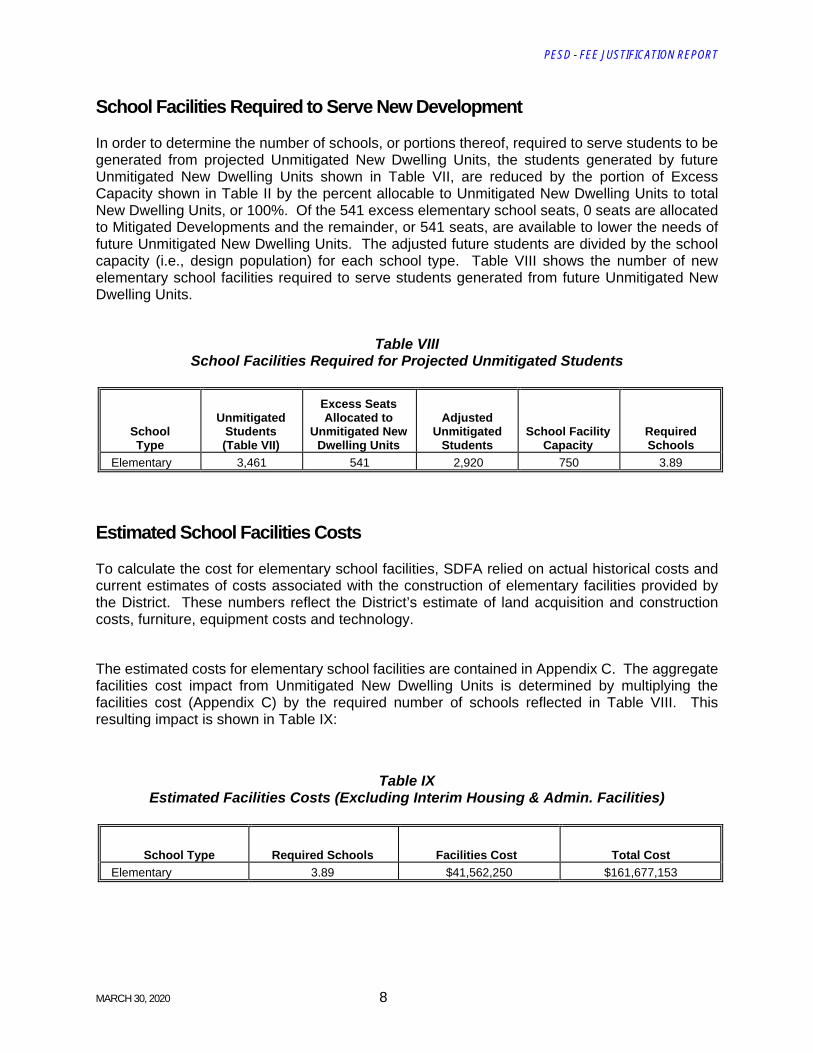
In order to determine the number of schools, or portions thereof, required to serve students to be generated from projected Unmitigated New Dwelling Units, the students generated by future Unmitigated New Dwelling Units shown in Table VII, are reduced by the portion of Excess Capacity shown in Table II by the percent allocable to Unmitigated New Dwelling Units to total New Dwelling Units, or 100%. Of the 541 excess elementary school seats, 0 seats are allocated to Mitigated Developments and the remainder, or 541 seats, are available to lower the needs of future Unmitigated New Dwelling Units. The adjusted future students are divided by the school capacity (i.e., design population) for each school type. Table VIII shows the number of new elementary school facilities required to serve students generated from future Unmitigated New Dwelling Units.
Table VIII School Facilities Required for Projected Unmitigated Students
School Type
Unmitigated Students (Table VII)
Excess Seats Allocated to
Unmitigated New Dwelling Units
Adjusted Unmitigated
StudentsSchool Facility
Capacity Required Schools
Elementary 3,461 541 2,920 750 3.89
Estimated School Facilities Costs
To calculate the cost for elementary school facilities, SDFA relied on actual historical costs and current estimates of costs associated with the construction of elementary facilities provided by the District. These numbers reflect the District’s estimate of land acquisition and construction costs, furniture, equipment costs and technology.
The estimated costs for elementary school facilities are contained in Appendix C. The aggregate facilities cost impact from Unmitigated New Dwelling Units is determined by multiplying the facilities cost (Appendix C) by the required number of schools reflected in Table VIII. This resulting impact is shown in Table IX:
Table IX Estimated Facilities Costs (Excluding Interim Housing & Admin. Facilities)
School Type Required Schools Facilities Cost Total Cost
Elementary 3.89 $41,562,250 $161,677,153
PESD - FEE JUSTIFICATION REPORT
MARCH 30, 2020 9
Ancillary Facilities
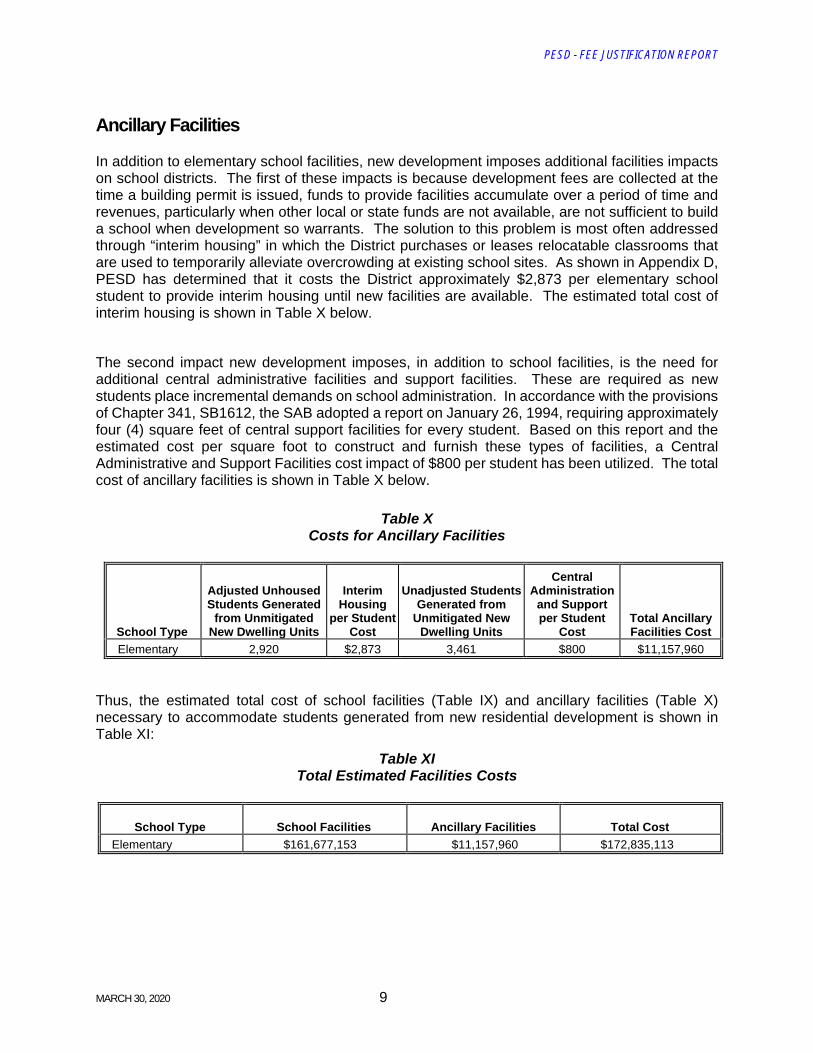
In addition to elementary school facilities, new development imposes additional facilities impacts on school districts. The first of these impacts is because development fees are collected at the time a building permit is issued, funds to provide facilities accumulate over a period of time and revenues, particularly when other local or state funds are not available, are not sufficient to build a school when development so warrants. The solution to this problem is most often addressed through “interim housing” in which the District purchases or leases relocatable classrooms that are used to temporarily alleviate overcrowding at existing school sites. As shown in Appendix D, PESD has determined that it costs the District approximately $2,873 per elementary school student to provide interim housing until new facilities are available. The estimated total cost of interim housing is shown in Table X below.
The second impact new development imposes, in addition to school facilities, is the need for additional central administrative facilities and support facilities. These are required as new students place incremental demands on school administration. In accordance with the provisions of Chapter 341, SB1612, the SAB adopted a report on January 26, 1994, requiring approximately four (4) square feet of central support facilities for every student. Based on this report and the estimated cost per square foot to construct and furnish these types of facilities, a Central Administrative and Support Facilities cost impact of $800 per student has been utilized. The total cost of ancillary facilities is shown in Table X below.
Table X
Costs for Ancillary Facilities
School Type
Adjusted Unhoused Students Generated
from Unmitigated New Dwelling Units
Interim Housing
per Student Cost
Unadjusted Students Generated from
Unmitigated New Dwelling Units
Central Administration
and Support per Student
Cost Total Ancillary Facilities Cost
Elementary 2,920 $2,873 3,461 $800 $11,157,960
Thus, the estimated total cost of school facilities (Table IX) and ancillary facilities (Table X) necessary to accommodate students generated from new residential development is shown in Table XI:
Table XI Total Estimated Facilities Costs
School Type School Facilities Ancillary Facilities Total Cost
Elementary $161,677,153 $11,157,960 $172,835,113
PESD - FEE JUSTIFICATION REPORT
MARCH 30, 2020 10
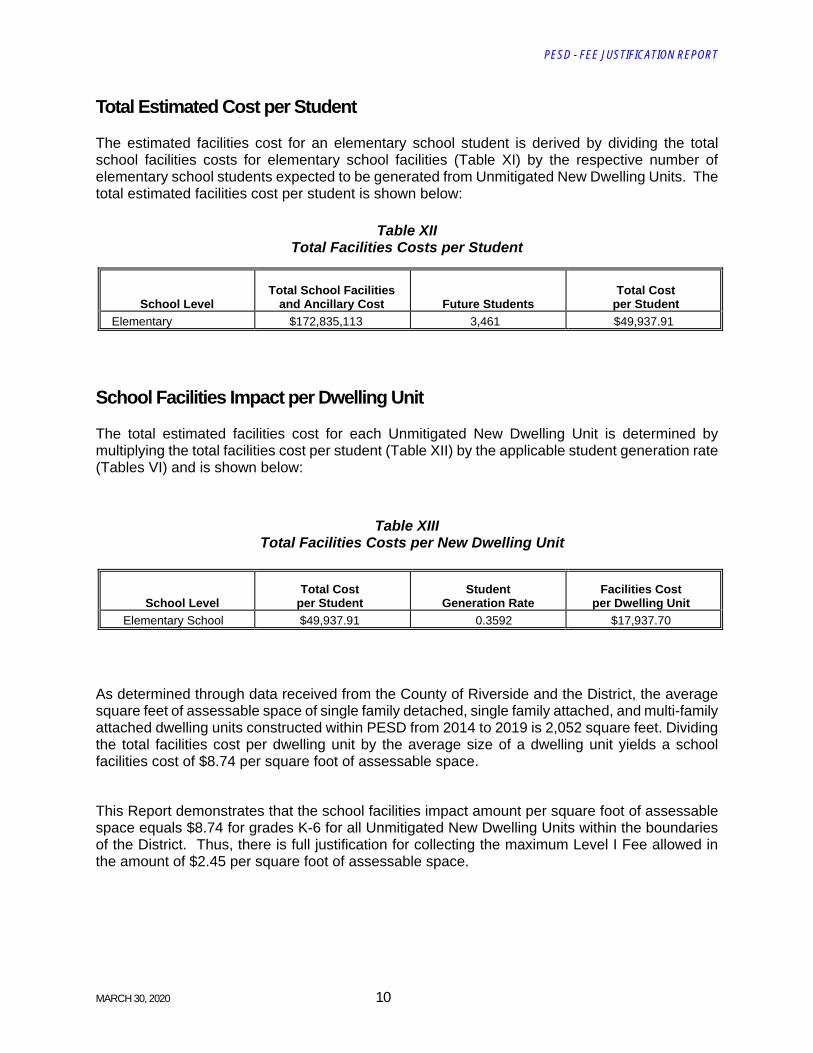
Total Estimated Cost per Student
The estimated facilities cost for an elementary school student is derived by dividing the total school facilities costs for elementary school facilities (Table XI) by the respective number of elementary school students expected to be generated from Unmitigated New Dwelling Units. The total estimated facilities cost per student is shown below:
Table XII Total Facilities Costs per Student
School Level Total School Facilities
and Ancillary Cost Future StudentsTotal Cost
per Student
Elementary $172,835,113 3,461 $49,937.91
School Facilities Impact per Dwelling Unit
The total estimated facilities cost for each Unmitigated New Dwelling Unit is determined by multiplying the total facilities cost per student (Table XII) by the applicable student generation rate (Tables VI) and is shown below:
Table XIII Total Facilities Costs per New Dwelling Unit
School Level Total Cost
per StudentStudent
Generation RateFacilities Cost
per Dwelling Unit
Elementary School $49,937.91 0.3592 $17,937.70
As determined through data received from the County of Riverside and the District, the average square feet of assessable space of single family detached, single family attached, and multi-family attached dwelling units constructed within PESD from 2014 to 2019 is 2,052 square feet. Dividing the total facilities cost per dwelling unit by the average size of a dwelling unit yields a school facilities cost of $8.74 per square foot of assessable space.
This Report demonstrates that the school facilities impact amount per square foot of assessable space equals $8.74 for grades K-6 for all Unmitigated New Dwelling Units within the boundaries of the District. Thus, there is full justification for collecting the maximum Level I Fee allowed in the amount of $2.45 per square foot of assessable space.
PESD - FEE JUSTIFICATION REPORT
MARCH 30, 2020 11
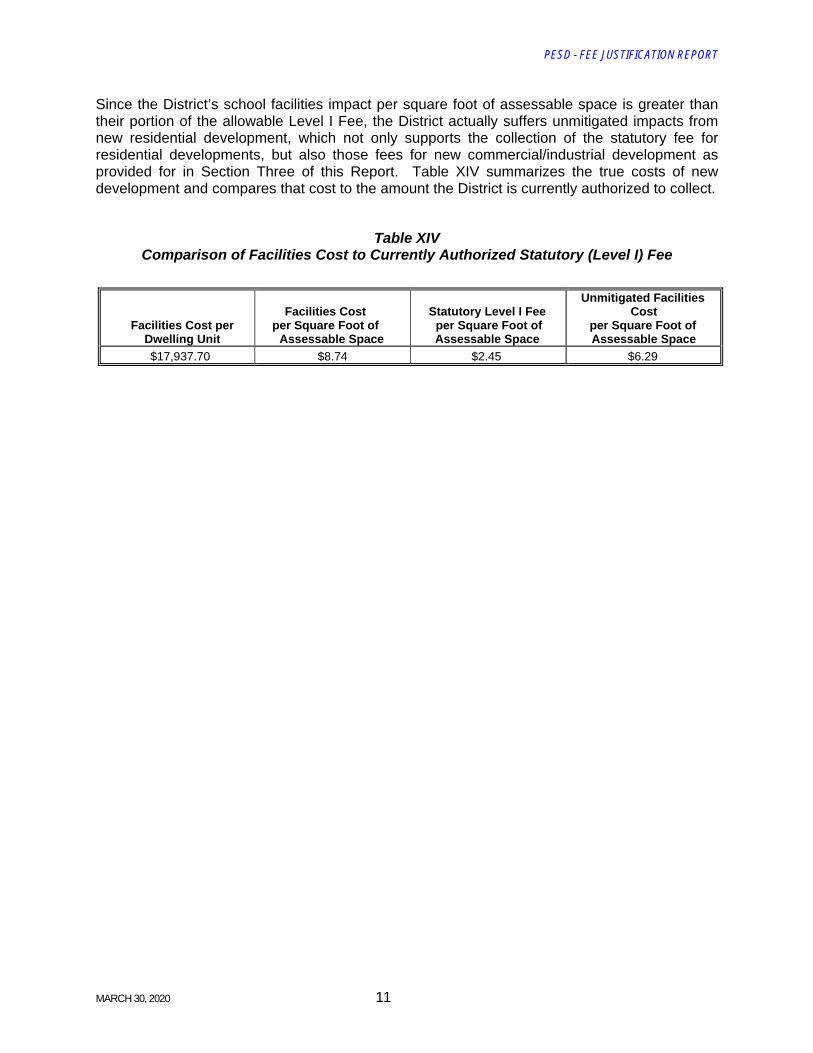
Since the District’s school facilities impact per square foot of assessable space is greater than their portion of the allowable Level I Fee, the District actually suffers unmitigated impacts from new residential development, which not only supports the collection of the statutory fee for residential developments, but also those fees for new commercial/industrial development as provided for in Section Three of this Report. Table XIV summarizes the true costs of new development and compares that cost to the amount the District is currently authorized to collect.
Table XIV Comparison of Facilities Cost to Currently Authorized Statutory (Level I) Fee
Facilities Cost per Dwelling Unit
Facilities Cost per Square Foot of
Assessable Space
Statutory Level I Fee per Square Foot of Assessable Space
Unmitigated Facilities Cost
per Square Foot of Assessable Space
$17,937.70 $8.74 $2.45 $6.29
PESD - FEE JUSTIFICATION REPORT
MARCH 30, 2020 12
COMMERCIAL/INDUSTRIAL DEVELOPMENT
This section of the Report identifies the school facilities impact from new commercial and industrial development.
School Facilities Impacts from New Commercial and Industrial Development
Just as the District is required to identify the impact of new residential development on student enrollment and a corresponding need for additional school facilities, a similar nexus must be established between new commercial/industrial development and the corresponding need for additional school facilities. A four-step methodology was used to quantify the impact of new commercial and industrial development on the need for school facilities. This methodology incorporates “employment densities” for various commercial and industrial types which have been generated by SANDAG. The methodology includes the following actions:
1. Determine the number of employees required per square foot for specific types of commercial and industrial development (i.e., new jobs created within the school district).
2. Determine the number of new employees that would both live and work within the District.
3. Determine the number of occupied housing units that would be associated with new employees.
4. Determine the school facilities impact generated from these employees utilizing the “per dwelling unit” facilities costs computed in Section Two.
The following discussion incorporates the four-step methodology and identifies the school facilities impact for various commercial and industrial developments.
Estimated Number of Employees per Square Foot
Because the utilization of commercial and industrial buildings varies significantly, in order to estimate the number of employees and hence, the number of school age children generated by employees, it is important that the relationship between the size of any commercial/industrial development and its associated employee base, be established for various development or land use types. To do this, SDFA relied on survey results published in SANDAG’s report entitled Traffic Generators published in April of 2002. This report reflects data gleaned from a site specific employment inventory of diverse developments throughout San Diego County. Multiple sites for 17 different development types are included in the survey data and the square footage and
Section
Three
PESD - FEE JUSTIFICATION REPORT
MARCH 30, 2020 13
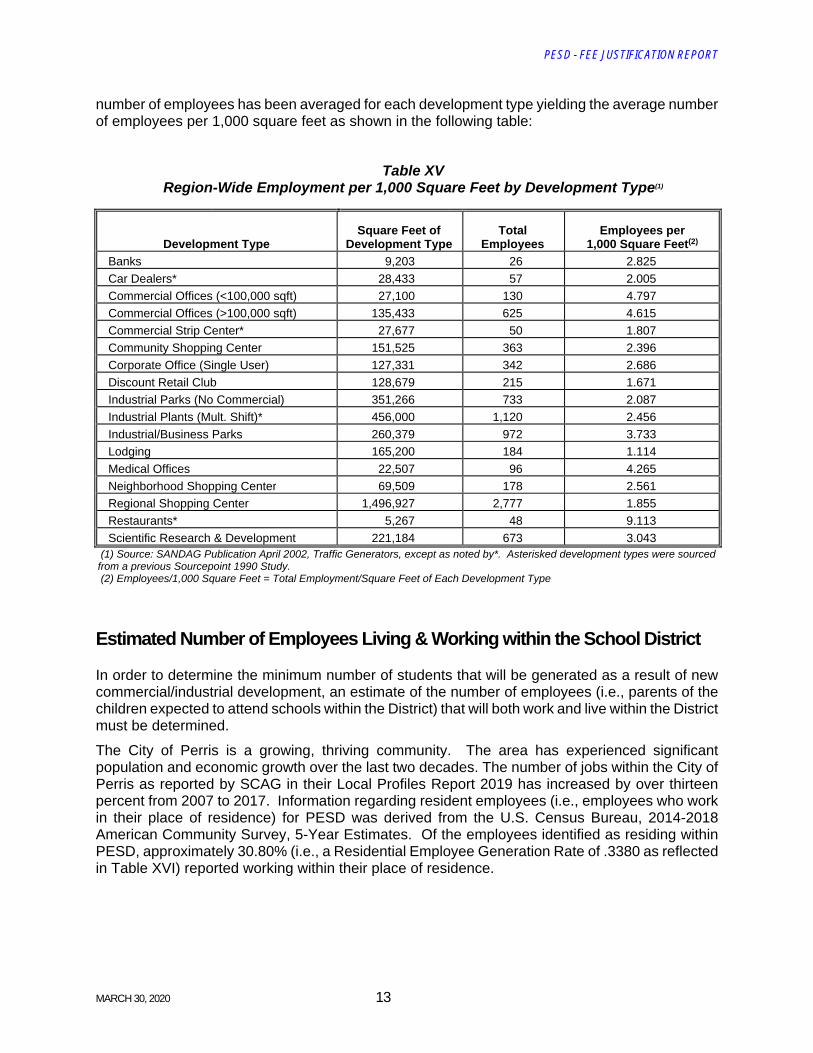
number of employees has been averaged for each development type yielding the average number of employees per 1,000 square feet as shown in the following table:
Table XV Region-Wide Employment per 1,000 Square Feet by Development Type(1)
Development Type Square Feet of
Development TypeTotal
EmployeesEmployees per
1,000 Square Feet(2)
Banks 9,203 26 2.825
Car Dealers* 28,433 57 2.005
Commercial Offices (<100,000 sqft) 27,100 130 4.797
Commercial Offices (>100,000 sqft) 135,433 625 4.615
Commercial Strip Center* 27,677 50 1.807
Community Shopping Center 151,525 363 2.396
Corporate Office (Single User) 127,331 342 2.686
Discount Retail Club 128,679 215 1.671
Industrial Parks (No Commercial) 351,266 733 2.087
Industrial Plants (Mult. Shift)* 456,000 1,120 2.456
Industrial/Business Parks 260,379 972 3.733
Lodging 165,200 184 1.114
Medical Offices 22,507 96 4.265
Neighborhood Shopping Center 69,509 178 2.561
Regional Shopping Center 1,496,927 2,777 1.855
Restaurants* 5,267 48 9.113
Scientific Research & Development 221,184 673 3.043 (1) Source: SANDAG Publication April 2002, Traffic Generators, except as noted by*. Asterisked development types were sourced from a previous Sourcepoint 1990 Study. (2) Employees/1,000 Square Feet = Total Employment/Square Feet of Each Development Type
Estimated Number of Employees Living & Working within the School District
In order to determine the minimum number of students that will be generated as a result of new commercial/industrial development, an estimate of the number of employees (i.e., parents of the children expected to attend schools within the District) that will both work and live within the District must be determined.
The City of Perris is a growing, thriving community. The area has experienced significant population and economic growth over the last two decades. The number of jobs within the City of Perris as reported by SCAG in their Local Profiles Report 2019 has increased by over thirteen percent from 2007 to 2017. Information regarding resident employees (i.e., employees who work in their place of residence) for PESD was derived from the U.S. Census Bureau, 2014-2018 American Community Survey, 5-Year Estimates. Of the employees identified as residing within PESD, approximately 30.80% (i.e., a Residential Employee Generation Rate of .3380 as reflected in Table XVI) reported working within their place of residence.
PESD - FEE JUSTIFICATION REPORT
MARCH 30, 2020 14
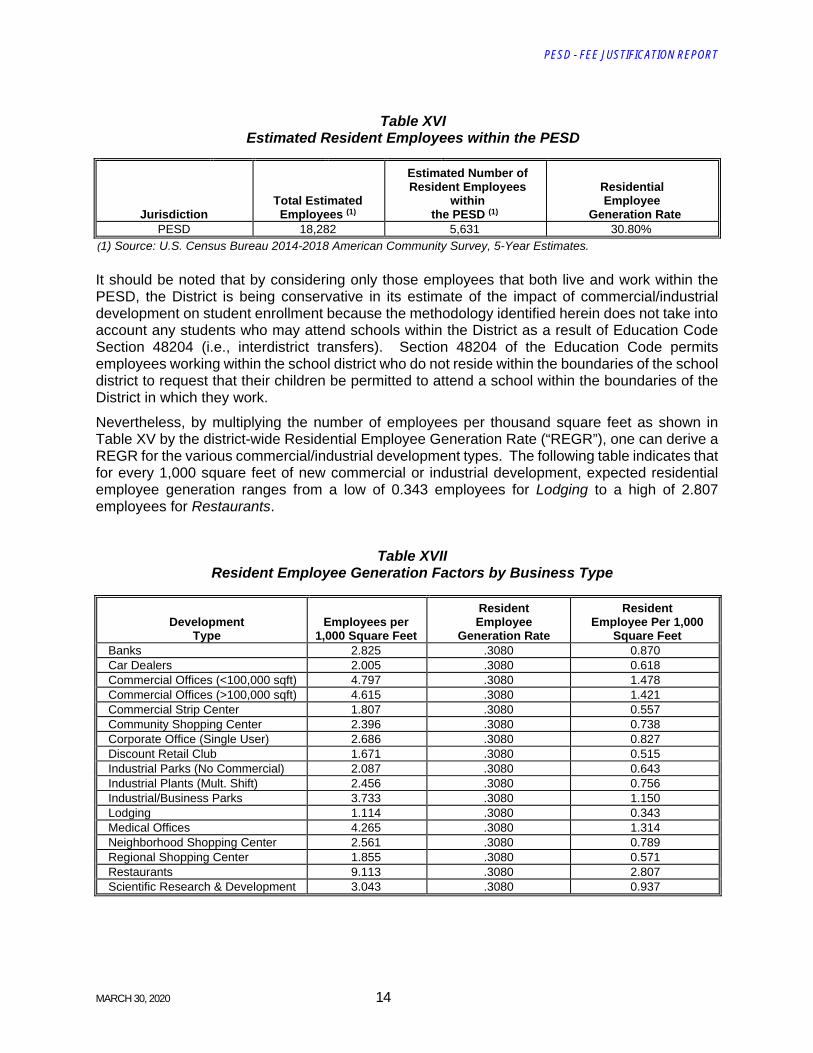
Table XVI
Estimated Resident Employees within the PESD
Jurisdiction Total Estimated Employees (1)
Estimated Number of Resident Employees
within the PESD (1)
Residential Employee
Generation Rate PESD 18,282 5,631 30.80%
(1) Source: U.S. Census Bureau 2014-2018 American Community Survey, 5-Year Estimates.
It should be noted that by considering only those employees that both live and work within the PESD, the District is being conservative in its estimate of the impact of commercial/industrial development on student enrollment because the methodology identified herein does not take into account any students who may attend schools within the District as a result of Education Code Section 48204 (i.e., interdistrict transfers). Section 48204 of the Education Code permits employees working within the school district who do not reside within the boundaries of the school district to request that their children be permitted to attend a school within the boundaries of the District in which they work.
Nevertheless, by multiplying the number of employees per thousand square feet as shown in Table XV by the district-wide Residential Employee Generation Rate (“REGR”), one can derive a REGR for the various commercial/industrial development types. The following table indicates that for every 1,000 square feet of new commercial or industrial development, expected residential employee generation ranges from a low of 0.343 employees for Lodging to a high of 2.807 employees for Restaurants.
Table XVII Resident Employee Generation Factors by Business Type
Development Type
Employees per 1,000 Square Feet
Resident Employee
Generation Rate
Resident Employee Per 1,000
Square FeetBanks 2.825 .3080 0.870 Car Dealers 2.005 .3080 0.618 Commercial Offices (<100,000 sqft) 4.797 .3080 1.478 Commercial Offices (>100,000 sqft) 4.615 .3080 1.421 Commercial Strip Center 1.807 .3080 0.557 Community Shopping Center 2.396 .3080 0.738 Corporate Office (Single User) 2.686 .3080 0.827 Discount Retail Club 1.671 .3080 0.515 Industrial Parks (No Commercial) 2.087 .3080 0.643 Industrial Plants (Mult. Shift) 2.456 .3080 0.756 Industrial/Business Parks 3.733 .3080 1.150 Lodging 1.114 .3080 0.343 Medical Offices 4.265 .3080 1.314 Neighborhood Shopping Center 2.561 .3080 0.789 Regional Shopping Center 1.855 .3080 0.571 Restaurants 9.113 .3080 2.807 Scientific Research & Development 3.043 .3080 0.937
PESD - FEE JUSTIFICATION REPORT
MARCH 30, 2020 15
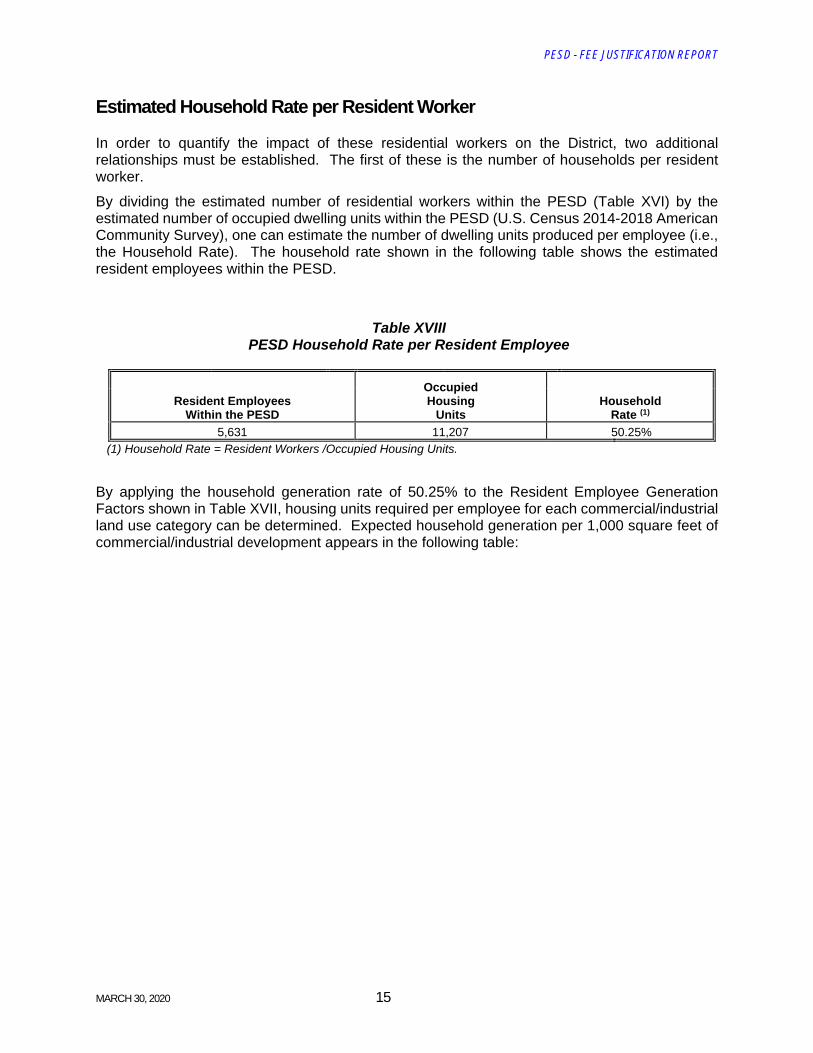
Estimated Household Rate per Resident Worker
In order to quantify the impact of these residential workers on the District, two additional relationships must be established. The first of these is the number of households per resident worker.
By dividing the estimated number of residential workers within the PESD (Table XVI) by the estimated number of occupied dwelling units within the PESD (U.S. Census 2014-2018 American Community Survey), one can estimate the number of dwelling units produced per employee (i.e., the Household Rate). The household rate shown in the following table shows the estimated resident employees within the PESD.
Table XVIII PESD Household Rate per Resident Employee
Resident Employees Within the PESD
Occupied Housing
UnitsHousehold
Rate (1)
5,631 11,207 50.25%
(1) Household Rate = Resident Workers /Occupied Housing Units.
By applying the household generation rate of 50.25% to the Resident Employee Generation Factors shown in Table XVII, housing units required per employee for each commercial/industrial land use category can be determined. Expected household generation per 1,000 square feet of commercial/industrial development appears in the following table:
PESD - FEE JUSTIFICATION REPORT
MARCH 30, 2020 16
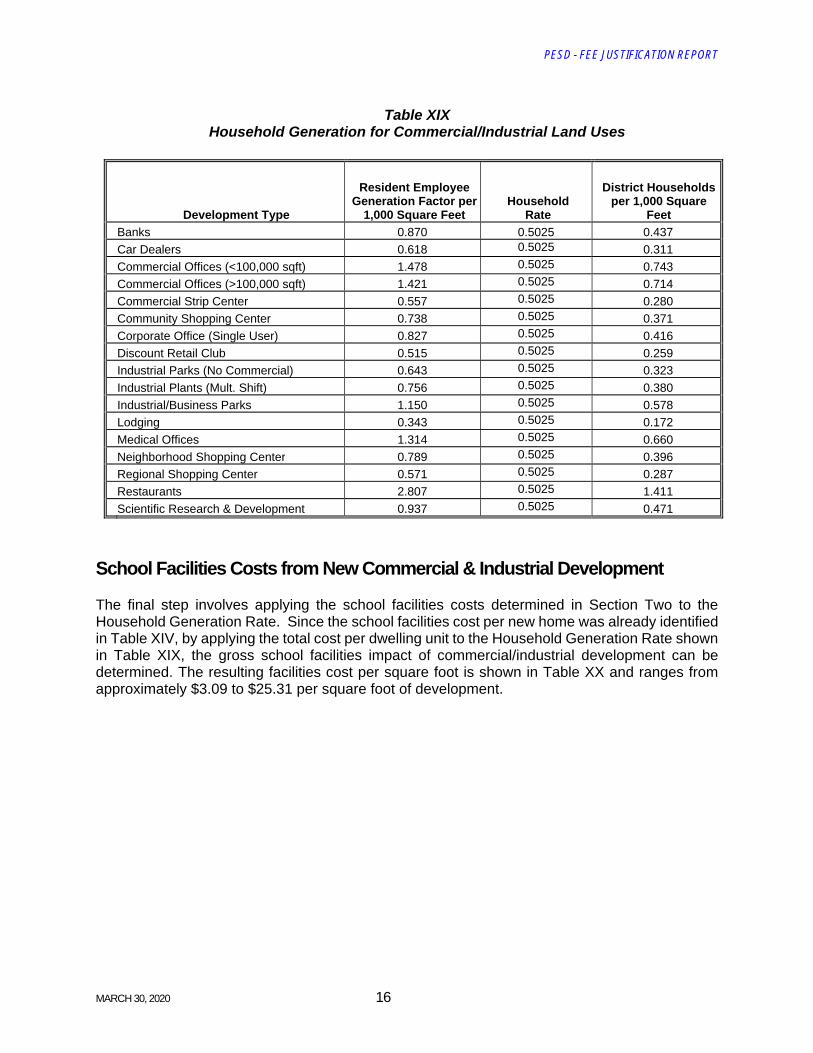
Table XIX Household Generation for Commercial/Industrial Land Uses
Development Type
Resident Employee Generation Factor per
1,000 Square FeetHousehold
Rate
District Households per 1,000 Square
Feet
Banks 0.870 0.5025 0.437
Car Dealers 0.618 0.5025 0.311
Commercial Offices (<100,000 sqft) 1.478 0.5025 0.743
Commercial Offices (>100,000 sqft) 1.421 0.5025 0.714
Commercial Strip Center 0.557 0.5025 0.280
Community Shopping Center 0.738 0.5025 0.371
Corporate Office (Single User) 0.827 0.5025 0.416
Discount Retail Club 0.515 0.5025 0.259
Industrial Parks (No Commercial) 0.643 0.5025 0.323
Industrial Plants (Mult. Shift) 0.756 0.5025 0.380
Industrial/Business Parks 1.150 0.5025 0.578
Lodging 0.343 0.5025 0.172
Medical Offices 1.314 0.5025 0.660
Neighborhood Shopping Center 0.789 0.5025 0.396
Regional Shopping Center 0.571 0.5025 0.287
Restaurants 2.807 0.5025 1.411
Scientific Research & Development 0.937 0.5025 0.471
School Facilities Costs from New Commercial & Industrial Development
The final step involves applying the school facilities costs determined in Section Two to the Household Generation Rate. Since the school facilities cost per new home was already identified in Table XIV, by applying the total cost per dwelling unit to the Household Generation Rate shown in Table XIX, the gross school facilities impact of commercial/industrial development can be determined. The resulting facilities cost per square foot is shown in Table XX and ranges from approximately $3.09 to $25.31 per square foot of development.
PESD - FEE JUSTIFICATION REPORT
MARCH 30, 2020 17
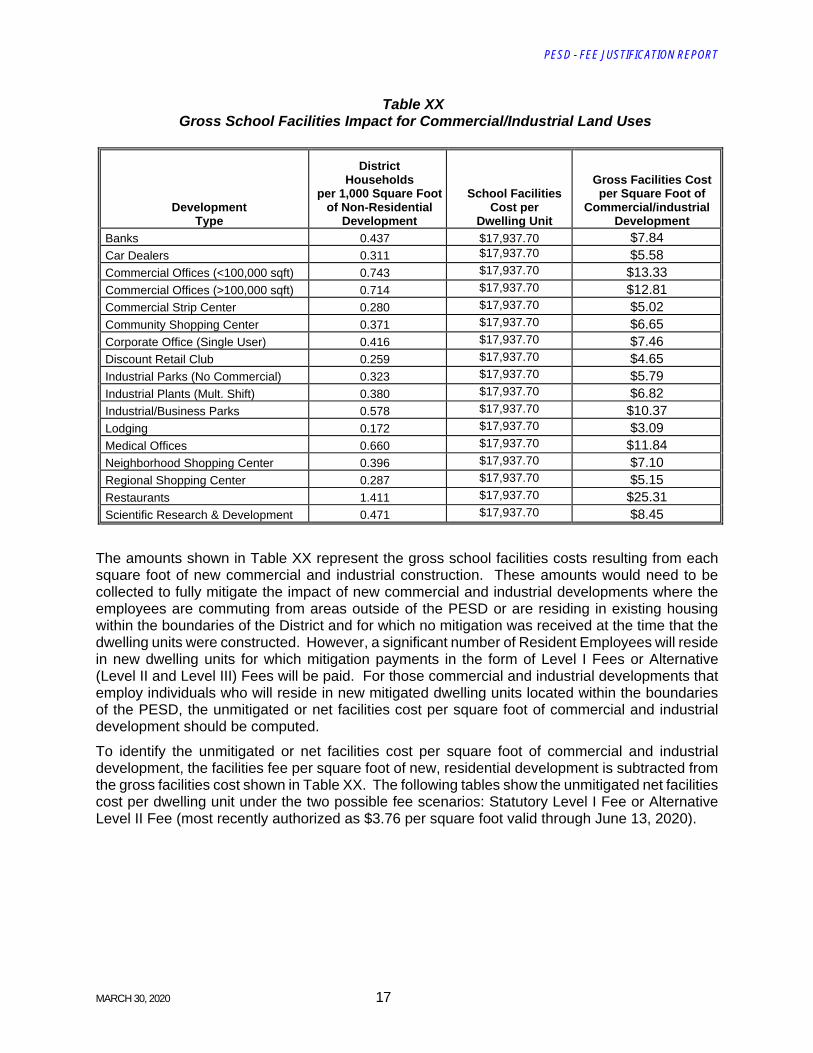
Table XX Gross School Facilities Impact for Commercial/Industrial Land Uses
Development Type
District Households
per 1,000 Square Foot of Non-Residential
Development
School Facilities
Cost per Dwelling Unit
Gross Facilities Cost per Square Foot of
Commercial/industrial Development
Banks 0.437 $17,937.70 $7.84Car Dealers 0.311 $17,937.70 $5.58 Commercial Offices (<100,000 sqft) 0.743 $17,937.70 $13.33 Commercial Offices (>100,000 sqft) 0.714 $17,937.70 $12.81 Commercial Strip Center 0.280 $17,937.70 $5.02Community Shopping Center 0.371 $17,937.70 $6.65 Corporate Office (Single User) 0.416 $17,937.70 $7.46 Discount Retail Club 0.259 $17,937.70 $4.65 Industrial Parks (No Commercial) 0.323 $17,937.70 $5.79 Industrial Plants (Mult. Shift) 0.380 $17,937.70 $6.82 Industrial/Business Parks 0.578 $17,937.70 $10.37 Lodging 0.172 $17,937.70 $3.09Medical Offices 0.660 $17,937.70 $11.84 Neighborhood Shopping Center 0.396 $17,937.70 $7.10Regional Shopping Center 0.287 $17,937.70 $5.15 Restaurants 1.411 $17,937.70 $25.31 Scientific Research & Development 0.471 $17,937.70 $8.45
The amounts shown in Table XX represent the gross school facilities costs resulting from each square foot of new commercial and industrial construction. These amounts would need to be collected to fully mitigate the impact of new commercial and industrial developments where the employees are commuting from areas outside of the PESD or are residing in existing housing within the boundaries of the District and for which no mitigation was received at the time that the dwelling units were constructed. However, a significant number of Resident Employees will reside in new dwelling units for which mitigation payments in the form of Level I Fees or Alternative (Level II and Level III) Fees will be paid. For those commercial and industrial developments that employ individuals who will reside in new mitigated dwelling units located within the boundaries of the PESD, the unmitigated or net facilities cost per square foot of commercial and industrial development should be computed.
To identify the unmitigated or net facilities cost per square foot of commercial and industrial development, the facilities fee per square foot of new, residential development is subtracted from the gross facilities cost shown in Table XX. The following tables show the unmitigated net facilities cost per dwelling unit under the two possible fee scenarios: Statutory Level I Fee or Alternative Level II Fee (most recently authorized as $3.76 per square foot valid through June 13, 2020).
PESD - FEE JUSTIFICATION REPORT
MARCH 30, 2020 18
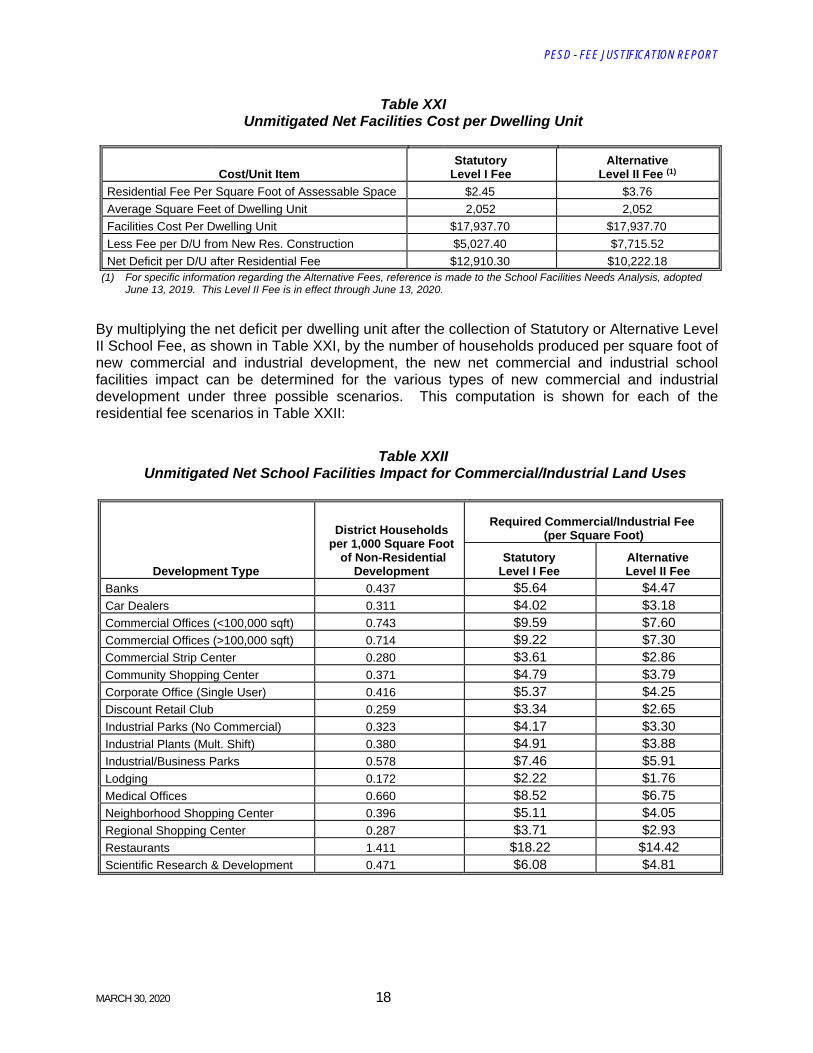
Table XXI Unmitigated Net Facilities Cost per Dwelling Unit
Cost/Unit Item
Statutory Level I Fee
Alternative Level II Fee (1)
Residential Fee Per Square Foot of Assessable Space $2.45 $3.76
Average Square Feet of Dwelling Unit 2,052 2,052
Facilities Cost Per Dwelling Unit $17,937.70 $17,937.70
Less Fee per D/U from New Res. Construction $5,027.40 $7,715.52
Net Deficit per D/U after Residential Fee $12,910.30 $10,222.18 (1) For specific information regarding the Alternative Fees, reference is made to the School Facilities Needs Analysis, adopted
June 13, 2019. This Level II Fee is in effect through June 13, 2020.
By multiplying the net deficit per dwelling unit after the collection of Statutory or Alternative Level II School Fee, as shown in Table XXI, by the number of households produced per square foot of new commercial and industrial development, the new net commercial and industrial school facilities impact can be determined for the various types of new commercial and industrial development under three possible scenarios. This computation is shown for each of the residential fee scenarios in Table XXII:
Table XXII
Unmitigated Net School Facilities Impact for Commercial/Industrial Land Uses
Development Type
District Households per 1,000 Square Foot
of Non-Residential Development
Required Commercial/Industrial Fee (per Square Foot)
Statutory Level I Fee
Alternative Level II Fee
Banks 0.437 $5.64 $4.47 Car Dealers 0.311 $4.02 $3.18 Commercial Offices (<100,000 sqft) 0.743 $9.59 $7.60 Commercial Offices (>100,000 sqft) 0.714 $9.22 $7.30 Commercial Strip Center 0.280 $3.61 $2.86 Community Shopping Center 0.371 $4.79 $3.79 Corporate Office (Single User) 0.416 $5.37 $4.25 Discount Retail Club 0.259 $3.34 $2.65 Industrial Parks (No Commercial) 0.323 $4.17 $3.30 Industrial Plants (Mult. Shift) 0.380 $4.91 $3.88 Industrial/Business Parks 0.578 $7.46 $5.91 Lodging 0.172 $2.22 $1.76 Medical Offices 0.660 $8.52 $6.75 Neighborhood Shopping Center 0.396 $5.11 $4.05 Regional Shopping Center 0.287 $3.71 $2.93 Restaurants 1.411 $18.22 $14.42 Scientific Research & Development 0.471 $6.08 $4.81
PESD - FEE JUSTIFICATION REPORT
MARCH 30, 2020 19
Commercial/Industrial Development Impact
The school facilities impact shown above represents the net cost to provide school facilities required to serve new students resulting from the construction of new commercial/industrial development assuming that a portion of the impact has already been mitigated by new residential construction. As previously noted, this amount does not reflect the gross impact of new commercial/industrial development where some portion of the new employees will be housed in existing housing (from which no additional residential impact fee may be collected) or from interdistrict transfers due to employment. However, as can be seen in Table XXII, assuming that the District received corresponding residential Alternative Level II Fees for all new commercial and industrial development, it would still be justified in collecting between $1.76 and $14.42 per square foot in order to fully mitigate the impact of new commercial and industrial development. Pursuant to Government Code Section 65995(b)(2), a unified school district is only authorized to collect $0.66 per square foot of new commercial/industrial development. Therefore, for all commercial/industrial development types shown in Table XXII, PESD is justified in levying the maximum authorized, pursuant to agreements with the associated high school district, of $0.40 per square foot.
Senior Citizen Housing
As it relates to the imposition of developer fees upon senior citizen housing projects, Section 65995.1(a) of the Government Code reads as follows:
Notwithstanding any other provision of law, as to any development project for the construction of senior citizen housing, as described in Section 51.3 of the Civil Code, a residential care facility for the elderly as described in subdivision (k) of Section 1569.2 of the Health and Safety Code[1], or a multilevel facility for the elderly as described in paragraph (9) of subdivision (d) of Section 15432, any fee charge, dedication or other requirement that is levied under Section 53080[2] may be applied only to new construction and is subject to the limits and conditions applicable to under subdivision (b) of Section 65995 in the case of commercial or industrial development.
[1] Although described in subdivision (k), definition found under subdivision (o) and (p). [2] Government Code Section 53080 was revised to Education Code Section 17620.
The District acknowledges that students will not reside in senior citizen housing units. However, the development of such housing generally generates jobs for facilities maintenance and administration, and in the case of assisted care living situations, health professionals. These jobs may be filled by persons living either within the boundaries of the District or outside the boundaries of the District. In either case, the employees may enroll their students in the District. As a result, some students may be generated as a result of the development of new senior citizen housing.
The District acknowledges Section 65995.1 and will levy its share of developer fees on any senior citizen housing projects at the current commercial/industrial rate per square foot. The District will require proof that such senior units are indeed restricted to seniors (i.e. a copy of the recorded CC&Rs or deed(s)).
PESD - FEE JUSTIFICATION REPORT
MARCH 30, 2020 20
CONCLUSIONS & STATEMENT OF FINDINGS
Based upon the data gathered by SDFA regarding future development within the boundaries of the PESD, student generation, school facilities costs and the methodology employed to determine the school facilities impact from new residential and commercial development, PESD makes the following findings pursuant to Section 66001 of the California Government Code:
The purpose of the fee is to pay for the construction and/or acquisition of new public school facilities necessary to serve students expected to be generated from new residential and commercial/industrial development.
The fees will be collected and may be used to repay debt service for financing issued for the purpose of providing new school facilities or to pay directly for the acquisition and/or construction of such facilities. The fees may also be used to pay for the leasing or acquisition of portable classrooms to meet the temporary needs of students generated from new development.
There is a reasonable relationship between the expected use of the fee (i.e., new school facilities) and the development on which the fee is imposed (i.e., new residential, commercial and industrial development) because additional students will be generated by new residential and commercial/industrial development.
There is a reasonable relationship between the number of new residential units constructed and the number of elementary school students expected to be generated from the construction of such units. There is also a reasonable relationship between the construction of new commercial/industrial development and the number of students expected to be generated from the construction of such commercial/industrial development, as students and the parents of students will be employed by new businesses occupying the new commercial or industrial development and a portion of the students and/or the students’ parents will also choose to live within the boundaries of the District.
There is a reasonable relationship between the amount of the fee identified in this Report and the cost of the school facilities to be constructed and deemed necessary to serve new residential and commercial/industrial developments.
As identified in Section Two, the District would need to collect approximately $8.74 per square foot of assessable space of new residential development to mitigate the school facilities impacts for grades K though 6. This amount is well in excess of the District’s portion of the currently authorized statutory fee (i.e., Level I Fee) of $2.45 per square foot of assessable space for grades K though 6. Thus, the District is justified in collecting the statutory fees for residential development as permitted by state law.
Section
Four
PESD - FEE JUSTIFICATION REPORT
MARCH 30, 2020 21
As identified in Section Three, the District would need to collect between $1.76 and $14.42 per square foot of commercial/industrial development to mitigate the net school facilities impacts resulting from new commercial and industrial development. This amount is well in excess of the District’s portion of the currently authorized statutory fee (i.e., Commercial/Industrial Fees) of $0.40 per square foot. Thus, the District is justified in collecting the statutory fees for commercial/industrial development as permitted by state law.
PESD - FEE JUSTIFICATION REPORT
MARCH 30, 2020 22
APPENDICES
Appendix A: SCAG – Residential Development Projections
Appendix B: Student Generation Rate Analysis
Appendix C: Elementary School Facilities Costs
Appendix D: Interim Housing Facilities Costs
Section
Five
PESD - FEE JUSTIFICATION REPORT
Appendix A: SCAG – Residential Development Projections
Perris Elementary School DistrictSource: Southern California Associate of Governments
Tier2 (TAZ) Location
Percent in
District*
2012
Households
2020
Households
2035
Households
2040
Households
43300200 Lake Elsinore 62.03% 7 14 32 37
43302400 Perris 100.00% 397 527 902 969
43304300 Perris 73.41% 7 39 154 179
43308200 Perris 75.00% 287 380 669 729
43308300 Perris 100.00% 487 704 1,373 1,502
43310300 Perris 39.04% 1 2 2 2
43312100 Perris 100.00% 680 911 1,548 1,602
43312300 Perris 100.00% 1,272 1,863 2,930 3,112
43312400 Perris 100.00% 346 553 1,185 1,256
43313100 Perris 6.00% 2 2 2 2
43313200 Perris 99.52% 20 88 334 388
43313300 Perris 100.00% 51 102 280 318
43313400 Perris 5.00% 3 3 4 4
43313600 Perris 100.00% 182 275 572 631
43313700 Perris 98.85% 3 3 3 3
43313800 Perris 100.00% 20 25 25 25
43313900 Perris 100.00% 205 256 267 267
43315100 Perris 0.85% 0 0 1 1
43315200 Perris 0.00% 0 0 0 0
43315400 Perris 46.02% 171 241 453 493
43318300 Perris 50.04% 1,614 2,126 2,450 2,452
43320100 Perris 99.90% 1,912 2,587 4,447 4,508
43321300 Perris 0.00% 0 0 0 0
43329300 Perris 98.57% 7 21 70 80
43329600 Perris 98.44% 209 267 377 378
43331800 Perris 49.41% 261 364 673 732
43332500 Perris 0.20% 0 0 0 0
43216100 Unincorporated 2.95% 4 5 6 6
43216300 Unincorporated 24.20% 61 61 61 61
43216400 Unincorporated 28.36% 34 40 45 48
43226100 Unincorporated 14.26% 12 18 36 40
43226200 Unincorporated 81.30% 112 136 193 207
43226400 Unincorporated 92.46% 304 362 376 376
43226500 Unincorporated 23.63% 23 29 41 44
43299200 Unincorporated 1.74% 2 2 3 3
43299300 Unincorporated 100.00% 75 94 139 152
43299400 Unincorporated 8.53% 12 14 19 20
43299500 Unincorporated 100.00% 66 75 133 133
43300100 Unincorporated 100.00% 143 152 206 214
43300200 Unincorporated 1.27% 0 0 1 1
43300300 Unincorporated 0.03% 0 0 0 0
43300400 Unincorporated 75.82% 268 268 324 324
43301100 Unincorporated 100.00% 337 337 491 491
43301200 Unincorporated 100.00% 39 48 48 48
43301300 Unincorporated 100.00% 189 189 280 280
43301400 Unincorporated 100.00% 192 192 273 273
43301500 Unincorporated 100.00% 43 43 50 50
43302200 Unincorporated 80.37% 335 335 362 383
43302300 Unincorporated 24.43% 52 52 64 87
43303100 Unincorporated 100.00% 53 55 76 76
43303200 Unincorporated 100.00% 86 93 123 123
SCAG's 2016 Regional Transportation Plan and Sustainable Communities Strategy (RTP/SCS) Growth Forecast adopted
(data date) April 2016
PESD ‐ Growth Forecast By TAZ Appendix A ‐ Page 1 of 2
Perris Elementary School DistrictSource: Southern California Associate of Governments
Tier2 (TAZ) Location
Percent in
District*
2012
Households
2020
Households
2035
Households
2040
Households
SCAG's 2016 Regional Transportation Plan and Sustainable Communities Strategy (RTP/SCS) Growth Forecast adopted
(data date) April 2016
43303300 Unincorporated 100.00% 51 56 66 70
43303400 Unincorporated 100.00% 189 195 234 272
43303500 Unincorporated 100.00% 136 200 271 271
43304200 Unincorporated 91.58% 131 144 169 186
43304300 Unincorporated 24.47% 2 13 51 60
43304400 Unincorporated 0.62% 0 0 1 1
43308100 Unincorporated 100.00% 112 113 171 172
43308200 Unincorporated 25.00% 96 127 223 243
43312200 Unincorporated 100.00% 14 14 14 14
43313100 Unincorporated 94.00% 26 26 26 26
43313400 Unincorporated 95.00% 55 60 82 85
43313500 Unincorporated 100.00% 59 59 69 69
43329200 Unincorporated 7.58% 1 1 3 12
43331400 Unincorporated 0.09% 0 0 2 2
11,461 14,956 23,484 24,591
Estimated Number of Dwelling Units to Exist on January 1, 2020: 14,956Data provided by SCAG per TAZ was adopted at a Jurisdictional Level Only in April of 2016 to be used in the 2016 Regional Transportation Plan and Sustainable Communities Strategy.
*Percentage in District was provided by SCAG through GIS review. Percentage within each Local Agencies was determined through review of GIS mapping.
PESD ‐ Growth Forecast By TAZ Appendix A ‐ Page 2 of 2
PESD - FEE JUSTIFICATION REPORT
Appendix B: Student Generation Rate Analysis
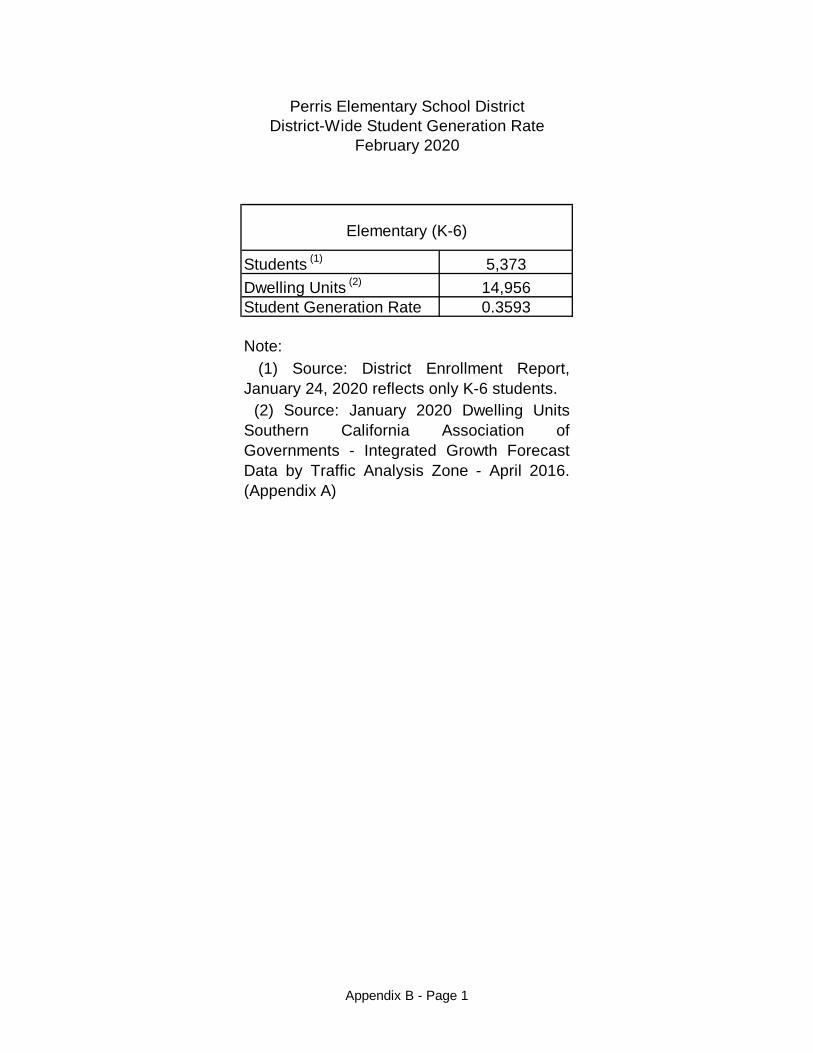
Students (1) 5,373
Dwelling Units (2) 14,956Student Generation Rate 0.3593
Note:
February 2020
(2) Source: January 2020 Dwelling UnitsSouthern California Association ofGovernments - Integrated Growth ForecastData by Traffic Analysis Zone - April 2016.(Appendix A)
Perris Elementary School DistrictDistrict-Wide Student Generation Rate
(1) Source: District Enrollment Report,January 24, 2020 reflects only K-6 students.
Elementary (K-6)
Appendix B - Page 1

PESD - FEE JUSTIFICATION REPORT
Appendix C: Elementary School Facilities Costs
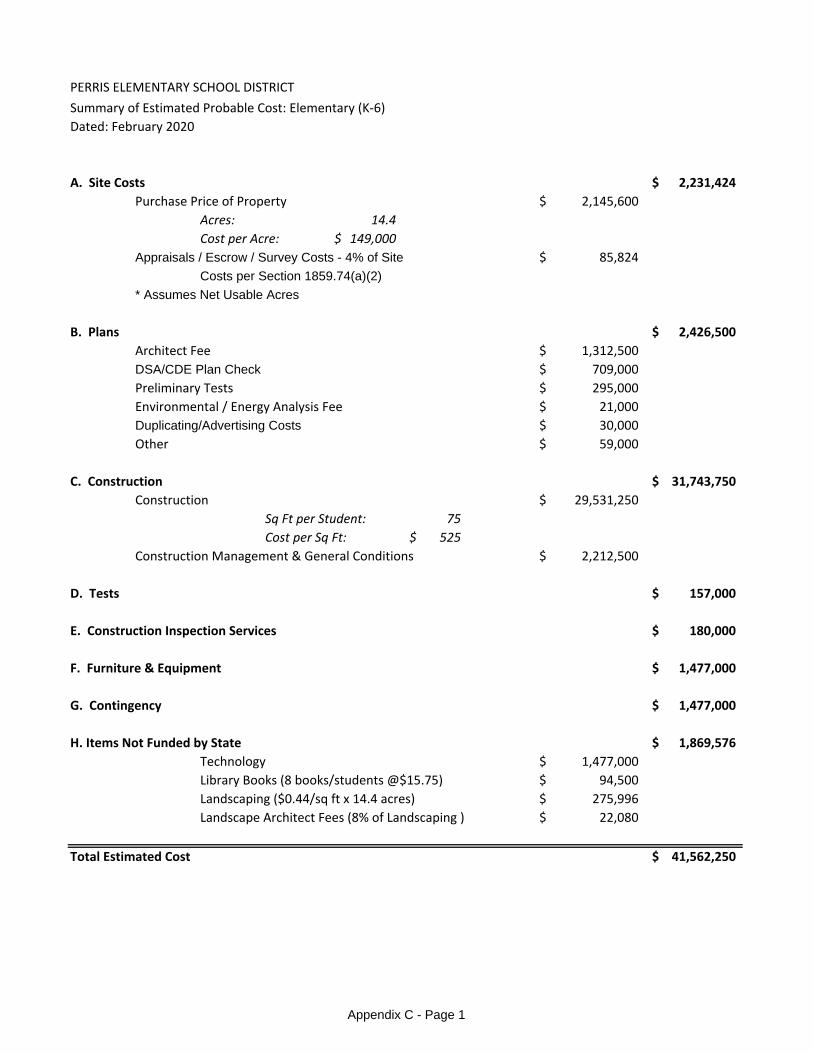
PERRIS ELEMENTARY SCHOOL DISTRICT
Summary of Estimated Probable Cost: Elementary (K‐6)
Dated: February 2020
A. Site Costs 2,231,424$
Purchase Price of Property 2,145,600$
Acres: 14.4
Cost per Acre: 149,000$
Appraisals / Escrow / Survey Costs - 4% of Site 85,824$
Costs per Section 1859.74(a)(2)
* Assumes Net Usable Acres
B. Plans 2,426,500$
Architect Fee 1,312,500$
DSA/CDE Plan Check 709,000$
Preliminary Tests 295,000$
Environmental / Energy Analysis Fee 21,000$
Duplicating/Advertising Costs 30,000$
Other 59,000$
C. Construction 31,743,750$
Construction 29,531,250$
Sq Ft per Student: 75
Cost per Sq Ft: 525$
Construction Management & General Conditions 2,212,500$
D. Tests 157,000$
E. Construction Inspection Services 180,000$
F. Furniture & Equipment 1,477,000$
G. Contingency 1,477,000$
H. Items Not Funded by State 1,869,576$
Technology 1,477,000$
Library Books (8 books/students @$15.75) 94,500$
Landscaping ($0.44/sq ft x 14.4 acres) 275,996$
Landscape Architect Fees (8% of Landscaping ) 22,080$
Total Estimated Cost 41,562,250$
Appendix C - Page 1
PESD - FEE JUSTIFICATION REPORT
Appendix D: Interim Housing Facilities Costs
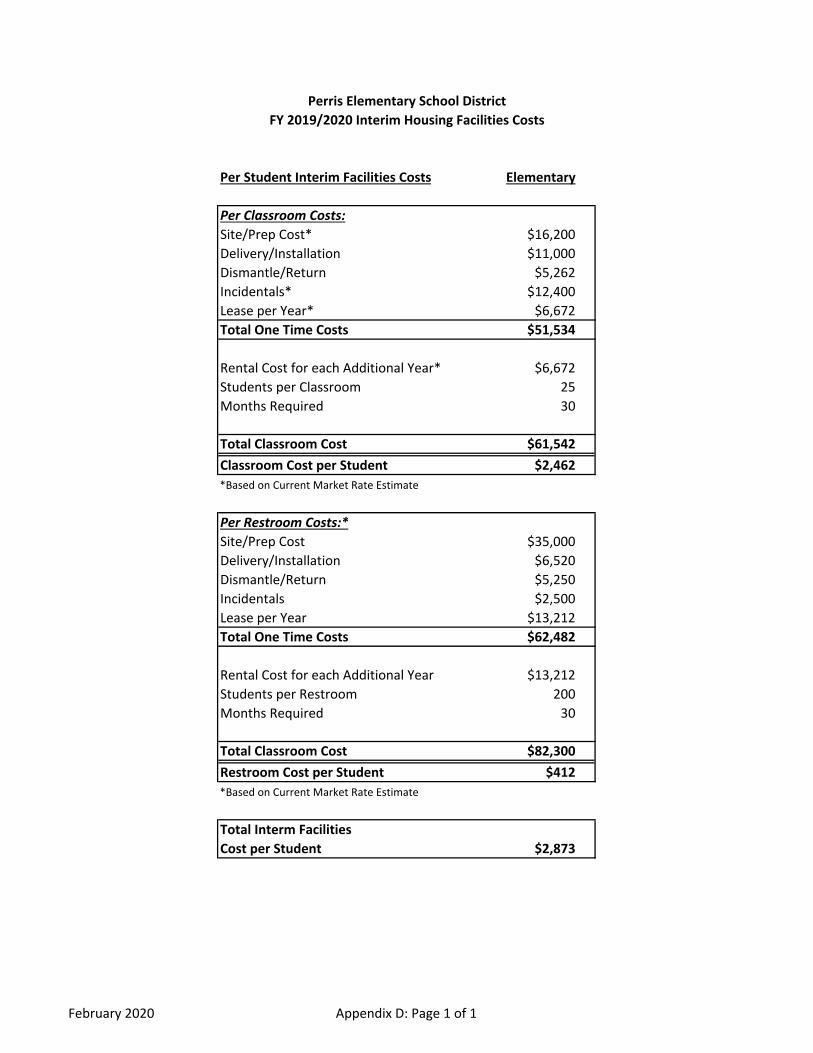
Per Student Interim Facilities Costs Elementary
Per Classroom Costs:
Site/Prep Cost* $16,200
Delivery/Installation $11,000
Dismantle/Return $5,262
Incidentals* $12,400
Lease per Year* $6,672
Total One Time Costs $51,534
Rental Cost for each Additional Year* $6,672
Students per Classroom 25
Months Required 30
Total Classroom Cost $61,542
Classroom Cost per Student $2,462
*Based on Current Market Rate Estimate
Per Restroom Costs:*
Site/Prep Cost $35,000
Delivery/Installation $6,520
Dismantle/Return $5,250
Incidentals $2,500
Lease per Year $13,212
Total One Time Costs $62,482
Rental Cost for each Additional Year $13,212
Students per Restroom 200
Months Required 30
Total Classroom Cost $82,300
Restroom Cost per Student $412
*Based on Current Market Rate Estimate
Total Interm Facilities
Cost per Student $2,873
Perris Elementary School District
FY 2019/2020 Interim Housing Facilities Costs
February 2020 Appendix D: Page 1 of 1