Embed Size (px)
Citation preview


Perpustakaan Dewan Bahasa dan Pustaka BruneiCataloguing-in-publication
BRUNEI Darussalam key indicators 2016. --Bandar Seri Begawan : Department of Statistics, Department of Economic Planning and Development Prime Minister’s Office, 2017. 82p. cm. ISBN 978-99917-72-09-7 (kulit lembut) 1. Economic indicators--Brunei Darussalam--Statistics--Periodicals. 2. Brunei Darussalam--Economic conditions--Statistics--Periodicals. 330.905955 BRU (DDC23)
BRUNEI DARUSSALAMKEY INDICATORS 2016
JABATAN PERANGKAANJABATAN PERANCANGAN DAN KEMAJUAN EKONOMI (JPKE)
JABATAN PERDANA MENTERINEGARA BRUNEI DARUSSALAM
DEPARTMENT OF STATISTICSDEPARTMENT OF ECONOMIC PLANNING AND DEVELOPMENT (DEPD)
PRIME MINISTER’S OFFICEBRUNEI DARUSSALAM
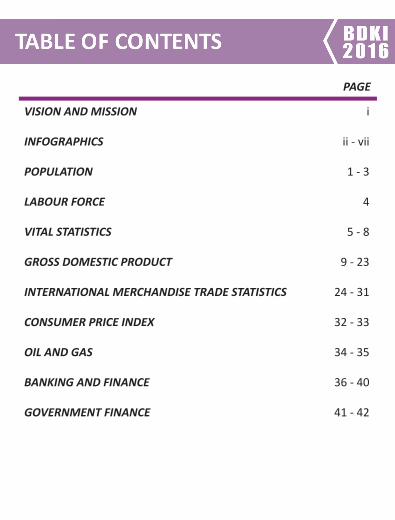
VISION AND MISSION i
INFOGRAPHICS ii - vii
POPULATION 1 - 3
LABOUR FORCE 4
VITAL STATISTICS 5 - 8
GROSS DOMESTIC PRODUCT 9 - 23
INTERNATIONAL MERCHANDISE TRADE STATISTICS 24 - 31
CONSUMER PRICE INDEX 32 - 33
OIL AND GAS 34 - 35
BANKING AND FINANCE 36 - 40
GOVERNMENT FINANCE 41 - 42
PAGE

EDUCATION 43 - 46
HEALTH 47 - 48
TRANSPORT 49 - 51
COMMUNICATION 52 -53
UTILITIES 54
PRIMARY SECTOR 55 - 60
MISCELLANEOUS 61 - 63
NOTES 64 - 65
LIST OF SOURCES 66 - 68
ENQUIRIES 69
PAGE

This Page is Intentionally Left Blank
DEPARTMENT OF ECONOMIC PLANNING AND DEVELOPMENT
Vision
Progressive and Sustainable Economic Growth to Achieve Wawasan Brunei Darussalam 2035
Mission
Visionary Economic Planning, Innovative Implementation and High Quality Statistics
iBDKI 2016
BDKI 2016ii
iiiBDKI 2016
BDKI 2016iv
vBDKI 2016
BDKI 2016vi
viiBDKI 2016
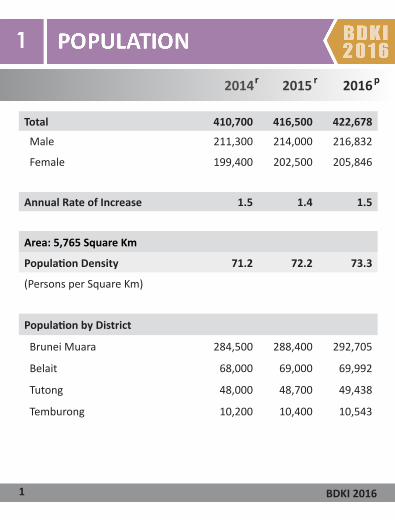
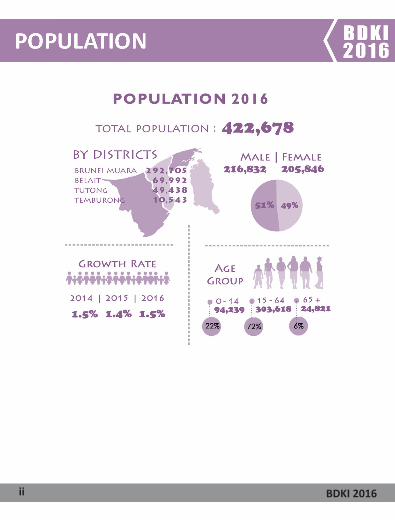
Total 410,700 416,500 422,678
Male 211,300 214,000 216,832
Female 199,400 202,500 205,846
Annual Rate of Increase 1.5 1.4 1.5
Area: 5,765 Square Km
Population Density 71.2 72.2 73.3
(Persons per Square Km)
Population by District
Brunei Muara 284,500 288,400 292,705
Belait 68,000 69,000 69,992
Tutong 48,000 48,700 49,438
Temburong 10,200 10,400 10,543
2014 2015 2016
BDKI 20161
rr p
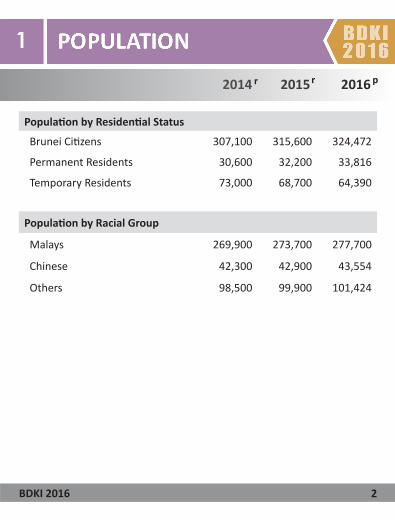
2014 2015 2016
Population by Residential Status
Brunei Citizens 307,100 315,600 324,472
Permanent Residents 30,600 32,200 33,816
Temporary Residents 73,000 68,700 64,390
Population by Racial Group
Malays 269,900 273,700 277,700
Chinese 42,300 42,900 43,554
Others 98,500 99,900 101,424
2014 2015 2016
2BDKI 2016
prr
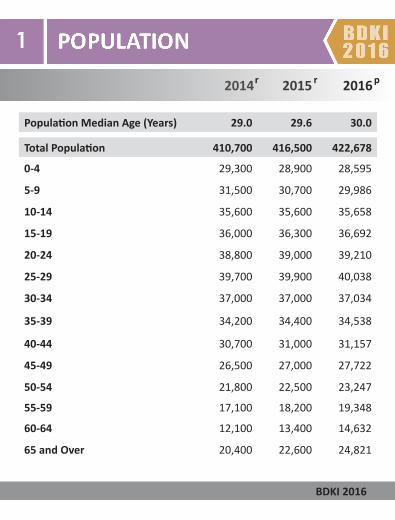
Total Population 410,700 416,500 422,678
0-4 29,300 28,900 28,595
5-9 31,500 30,700 29,986
10-14 35,600 35,600 35,658
15-19 36,000 36,300 36,692
20-24 38,800 39,000 39,210
25-29 39,700 39,900 40,038
30-34 37,000 37,000 37,034
35-39 34,200 34,400 34,538
40-44 30,700 31,000 31,157
45-49 26,500 27,000 27,722
50-54 21,800 22,500 23,247
55-59 17,100 18,200 19,348
60-64 12,100 13,400 14,632
65 and Over 20,400 22,600 24,821
Population Median Age (Years) 29.0 29.6 30.0
3 BDKI 2016
2014 2015 2016 rr p
2014 2015 2016
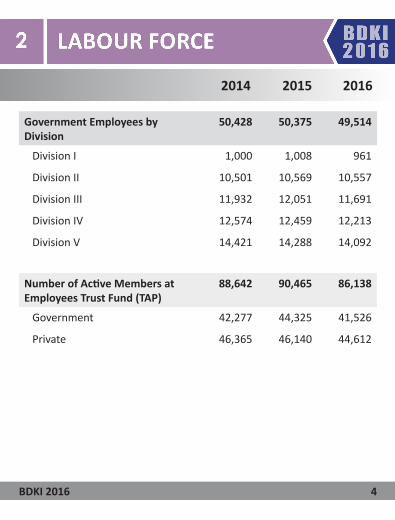
Government Employees by Division
50,428 50,375 49,514
Division I 1,000 1,008 961
Division II 10,501 10,569 10,557
Division III 11,932 12,051 11,691
Division IV 12,574 12,459 12,213
Division V 14,421 14,288 14,092
Number of Active Members at Employees Trust Fund (TAP)
88,642 90,465 86,138
Government 42,277 44,325 41,526
Private 46,365 46,140 44,612
4BDKI 2016
2014 2015 2016
2014 2015 2016
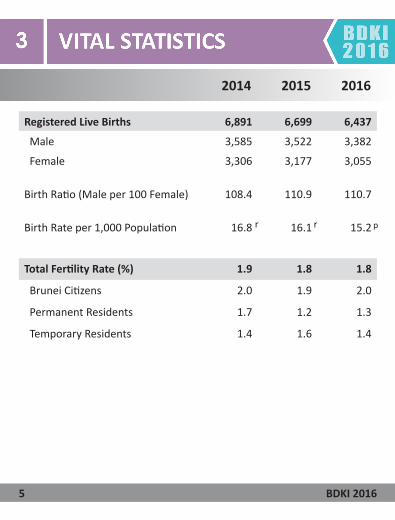
Registered Live Births 6,891 6,699 6,437
Male 3,585 3,522 3,382
Female 3,306 3,177 3,055
Birth Ratio (Male per 100 Female) 108.4 110.9 110.7
Birth Rate per 1,000 Population 16.8 16.1 15.2
Total Fertility Rate (%) 1.9 1.8 1.8
Brunei Citizens 2.0 1.9 2.0
Permanent Residents 1.7 1.2 1.3
Temporary Residents 1.4 1.6 1.4
5 BDKI 2016
r r p
2014 2015 2016
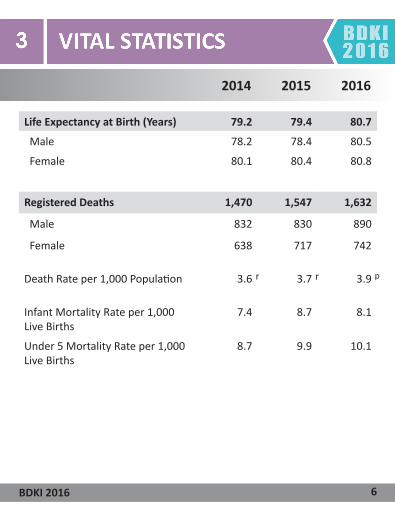
Life Expectancy at Birth (Years) 79.2 79.4 80.7
Male 78.2 78.4 80.5
Female 80.1 80.4 80.8
Registered Deaths 1,470 1,547 1,632
Male 832 830 890
Female 638 717 742
Death Rate per 1,000 Population 3.6 3.7 3.9
Infant Mortality Rate per 1,000 Live Births
7.4 8.7 8.1
Under 5 Mortality Rate per 1,000 Live Births
8.7 9.9 10.1
6BDKI 2016
rr p
2014 2015 2016
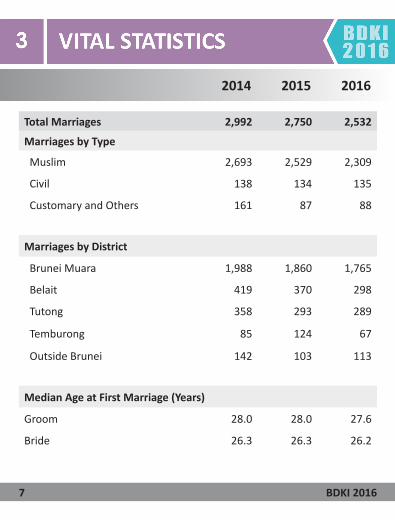
Total Marriages 2,992 2,750 2,532
Marriages by Type
Muslim 2,693 2,529 2,309
Civil 138 134 135
Customary and Others 161 87 88
Marriages by District
Brunei Muara 1,988 1,860 1,765
Belait 419 370 298
Tutong 358 293 289
Temburong 85 124 67
Outside Brunei 142 103 113
Median Age at First Marriage (Years)
Groom 28.0 28.0 27.6
Bride 26.3 26.3 26.2
7 BDKI 2016
2014 2015 2016
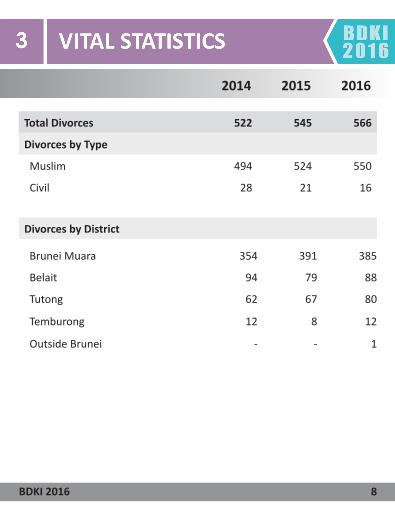
Total Divorces 522 545 566
Divorces by Type
Muslim 494 524 550
Civil 28 21 16
Divorces by District
Brunei Muara 354 391 385
Belait 94 79 88
Tutong 62 67 80
Temburong 12 8 12
Outside Brunei - - 1
8BDKI 2016
2014 2015 2016
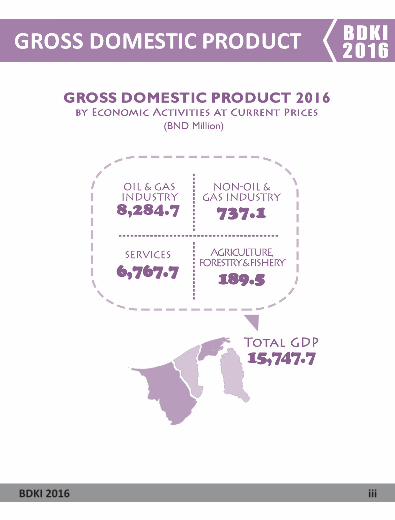
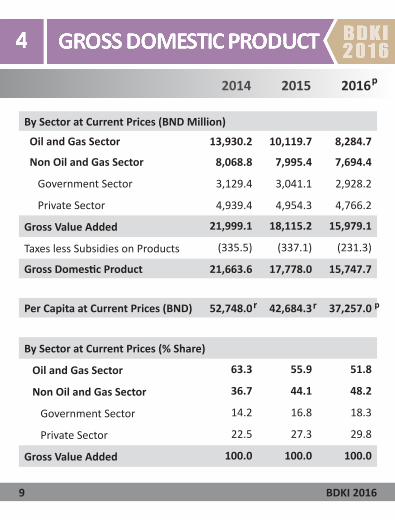
By Sector at Current Prices (BND Million)
Oil and Gas Sector 13,930.2 10,119.7 8,284.7
Non Oil and Gas Sector 8,068.8 7,995.4 7,694.4
Government Sector 3,129.4 3,041.1 2,928.2
Private Sector 4,939.4 4,954.3 4,766.2
Gross Value Added 21,999.1 18,115.2 15,979.1
Taxes less Subsidies on Products (335.5) (337.1) (231.3)
Gross Domestic Product 21,663.6 17,778.0 15,747.7
Per Capita at Current Prices (BND) 52,748.0 42,684.3 37,257.0
By Sector at Current Prices (% Share)
Oil and Gas Sector 63.3 55.9 51.8
Non Oil and Gas Sector 36.7 44.1 48.2
Government Sector 14.2 16.8 18.3
Private Sector 22.5 27.3 29.8
Gross Value Added 100.0 100.0 100.0
p
9 BDKI 2016
prr
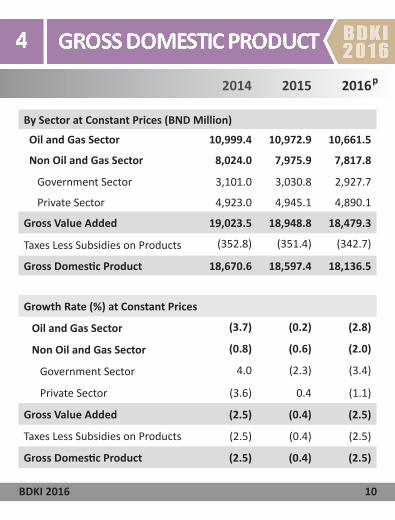
By Sector at Constant Prices (BND Million)
Oil and Gas Sector 10,999.4 10,972.9 10,661.5
Non Oil and Gas Sector 8,024.0 7,975.9 7,817.8
Government Sector 3,101.0 3,030.8 2,927.7
Private Sector 4,923.0 4,945.1 4,890.1
Gross Value Added 19,023.5 18,948.8 18,479.3
Taxes Less Subsidies on Products (352.8) (351.4) (342.7)
Gross Domestic Product 18,670.6 18,597.4 18,136.5
Growth Rate (%) at Constant Prices
Oil and Gas Sector (3.7) (0.2) (2.8)
Non Oil and Gas Sector (0.8) (0.6) (2.0)
Government Sector 4.0 (2.3) (3.4)
Private Sector (3.6) 0.4 (1.1)
Gross Value Added (2.5) (0.4) (2.5)
Taxes Less Subsidies on Products (2.5) (0.4) (2.5)
Gross Domestic Product (2.5) (0.4) (2.5)
2014 2015 2016p
10BDKI 2016
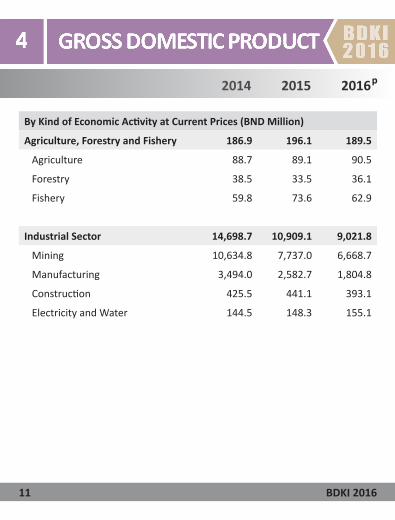
By Kind of Economic Activity at Current Prices (BND Million)
Agriculture, Forestry and Fishery 186.9 196.1 189.5
Agriculture 88.7 89.1 90.5
Forestry 38.5 33.5 36.1
Fishery 59.8 73.6 62.9
Industrial Sector 14,698.7 10,909.1 9,021.8
Mining 10,634.8 7,737.0 6,668.7
Manufacturing 3,494.0 2,582.7 1,804.8
Construction 425.5 441.1 393.1
Electricity and Water 144.5 148.3 155.1
2014 2015 2016p
11 BDKI 2016
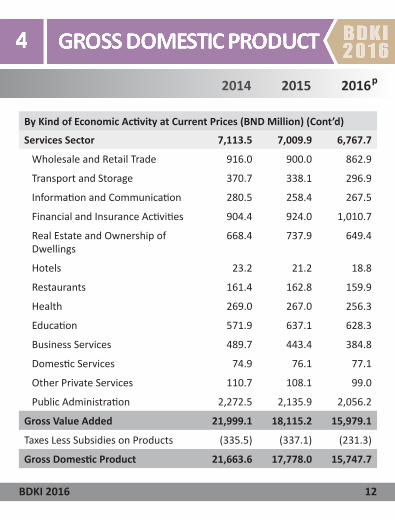
Services Sector 7,113.5 7,009.9 6,767.7
Wholesale and Retail Trade 916.0 900.0 862.9
Transport and Storage 370.7 338.1 296.9
Information and Communication 280.5 258.4 267.5
Financial and Insurance Activities 904.4 924.0 1,010.7
Real Estate and Ownership of Dwellings
668.4 737.9 649.4
Hotels 23.2 21.2 18.8
Restaurants 161.4 162.8 159.9
Health 269.0 267.0 256.3
Education 571.9 637.1 628.3
Business Services 489.7 443.4 384.8
Domestic Services 74.9 76.1 77.1
Other Private Services 110.7 108.1 99.0
Public Administration 2,272.5 2,135.9 2,056.2
Gross Value Added 21,999.1 18,115.2 15,979.1
Taxes Less Subsidies on Products (335.5) (337.1) (231.3)
Gross Domestic Product 21,663.6 17,778.0 15,747.7
2014 2015 2016p
12BDKI 2016
By Kind of Economic Activity at Current Prices (BND Million) (Cont’d)
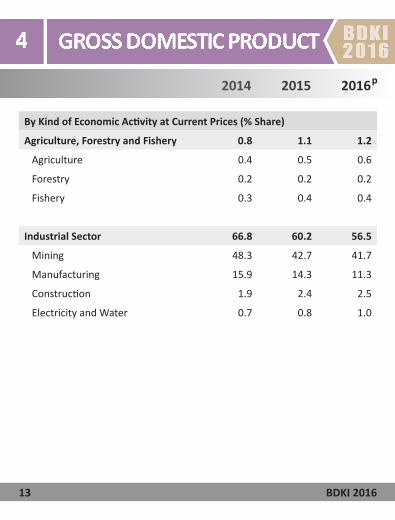
By Kind of Economic Activity at Current Prices (% Share)
Agriculture, Forestry and Fishery 0.8 1.1 1.2
Agriculture 0.4 0.5 0.6
Forestry 0.2 0.2 0.2
Fishery 0.3 0.4 0.4
Industrial Sector 66.8 60.2 56.5
Mining 48.3 42.7 41.7
Manufacturing 15.9 14.3 11.3
Construction 1.9 2.4 2.5
Electricity and Water 0.7 0.8 1.0
2014 2015 2016p
13 BDKI 2016

Services Sector 34.0 40.6 44.2
Wholesale and Retail Trade 4.2 5.0 5.4
Transport and Storage 1.7 1.9 1.9
Information and Communication 1.3 1.4 1.7
Financial and Insurance Activities 4.1 5.1 6.3
Real Estate and Ownership of Dwellings
3.0 4.1 4.1
Hotels 0.1 0.1 0.1
Restaurants 0.7 0.9 1.0
Health 1.2 1.5 1.6
Education 2.6 3.5 3.9
Business Services 2.2 2.4 2.4
Domestic Services 0.3 0.4 0.5
Other Private Services 0.5 0.6 0.6
Public Administration 10.3 11.8 12.9
Gross Value Added 100.0 100.0 100.0
2014 2015 2016p
14BDKI 2016
By Kind of Economic Activity at Current Prices (% Share) (Cont’d)

By Kind of Economic Activity at Constant Prices (BND Million)
Agriculture, Forestry and Fishery 149.3 158.9 153.2
Agriculture 83.3 85.1 86.0
Forestry 15.7 13.8 15.0
Fishery 50.4 60.0 52.2
Industrial Sector 11,790.0 11,786.0 11,439.2
Mining 8,537.3 8,444.4 8,140.0
Manufacturing 2,670.5 2,734.6 2,715.0
Construction 434.0 454.7 424.5
Electricity and Water 148.3 152.4 159.6
2014 2015 2016p
15 BDKI 2016

Services Sector 7,084.1 7,003.9 6,886.9
Wholesale and Retail Trade 917.0 925.2 893.0
Transport and Storage 381.0 365.5 332.3
Information and Communication 276.1 281.2 291.0
Financial and Insurance Activities 904.4 908.6 993.5
Real Estate and Ownership of Dwellings
679.0 698.7 711.9
Hotels 24.3 20.8 19.3
Restaurants 157.6 157.1 155.7
Health 268.3 264.4 257.9
Education 544.8 623.5 593.9
Business Services 487.8 443.4 387.5
Domestic Services 74.5 76.1 77.6
Other Private Services 106.8 104.1 96.0
Public Administration 2,262.5 2,135.4 2,077.1
Gross Value Added 19,023.5 18,948.8 18,479.3
Taxes Less Subsidies on Products (352.8) (351.4) (342.7)
Gross Domestic Product 18,670.6 18,597.4 18,136.5
2014 2015 2016p
16BDKI 2016
By Kind of Economic Activity at Constant Prices (BND Million) (Cont’d)

Growth Rate (%) By Kind of Economic Activity at Constant Prices
Agriculture, Forestry and Fishery 4.7 6.4 (3.6)
Agriculture 6.4 2.2 1.1
Forestry (3.8) (12.0) 8.5
Fishery 4.9 19.1 (12.9)
Industrial Sector (4.4) (0.0) (2.9)
Mining (2.6) (1.1) (3.6)
Manufacturing (6.8) 2.4 (0.7)
Construction (22.0) 4.8 (6.6)
Electricity and Water 4.5 2.8 4.8
2014 2015 2016p
17 BDKI 2016
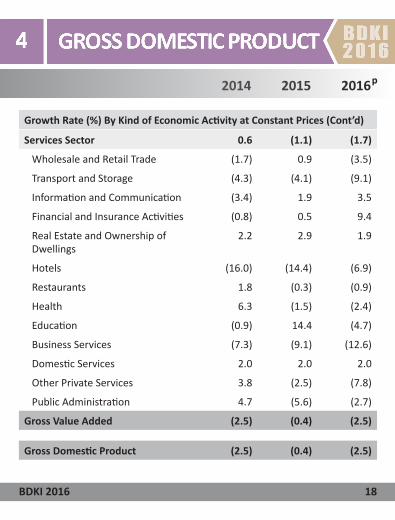
Services Sector 0.6 (1.1) (1.7)
Wholesale and Retail Trade (1.7) 0.9 (3.5)
Transport and Storage (4.3) (4.1) (9.1)
Information and Communication (3.4) 1.9 3.5
Financial and Insurance Activities (0.8) 0.5 9.4
Real Estate and Ownership of Dwellings
2.2 2.9 1.9
Hotels (16.0) (14.4) (6.9)
Restaurants 1.8 (0.3) (0.9)
Health 6.3 (1.5) (2.4)
Education (0.9) 14.4 (4.7)
Business Services (7.3) (9.1) (12.6)
Domestic Services 2.0 2.0 2.0
Other Private Services 3.8 (2.5) (7.8)
Public Administration 4.7 (5.6) (2.7)
Gross Value Added (2.5) (0.4) (2.5)
Gross Domestic Product (2.5) (0.4) (2.5)
2014 2015 2016p
18BDKI 2016
Growth Rate (%) By Kind of Economic Activity at Constant Prices (Cont’d)

GDP by Type of Expenditureat Current Prices (BND Million)
21,663.6 17,778.0 15,747.7
Household Final Consumption Expenditure
3,359.8 3,517.5 3,330.7
Government Final Consumption Expenditure
4,639.8 4,455.5 4,129.6
Gross Capital Formation 5,944.9 6,266.3 5,451.9
Gross Fixed Capital Formation 5,909.5 6,227.3 5,412.3
Private 4,475.3 5,070.6 4,383.0
Government 1,434.2 1,156.7 1,029.2
Change in Inventories 35.4 39.0 39.7
Exports of Goods and Services 14,769.6 9,282.4 7,807.4
Less: Imports of Goods and Services 7,418.5 6,699.3 5,943.5
Statistical Discrepancy 367.9 955.7 971.7
2014 2015 2016p
19 BDKI 2016

GDP Share (%) by Type of Expenditure at Current Prices
100.0 100.0 100.0
Household Final Consumption Expenditure
15.5 19.8 21.2
Government Final Consumption Expenditure
21.4 25.1 26.2
Gross Capital Formation 27.4 35.2 34.6
Gross Fixed Capital Formation 27.3 35.0 34.4
Private 20.7 28.5 27.8
Government 6.6 6.5 6.5
Change in Inventories 0.2 0.2 0.3
Exports of Goods and Services 68.2 52.2 49.6
Less: Imports of Goods and Services 34.2 37.7 37.7
Statistical Discrepancy 1.7 5.4 6.2
2014 2015 2016p
20BDKI 2016

GDP by Type of Expenditureat Constant Prices (BND Million)
18,670.6 18,595.0 18,136.5
Household Final Consumption Expenditure
3,215.8 3,383.9 3,339.3
Government Final Consumption Expenditure
4,620.0 4,454.5 4,166.7
Gross Capital Formation 6,022.1 6,416.6 5,704.7
Gross Fixed Capital Formation 5,986.3 6,376.9 5,664.1
Private 4,529.8 5,186.4 4,574.0
Government 1,456.6 1,190.5 1,090.1
Change in Inventories 35.7 39.7 40.6
Exports of Goods and Services 11,655.1 10,495.6 10,297.1
Less: Imports of Goods and Services 7,444.3 6,780.3 6,047.8
Statistical Discrepancy 602.0 627.1 676.5
2014 2015 2016p
21 BDKI 2016
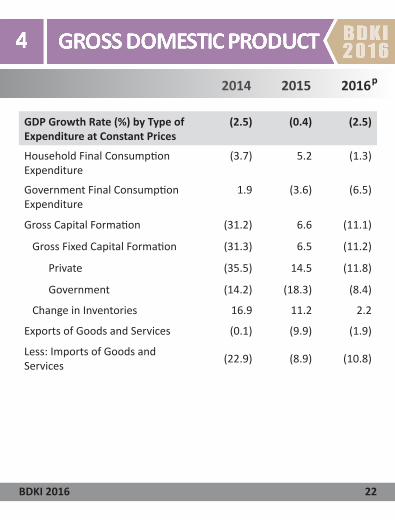
GDP Growth Rate (%) by Type of Expenditure at Constant Prices
(2.5) (0.4) (2.5)
Household Final Consumption Expenditure
(3.7) 5.2 (1.3)
Government Final Consumption Expenditure
1.9 (3.6) (6.5)
Gross Capital Formation (31.2) 6.6 (11.1)
Gross Fixed Capital Formation (31.3) 6.5 (11.2)
Private (35.5) 14.5 (11.8)
Government (14.2) (18.3) (8.4)
Change in Inventories 16.9 11.2 2.2
Exports of Goods and Services (0.1) (9.9) (1.9)
Less: Imports of Goods and Services (22.9) (8.9) (10.8)
2014 2015 2016p
22BDKI 2016
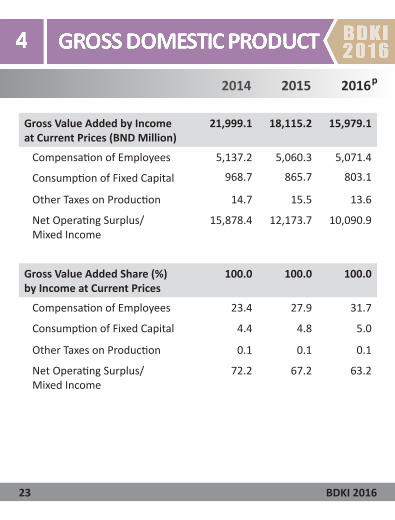
Gross Value Added by Incomeat Current Prices (BND Million)
21,999.1 18,115.2 15,979.1
Compensation of Employees 5,137.2 5,060.3 5,071.4
Consumption of Fixed Capital 968.7 865.7 803.1
Other Taxes on Production 14.7 15.5 13.6
Net Operating Surplus/ Mixed Income
15,878.4 12,173.7 10,090.9
Gross Value Added Share (%) by Income at Current Prices
100.0 100.0 100.0
Compensation of Employees 23.4 27.9 31.7
Consumption of Fixed Capital 4.4 4.8 5.0
Other Taxes on Production 0.1 0.1 0.1
Net Operating Surplus/ Mixed Income
72.2 67.2 63.2
2014 2015 2016p
23 BDKI 2016

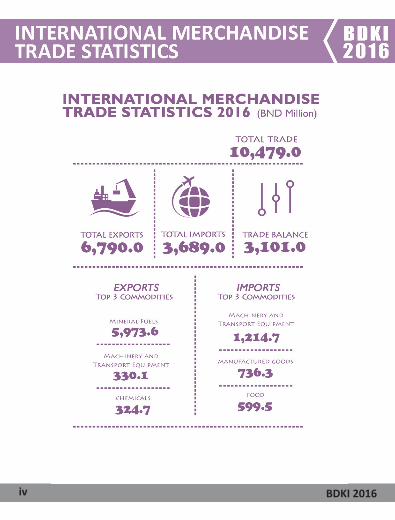
INTERNATIONAL MERCHANDISE TRADE STATISTICS (BND Million)
Exports f.o.b. 13,438.0 8,714.8 6,790.0
Imports c.i.f. 4,556.1 4,447.5 3,689.0
Total Trade 17,994.1 13,162.3 10,479.0
Trade Balance 8,881.9 4,267.3 3,101.0
Annual Change (%)
Exports f.o.b. (6.1) (35.1) (22.1)
Imports c.i.f. 0.8 (2.4) (17.1)
2014 2015 2016
24BDKI 2016

Exports by Commodity Section (BND Million)
Food 39.4 7.0 8.6
Beverages and Tobacco 12.7 2.7 2.4
Crude Materials Inedible 17.8 12.8 23.8
Mineral Fuels 12,432.1 8,102.9 5,973.6
Animal and Vegetable Oils and Fats
0.0 0.1 0.1
Chemicals 601.7 189.3 324.7
Manufactured Goods 67.9 73.5 51.8
Machinery and Transport Equipments
188.7 249.4 330.1
Miscellaneous Manufactured Articles
59.2 65.8 62.8
Miscellaneous Transactions 18.6 11.3 12.0
Total 13,438.0 8,714.8 6,790.0
2014 2015 2016
25 BDKI 2016
2014 2015 2016
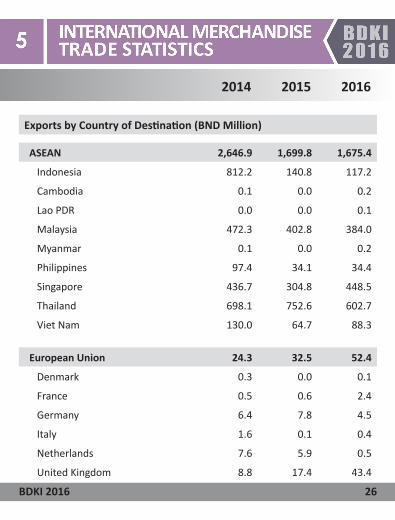
ASEAN 2,646.9 1,699.8 1,675.4
Indonesia 812.2 140.8 117.2
Cambodia 0.1 0.0 0.2
Lao PDR 0.0 0.0 0.1
Malaysia 472.3 402.8 384.0
Myanmar 0.1 0.0 0.2
Philippines 97.4 34.1 34.4
Singapore 436.7 304.8 448.5
Thailand 698.1 752.6 602.7
Viet Nam 130.0 64.7 88.3
European Union 24.3 32.5 52.4
Denmark 0.3 0.0 0.1
France 0.5 0.6 2.4
Germany 6.4 7.8 4.5
Italy 1.6 0.1 0.4
Netherlands 7.6 5.9 0.5
United Kingdom 8.8 17.4 43.4
Exports by Country of Destination (BND Million)
26BDKI 2016
2014 2015 2016
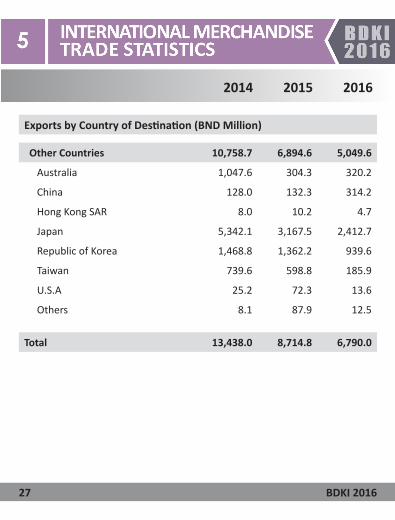
Other Countries 10,758.7 6,894.6 5,049.6
Australia 1,047.6 304.3 320.2
China 128.0 132.3 314.2
Hong Kong SAR 8.0 10.2 4.7
Japan 5,342.1 3,167.5 2,412.7
Republic of Korea 1,468.8 1,362.2 939.6
Taiwan 739.6 598.8 185.9
U.S.A 25.2 72.3 13.6
Others 8.1 87.9 12.5
Total 13,438.0 8,714.8 6,790.0
Exports by Country of Destination (BND Million)
27 BDKI 2016
2014 2015 2016
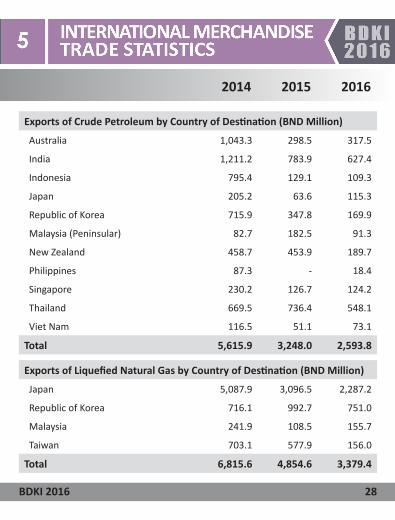
Exports of Crude Petroleum by Country of Destination (BND Million)
Australia 1,043.3 298.5 317.5
India 1,211.2 783.9 627.4
Indonesia 795.4 129.1 109.3
Japan 205.2 63.6 115.3
Republic of Korea 715.9 347.8 169.9
Malaysia (Peninsular) 82.7 182.5 91.3
New Zealand 458.7 453.9 189.7
Philippines 87.3 - 18.4
Singapore 230.2 126.7 124.2
Thailand 669.5 736.4 548.1
Viet Nam 116.5 51.1 73.1
Total 5,615.9 3,248.0 2,593.8
Exports of Liquefied Natural Gas by Country of Destination (BND Million)
Japan 5,087.9 3,096.5 2,287.2
Republic of Korea 716.1 992.7 751.0
Malaysia 241.9 108.5 155.7
Taiwan 703.1 577.9 156.0
Total 6,815.6 4,854.6 3,379.4
28BDKI 2016
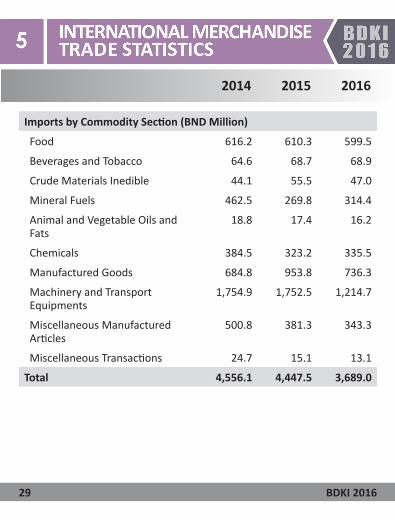
Imports by Commodity Section (BND Million)
Food 616.2 610.3 599.5
Beverages and Tobacco 64.6 68.7 68.9
Crude Materials Inedible 44.1 55.5 47.0
Mineral Fuels 462.5 269.8 314.4
Animal and Vegetable Oils and Fats
18.8 17.4 16.2
Chemicals 384.5 323.2 335.5
Manufactured Goods 684.8 953.8 736.3
Machinery and Transport Equipments
1,754.9 1,752.5 1,214.7
Miscellaneous Manufactured Articles
500.8 381.3 343.3
Miscellaneous Transactions 24.7 15.1 13.1
Total 4,556.1 4,447.5 3,689.0
2014 2015 2016
29 BDKI 2016
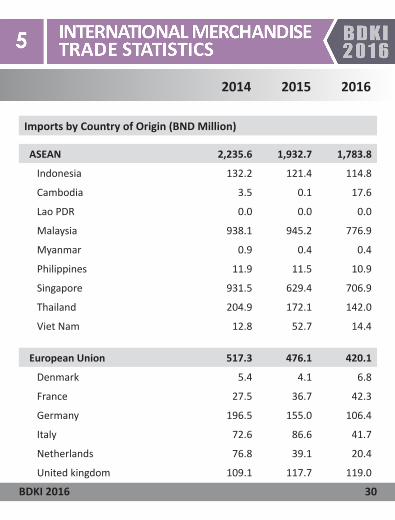
2014 2015 2016
ASEAN 2,235.6 1,932.7 1,783.8
Indonesia 132.2 121.4 114.8
Cambodia 3.5 0.1 17.6
Lao PDR 0.0 0.0 0.0
Malaysia 938.1 945.2 776.9
Myanmar 0.9 0.4 0.4
Philippines 11.9 11.5 10.9
Singapore 931.5 629.4 706.9
Thailand 204.9 172.1 142.0
Viet Nam 12.8 52.7 14.4
European Union 517.3 476.1 420.1
Denmark 5.4 4.1 6.8
France 27.5 36.7 42.3
Germany 196.5 155.0 106.4
Italy 72.6 86.6 41.7
Netherlands 76.8 39.1 20.4
United kingdom 109.1 117.7 119.0
Imports by Country of Origin (BND Million)
30BDKI 2016
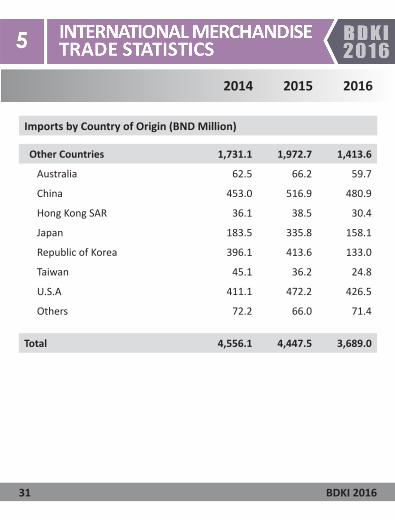
2014 2015 2016
Other Countries 1,731.1 1,972.7 1,413.6
Australia 62.5 66.2 59.7
China 453.0 516.9 480.9
Hong Kong SAR 36.1 38.5 30.4
Japan 183.5 335.8 158.1
Republic of Korea 396.1 413.6 133.0
Taiwan 45.1 36.2 24.8
U.S.A 411.1 472.2 426.5
Others 72.2 66.0 71.4
Total 4,556.1 4,447.5 3,689.0
Imports by Country of Origin (BND Million)
31 BDKI 2016
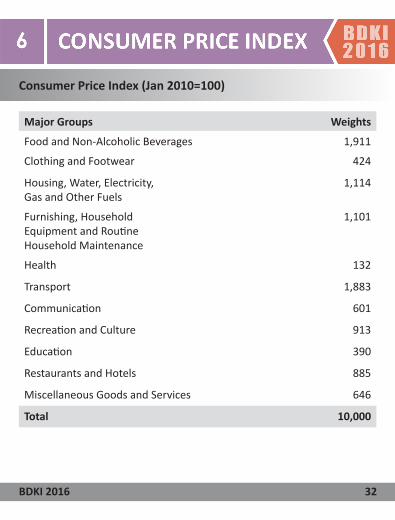
Consumer Price Index (Jan 2010=100)
Major Groups Weights
Food and Non-Alcoholic Beverages 1,911
Clothing and Footwear 424
Housing, Water, Electricity, Gas and Other Fuels
1,114
Furnishing, Household Equipment and Routine Household Maintenance
1,101
Health 132
Transport 1,883
Communication 601
Recreation and Culture 913
Education 390
Restaurants and Hotels 885
Miscellaneous Goods and Services 646
Total 10,000
32BDKI 2016
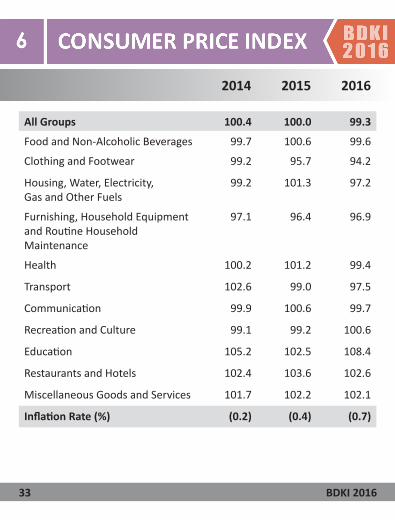
2014 2015 2016
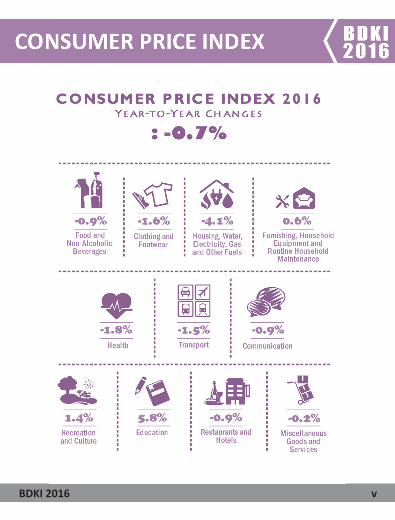
All Groups 100.4 100.0 99.3
Food and Non-Alcoholic Beverages 99.7 100.6 99.6
Clothing and Footwear 99.2 95.7 94.2
Housing, Water, Electricity, Gas and Other Fuels
99.2 101.3 97.2
Furnishing, Household Equipment and Routine Household Maintenance
97.1 96.4 96.9
Health 100.2 101.2 99.4
Transport 102.6 99.0 97.5
Communication 99.9 100.6 99.7
Recreation and Culture 99.1 99.2 100.6
Education 105.2 102.5 108.4
Restaurants and Hotels 102.4 103.6 102.6
Miscellaneous Goods and Services 101.7 102.2 102.1
Inflation Rate (%) (0.2) (0.4) (0.7)
33 BDKI 2016
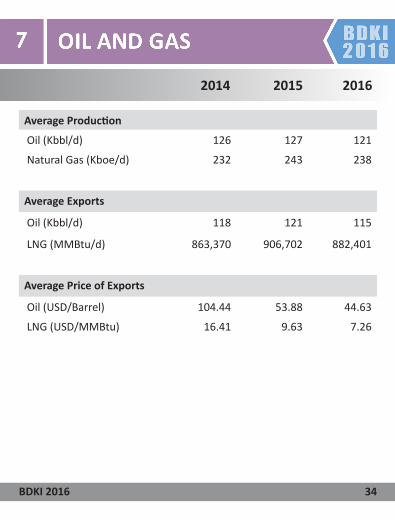
Average Production
Oil (Kbbl/d) 126 127 121
Natural Gas (Kboe/d) 232 243 238
Average Exports
Oil (Kbbl/d) 118 121 115
LNG (MMBtu/d) 863,370 906,702 882,401
Average Price of Exports
Oil (USD/Barrel) 104.44 53.88 44.63
LNG (USD/MMBtu) 16.41 9.63 7.26
2014 2015 2016
34BDKI 2016
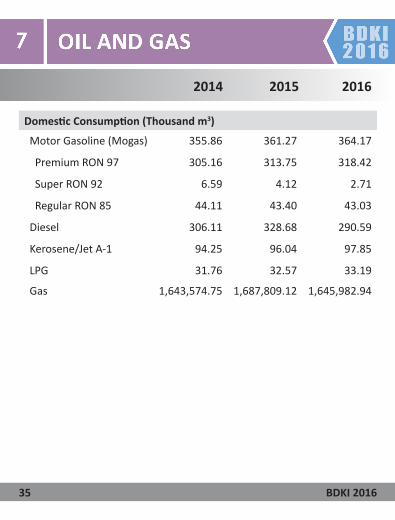
Domestic Consumption (Thousand m3)
Motor Gasoline (Mogas) 355.86 361.27 364.17
Premium RON 97 305.16 313.75 318.42
Super RON 92 6.59 4.12 2.71
Regular RON 85 44.11 43.40 43.03
Diesel 306.11 328.68 290.59
Kerosene/Jet A-1 94.25 96.04 97.85
LPG 31.76 32.57 33.19
Gas 1,643,574.75 1,687,809.12 1,645,982.94
2014 2015 2016
35 BDKI 2016
2014 2015 2016
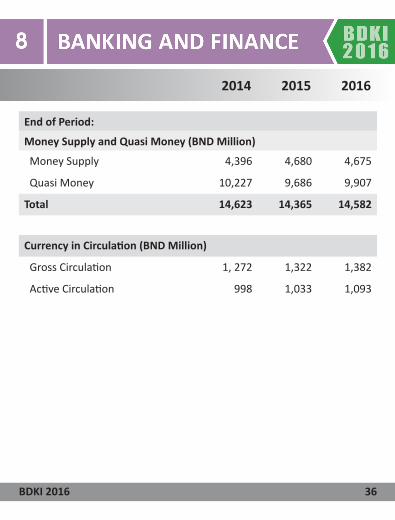
End of Period:
Money Supply and Quasi Money (BND Million)
Money Supply 4,396 4,680 4,675
Quasi Money 10,227 9,686 9,907
Total 14,623 14,365 14,582
Currency in Circulation (BND Million)
Gross Circulation 1, 272 1,322 1,382
Active Circulation 998 1,033 1,093
36BDKI 2016
2014 2015 2016
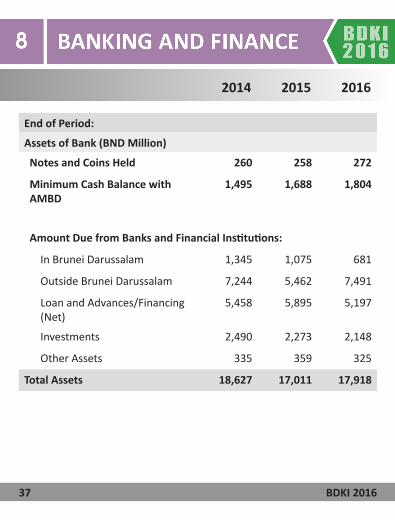
End of Period:
Assets of Bank (BND Million)
Notes and Coins Held 260 258 272
Minimum Cash Balance with AMBD
1,495 1,688 1,804
Amount Due from Banks and Financial Institutions:
In Brunei Darussalam 1,345 1,075 681
Outside Brunei Darussalam 7,244 5,462 7,491
Loan and Advances/Financing (Net)
5,458 5,895 5,197
Investments 2,490 2,273 2,148
Other Assets 335 359 325
Total Assets 18,627 17,011 17,918
37 BDKI 2016

2014 2015 2016
End of Period:
Liabilities of Bank (BND Million)
Deposits (Non-bank Customers):
Demand 3,975 4,155 3,945
Savings 4,264 4,180 3,928
Time 7,257 5,500 6,921
Others 123 122 102
Amount Due to Banks:
In Brunei Darussalam 351 243 149
Outside Brunei Darussalam 153 254 137
Other (Capital Funds and Other Liabilities)
2,505 2,557 2,737
Total Liabilities 18,627 17,011 17,918
38BDKI 2016
2014 2015 2016
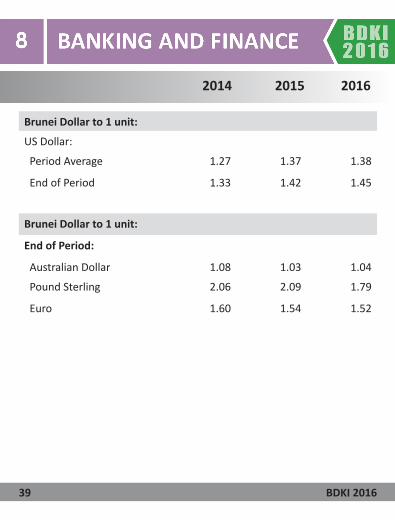
Brunei Dollar to 1 unit:
US Dollar:
Period Average 1.27 1.37 1.38
End of Period 1.33 1.42 1.45
Brunei Dollar to 1 unit:
End of Period:
Australian Dollar 1.08 1.03 1.04
Pound Sterling 2.06 2.09 1.79
Euro 1.60 1.54 1.52
39 BDKI 2016

2014 2015 2016
Brunei Dollar to 100 units:
End of Period:
Malaysian Ringgit 37.81 32.96 32.23
Hongkong Dollar 17.08 18.30 18.66
Indonesian Rupiah 0.01 0.01 0.01
Japanese Yen 1.11 1.18 1.24
Philippine Peso 2.96 3.03 2.92
Saudi Riyal 35.27 37.79 38.58
Swiss Franc 133.28 141.55 141.84
Thai Baht 4.03 3.94 4.04
40BDKI 2016
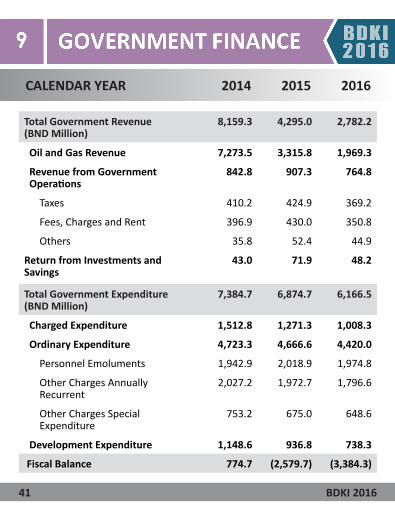
Total Government Revenue (BND Million)
8,159.3 4,295.0 2,782.2
Oil and Gas Revenue 7,273.5 3,315.8 1,969.3
Revenue from Government Operations
842.8 907.3 764.8
Taxes 410.2 424.9 369.2
Fees, Charges and Rent 396.9 430.0 350.8
Others 35.8 52.4 44.9
Return from Investments and Savings
43.0 71.9 48.2
Total Government Expenditure (BND Million)
7,384.7 6,874.7 6,166.5
Charged Expenditure 1,512.8 1,271.3 1,008.3
Ordinary Expenditure 4,723.3 4,666.6 4,420.0
Personnel Emoluments 1,942.9 2,018.9 1,974.8
Other Charges Annually Recurrent
2,027.2 1,972.7 1,796.6
Other Charges Special Expenditure
753.2 675.0 648.6
Development Expenditure 1,148.6 936.8 738.3
Fiscal Balance 774.7 (2,579.7) (3,384.3)
2014 2015 2016 CALENDAR YEAR
41 BDKI 2016
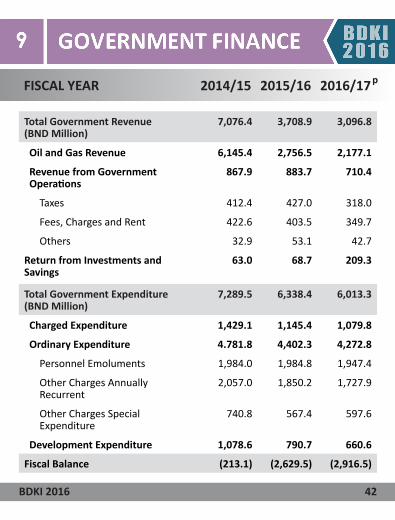
Total Government Revenue (BND Million)
7,076.4 3,708.9 3,096.8
Oil and Gas Revenue 6,145.4 2,756.5 2,177.1
Revenue from Government Operations
867.9 883.7 710.4
Taxes 412.4 427.0 318.0
Fees, Charges and Rent 422.6 403.5 349.7
Others 32.9 53.1 42.7
Return from Investments andSavings
63.0 68.7 209.3
Total Government Expenditure (BND Million)
7,289.5 6,338.4 6,013.3
Charged Expenditure 1,429.1 1,145.4 1,079.8
Ordinary Expenditure 4.781.8 4,402.3 4,272.8
Personnel Emoluments 1,984.0 1,984.8 1,947.4
Other Charges Annually Recurrent
2,057.0 1,850.2 1,727.9
Other Charges Special Expenditure
740.8 567.4 597.6
Development Expenditure 1,078.6 790.7 660.6
Fiscal Balance (213.1) (2,629.5) (2,916.5)
2014/15 2015/16 2016/17 FISCAL YEAR p
42BDKI 2016
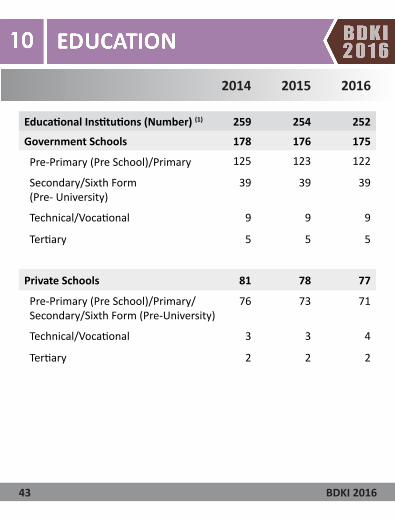
2014 2015 2016
Educational Institutions (Number) (1) 259 254 252
Government Schools 178 176 175
Pre-Primary (Pre School)/Primary 125 123 122
Secondary/Sixth Form (Pre- University)
39 39 39
Technical/Vocational 9 9 9
Tertiary 5 5 5
Private Schools 81 78 77
Pre-Primary (Pre School)/Primary/ Secondary/Sixth Form (Pre-University)
76 73 71
Technical/Vocational 3 3 4
Tertiary 2 2 2
43 BDKI 2016
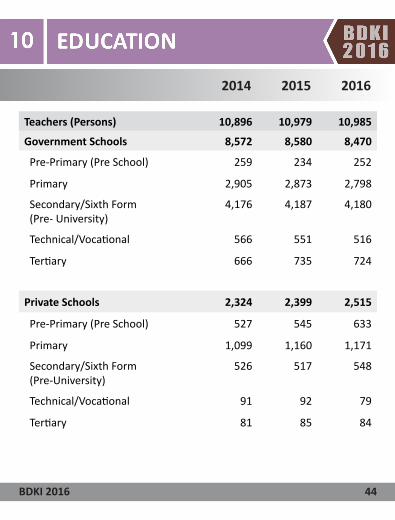
2014 2015 2016
Teachers (Persons) 10,896 10,979 10,985
Government Schools 8,572 8,580 8,470
Pre-Primary (Pre School) 259 234 252
Primary 2,905 2,873 2,798
Secondary/Sixth Form (Pre- University)
4,176 4,187 4,180
Technical/Vocational 566 551 516
Tertiary 666 735 724
Private Schools 2,324 2,399 2,515
Pre-Primary (Pre School) 527 545 633
Primary 1,099 1,160 1,171
Secondary/Sixth Form (Pre-University)
526 517 548
Technical/Vocational 91 92 79
Tertiary 81 85 84
44BDKI 2016
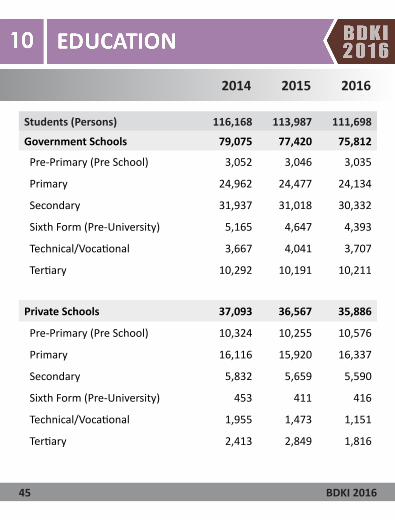
2014 2015 2016
Students (Persons) 116,168 113,987 111,698
Government Schools 79,075 77,420 75,812
Pre-Primary (Pre School) 3,052 3,046 3,035
Primary 24,962 24,477 24,134
Secondary 31,937 31,018 30,332
Sixth Form (Pre-University) 5,165 4,647 4,393
Technical/Vocational 3,667 4,041 3,707
Tertiary 10,292 10,191 10,211
Private Schools 37,093 36,567 35,886
Pre-Primary (Pre School) 10,324 10,255 10,576
Primary 16,116 15,920 16,337
Secondary 5,832 5,659 5,590
Sixth Form (Pre-University) 453 411 416
Technical/Vocational 1,955 1,473 1,151
Tertiary 2,413 2,849 1,816
45 BDKI 2016
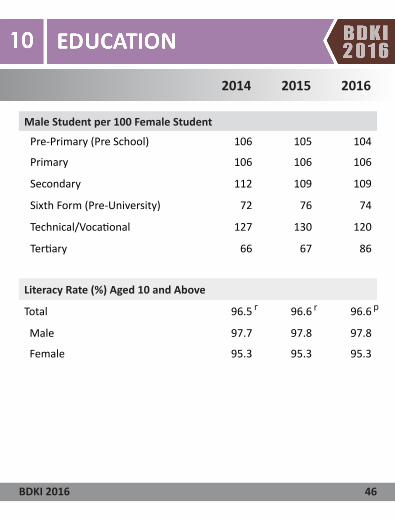
2014 2015 2016
Male Student per 100 Female Student
Pre-Primary (Pre School) 106 105 104
Primary 106 106 106
Secondary 112 109 109
Sixth Form (Pre-University) 72 76 74
Technical/Vocational 127 130 120
Tertiary 66 67 86
Literacy Rate (%) Aged 10 and Above
Total 96.5 96.6 96.6
Male 97.7 97.8 97.8
Female 95.3 95.3 95.3
p
46BDKI 2016
r r
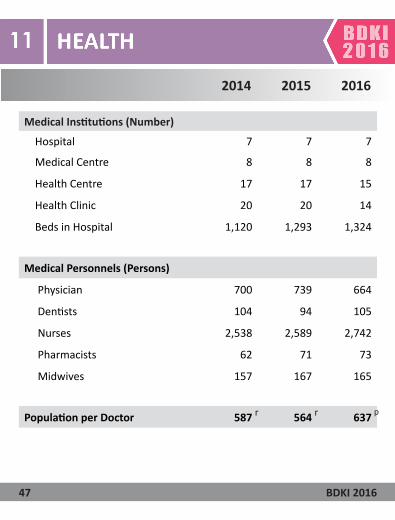
2014 2015 2016
Medical Institutions (Number)
Hospital 7 7 7
Medical Centre 8 8 8
Health Centre 17 17 15
Health Clinic 20 20 14
Beds in Hospital 1,120 1,293 1,324
Medical Personnels (Persons)
Physician 700 739 664
Dentists 104 94 105
Nurses 2,538 2,589 2,742
Pharmacists 62 71 73
Midwives 157 167 165
Population per Doctor 587 564 637
47 BDKI 2016
r r p

2014 2015 2016
Leading Causes of Deaths 1,470 1,547 1,632
Cancer 300 312 353
Heart Diseases (Including Acute Rheumatic Fever)
227 193 211
Diabetes Mellitus 141 147 149
Cerebrovascular Diseases 104 102 123
Influenza and Pneumonia 48 75 82
Hypertensive Diseases 64 54 72
Septicaemia 42 51 61
Bronchitis, Chronic and Unspecified Emphysema and Asthma
63 44 38
Certain Conditions Originating in the Perinatal Period
24 27 29
Other Diseases 457 542 514
48BDKI 2016
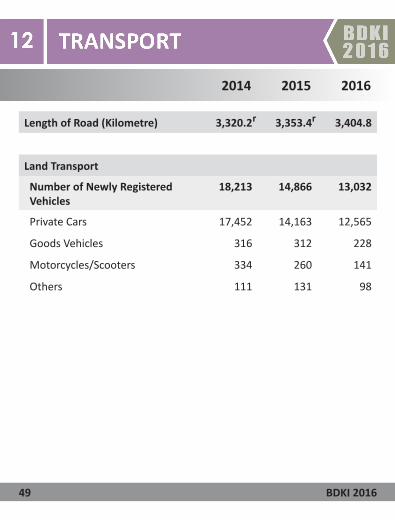
2014 2015 2016
Length of Road (Kilometre) 3,320.2 3,353.4 3,404.8
Land Transport
Number of Newly Registered Vehicles
18,213 14,866 13,032
Private Cars 17,452 14,163 12,565
Goods Vehicles 316 312 228
Motorcycles/Scooters 334 260 141
Others 111 131 98
49 BDKI 2016
r r
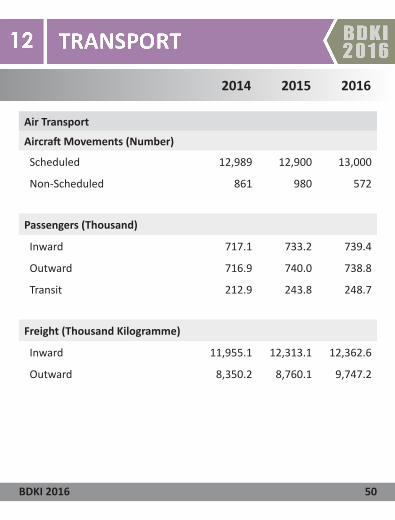
2014 2015 2016
Air Transport
Aircraft Movements (Number)
Scheduled 12,989 12,900 13,000
Non-Scheduled 861 980 572
Passengers (Thousand)
Inward 717.1 733.2 739.4
Outward 716.9 740.0 738.8
Transit 212.9 243.8 248.7
Freight (Thousand Kilogramme)
Inward 11,955.1 12,313.1 12,362.6
Outward 8,350.2 8,760.1 9,747.2
50BDKI 2016
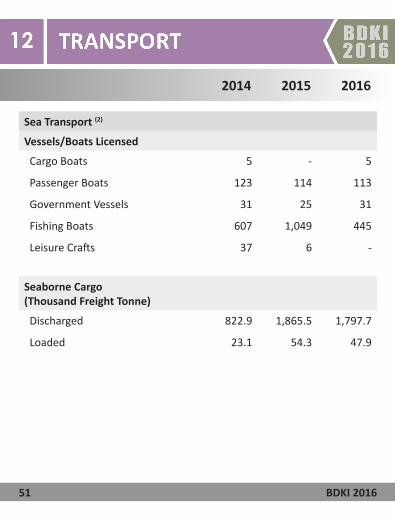
2014 2015 2016
Sea Transport (2)
Vessels/Boats Licensed
Cargo Boats 5 - 5
Passenger Boats 123 114 113
Government Vessels 31 25 31
Fishing Boats 607 1,049 445
Leisure Crafts 37 6 -
Seaborne Cargo (Thousand Freight Tonne)
Discharged 822.9 1,865.5 1,797.7
Loaded 23.1 54.3 47.9
51 BDKI 2016
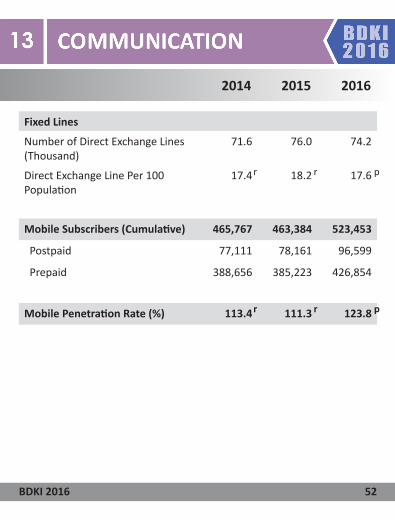
2014 2015 2016
Fixed Lines
Number of Direct Exchange Lines (Thousand)
71.6 76.0 74.2
Direct Exchange Line Per 100 Population
17.4 18.2 17.6
Mobile Subscribers (Cumulative) 465,767 463,384 523,453
Postpaid 77,111 78,161 96,599
Prepaid 388,656 385,223 426,854
Mobile Penetration Rate (%) 113.4 111.3 123.8
52BDKI 2016
r r p
prr

2014 2015 2016
Internet Subscribers (Number) (3) 417,605 440,416 541,843
Fixed Broadband 30,259 33,803 36,120
Mobile Broadband 387,346 406,613 505,723
Internet Penetration Rate (%)
Fixed Broadband 7.4 8.1 8.5
Mobile Broadband 94.3 97.6 119.6
Postal
Post Office (Number) (4) 26 26 23
Postal Services (Pieces)
Letter Mails 7,281,242 7,066,158 7,505,241
Printed Matters 365,175 332,350 280,404
Postcards 24,324 34,820 29,112
Registered Articles 166,126 173,511 182,707
Parcels, Small Packets and Others 304,958 288,688 334,288
53 BDKI 2016
r
r r
p
p
r
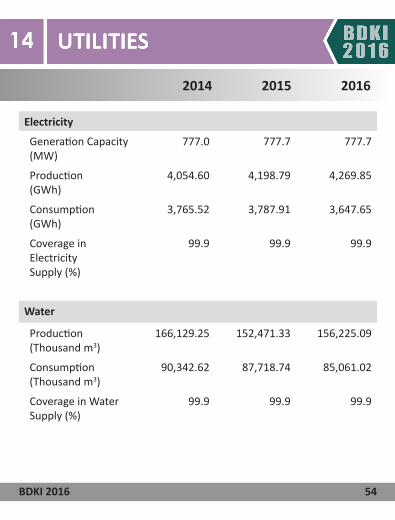
2014 2015 2016
Electricity
Generation Capacity (MW)
777.0 777.7 777.7
Production (GWh)
4,054.60 4,198.79 4,269.85
Consumption (GWh)
3,765.52 3,787.91 3,647.65
Coverage in Electricity Supply (%)
99.9 99.9 99.9
Water
Production (Thousand m3)
166,129.25 152,471.33 156,225.09
Consumption (Thousand m3)
90,342.62 87,718.74 85,061.02
Coverage in Water Supply (%)
99.9 99.9 99.9
54BDKI 2016
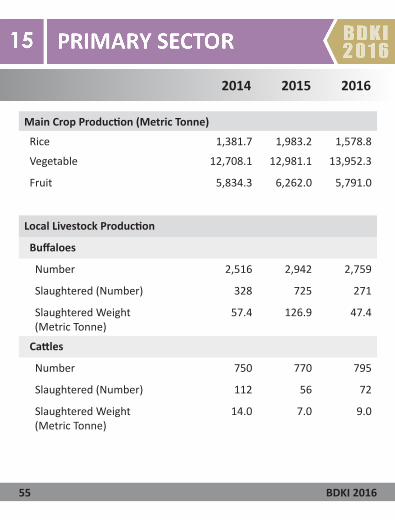
Main Crop Production (Metric Tonne)
Rice 1,381.7 1,983.2 1,578.8
Vegetable 12,708.1 12,981.1 13,952.3
Fruit 5,834.3 6,262.0 5,791.0
Local Livestock Production
Buffaloes
Number 2,516 2,942 2,759
Slaughtered (Number) 328 725 271
Slaughtered Weight (Metric Tonne)
57.4 126.9 47.4
Cattles
Number 750 770 795
Slaughtered (Number) 112 56 72
Slaughtered Weight (Metric Tonne)
14.0 7.0 9.0
2014 2015 2016
55 BDKI 2016
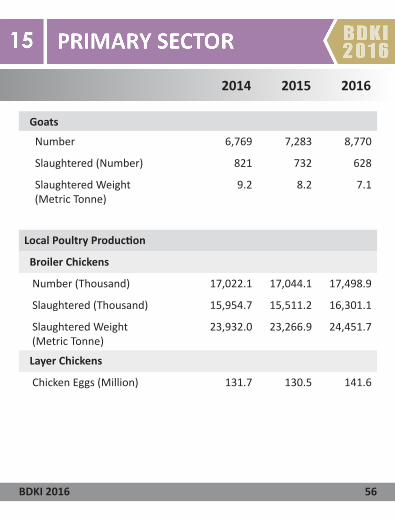
Goats
Number 6,769 7,283 8,770
Slaughtered (Number) 821 732 628
Slaughtered Weight (Metric Tonne)
9.2 8.2 7.1
Local Poultry Production
Broiler Chickens
Number (Thousand) 17,022.1 17,044.1 17,498.9
Slaughtered (Thousand) 15,954.7 15,511.2 16,301.1
Slaughtered Weight (Metric Tonne)
23,932.0 23,266.9 24,451.7
Layer Chickens
Chicken Eggs (Million) 131.7 130.5 141.6
2014 2015 2016
56BDKI 2016
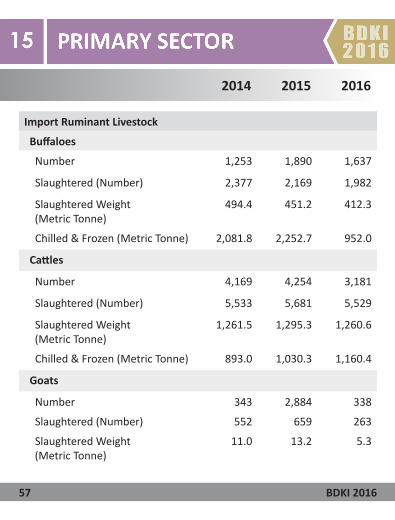
Import Ruminant Livestock
Buffaloes
Number 1,253 1,890 1,637
Slaughtered (Number) 2,377 2,169 1,982
Slaughtered Weight (Metric Tonne)
494.4 451.2 412.3
Chilled & Frozen (Metric Tonne) 2,081.8 2,252.7 952.0
Cattles
Number 4,169 4,254 3,181
Slaughtered (Number) 5,533 5,681 5,529
Slaughtered Weight (Metric Tonne)
1,261.5 1,295.3 1,260.6
Chilled & Frozen (Metric Tonne) 893.0 1,030.3 1,160.4
Goats
Number 343 2,884 338
Slaughtered (Number) 552 659 263
Slaughtered Weight (Metric Tonne)
11.0 13.2 5.3
2014 2015 2016
57 BDKI 2016
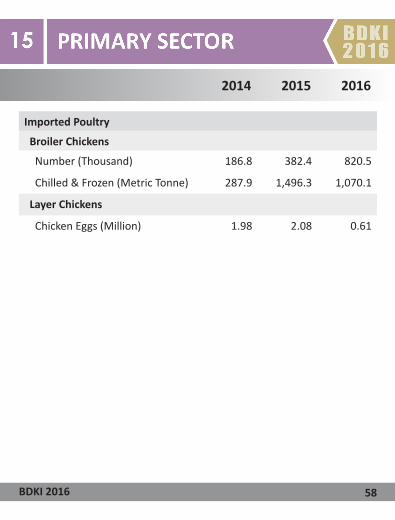
Imported Poultry
Broiler Chickens
Number (Thousand) 186.8 382.4 820.5
Chilled & Frozen (Metric Tonne) 287.9 1,496.3 1,070.1
Layer Chickens
Chicken Eggs (Million) 1.98 2.08 0.61
2014 2015 2016
58BDKI 2016

2014 2015 2016
Forestry
Production
Round Timber (Thousand m3) 104.6 73.7 69.2
Sawn Timber (Thousand m3) 44.1 37.8 41.2
Bakau Poles (Thousand Pieces) 126.4 125.8 102.5
Charcoal (Thousand Kilogramme) 5.5 162.0 494.3
59 BDKI 2016
2014 2015 2016
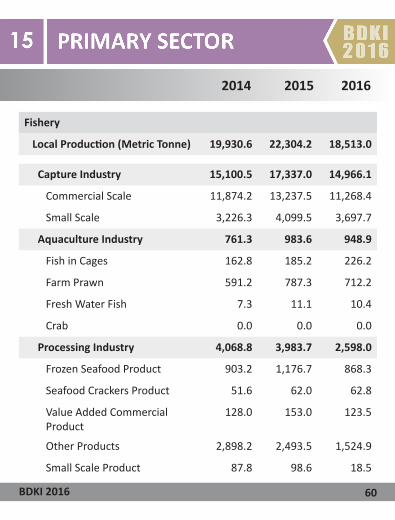
Fishery
Local Production (Metric Tonne) 19,930.6 22,304.2 18,513.0
Capture Industry 15,100.5 17,337.0 14,966.1
Commercial Scale 11,874.2 13,237.5 11,268.4
Small Scale 3,226.3 4,099.5 3,697.7
Aquaculture Industry 761.3 983.6 948.9
Fish in Cages 162.8 185.2 226.2
Farm Prawn 591.2 787.3 712.2
Fresh Water Fish 7.3 11.1 10.4
Crab 0.0 0.0 0.0
Processing Industry 4,068.8 3,983.7 2,598.0
Frozen Seafood Product 903.2 1,176.7 868.3
Seafood Crackers Product 51.6 62.0 62.8
Value Added Commercial Product
128.0 153.0 123.5
Other Products 2,898.2 2,493.5 1,524.9
Small Scale Product 87.8 98.6 18.5
60BDKI 2016

2014 2015 2016
Road Casualties (Number)
Accidents 3,366 3,345 3,375
Injuries 433 460 473
Deaths 24 36 16
Crime (Number) (5)
Total Cases 6,227 5,794 5,613
Against
Person 545 583 730
Property 3,854 3,341 2,900
Penal Code 1,263 1,308 1,457
Misuse of Drug 381 395 410
Other Enactment 184 167 116
Crime Rate per 1,000 Population 15 14 13
61 BDKI 2016
r r p

2014 2015 2016
Climate
Temperature (Degree Celcius)
Maximum (Mean) 32.9 33.0 30.7
Minimum (Mean) 23.1 24.1 25.5
Relative Humidity (%)
Maximum (Mean) 99 99 96
Minimum (Mean) 60 61 71
Total Rainfall (Millimetre) 3,173.5 3,015.8 2,182.2
Pensions
Persons Receiving Old Age Pension by District
27,496 29,186 31,273
Brunei Muara 17,006 18,159 19,484
Belait 5,600 5,935 6,352
Tutong 3,959 4,146 4,417
Temburong 931 946 1,020
62BDKI 2016
2014 2015 2016
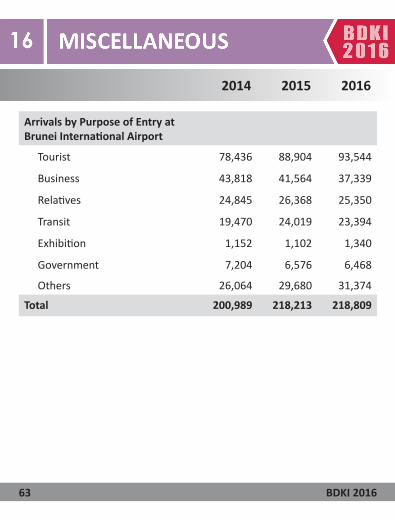
Arrivals by Purpose of Entry at Brunei International Airport
Tourist 78,436 88,904 93,544
Business 43,818 41,564 37,339
Relatives 24,845 26,368 25,350
Transit 19,470 24,019 23,394
Exhibition 1,152 1,102 1,340
Government 7,204 6,576 6,468
Others 26,064 29,680 31,374
Total 200,989 218,213 218,809
63 BDKI 2016

This Page is Intentionally Left Blank
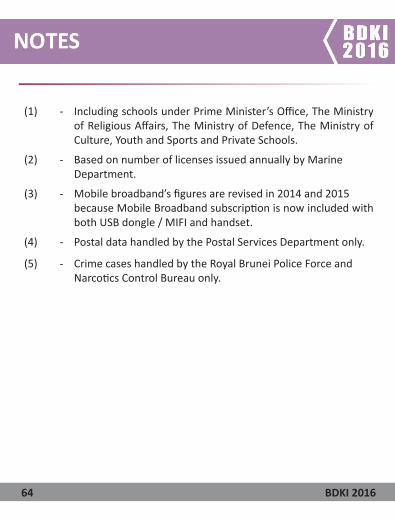
(1) - Including schools under Prime Minister’s Office, The Ministry of Religious Affairs, The Ministry of Defence, The Ministry of Culture, Youth and Sports and Private Schools.
(2) - Based on number of licenses issued annually by MarineDepartment.
(3) - Mobile broadband’s figures are revised in 2014 and 2015 because Mobile Broadband subscription is now included with both USB dongle / MIFI and handset.
(4) - Postal data handled by the Postal Services Department only.
(5) - Crime cases handled by the Royal Brunei Police Force and Narcotics Control Bureau only.
64 BDKI 2016
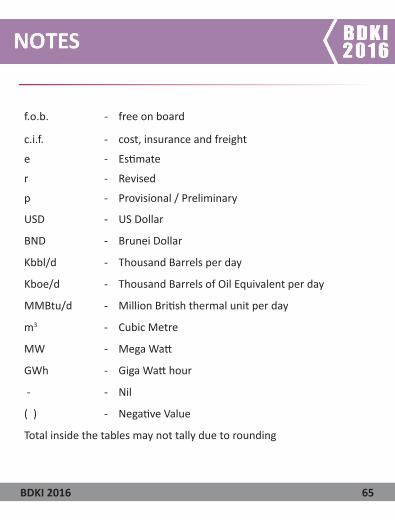
f.o.b. - free on board
c.i.f. - cost, insurance and freight
e - Estimate
r - Revised
p - Provisional / Preliminary
USD - US Dollar
BND - Brunei Dollar
Kbbl/d - Thousand Barrels per day
Kboe/d - Thousand Barrels of Oil Equivalent per day
MMBtu/d - Million British thermal unit per day
m3 - Cubic Metre
MW - Mega Watt
GWh - Giga Watt hour
- - Nil
( ) - Negative Value
Total inside the tables may not tally due to rounding
65BDKI 2016

MINISTRY DEPARTMENTS
PRIME MINISTER’S OFFICE
ATTORNEY GENERAL’S CHAMBERS
STATE JUDICIARY DEPARTMENT
PUBLIC SERVICES DEPARTMENT
ROYAL BRUNEI POLICE FORCE
ENERGY AND INDUSTRY DEPARTMENT
NARCOTICS CONTROL BUREAU
MINISTRY OF FINANCE
TREASURY DEPARTMENT
MINISTRY OF HOMEAFFAIRS
DEPARTMENT OF IMMIGRATION AND NATIONAL REGISTRATION
DISTRICT OFFICES
MINISTRY OF DEFENCE DEPARTMENT OF DEVELOPMENT AND WORK SERVICES
66 BDKI 2016
MINISTRY DEPARTMENTS
PRIME MINISTER’S OFFICE
ATTORNEY GENERAL’S CHAMBERS
STATE JUDICIARY DEPARTMENT
PUBLIC SERVICES DEPARTMENT
ROYAL BRUNEI POLICE FORCE
ENERGY AND INDUSTRY DEPARTMENT
NARCOTICS CONTROL BUREAU
MINISTRY OF FINANCE
TREASURY DEPARTMENT
MINISTRY OF HOMEAFFAIRS
DEPARTMENT OF IMMIGRATION AND NATIONAL REGISTRATION
DISTRICT OFFICES
MINISTRY OF DEFENCE DEPARTMENT OF DEVELOPMENT AND WORK SERVICES
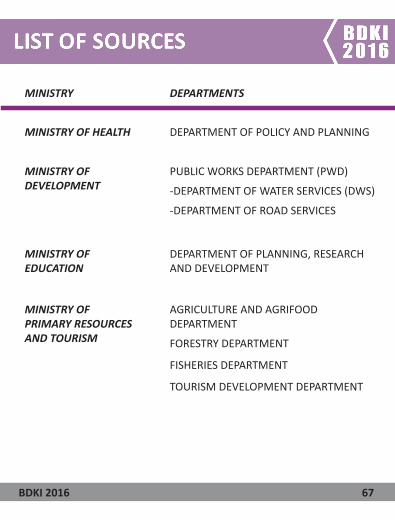
MINISTRY DEPARTMENTS
MINISTRY OF HEALTH DEPARTMENT OF POLICY AND PLANNING
MINISTRY OF DEVELOPMENT
PUBLIC WORKS DEPARTMENT (PWD)
-DEPARTMENT OF WATER SERVICES (DWS)
-DEPARTMENT OF ROAD SERVICES
MINISTRY OF EDUCATION
DEPARTMENT OF PLANNING, RESEARCH AND DEVELOPMENT
MINISTRY OF PRIMARY RESOURCES AND TOURISM
AGRICULTURE AND AGRIFOOD DEPARTMENT
FORESTRY DEPARTMENT
FISHERIES DEPARTMENT
TOURISM DEVELOPMENT DEPARTMENT
67BDKI 2016

MINISTRY DEPARTMENTS
MINISTRY OFCOMMUNICATIONS
MARINE DEPARTMENT
PORTS DEPARTMENT
CIVIL AVIATION DEPARTMENT
LAND TRANSPORT DEPARTMENT
POSTAL SERVICES DEPARTMENT
MINISTRY OF CULTURE, YOUTH AND SPORTS
COMMUNITY DEVELOPMENTDEPARTMENT
OTHER AGENCIES AUTORITI MONETARI BRUNEIDARUSSALAM (AMBD)
AUTHORITY FOR INFO-COMMUNICATIONSTECHNOLOGY INDUSTRY OF BRUNEIDARUSSALAM (AITI)
TABUNG AMANAH PEKERJA (TAP)
68 BDKI 2016
MINISTRY DEPARTMENTS
MINISTRY OFCOMMUNICATIONS
MARINE DEPARTMENT
PORTS DEPARTMENT
CIVIL AVIATION DEPARTMENT
LAND TRANSPORT DEPARTMENT
POSTAL SERVICES DEPARTMENT
MINISTRY OF CULTURE, YOUTH AND SPORTS
COMMUNITY DEVELOPMENTDEPARTMENT
OTHER AGENCIES AUTORITI MONETARI BRUNEIDARUSSALAM (AMBD)
AUTHORITY FOR INFO-COMMUNICATIONSTECHNOLOGY INDUSTRY OF BRUNEIDARUSSALAM (AITI)
TABUNG AMANAH PEKERJA (TAP)
Department of StatisticsDepartment of Economic Planning and Development (JPKE)Prime Minister’s OfficeBrunei Darussalam
69BDKI 2016