Embed Size (px)
Citation preview

Permian Basin Artificial Lift & Production Optimization CongressJanuary 2019II

IIThe More Things Change….
2
2016 – Current Crude Oil (WTI) Spot Price
This information is for illustrative purposes onlySource: EIA as of 1//2018
233%
-71%
303%
-44%
384%
690%
-71%
280%

IIRecent Oil Prices
3
2016 – Current Crude Oil (WTI) Spot Price
This information is for illustrative purposes onlySource: EIA as of 1/24/2018
??%

IIOld vs. New Price Influencers
4
2016 – Current Crude Oil (WTI) Spot Price
This information is for illustrative purposes onlySource: Instagram, Twitter, OPEC
US SHALE

II
Northern Midland: 25,000 net acresSouthern Midland: 180,000 net acres
5
Ajax Resources Management: Collective Basin & Play Experience
Powder RiverBasin
Haynesville
TGC• Yegua• Wilcox• Hackberry
S LA/Tight Wilcox
GOM ShelfEagle FordAustin ChalkBuda
Permian Basin• Wolfcamp• Spraberry• San Andres• Woodford
SCOOP/STACK
Uinta Basin• Altamont• Bluebell
Marcellus
Williston Basin
Arkoma• CBM
Resource
Conventional
Evaluated (M&A)
Gaines Dawson
MartinAndrews
Eagle Ford: 120,000 net acresHaynesville: 30,000 net acres
n Over the last several decades, Ajax Resources Management has evaluated and / or exploited nearly every primary hydrocarbon producing region in the US
o Conducted operations across 700,000 net acres over the last 10 years
n Over 70 years of cumulative Permian experience in both Midland and Delaware Basins
n Over 400 horizontal wells drilled and $7B+ in M&A evaluation ($2B+ in closed deals) in the Permian Basin
S LA Wilcox: 177,000 net acresAltamont: 181,000 net acres

Ajax Resources: A Northern Midland Basin Story
6
Andrews Martin
DawsonGainesn Ajax Resources, LLC was founded in Oct-15 following the acquisition of the Yellow Rose Field from W&T Offshore for $376 MM
n Dynamic shift in operational execution, balance sheet and production
n Diamondback acquired the Yellow Rose Field in Oct-18 for $1,245 MM, which represents:o 12.2x LQA EBITDAo ~$34,000 per net adjusted surface acre
n 8 rigs are currently running offset to the Yellow Rose Field today
Ajax
Murphy
Diamondback Pioneer
JCT
QEP
Rig
(1) Denotes completion crews for Ajax activity only.
ExL / EQ QEP
Guidon
FANG
FANG
Zarvona
C.R.

Realizing Substantial Production Growth (Net Bopd)
7
-
2,000
4,000
6,000
8,000
10,000
12,000
Oct-15 Dec-15 Feb-16 Apr-16 Jun-16 Aug-16 Oct-16 Dec-16 Feb-17 Apr-17 Jun-17 Aug-17 Oct-17 Dec-17 Feb-18 Apr-18 Jun-18 Aug-18 Oct-18
Base, W&T Ajax Initial 7 (7-10 thru EQ1) Riesling MS Riesling LS Riesling WA EQ2 Cabernet MS Cabernet LS Cabernet WA 4007LS 4008LS 4009LS 4008WA OBO
+ 47%
+ 56%
+ 75%

IIProduction Optimization is Easy…
8
Resource Development Starts and Ends with the Rock Geologic, geophysical and reservoir properties drive modeling, landing zone and completion/production practices
The solution is 3D and container math isn’t a zero sum game
Landing Zone Matters and Completions Are NOT Blanket Solutions Subtle laminations and changes across the lateral are key Designing completions should be a dynamic process, aiming to make next years P50 your current P10
Productivity Increases via Optimizing By-Bench Develop and optimize flowback procedures, workover programs, initial and long term artificial lift strategy, chemical and field wide infrastructure to support wells by location
Offset frac interference is real and should be optimized in your field-wide development plans
1
2
3

IIProduction Comes from a 3-D Container
9

IICompletions Optimization Driven by Subsurface
10
n Selected “valued” rock properties, seismic, core, etc are inputs to regression analysis and completion optimization
n Height is key, and is ultimately the driver to EUR
n Don’t be fooled by pan flashes – IP30/60/90 are great indicators, but can mislead you on completion and production optimization programs
n Parlay effect is real – the sum isn’t the additional of the parts when it comes to optimization

IIBench by Bench Flowback and Artificial Lift Optimization
11
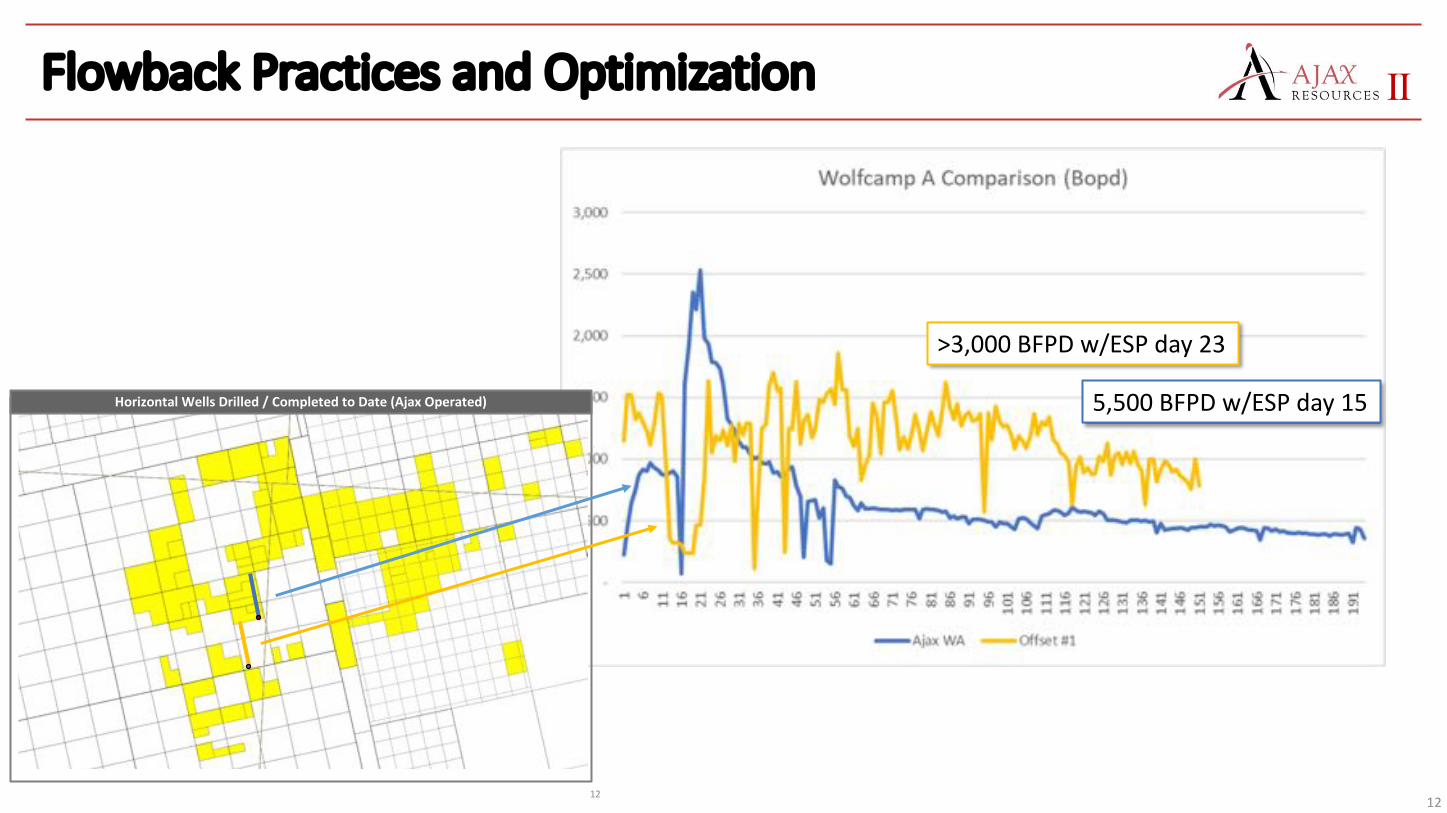
IIFlowback Practices and Optimization
12
5,500 BFPD w/ESP day 15
>3,000 BFPD w/ESP day 23
12
Horizontal Wells Drilled / Completed to Date (Ajax Operated)

IIConsistent Production Growth in Permian
13
SMB Production and Type Curve Growth NMB Production and Type Curve Growth
0
50,000
100,000
150,000
200,000
250,000
300,000
350,000
0 50 100 150 200 250 300 350 400 450 500 550 600 650 700 750 800BB
LDays
350
300
250
200
150
100
50
Cum
ulat
ive
Prod
uctio
n, M
BO
2017 / 2018 Average Well (15 Wells)
2015 / 2016 Average Well (7 Wells)
350
Cum
ulat
ive
Prod
uctio
n, M
BO
50
100
15020
16 / 2
017 A
verag
e Well
(95 W
ells)
2012 / 2013 Average Well (11 Wells)
Gaines Dawson
MartinAndrews

IIFocus on Base Production
14
Active WO Program –Optimizing Base Production
Post Deal Close
Ajax Base Production, BOPD
Base maintenance including optimization of chemicals and full life artificial lift program by bench
Base focus shift to optimize chemical and AL programs yields ~2% Decline
in Base Qo
~14% decline in Base Qo

0
1,000
2,000
3,000
4,000
Operations Update: Workover Program Economics
15
n 86 workovers have been completed in Q1 2016; $3.01 MM total expense Average of $34,098 per workover
n Base production increase of ~1,200 Boe/d
Workovers with tailored solvent/surfactant systems prove to be highest returns and production uplift
n The uplift in production added $13.8 MM in PV-10 toward legacy wells
Assumes legacy production would continue to decline from 2,257 Boe/d following WDVG decline profile, as depicted in the graph on the right
Total program payback of ~12 months; total program IRR of over 200%
Incremental Legacy Production Uplift (Gross Boe/d)
-
1,000
2,000
3,000
4,000
0
1,000
2,000
3,000
4,000 Historical Projected
Q1 2016 Q2 2016 Q3 2016 Q4 2016
Selected Workover Well Progress Report
Workover Details Production History
Well Date Cost -1 Day +1 Day +30 Days +60 DaysPinotage 7 03/16/16 $61,113 16 56 52 33
UL 6-15-10 02/16/16 $46,375 28 58 35 34
Pinot 65-8 03/17/16 $48,402 15 36 23 NA
UL 6-15-9 02/29/16 $36,924 20 30 34 29
UL 7-3-7 04/06/16 $62,242 15 39 28 NA
Average $51,011 19 +25 +16 +13

IIOFI Impacts Are Real and Usually Under-Estimated
Cabernet Well OFI Impact Riesling Well OFI Impact
1,00
0’
1,00
0’
2,00
0’
3,00
0’
2,00
0’
3,00
0’
1,00
0’
1,00
0’
2,00
0’
3,00
0’
2,00
0’
3,00
0’
1,00
0’
1,00
0’
2,00
0’
3,00
0’
2,00
0’
3,00
0’
1,00
0’
1,00
0’
2,00
0’
3,00
0’
2,00
0’
3,00
0’
1,000’ Away from Frac’d Wells 2,000’ Away from Frac’d Wells 3,000’ Away from Frac’d Wells Wells knocked 100% offline by Frac
n Vertical wells are good indicators to establish baseline modeling for OFI
n Depending on natural fracture network and orientation, OFI can impact wells over 1 mile away
n Timing of wells returning to production forecasts vary, but are highly dependent upon parent well BHP
n Deals miss OFI impacts consistently, and cause for cashflow and project returns to be overstated
OFI Impact Findings
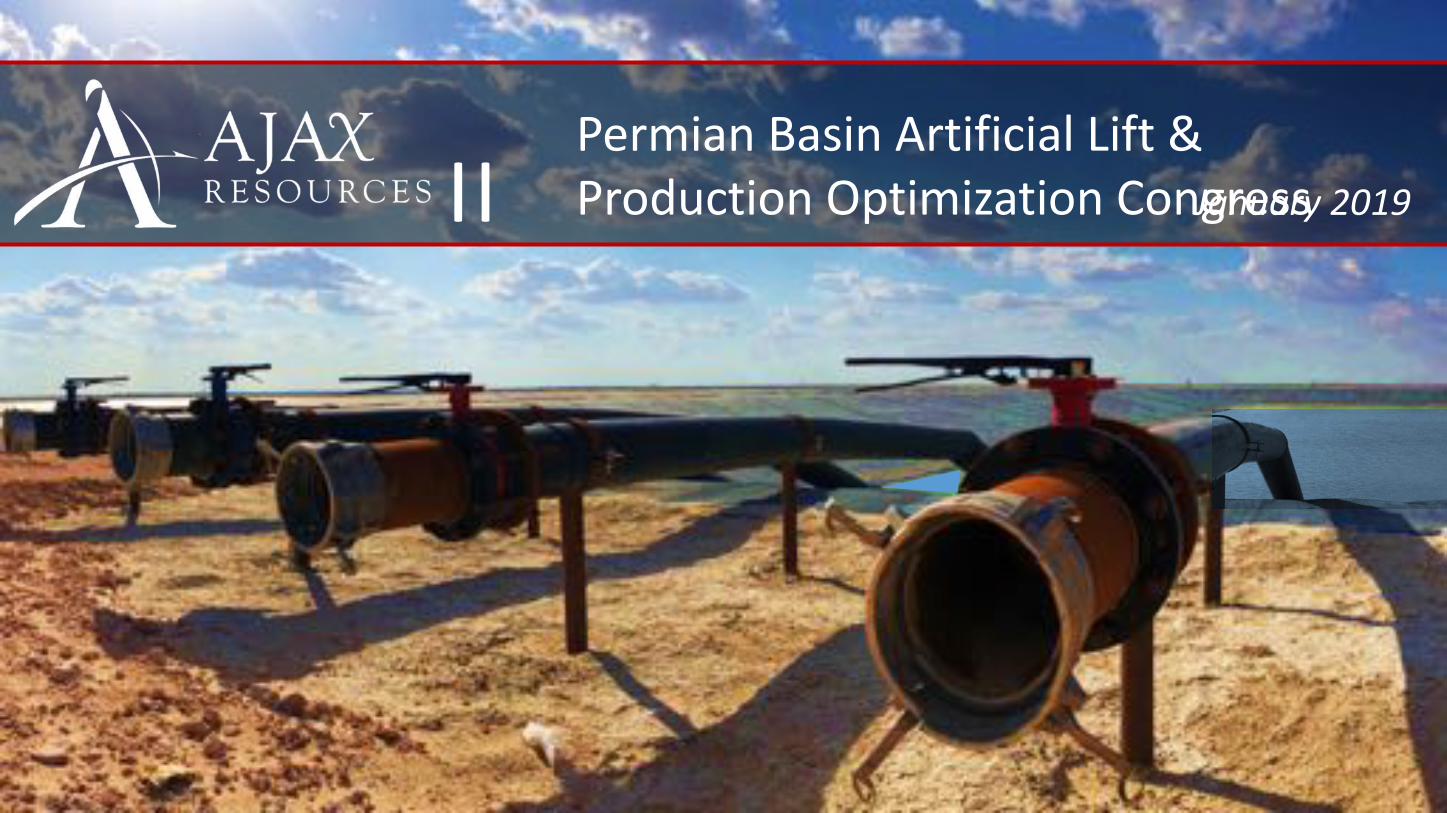
Permian Basin Artificial Lift & Production Optimization CongressJanuary 2019II

IINorthern Midland Basin: Historical LOE per Boe
18
2017 Average: $6.08/Boe 2018 YTD: $4.07/Boe
$9.2
7
$8.0
5
$5.7
5
$5.5
8
$4.3
4 $5.0
5
$7.4
1
$6.8
3
$5.8
8
$5.2
4
$5.0
5
$4.5
6
$4.5
9
$4.2
5
$4.3
4
$4.6
2
$4.2
6
$4.5
6
$3.1
8
$2.8
0
$0.00
$1.00
$2.00
$3.00
$4.00
$5.00
$6.00
$7.00
$8.00
$9.00
$10.00
Jan-
17
Feb-
17
Mar
-17
Apr-
17
May
-17
Jun-
17
Jul-1
7
Aug-
17
Sep-
17
Oct
-17
Nov
-17
Dec
-17
Jan-
18
Feb-
18
Mar
-18
Apr-
18
May
-18
Jun-
18
Jul-1
8
Aug-
18
41%

Permian Basin Artificial Lift & Production Optimization CongressJanuary 2019II