Embed Size (px)
Citation preview

Permeability as a toggle switch in £uid-controlled crustalprocesses
Stephen A. Miller a;*, Amos Nur b
a Geology Institute, Swiss Federal Institute of Technology (ETH), 8093 Zurich, Switzerlandb Department of Geophysics, Stanford University, Stanford, CA, USA
Received 3 March 2000; received in revised form 16 August 2000; accepted 31 August 2000
Abstract
Fluid transport in the earth's crust is either extremely rapid, or extremely slow. Cracks, dikes and joints represent theformer while tight crystalline rocks and impermeable fault gouge/seals represent the latter. In many cases, the localpermeability can change instantaneously from one extreme to the other. Instantaneous permeability changes can occurwhen pore pressures increase to a level sufficient to induce hydro-fracture, or when slip during an earthquake ruptures ahigh fluid pressure compartment within a fault zone. This `toggle switch' permeability suggests that modelingapproaches that assume homogeneous permeability through the whole system may not capture the real processesoccurring. An alternative approach to understanding permeability evolution, and modeling fluid pressure-controlledprocesses, involves using local permeability rules to govern the fluid pressure evolution of the system. Here we present amodel based on the assumption that permeability is zero when a cell is below some failure condition, and very largelocally (e.g. nearest neighbors) when the failure condition is met. This toggle switch permeability assumption isincorporated into a cellular automaton model driven by an internal fluid source. Fluid pressure increases (i.e. fromporosity reduction, dehydration, partial melt) induce a local hydro-fracture that creates an internally connectednetwork affecting only the regions in the immediate neighborhood. The evolution, growth, and coalescence of thisinternal network then determines how fluid ultimately flows out of the system when an external (drained) boundary isbreached. We show how the fluid pressure state evolves in the system, and how networks of equal pore pressure link onapproach to a critical state. We find that the linking of subnetworks marks the percolation threshold and the onset of acorrelation length in the model. Statistical distributions of cluster sizes show power law statistics with an exponentialtail at the percolation threshold, and power laws when the system is at a critical state. The model provides insights intomechanisms that can establish long-range correlations in flow networks, with applications to earthquake mechanics,dehydration, and melting. ß 2000 Elsevier Science B.V. All rights reserved.
Keywords: earthquakes; failures; fractures; liquidphase; percolation; permeability; self-organization
1. Introduction
Fluids (and their pressure state) play a domi-nant role in many geological, geophysical, andpetrologic processes [1,2]. Substantial evidencesuggests that £uid pressures in many parts of
0012-821X / 00 / $ ^ see front matter ß 2000 Elsevier Science B.V. All rights reserved.PII: S 0 0 1 2 - 8 2 1 X ( 0 0 ) 0 0 2 6 3 - 6
* Corresponding author. Fax: +41-1-633-1108;E-mail: [email protected]
EPSL 5617 3-11-00 Cyaan Magenta Geel Zwart
Earth and Planetary Science Letters 183 (2000) 133^146
www.elsevier.com/locate/epsl

the crust are close to lithostatic [3^5], and ubiq-uitous evidence in the form of mineral bearingveins point to hydro-fracture as a primary meansof £uid transport [6]. Over-pressured £uid a¡ectsthe mechanical strength of rock, and was pro-posed by Hubbert and Rubey [7] as the mecha-nism responsible for overthrust faulting. Over-pressuring in sedimentary basins is widespread be-low depths of 1^2 km [8], and abrupt vertical andlateral transitions form distinct pore pressurestates within sedimentary sequences [9]. Thinfaults or hydrothermally altered seals add to thespatial and temporal variations in crustal hydraul-ics. Rapid changes in pore pressure are suggestedas an important precipitation mechanism in golddeposits [10,11], and dilatancy hardening is a well-known phenomenon associated with crustal fault-ing [12,13]. Reaction-induced hydro-fracture inhigh-pressure anatectic melting experiments [14]con¢rms that this mechanism exists, and may beimportant in £uid-controlled crustal processes.
A principal problem in modeling £uid-con-trolled crustal processes is that the nature inwhich £uids move in the crust is controlled by aparameter that spans about ¢ve orders of magni-tude for common geologic materials. In general,permeability (k) ranges from about 10314 m2 forcommon sandstone to less than 10319 m2 in shalesand clays [15,16]. This problem is compounded byevidence that £uid £ow in the crust is channeled[17] and episodic [18], resulting in strong spatialand temporal variations in pore pressure and hy-draulic properties. Given such an uncontrolledparameter, £uid £ow models developed for mid-crustal levels can generate a wide range of results,with potentially little or no validity. Here wepresent a simple model where the internal perme-ability network develops within the system in re-sponse to some physical or chemical process. Spe-ci¢cally, we consider an increasing pore pressuremechanism through porosity reduction or a direct£uid source that increases pore pressure until hy-dro-fracture. To model rapid changes in hydraulicproperties, permeability is treated as a toggleswitch (e.g. on or o¡), being either zero or verylarge to nearest neighbors. That is, permeability iszero while the £uid pressure state is below somefailure condition, and locally very large when the
£uid pressure reaches this condition. Conceptu-ally, this translates to two extreme £ow states inthe crust. Over short time scales in an imperme-able medium, £uid £ow is restricted, and porepressures increase at rates that depend on the £u-id source rate and the compressibility of the me-dium. At the time of failure, £uid £ow is rapid tothe immediate neighborhood. The reduced £uidpressures that accompany an increase in crackporosity or sudden hydraulic connectivity to alow-pressure region thus limit £ow to the imme-diate neighborhood. Whether the high £uid pres-sure perturbation propagates depends on the stateof the neighbor: (1) If the neighbor is su¤cientlyfar from failure, the crack (or £uid £ow) is ar-rested, or (2) if the state of the neighbor is alsonear the failure condition, then the instability canpropagate.
The purpose of this paper is to demonstrate thebasic behavior of a model based on the toggleswitch permeability assumption, presented as acellular automaton model, and describe how thismodel behaves in terms of permeability evolution,self-organization, and critical states. The modelhas no inherent length scale above the grain scale,so its utility is limited to understanding evolution-ary processes to a critical state and a study ofmodel statistics. We have purposely reduced theproblem to the simplest possible scenario, exclud-ing for now processes that can be initiated byrapid £uid pressure reductions, such as precipita-tion, dissolution, dehydration, melting, or dila-tancy hardening. Coupling the model to some ofthese processes is addressed elsewhere [19,20].
2. Conceptual model
The cyclic (or toggle switch) model for perme-ability is postulated as a possible mechanism op-erating within the crust or in fault zones. Forearthquakes [21,19], fault compaction increasespore pressure in zero permeability cells duringquiescence [22,23]. Permeability is transientlyvery large when dilatant slip accompanies anearthquake [12,13,24,25]. After £uid pressuresare redistributed among cells participating in theevent, rapid sealing toggles permeability back to
EPSL 5617 3-11-00 Cyaan Magenta Geel Zwart
S.A. Miller, A. Nur / Earth and Planetary Science Letters 183 (2000) 133^146134

zero. Fluid £ow within the fault plane is thusepisodic and only transiently over-pressured. Fordehydration, melting, or other phase transitionswith positive Clapeyron slopes (Fig. 1b), scatterednucleation sites within the body generate localover-pressures at time of the reaction [26]. Thesesites are initially hydraulically disconnected, bothto a drained boundary or to other sites (kV0).Increased £uid pressure can bu¡er the reactionunless it is su¤cient to induce hydro-fracture[14]. If hydro-fracture occurs, then the site is hy-
draulically connected to the local environment,thus reducing £uid pressure via increased crackporosity or hydraulic connectivity to low-pressureregions. The reduced £uid pressure has the samethermodynamic e¡ect as an increase in tempera-ture (although much reduced), and the dehydra-tion/melting reaction continues. The resulting pos-itive feedback is an evolving system where thepermeability network is created internally fromthe loop of £uid pressure increaseChydro-frac-tureC£uid pressure decrease C kinetics. In thiscase, rapid sealing from precipitation can reducepermeability, or the toggle switch permeabilitycomes into play because permeability is zero be-tween simultaneously evolving crack networksthat are hydraulically unconnected. When isolatednetworks become connected, then k is very largewithin this subsystem, but is still zero betweensimilar systems developing independently withinthe body. Scale invariance can be seen conceptu-ally to emerge because the same mechanisms areoperating whether one considers the interaction oftwo individual cells, two interacting networks ofmany cells, or many isolated networks of unlim-ited cells. Eventually all subnetworks merge, cre-ating a permeable pathway where the macroscopicvalue for k becomes applicable. Merging of inter-nal networks results in a percolation-type thresh-old within the system [27,28].
3. A cellular automaton model of £uid £ow
These concepts are well modeled with cellularautomata [29^32]. Cellular automata are simplynumerical bookkeeping algorithms to distributea parameter to nearest neighbor cells once someprescribed condition is reached. Typically, a ran-dom distribution of a parameter is assumed scat-tered in a two-dimensional matrix (although itcan be extended to three dimensions). The systemis then driven by this parameter until a failurecriterion is satis¢ed, where the `load' is redistrib-uted to nearest neighbors. These extremely simplemodels produce complex and rich behavior, andare commonly used in studying critical phenom-ena and phase transitions. The original Isingmodel for a ferromagnet is an example of a cel-
Fig. 1. Conceptual model of toggle switch permeability usedfor modeling £uid-controlled crustal processes. (a) Earth-quakes. Fault zone compaction or other £uid sources in alow permeability fault zone increase £uid pressure in discretecompartments. High £uid pressures induce a dilatant slipevent that locally increases permeability and equilibrates £uidpressure in the immediate neighborhood. Healing and sealingthen reduce permeability. (b) Dehydration/melting. Isolatednucleation sites from a dehydration or melting reaction in-crease pore pressure and can induce local hydro-fracture.Hydro-fracture increases the local permeability, and withcontinued reaction, the crack network grows and coalesces.
EPSL 5617 3-11-00 Cyaan Magenta Geel Zwart
S.A. Miller, A. Nur / Earth and Planetary Science Letters 183 (2000) 133^146 135

lular automaton. In this paper a cellular autom-aton model is proposed for crustal £uid £ow,where the driving parameter is pore pressure with-in the system.
The physical basis for this model derives from aformulation of the di¡usion equation that in-cludes source terms from time-dependent porosityreduction _P , or a direct £uid source _y . Variousderivations are given elsewhere and are not re-peated here [33^35]. The equation is :
DPf
D t� 1
P �L P � L f �kX9 2Pf 3� _P plastic3 _y �
� ��1�
where the ¢rst part in brackets describes porepressure reduction through di¡usion, and the sec-ond part in brackets represents pore pressure in-creases from a £uid source. In Eq. 1 P is porosity,LP and Lf are the pore and £uid compressibility(LP = (1/P)(DP/DP)), X is the viscosity, and k is theintrinsic isotropic permeability of the matrix. Foran impermeable matrix (kV0), Eq. 1 reducesto:
DPf
D tjnoflow � �
_y3 _P �iP iL i
�2�
where i is the cell matrix index and the compres-sibility has been lumped into a single parameterL= LP +Lf [34]. When porosity is reduced in asystem faster than the permeability network cantransport it away (kW0; P6 0), pore pressuresincrease at rates proportional to the storage ca-pacity of the rock (PL). Proposed mechanisms forporosity reduction include healing and sealing ofcracks [33], pressure solution [5,36^38], compac-tion by sedimentation [39,40], and compactioncreep of fault gouge [41^43]. In such systems,pore pressures can increase until they overcomethe least principal stress and initiate hydro-frac-ture. In the case of earthquakes, pore pressureincreases reduce the frictional resistance to slidingand can induce a dilatant slip event [21,24]. Inboth cases, £uid pressures are reduced rapidlywith local permeability increases (kWr). Thenew permeability network may include openingold pathways, or creating new ones. The cycleof reduced porosity, hydro-fracture, and repeated
porosity reduction is proposed as the mechanismfor the observed episodic crustal £uid £ow [13,18].Field evidence of spatially varying, episodic £uid£ow within mature fault zones supports the as-sumption in Eq. 2 that permeability is su¤cientlysmall as to be approximated as zero [22,44]. Ex-amples of a direct £uid source include a £uidsource at depth [45], or devolitization reactions[46].
When the failure condition is reached, £uidpressures instantaneously equilibrate with nearestneighbor cells. This can be viewed as a di¡usiontime of one time step and ¢xes a relationship be-tween the di¡usion length and the size of thesmallest model element [47]. The equilibrium pres-sure, determined by conserving £uid mass (andignoring gravity), is :
P �P m
i�1�P L �iPiP mi�1�P L �i
�3�
where P is the average pressure of the a¡ectedcells, Pi is the pre-failure pore pressure in cells i,and m is the number of cells involved in the re-distribution. We do not currently include in-creases in crack porosity associated with an event,so any £uid pressure reductions result solely fromhydraulic connectivity with lower-pressure re-gions. Including other important mechanismssuch as increased crack porosity, mechanicalstrength variations, and time-dependent healingwould allow larger £uid pressure variations, butare currently not explicity modeled.
The numerical algorithm is as follows: (a) cal-culate increase in £uid pressure in each cell (Eq.2), (b) check for cells meeting the failure conditionand monitor the size of the connected regions,(c) for failed cells, redistribute £uid pressureamong nearest neighbors (Eq. 3), (d) repeat (b)and (c) until all cells are below the failure condi-tion, and (e) advance to next time step. Duringthe redistribution phase, cluster size is determinedby counting the distinct number of cells involvedin the event. The algorithm keeps track of thestate of each cell, and after applying Eq. 3, thematrix is scanned to see if the high pore pressurezone propagates, or stabilizes. Initially, only local-ized events occur because the system is hydrauli-
EPSL 5617 3-11-00 Cyaan Magenta Geel Zwart
S.A. Miller, A. Nur / Earth and Planetary Science Letters 183 (2000) 133^146136

cally disconnected. As the system evolves, evolv-ing subsystems link to a point where communica-tion between cells can propagate spontaneouslythrough the system, creating a hydraulically con-nected body.
4. Model input
We investigated a matrix of 300U300 cells. Thefree parameters reduce to assumptions about the£uid sources, initial porosity, and the compressi-bility of the pore space and £uid. Although manyprocesses are involved in increasing pore pressurewith time, we have chosen to simplify the systemby investigating a range of pore pressure increaserates (Fig. 2) determined by assumed initial dis-tributions of either the numerator or denominatorin Eq. 2. In cases I and IV, normal and uniformdistributions of compressibility, respectively, were
assumed in a matrix with a constant source term.In cases II and III, normal and uniform distribu-tions of the source term, respectively, were as-sumed in a matrix of constant compressibility.Compressibility of the pore space and £uid arerelatively well constrained within a range of val-ues [15], and were restricted in cases I and IV to1U1032 MPa31 9 L9 1U1033 MPa31 [34]. Forcases II and III, compressibility was constant atL= 5U1033 MPa31. For the source term, we as-sumed porosity reduction rates on the order ofgeologic strain rates (V1U10315 s31), con-strained in cases II and III to 1U1038
yr31 9 _y 3 _P91U1036 yr31, and held constantfor cases I and IV to _y3 _P = 1U1036 yr31. Theinitial porosity was chosen at 2% for all cases.Fig. 2 shows the input distributions of parame-ters, and the resulting distributions of pore pres-sure increase rates. The failure condition was ar-bitrarily set at the overburden pressure at a depth
Fig. 2. Histograms of initial pore pressure increase rates of four cases considered. The rates were determined by choosing a ran-dom distribution of source terms (numerator) or material properties (denominator) in Eq. 2. The distributions of the source termand material properties are shown in the insets.
EPSL 5617 3-11-00 Cyaan Magenta Geel Zwart
S.A. Miller, A. Nur / Earth and Planetary Science Letters 183 (2000) 133^146 137
of 10 km (270 MPa). This choice of failure con-dition has no e¡ect on the overall model behavior.The initial cell £uid pressures were evenly distrib-uted between lithostatic and hydrostatic porepressure to represent the range of possible £uidpressure states in the crust. In the di¡erent casespresented, numerous processes that contribute toa non-uniform pore pressure build-up have beengrouped into a distribution of pore pressure in-crease rates. These di¡erent rates were determinedby assuming a di¡erent distribution of sourcesand compressibilities, ignoring for now randomdi¡erences in initial porosity, porosity creationwith hydro-fracture, changes in the mechanicalstrength of the rock, and time-dependent healing.Grouping these processes into a single term cap-tured the overall behavior of the model, but spe-ci¢c cases are left to future work.
Eq. 2 provides a model time scale in years, andthe time step was chosen at 0.1 yr for all cases.The e¡ects of choosing a range of time steps wasnot fully explored, but for cases where a time stepof 1 yr was chosen showed no e¡ect on the overallevolution of the system. However, some quantita-
tive details are a¡ected by the time step and dis-cussed below.
5. Results
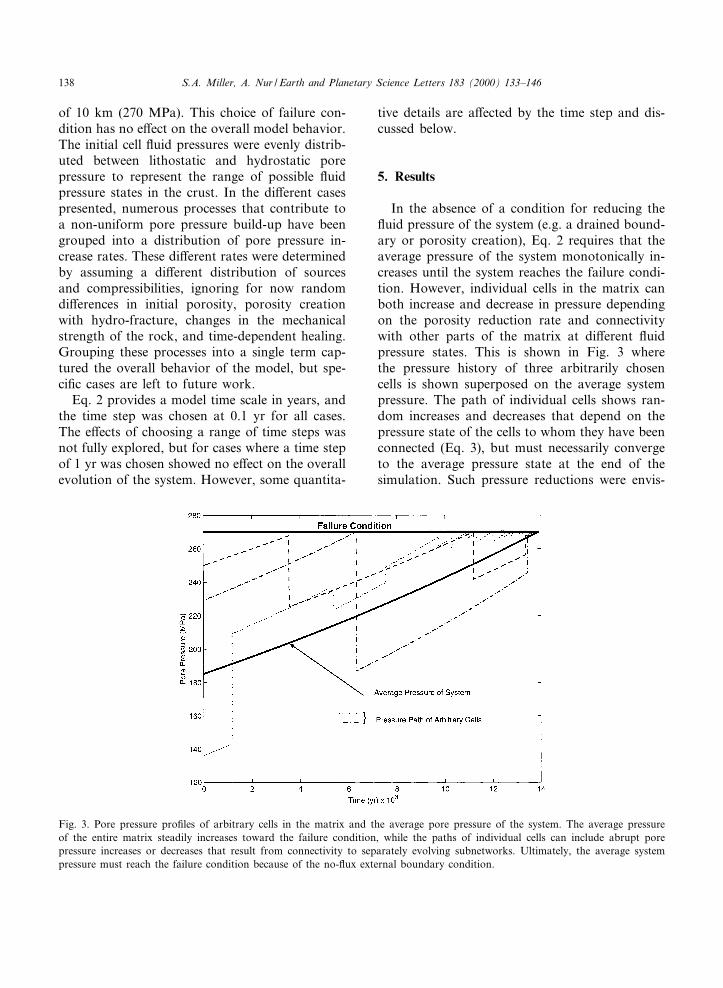
In the absence of a condition for reducing the£uid pressure of the system (e.g. a drained bound-ary or porosity creation), Eq. 2 requires that theaverage pressure of the system monotonically in-creases until the system reaches the failure condi-tion. However, individual cells in the matrix canboth increase and decrease in pressure dependingon the porosity reduction rate and connectivitywith other parts of the matrix at di¡erent £uidpressure states. This is shown in Fig. 3 wherethe pressure history of three arbitrarily chosencells is shown superposed on the average systempressure. The path of individual cells shows ran-dom increases and decreases that depend on thepressure state of the cells to whom they have beenconnected (Eq. 3), but must necessarily convergeto the average pressure state at the end of thesimulation. Such pressure reductions were envis-
Fig. 3. Pore pressure pro¢les of arbitrary cells in the matrix and the average pore pressure of the system. The average pressureof the entire matrix steadily increases toward the failure condition, while the paths of individual cells can include abrupt porepressure increases or decreases that result from connectivity to separately evolving subnetworks. Ultimately, the average systempressure must reach the failure condition because of the no-£ux external boundary condition.
EPSL 5617 3-11-00 Cyaan Magenta Geel Zwart
S.A. Miller, A. Nur / Earth and Planetary Science Letters 183 (2000) 133^146138

aged in qualitative models of episodic £uid £ow inthe crust [13]. Convergence to the average systempressure will be discussed shortly in the context ofincreasing correlation and linking of subnetworkson approach to a critical state (e.g. when the sys-
tem is at incipient failure). The subtle increase inthe overall pore pressure increase rate of the sys-tem results from the functional dependence of therates on porosity, which itself is being reduced(Eq. 2).
Fig. 4. Snapshots of pressure state showing the late time evolution of large networks of connectivity approaching the failure con-dition (e.g. within 5%). Little structure is observed prior to frame a because the cells that fail are isolated in space and hydrauliccommunication with neighbor cells lowers the pressure and heals it. Once the system is self-organized (a^c) and large regions ofconnectivity are established, a structure is observed, which grows in scale (d^f). On approach to the critical state (g^h), the scaleof interaction has increased to the size of the matrix and the whole system nears failure (i). The corresponding times of theseframes are indicated in Figs. 5b and 6b. The color bar ranges from 6 95% of the failure condition to s 99% of the failure con-dition.
EPSL 5617 3-11-00 Cyaan Magenta Geel Zwart
S.A. Miller, A. Nur / Earth and Planetary Science Letters 183 (2000) 133^146 139

For the following discussion, an event is de¢nedas the failure (via hydro-fracture) of at least onecell. If the failure of a cell and subsequent pres-sure redistribution initiates failure of neighborcells during the same time step, then the numberof connected cells are counted when equilibrium isachieved, and a cluster is de¢ned as the size of theconnected cells. That is, if pressure equilibrationbetween neighbor cells is still above the failurecondition, then pressure is redistributed to thenext nearest neighbors. This continues until pres-sure equilibration of the subnetwork falls belowthe failure condition. The number of cells in-volved in this redistribution sequence is a cluster.Connectivity within the system is monitored in thenumerical algorithm, thus ensuring that at leastone cell length separates the boundaries betweenclusters.
The general model behavior (for case II) isshown visually as snapshots in time of zones ofincipient failure (Fig. 4a^i). This visual map of thepressure state corresponds to the late time quan-titative description in Fig. 3. The full animation ofthis simulation can be found at http://www.erdw.ethz.ch/Vsteve/press.htm. At early times,cells approaching failure are isolated in space, sowhen a cell fails, pressure equilibration withneighbor cells does not propagate and clustersize is limited to one or a few cells. After su¤cienttime has passed, clusters begin to appear (Fig. 4a^c) that converge onto a de¢ned structure of incip-ient failure within the system (Fig. 4d^f). Oncethis structure is established (e.g. Fig. 4f), it growsin time (Fig. 4g^h), until a critical state is reached(Fig. 4i) whereby the system as a whole is nearingthe failure condition. These snapshots are quanti-
Fig. 5. Time line of the number of events, shown as a histogram binned by year. In all cases, the number of events steadily in-creases until a drastic reduction occurs and which marks the percolation threshold and the onset of a correlation length. A longerrange of interaction reduces the e¡ects of individual cells because the pore pressure grows at the e¡ective rate of clusters. A simi-lar pattern in the time line is observed at later times because of the same e¡ect of linking correlated networks. That is, large sub-networks begin to merge and thus change (again) the scale of interaction. The times of the snapshots shown in Fig. 4 are indi-cated in frame b.
EPSL 5617 3-11-00 Cyaan Magenta Geel Zwart
S.A. Miller, A. Nur / Earth and Planetary Science Letters 183 (2000) 133^146140

¢ed as a time line of the number of events (Fig.5), the cumulative cluster size (Fig. 6), the statis-tical distributions of cluster sizes (Fig. 7), and aquanti¢cation of the cluster size distribution forcase II (Fig. 8). Each of these will be discussed inturn, but the reader should refer to Figs. 3 and 4for the following discussion of how this systembehaves.
6. Discussion
A general model behavior, independent of theinput, is the manner in which the evolved struc-ture in Fig. 4 relates to the (self-) organization ofthe system. Fig. 5 shows the time line of the num-ber of events for each of the four cases, with thetime of each snapshot of Fig. 4 indicated on Fig.
5b. The overall shape of the time line of events isthe same for all cases. At early times (not shown),the rate is constant and re£ects the random fail-ures of cells. As the system evolves, the rate offailure grows steadily as the average system pres-sure increases and a larger number of cells fail (orfail again). The acceleration in the number ofevents is followed by an abrupt reduction late inthe simulation. Coincident, but not coincidently,the reduction in the number of events occurs atthe time when the structure of incipient failure is¢rst established (Fig. 4c^d). As will be shown, thismarks the onset of a correlation length, and iden-ti¢es the percolation threshold of the system. Atthe percolation threshold, the system is reset at anew scale of interaction. These subsystems thengrow in unison, link with other such subsystemsevolved elsewhere in the matrix, and evolve to-
Fig. 6. Time line of the cumulative sum of the size of all events. All cases show a steady increase until reaching a plateau(marked by a square) that corresponds to the abrupt change in number of events in Fig. 5. The explanation for this feature ofthe record is the same as described in Fig. 5. The statistics of cluster size distributions (Fig. 7) were determined at times markedby the `x'.
EPSL 5617 3-11-00 Cyaan Magenta Geel Zwart
S.A. Miller, A. Nur / Earth and Planetary Science Letters 183 (2000) 133^146 141

ward a critical state. In Fig. 4d^i, this transition isobserved as growth of an established structure,and is seen both in the rate at which cells arefailing (Fig. 5), and the rate at which failing cellsare accumulating (Fig. 6). Fig. 6 is the cumulativesum of all cells that failed during the simulation,and the derivative represents the rate at whichcells are failing. The cusp seen in Fig. 6 marksthe percolation threshold and the onset of a cor-relation length in the model. The increasing cor-relation length (e.g. connected subnetworks) e¡ec-tively reduces the number of cells that can actindependently, and thus reduces the number ofindividual events that can occur. Following theobvious initial reduction in the number of events,another more subtle drop is observed (Fig. 5) thatindicates still another scale of interaction from themerging of correlated subnetworks. Ultimately,
the system reaches a critical state where the scaleof interaction is the size of the matrix.
The physical basis for this behavior rests withthe self-organization of the system. While zones ofincipient failure tend to organize into a correlatedstructure, they surround (and are surrounded by)zones of low pressure that are also organizing.When the two networks at di¡erent pressuresmeet, the subnetworks merge and equilibrate ata £uid pressure de¢ned by the pressures involved,but below the failure condition. With continuedpressure build-up, correlation among cells in-creases and large portions of the system act to-gether and approximately follow the average pres-sure of the system. In other words, this healinge¡ect is pronounced at or above the percolationthreshold because correlated zones of high pres-sure tap into low-pressure zones, thus equilibrat-
Fig. 7. Evolution of the cluster size distributions for the four cases, shown as distributions of cluster size (S) and the number ofevents (N) greater than S. The distributions were determined for the model catalog up to the times indicated by `x' in Fig. 6.The cluster size is determined by the number of connected cells that fail during one event. In all cases, the ¢nal distribution ofcluster sizes show power laws over many orders of magnitude, but with slightly di¡erent structure at the largest events.
EPSL 5617 3-11-00 Cyaan Magenta Geel Zwart
S.A. Miller, A. Nur / Earth and Planetary Science Letters 183 (2000) 133^146142

ing a large part of the matrix at a lower pressure.This occurs only when the system is correlatedbecause a large number of cells need to be in-volved to signi¢cantly alter the pressure late inthe system evolution. The observed large pressurereductions early in the simulation (e.g. Fig. 3)represent only local equilibration, so only localhealing is possible while healing of the overallsystem is not observed.
The behavior of the system can be quanti¢ed byinvestigating the evolution of cluster size distribu-tions (Fig. 7). The distributions were determinedfor the entire record up to the times indicated by`x' in Fig. 6, and span the percolation threshold(indicated by the square). When a cell fails atearly times, pressure redistribution with nearestneighbors typically reduces pressure of the af-fected cells. Therefore, the cluster size is one andthe early part of the record is dominated byevents of size one (or a few), with no large events.This results in a very steep slope of the cluster sizedistribution. As correlation among cells is estab-lished and grows, larger events are recorded andthis results in a wider range of event sizes. As thewhole system approaches the failure condition,failure of one cell can initiate failure of neighborcells, which can then chain-react through the ma-
trix and generate clusters of all sizes up to the sizeof the matrix.
The cluster size distributions in Fig. 7 are well¢t by a simple correlation relationship:
D�S� � S3K exp�3S=L� �4�
where S is the cluster size, K is the power lawexponent, and L is a correlation length. Eq. 4 isoften used in statistical percolation models andcritical point phenomena [48,49]. Fig. 8 showsthe distribution for case II superposed with a ¢tof Eq. 4 resulting in estimates of the correlationlength in the model. The ¢tted distributions cor-respond to the times shown in Fig. 6b, spanningthe cusp that we identify as the percolationthreshold. Fig. 8 shows that a signi¢cant correla-tion length is established around the cusp of Fig.6, and grows rapidly following the cusp. In a clas-sic bond percolation model [48], power law statis-tics are found at the percolation threshold. Powerlaw statistic are also found here, but the powerlaw is appended with an exponential tail con-trolled by the correlation length. That is, the localcorrelations created by resetting connected ele-ments at the same £uid pressure introduce similare¡ects at the smaller scale. As the correlation
Fig. 8. Fit of Eq. 4 to the cluster size distribution in Fig. 7b. The ¢t shows how the correlation length increases beyond the per-colation threshold up to the critical state where the system is at the failure condition and a power law is observed.
EPSL 5617 3-11-00 Cyaan Magenta Geel Zwart
S.A. Miller, A. Nur / Earth and Planetary Science Letters 183 (2000) 133^146 143

length increases (Fig. 8), the power law extends tolarger sizes. Ultimately, the system acts as a singleunit (LCr) and shows power law distributionsof cluster sizes that span the size of the matrix(approximately ¢ve orders of magnitude and105^106 individual events). If the system size wasextended, the same power laws would result.Some deviations from a power law when the sys-tem is at failure are observed (e.g. cases I and III),and show both sub- and supercritical behavior asdiscussed elsewhere [50,51]. The slope of thepower law depends somewhat on the time step.For larger time steps (e.g. 1 yr), slopes of around31.2 are observed that re£ect the coarser mergingof networks as the system approaches failure.
7. Conclusions
We have presented here a simple model thatfollows through on the common observationthat hydro-fracturing and other sudden changesin hydraulic properties probably play an impor-tant role in crustal hydraulics. The model is basedon a basic assumption that crustal permeabilitycan be approximated as very small (i.e. e¡ectivelyzero), or very large (i.e. e¡ectively in¢nite), withthe transition between the two extremes activatedby processes such as dilatant slip during earth-quakes or hydro-fracture. The actual limits ofthe toggle switch are not well known, but canbe argued to be in the range of 10318
m2H10316 m2. The toggle switch permeability issupported by numerous ¢eld observations, andprovides a strong non-linearity necessary to pro-duce the resulting complex statistics. The modelresults present a plausible scenario for crustal£uid £ow, with implications for most £uid-controlled crustal processes. We show that theaverage behavior of the system pressure is in-distinguishable from a continuum approach, butalso show that sudden, large amplitude £uc-tuations occur in response to the linking of in-dependently evolving subnetworks. These high-frequency perturbations govern the internal con-nectivity structure. The evolution of the connec-tivity structure shows the onset of a correla-tion length at the percolation threshold that can
be described as a power law with an exponentialtail. After the percolation threshold, the correla-tion length increases until the entire system is atthe verge of failure where we observe power lawstatistics of cluster size distributions, indicat-ing scale invariance. Physically, scale invariancemeans that the snapshots in Fig. 3 could beviewed either as an entire system itself, or asmerely a minor subsystem operating within a larg-er network. That is, the snapshots could be both arepresentation of the processes occurring at thelevel of pore structure, or at the level of largescale £uid pressure development and expulsionwithin the crust. When the £uid pressure stateof the system is about to reach the failure condi-tion (Fig. 4i), then it could equally represent in-cipient failure of one computational cell, or alarge system that is on the verge of meeting itsnearest neighbor. The no-£ux model boundariesrequire that the £uid pressure within the systemultimately reaches the failure condition. In theearth, drainage occurs over long time scales, andan eventual balance is reached between sourcesand sinks, thus resulting in a state of criticalityover geologic time scales.
This model shows critical behavior in the samesense as other cellular automata models [29] thatproduce power law statistics at a critical state,and can be described in terms of critical statephase transitions, percolation theory, and renorm-alization group theory [52]. However, we arrive atthese results from an approach that uses physicalprocesses to explicity drive the system and showquantitatively and visually what these theoreticalresults show mathematically. The rich behavior ofthe model presented here results from the simplestpossible scenario of instantaneous large changesin local permeability. We investigated a widerange of inputs for probable crustal conditions,and show that the general behavior of the modelis independent of that input. The model showsthat the system self-organizes to a state wherethe merging of isolated networks resets the scaleof interaction. At this new scale of interaction,larger events become possible, until at the criticalstate all event sizes are possible because the scaleof interaction is on the scale of the model.
The utility of this model is that the rules that
EPSL 5617 3-11-00 Cyaan Magenta Geel Zwart
S.A. Miller, A. Nur / Earth and Planetary Science Letters 183 (2000) 133^146144

drive the system are based on simple conceptswith substantial natural observations to back upthe initial assumptions; namely that permeabilitycan take on extreme values in response to a sud-den event. A unique aspect of the model is that anatural large-scale correlation mechanism is in-herent in the system self-organization, and isbased on the physically probable mechanism ofconnecting isolated networks at di¡erent £uidpressures. The model can be further developedby explicity modeling other processes that are cur-rently ignored. This includes the simultaneouslyevolving stress ¢eld in response to the evolvingcrack network, and poroelastic e¡ects [53]. Nu-merous feedbacks and couplings can be includedin future models, with applications to £uid pres-sure-induced mineral precipitation or melting anddehydration reactions. As already pointed out,there exists no length scale in this model abovethe grain scale. Although this limits its immediateability to compare with geologic observations, itdoes serve to point out a physical basis for scaleinvariance of permeability and crack networksoften observed in nature. The model has manypotential applications in modeling £uid-controlledcrustal processes. For example, coupling this sim-ple model to elastic dislocation theory provided alength scale necessary to develop a deterministicthree-dimensional £uid-controlled earthquakemodel [19], and coupling this model to dehydra-tion kinetics has produced a dynamical system inP^T space for understanding permeability evolu-tion in dehydrating systems [20]. A further cou-pling to melt kinetics and elastic dislocationtheory [54] provides the necessary length scalefor an envisaged forward and deterministic modelof volcanic seismicity.
Acknowledgements
Reviewers Ian Main, Yves Gueguen and Mi-chael Brown are thanked for constructive reviews.Discussions about correlation lengths (I. Main)and percolation theory (Y. Gueguen) are appre-ciated.[FA]
References[1] J.D. Bredheoft, D.L. Norton, Mass and energy transport
in a deforming earth's crust, in: The Role of Fluids inCrustal Processes, National Academy Press, Washington,DC, 1990, pp. 27^41.
[2] B. Jamtveit, B.W.D. Yardley (Eds.), Fluid Flow andTransport in Rocks: Mechanisms and E¡ects, Chapmanand Hall, London, 1997.
[3] M.A. Etheridge, V.J. Hall, S.F. Cox, R.H. Vernon, High£uid pressures during regional metamorphism and defor-mation: Implications for mass transport and deformation,J. Geophys. Res. 89 (1984) 4344^4358.
[4] J.D. Byerlee, Friction, overpressure, and fault normalcompression, Geophys. Res. Lett. 17 (1990) 2109^2112.
[5] P. Gavrilenko, Y. Gueguen, Fluid overpressure and pres-sure solution in the crust, Tectonophysics 217 (1993) 91^110.
[6] S.F. Cox, Faulting processes at high £uid pressures: Anexample of fault valve behavior from the Wattle GullyFault, Victoria, Australia, J. Geophys. Res. 100 (1995)12841^12859.
[7] M.K. Hubbert, W.W. Rubey, Role of £uid pressure in themechanics of overthrust faulting, Geol. Soc. Am. Bull. 70(1959) 115^166.
[8] W.S. Fyfe, N. Price, A.B. Thompson, Fluids in theEarth's Crust, Elsevier, Amsterdam, 1978.
[9] S. Hickman, R. Sibson, R. Bruhn, Introduction to specialsection: Mechanical involvement of £uids and faulting,J. Geophys. Res. 100 (1995) 12831^12840.
[10] J.J. Wilkinson, J.D. Johnston, Pressure £uctuations,phase separation, and gold precipitation during seismicfracture propagation, Geology 24 (1996) 395^398.
[11] B.W.D. Yardley, Fluid migration and veining in the Con-nemara Schists, Ireland, in: J.V. Walther, B.J. Wood(Eds.), Fluid-Rock Interactions During Metamorphism,Springer, New York, 1986, pp. 109^131.
[12] J.W. Rudnicki, C.H. Chen, Stabilization of rapid friction-al slip on a weakening fault by dilatant hardening,J. Geophys. Res. 93 (1988) 4745^4757.
[13] R.H. Sibson, Implications of fault-valve behavior for rup-ture nucleation and recurrence, Tectonophysics 211 (1992)283^293.
[14] J.A.D. Connolly, M.B. Holness, D.C. Rubie, T. Rushmer,Reaction-induced microcracking: An experimental inves-tigation of a mechanism for enhancing anatectic melt ex-traction, Geology 25 (1997) 591^594.
[15] C. David, T.-f. Wong, W. Zhu, J. Zhang, Laboratorymeasurement of compaction-induced permeability changein porous rocks: Implications for the generation andmaintenance of pore pressure excess in the crust, PA-GEOPH 143 (1994) 425^456.
[16] Y. Gueguen, P. Gavrilenko, M. Le Ravelec, Scales ofrock permeability, Surv. Geophys. 17 (1996) 245^263.
[17] K. Bjorlykke, Lithological controls on £uid £ow in sedi-mentary basins, in: B. Jamtveit, B.W.D. Yardley (Eds.),Fluid Flow and Transport in Rocks: Mechanisms andE¡ects, Chapman and Hall, London, 1996, pp. 15^34.
EPSL 5617 3-11-00 Cyaan Magenta Geel Zwart
S.A. Miller, A. Nur / Earth and Planetary Science Letters 183 (2000) 133^146 145

[18] A. Nur, J. Walder, Time-dependent hydraulics of theearth's crust, in: The Role of Fluids in Crustal Processes,National Academy Press, Washington, DC, 1990, pp.113^127.
[19] S.A. Miller, Y. Ben-Zion, J.P. Burg, A 3-dimensional £u-id-controlled earthquake model: Behavior and implica-tions, J. Geophys. Res. 104 (1999) 10621^10638.
[20] S.A. Miller, W. van der Zee, D.L. Olgaard, J.A. Con-nolly, A £uid-pressure controlled feedback model for de-hydration reactions (2000), submitted.
[21] S.A. Miller, A. Nur, D.L. Olgaard, Earthquakes as acoupled shear stress-high pore pressure dynamical system,Geophys. Res. Lett. 23 (1996) 197^200.
[22] J.S. Caine, J.P. Evans, C.B. Forster, Fault zone architec-ture and permeability structure, Geology 24 (1996) 1025^1028.
[23] J.P. Evans, F.M. Chester, Fluid-rock interaction in faultsof the San Andreas system: Inferences from San Gabrielfault rock geochemistry and microstructures, J. Geophys.Res. 100 (B7) (1995) 13007^13020.
[24] R.H. Sibson, Interactions between temperature and pore£uid pressure during an earthquake faulting and a mech-anism for partial or total stress relief, Nature 243 (1973)66^68.
[25] S. Rojstaczer, S. Wolf, R. Michel, Permeability enhance-ment in the shallow crust as a cause of earthquake-in-duced hydrological changes, Nature 373 (1995) 237^238.
[26] B.R. Hacker, Diagenesis and fault valve seismicity ofcrustal faults, J. Geophys. Res. 102 (1997) 24459^24467.
[27] Y. Gueguen, J. Dienes, Transport properties of rocksfrom statistics and percolation, Math. Geol. 21 (1989)1^13.
[28] Y. Gueguen, C. David, P. Gavrilenko, Percolation net-works and £uid transport in the crust, Geophys. Res.Lett. 18 (1991) 931^934.
[29] P. Bak, C. Tang, Earthquakes as a self-organized criticalphenomenon, J. Geophys. Res. 94 (1989) 635^637.
[30] K. Ito, J. Matzusaki, Earthquakes as self-organized crit-ical phenomena, J. Geophys. Res. 95 (1990) 6853^6860.
[31] J.R. Henderson, I.G. Main, C. Maclean, N.G. Norman,A fracture-mechanical cellular automation model of seis-micity, PAGEOPH 142 (1994) 546^565.
[32] S.A. Wilson, J.R. Henderson, I.G. Main, A cellular auto-mation fracture model: the in£uence of heterogeneity inthe failure process, J. Struct. Geol. 18 (1996) 343^348.
[33] J. Walder, A. Nur, Porosity reduction and pore pressuredevelopment, J. Geophys. Res. 89 (1984) 11539^11548.
[34] P. Segal, J.R. Rice, Dilatancy, compaction, and slip insta-bility of a £uid in¢ltrated fault, J. Geophys. Res. 100(1995) 22155^22171.
[35] T.-f. Wong, S.-C. Ko, D.L. Olgaard, Generation andmaintenance of pore pressure excess in a dehydrating sys-tem, 2, Theoretical analysis, J. Geophys. Res. 102 (1997)841^852.
[36] E.S. Sprunt, A. Nur, Destruction of porosity throughpressure solution, Geophysics 42 (1977) 726^741.
[37] C.L. Angevine, D.L. Turcotte, Porosity reduction by pres-sure solution: A theoretical model for quartz arenites,Geol. Soc. Am. Bull. 94 (1983) 1129^1134.
[38] S.H. Hickman, B. Evans, Kinetics of pressure solution athalite-silica interfaces and intergranular clay ¢lms, J. Geo-phys. Res. 100 (1995) 13113^13132.
[39] J.D. Bredehoeft, B.B. Hanshaw, On the maintenance ofanomalous £uid pressures, I. Thick sedimentary sequen-ces, Geol. Soc. Am. Bull 79 (1968) 1096^1106.
[40] B.B. Hanshaw, J.D. Bredehoeft, On the maintenance ofanomalous £uid pressure, II. Source term at depth, Geol.Soc. Am. Bull. 709 (1968) 1107^1122.
[41] M.L. Blanpied, D.A. Lockner, J.D. Byerlee, An earth-quake mechanism based on rapid sealing of faults, Nature358 (1992) 574^576.
[42] N.H. Sleep, M.L. Blanpied, Creep, compaction and theweak rheology of major faults, Nature 359 (1992) 687^692.
[43] N.H. Sleep, Ductile creep, compaction, and rate and statedependent friction within major fault zones, J. Geophys.Res. 100 (1995) 13065^13080.
[44] F.M. Chester, J.P. Evans, R. Biegel, Internal structureand weakening mechanisms of the San Andreas Fault,J. Geophys. Res. 98 (B1) (1993) 771^786.
[45] J.R. Rice, Fault stress states, pore pressure redistribu-tions, and the weakness of the San Andreas fault, in: B.Evans, T.-f. Wong (Eds.), Fault Mechanics and TransportProperties of Rock, Academic Press, New York, 1992, pp.476^503.
[46] S.-c. Ko, D.L. Olgaard, T.-f. Wong, Generation andmaintenance of pore pressure excess in a dehydrating sys-tem. 1. Experimental and microstructural observations,J. Geophys. Res. 102 (1997) 825^839.
[47] I. Main, B. Ngwenya, S. Elphick, B. Smart, B. Crawford,C. Poux, Scale limits to £uid pressure di¡usion duringrapid self-sealing deformation and £uid £ow, in: M. Au-bertin, F. Hassani, H. Mitri (Eds.), Rock Mechanics,Tools and Techniques, Balkema, Rotterdam, 1996, pp.1161^1167.
[48] D. Stau¡er, A. Aharony, Introduction to PercolationTheory, Taylor and Francis, London, 1992.
[49] J.M. Yeomans, Statistical Mechanics of Phase Transi-tions, Oxford Science, Oxford, 1992.
[50] J.B. Rundle, W. Klein, Scaling and critical phenomena ina cellular automation slider-block model for earthquakes,J. Stat. Phys. 72 (1993) 405^413.
[51] I. Main, Statistical physics, seismogenesis, and seismichazard, Rev. Geophys. 34 (1996) 433^462.
[52] K.G. Wilson, Renormalization group and critical phe-nomena, I. Renormalization group and the Kadino¡ scal-ing picture, Phys. Res. B 4 (1971) 3174^3183.
[53] B. Maillot, S. Nielsen, I. Main, Numerical simulation ofseismicity due to £uid injection in a brittle poro-elasticmedium, Geophys. J. Int. 139 (1999) 263^272.
[54] Y. Okada, Internal deformation due to shear and tensilefaults in a half-space, Bull. Seismol. Soc. Am. 82 (1992)1018^1040.
EPSL 5617 3-11-00 Cyaan Magenta Geel Zwart
S.A. Miller, A. Nur / Earth and Planetary Science Letters 183 (2000) 133^146146

![Plastocyanin conformation. An analysis of its near ultraviolet … · 2017-01-01 · SincethereductionofPCby [Ru(NH3)5(py)]2, is inhibited by [Pt(NH3)6J', Tyr 83 is probably the domi-nant](https://img.pdfslide.us/doc/110x75/5f7b820a1fa459786f71e57f/plastocyanin-conformation-an-analysis-of-its-near-ultraviolet-2017-01-01-sincethereductionofpcby.jpg)


![COMMONALITIES AND PRESCRIPTIONS IN THE VERTICAL … · 1999] CONVERGENCE iN CORPORATE GOVERNANCE Part I of this Article examines the main characteristics of domi-nant models of corporate](https://img.pdfslide.us/doc/110x75/5d631f4f88c993e06a8b54d2/commonalities-and-prescriptions-in-the-vertical-1999-convergence-in-corporate.jpg)


![Nant - Final[1]](https://img.pdfslide.us/doc/110x75/577cdab71a28ab9e78a658a6/nant-final1.jpg)