Embed Size (px)
Citation preview
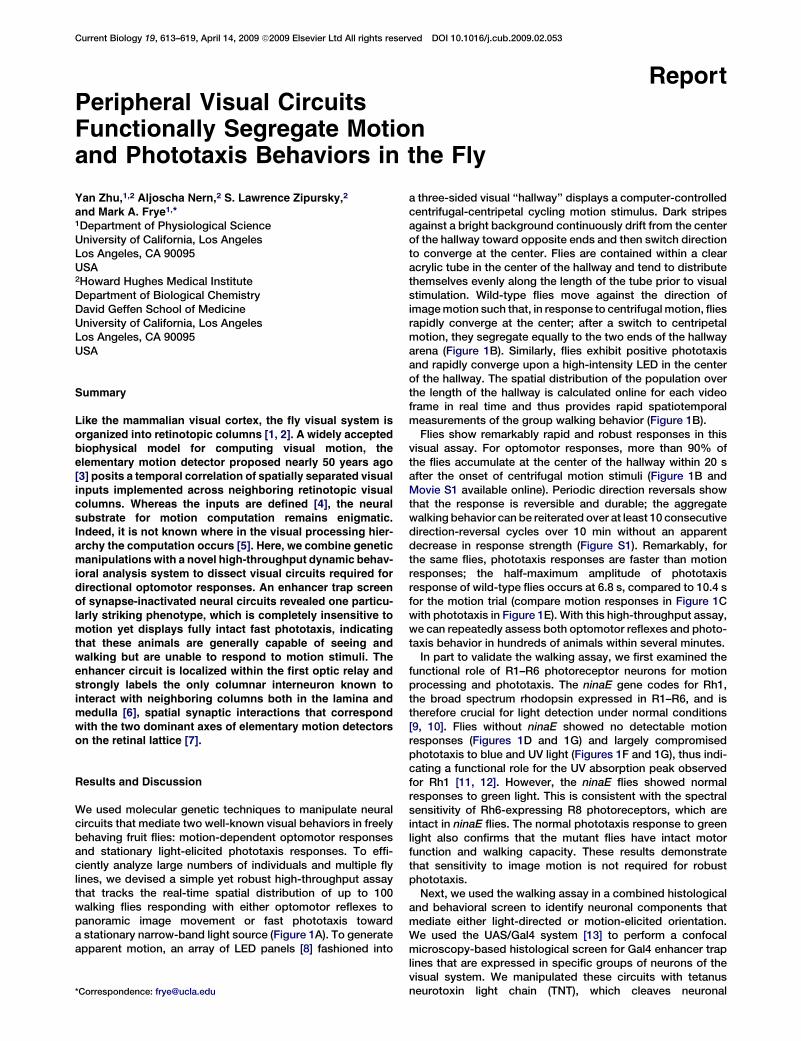
Current Biology 19, 613–619, April 14, 2009 ª2009 Elsevier Ltd All rights reserved DOI 10.1016/j.cub.2009.02.053
ReportPeripheral Visual CircuitsFunctionally Segregate Motionand Phototaxis Behaviors in the Fly
Yan Zhu,1,2 Aljoscha Nern,2 S. Lawrence Zipursky,2
and Mark A. Frye1,*1Department of Physiological ScienceUniversity of California, Los AngelesLos Angeles, CA 90095USA2Howard Hughes Medical InstituteDepartment of Biological ChemistryDavid Geffen School of MedicineUniversity of California, Los AngelesLos Angeles, CA 90095USA
Summary
Like the mammalian visual cortex, the fly visual system is
organized into retinotopic columns [1, 2]. A widely acceptedbiophysical model for computing visual motion, the
elementary motion detector proposed nearly 50 years ago[3] posits a temporal correlation of spatially separated visual
inputs implemented across neighboring retinotopic visualcolumns. Whereas the inputs are defined [4], the neural
substrate for motion computation remains enigmatic.Indeed, it is not known where in the visual processing hier-
archy the computation occurs [5]. Here, we combine geneticmanipulations with a novel high-throughput dynamic behav-
ioral analysis system to dissect visual circuits required for
directional optomotor responses. An enhancer trap screenof synapse-inactivated neural circuits revealed one particu-
larly striking phenotype, which is completely insensitive tomotion yet displays fully intact fast phototaxis, indicating
that these animals are generally capable of seeing andwalking but are unable to respond to motion stimuli. The
enhancer circuit is localized within the first optic relay andstrongly labels the only columnar interneuron known to
interact with neighboring columns both in the lamina andmedulla [6], spatial synaptic interactions that correspond
with the two dominant axes of elementary motion detectorson the retinal lattice [7].
Results and Discussion
We used molecular genetic techniques to manipulate neuralcircuits that mediate two well-known visual behaviors in freelybehaving fruit flies: motion-dependent optomotor responsesand stationary light-elicited phototaxis responses. To effi-ciently analyze large numbers of individuals and multiple flylines, we devised a simple yet robust high-throughput assaythat tracks the real-time spatial distribution of up to 100walking flies responding with either optomotor reflexes topanoramic image movement or fast phototaxis towarda stationary narrow-band light source (Figure 1A). To generateapparent motion, an array of LED panels [8] fashioned into
*Correspondence: [email protected]
a three-sided visual ‘‘hallway’’ displays a computer-controlledcentrifugal-centripetal cycling motion stimulus. Dark stripesagainst a bright background continuously drift from the centerof the hallway toward opposite ends and then switch directionto converge at the center. Flies are contained within a clearacrylic tube in the center of the hallway and tend to distributethemselves evenly along the length of the tube prior to visualstimulation. Wild-type flies move against the direction ofimage motion such that, in response to centrifugal motion, fliesrapidly converge at the center; after a switch to centripetalmotion, they segregate equally to the two ends of the hallwayarena (Figure 1B). Similarly, flies exhibit positive phototaxisand rapidly converge upon a high-intensity LED in the centerof the hallway. The spatial distribution of the population overthe length of the hallway is calculated online for each videoframe in real time and thus provides rapid spatiotemporalmeasurements of the group walking behavior (Figure 1B).
Flies show remarkably rapid and robust responses in thisvisual assay. For optomotor responses, more than 90% ofthe flies accumulate at the center of the hallway within 20 safter the onset of centrifugal motion stimuli (Figure 1B andMovie S1 available online). Periodic direction reversals showthat the response is reversible and durable; the aggregatewalking behavior can be reiterated over at least 10 consecutivedirection-reversal cycles over 10 min without an apparentdecrease in response strength (Figure S1). Remarkably, forthe same flies, phototaxis responses are faster than motionresponses; the half-maximum amplitude of phototaxisresponse of wild-type flies occurs at 6.8 s, compared to 10.4 sfor the motion trial (compare motion responses in Figure 1Cwith phototaxis in Figure 1E). With this high-throughput assay,we can repeatedly assess both optomotor reflexes and photo-taxis behavior in hundreds of animals within several minutes.
In part to validate the walking assay, we first examined thefunctional role of R1–R6 photoreceptor neurons for motionprocessing and phototaxis. The ninaE gene codes for Rh1,the broad spectrum rhodopsin expressed in R1–R6, and istherefore crucial for light detection under normal conditions[9, 10]. Flies without ninaE showed no detectable motionresponses (Figures 1D and 1G) and largely compromisedphototaxis to blue and UV light (Figures 1F and 1G), thus indi-cating a functional role for the UV absorption peak observedfor Rh1 [11, 12]. However, the ninaE flies showed normalresponses to green light. This is consistent with the spectralsensitivity of Rh6-expressing R8 photoreceptors, which areintact in ninaE flies. The normal phototaxis response to greenlight also confirms that the mutant flies have intact motorfunction and walking capacity. These results demonstratethat sensitivity to image motion is not required for robustphototaxis.
Next, we used the walking assay in a combined histologicaland behavioral screen to identify neuronal components thatmediate either light-directed or motion-elicited orientation.We used the UAS/Gal4 system [13] to perform a confocalmicroscopy-based histological screen for Gal4 enhancer traplines that are expressed in specific groups of neurons of thevisual system. We manipulated these circuits with tetanusneurotoxin light chain (TNT), which cleaves neuronal
Current Biology Vol 19 No 7614
A
GE
F
B
C
D
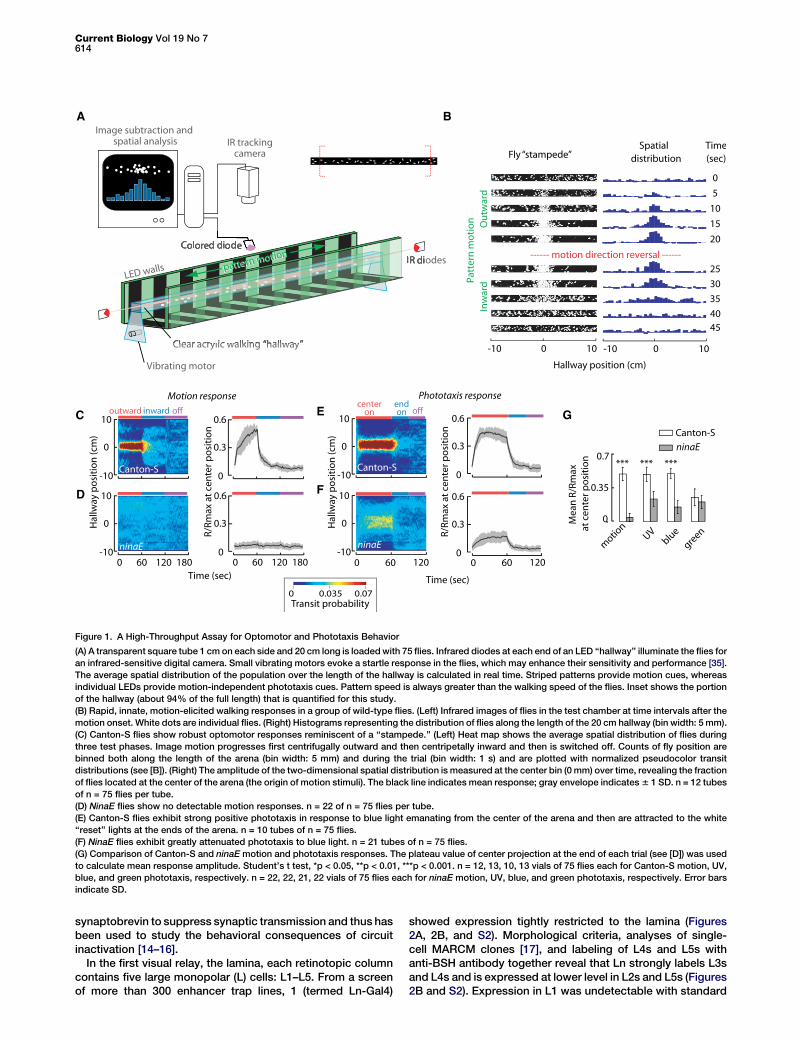
Figure 1. A High-Throughput Assay for Optomotor and Phototaxis Behavior
(A) A transparent square tube 1 cm on each side and 20 cm long is loaded with 75 flies. Infrared diodes at each end of an LED ‘‘hallway’’ illuminate the flies for
an infrared-sensitive digital camera. Small vibrating motors evoke a startle response in the flies, which may enhance their sensitivity and performance [35].
The average spatial distribution of the population over the length of the hallway is calculated in real time. Striped patterns provide motion cues, whereas
individual LEDs provide motion-independent phototaxis cues. Pattern speed is always greater than the walking speed of the flies. Inset shows the portion
of the hallway (about 94% of the full length) that is quantified for this study.
(B) Rapid, innate, motion-elicited walking responses in a group of wild-type flies. (Left) Infrared images of flies in the test chamber at time intervals after the
motion onset. White dots are individual flies. (Right) Histograms representing the distribution of flies along the length of the 20 cm hallway (bin width: 5 mm).
(C) Canton-S flies show robust optomotor responses reminiscent of a ‘‘stampede.’’ (Left) Heat map shows the average spatial distribution of flies during
three test phases. Image motion progresses first centrifugally outward and then centripetally inward and then is switched off. Counts of fly position are
binned both along the length of the arena (bin width: 5 mm) and during the trial (bin width: 1 s) and are plotted with normalized pseudocolor transit
distributions (see [B]). (Right) The amplitude of the two-dimensional spatial distribution is measured at the center bin (0 mm) over time, revealing the fraction
of flies located at the center of the arena (the origin of motion stimuli). The black line indicates mean response; gray envelope indicates 6 1 SD. n = 12 tubes
of n = 75 flies per tube.
(D) NinaE flies show no detectable motion responses. n = 22 of n = 75 flies per tube.
(E) Canton-S flies exhibit strong positive phototaxis in response to blue light emanating from the center of the arena and then are attracted to the white
‘‘reset’’ lights at the ends of the arena. n = 10 tubes of n = 75 flies.
(F) NinaE flies exhibit greatly attenuated phototaxis to blue light. n = 21 tubes of n = 75 flies.
(G) Comparison of Canton-S and ninaE motion and phototaxis responses. The plateau value of center projection at the end of each trial (see [D]) was used
to calculate mean response amplitude. Student’s t test, *p < 0.05, **p < 0.01, ***p < 0.001. n = 12, 13, 10, 13 vials of 75 flies each for Canton-S motion, UV,
blue, and green phototaxis, respectively. n = 22, 22, 21, 22 vials of 75 flies each for ninaE motion, UV, blue, and green phototaxis, respectively. Error bars
indicate SD.
synaptobrevin to suppress synaptic transmission and thus hasbeen used to study the behavioral consequences of circuitinactivation [14–16].
In the first visual relay, the lamina, each retinotopic columncontains five large monopolar (L) cells: L1–L5. From a screenof more than 300 enhancer trap lines, 1 (termed Ln-Gal4)
showed expression tightly restricted to the lamina (Figures2A, 2B, and S2). Morphological criteria, analyses of single-cell MARCM clones [17], and labeling of L4s and L5s withanti-BSH antibody together reveal that Ln strongly labels L3sand L4s and is expressed at lower level in L2s and L5s (Figures2B and S2). Expression in L1 was undetectable with standard
Fly Visual Circuits615
B
C
E F
A
D
G
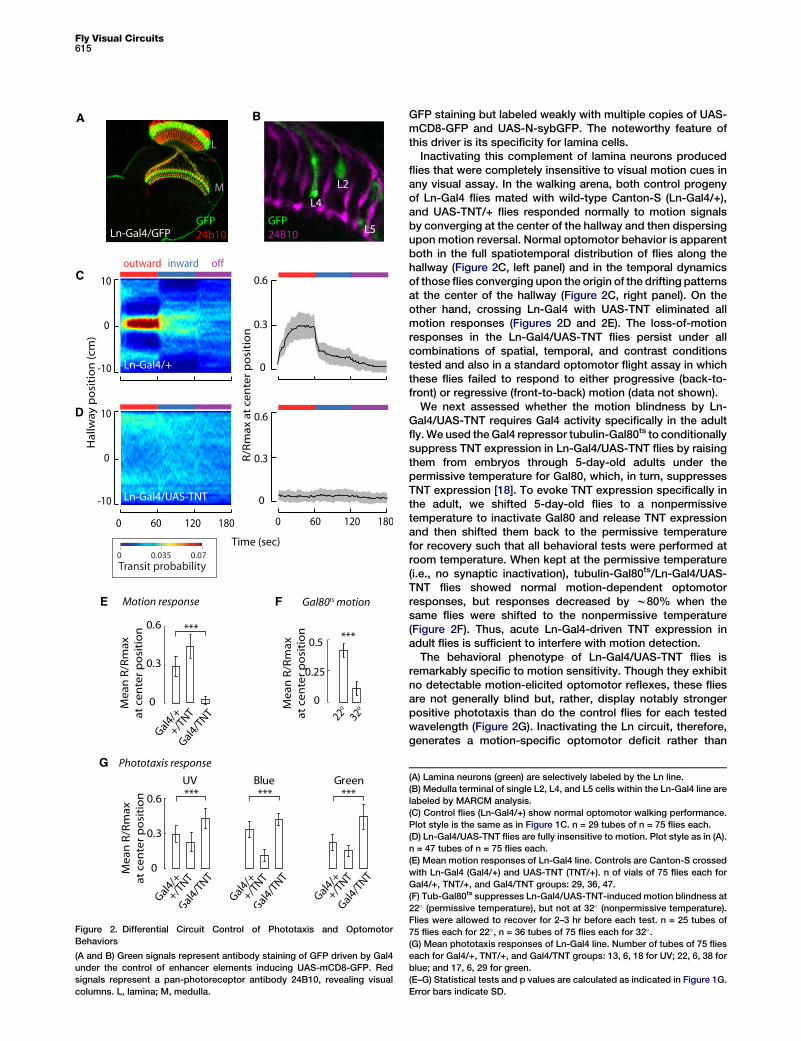
Figure 2. Differential Circuit Control of Phototaxis and Optomotor
Behaviors
(A and B) Green signals represent antibody staining of GFP driven by Gal4
under the control of enhancer elements inducing UAS-mCD8-GFP. Red
signals represent a pan-photoreceptor antibody 24B10, revealing visual
columns. L, lamina; M, medulla.
GFP staining but labeled weakly with multiple copies of UAS-mCD8-GFP and UAS-N-sybGFP. The noteworthy feature ofthis driver is its specificity for lamina cells.
Inactivating this complement of lamina neurons producedflies that were completely insensitive to visual motion cues inany visual assay. In the walking arena, both control progenyof Ln-Gal4 flies mated with wild-type Canton-S (Ln-Gal4/+),and UAS-TNT/+ flies responded normally to motion signalsby converging at the center of the hallway and then dispersingupon motion reversal. Normal optomotor behavior is apparentboth in the full spatiotemporal distribution of flies along thehallway (Figure 2C, left panel) and in the temporal dynamicsof those flies converging upon the origin of the drifting patternsat the center of the hallway (Figure 2C, right panel). On theother hand, crossing Ln-Gal4 with UAS-TNT eliminated allmotion responses (Figures 2D and 2E). The loss-of-motionresponses in the Ln-Gal4/UAS-TNT flies persist under allcombinations of spatial, temporal, and contrast conditionstested and also in a standard optomotor flight assay in whichthese flies failed to respond to either progressive (back-to-front) or regressive (front-to-back) motion (data not shown).
We next assessed whether the motion blindness by Ln-Gal4/UAS-TNT requires Gal4 activity specifically in the adultfly. We used the Gal4 repressor tubulin-Gal80ts to conditionallysuppress TNT expression in Ln-Gal4/UAS-TNT flies by raisingthem from embryos through 5-day-old adults under thepermissive temperature for Gal80, which, in turn, suppressesTNT expression [18]. To evoke TNT expression specifically inthe adult, we shifted 5-day-old flies to a nonpermissivetemperature to inactivate Gal80 and release TNT expressionand then shifted them back to the permissive temperaturefor recovery such that all behavioral tests were performed atroom temperature. When kept at the permissive temperature(i.e., no synaptic inactivation), tubulin-Gal80ts/Ln-Gal4/UAS-TNT flies showed normal motion-dependent optomotorresponses, but responses decreased by w80% when thesame flies were shifted to the nonpermissive temperature(Figure 2F). Thus, acute Ln-Gal4-driven TNT expression inadult flies is sufficient to interfere with motion detection.
The behavioral phenotype of Ln-Gal4/UAS-TNT flies isremarkably specific to motion sensitivity. Though they exhibitno detectable motion-elicited optomotor reflexes, these fliesare not generally blind but, rather, display notably strongerpositive phototaxis than do the control flies for each testedwavelength (Figure 2G). Inactivating the Ln circuit, therefore,generates a motion-specific optomotor deficit rather than
(A) Lamina neurons (green) are selectively labeled by the Ln line.
(B) Medulla terminal of single L2, L4, and L5 cells within the Ln-Gal4 line are
labeled by MARCM analysis.
(C) Control flies (Ln-Gal4/+) show normal optomotor walking performance.
Plot style is the same as in Figure 1C. n = 29 tubes of n = 75 flies each.
(D) Ln-Gal4/UAS-TNT flies are fully insensitive to motion. Plot style as in (A).
n = 47 tubes of n = 75 flies each.
(E) Mean motion responses of Ln-Gal4 line. Controls are Canton-S crossed
with Ln-Gal4 (Gal4/+) and UAS-TNT (TNT/+). n of vials of 75 flies each for
Gal4/+, TNT/+, and Gal4/TNT groups: 29, 36, 47.
(F) Tub-Gal80ts suppresses Ln-Gal4/UAS-TNT-induced motion blindness at
22� (permissive temperature), but not at 32� (nonpermissive temperature).
Flies were allowed to recover for 2–3 hr before each test. n = 25 tubes of
75 flies each for 22�, n = 36 tubes of 75 flies each for 32�.
(G) Mean phototaxis responses of Ln-Gal4 line. Number of tubes of 75 flies
each for Gal4/+, TNT/+, and Gal4/TNT groups: 13, 6, 18 for UV; 22, 6, 38 for
blue; and 17, 6, 29 for green.
(E–G) Statistical tests and p values are calculated as indicated in Figure 1G.
Error bars indicate SD.
Current Biology Vol 19 No 7616
B C
D
A
E
G H
I J
F
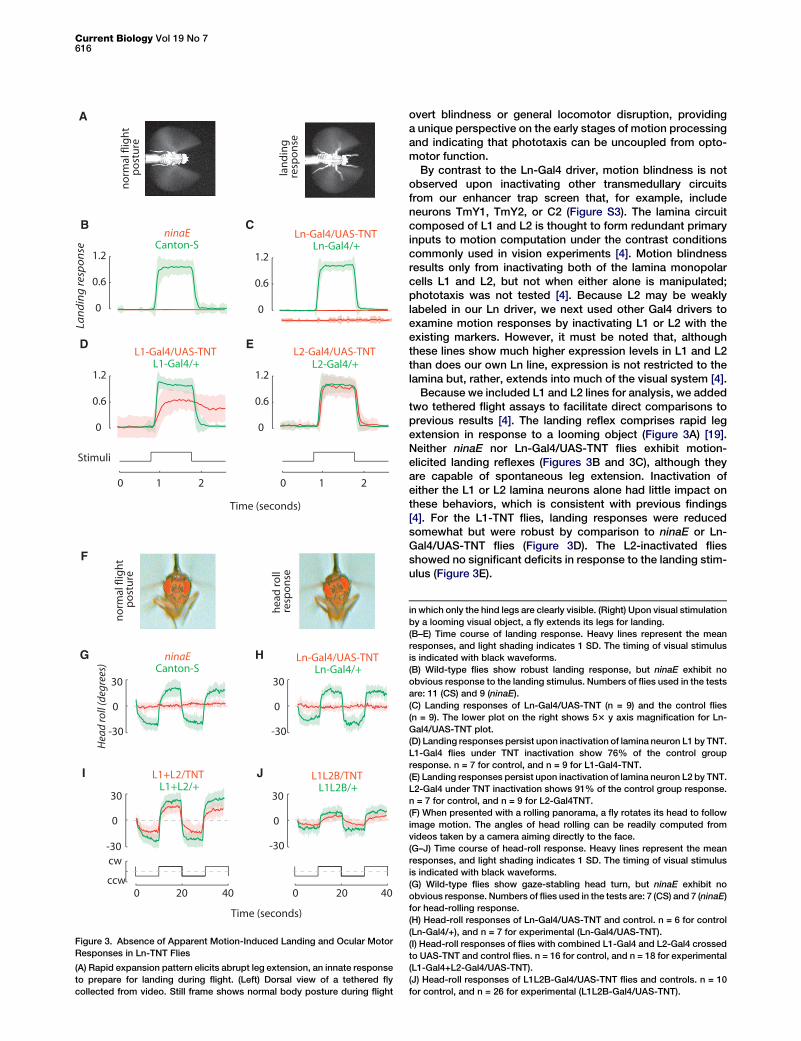
Figure 3. Absence of Apparent Motion-Induced Landing and Ocular Motor
Responses in Ln-TNT Flies
(A) Rapid expansion pattern elicits abrupt leg extension, an innate response
to prepare for landing during flight. (Left) Dorsal view of a tethered fly
collected from video. Still frame shows normal body posture during flight
overt blindness or general locomotor disruption, providinga unique perspective on the early stages of motion processingand indicating that phototaxis can be uncoupled from opto-motor function.
By contrast to the Ln-Gal4 driver, motion blindness is notobserved upon inactivating other transmedullary circuitsfrom our enhancer trap screen that, for example, includeneurons TmY1, TmY2, or C2 (Figure S3). The lamina circuitcomposed of L1 and L2 is thought to form redundant primaryinputs to motion computation under the contrast conditionscommonly used in vision experiments [4]. Motion blindnessresults only from inactivating both of the lamina monopolarcells L1 and L2, but not when either alone is manipulated;phototaxis was not tested [4]. Because L2 may be weaklylabeled in our Ln driver, we next used other Gal4 drivers toexamine motion responses by inactivating L1 or L2 with theexisting markers. However, it must be noted that, althoughthese lines show much higher expression levels in L1 and L2than does our own Ln line, expression is not restricted to thelamina but, rather, extends into much of the visual system [4].
Because we included L1 and L2 lines for analysis, we addedtwo tethered flight assays to facilitate direct comparisons toprevious results [4]. The landing reflex comprises rapid legextension in response to a looming object (Figure 3A) [19].Neither ninaE nor Ln-Gal4/UAS-TNT flies exhibit motion-elicited landing reflexes (Figures 3B and 3C), although theyare capable of spontaneous leg extension. Inactivation ofeither the L1 or L2 lamina neurons alone had little impact onthese behaviors, which is consistent with previous findings[4]. For the L1-TNT flies, landing responses were reducedsomewhat but were robust by comparison to ninaE or Ln-Gal4/UAS-TNT flies (Figure 3D). The L2-inactivated fliesshowed no significant deficits in response to the landing stim-ulus (Figure 3E).
in which only the hind legs are clearly visible. (Right) Upon visual stimulation
by a looming visual object, a fly extends its legs for landing.
(B–E) Time course of landing response. Heavy lines represent the mean
responses, and light shading indicates 1 SD. The timing of visual stimulus
is indicated with black waveforms.
(B) Wild-type flies show robust landing response, but ninaE exhibit no
obvious response to the landing stimulus. Numbers of flies used in the tests
are: 11 (CS) and 9 (ninaE).
(C) Landing responses of Ln-Gal4/UAS-TNT (n = 9) and the control flies
(n = 9). The lower plot on the right shows 53 y axis magnification for Ln-
Gal4/UAS-TNT plot.
(D) Landing responses persist upon inactivation of lamina neuron L1 by TNT.
L1-Gal4 flies under TNT inactivation show 76% of the control group
response. n = 7 for control, and n = 9 for L1-Gal4-TNT.
(E) Landing responses persist upon inactivation of lamina neuron L2 by TNT.
L2-Gal4 under TNT inactivation shows 91% of the control group response.
n = 7 for control, and n = 9 for L2-Gal4TNT.
(F) When presented with a rolling panorama, a fly rotates its head to follow
image motion. The angles of head rolling can be readily computed from
videos taken by a camera aiming directly to the face.
(G–J) Time course of head-roll response. Heavy lines represent the mean
responses, and light shading indicates 1 SD. The timing of visual stimulus
is indicated with black waveforms.
(G) Wild-type flies show gaze-stabling head turn, but ninaE exhibit no
obvious response. Numbers of flies used in the tests are: 7 (CS) and 7 (ninaE)
for head-rolling response.
(H) Head-roll responses of Ln-Gal4/UAS-TNT and control. n = 6 for control
(Ln-Gal4/+), and n = 7 for experimental (Ln-Gal4/UAS-TNT).
(I) Head-roll responses of flies with combined L1-Gal4 and L2-Gal4 crossed
to UAS-TNT and control flies. n = 16 for control, and n = 18 for experimental
(L1-Gal4+L2-Gal4/UAS-TNT).
(J) Head-roll responses of L1L2B-Gal4/UAS-TNT flies and controls. n = 10
for control, and n = 26 for experimental (L1L2B-Gal4/UAS-TNT).
Fly Visual Circuits617
In response to a striped pattern that rotates around the ante-rior-posterior body axis, the fly rotates its head in an attempt tominimize retinal slip (Figure 3F) [4]. Neither landing nor head-roll responses were detected in ninaE flies (Figure 3G), whichconfirms that photoreceptors R1–R6 provide the input forbehaviors requiring motion processing [20]. Similarly, headroll was undetectable in the Ln-Gal4/UAS-TNT flies(Figure 3H). Next, we tested two additional lines with strongGal4 expression in both L1 and L2. One line was created bycombining L1-Gal4 and L2-Gal4, and the other was used ina previous study (L1L2B-Gal4) [4]. Upon TNT inactivation,both lines continue to show significant head-roll responsesby comparison to the controls (Figures 3I and 3J).
This result contrasts with the findings of Rister et al., whoshow that inactivating L1 and L2 together abolishes head-rollreactions. The apparent discrepancy is most likely explainedby the constraints of the different inactivators used by usand Rister et al. Whereas TNT has been widely used in neuro-behavioral genetic analyses, it has been shown to be ineffec-tive in photoreceptors [21] and, as such, might fail to fullyinactivate their postsynaptic targets, including L1 and L2.Rister et al. inactivated L1 and L2 with a temperature-sensitiveallele of shibire [22]. However, the temperature regimerequired for shits strongly interfered with walking behavior inour assay. Although TNT may be minimally effective withinL1 and L2, it is apparently effective in other brain regions, giventhat both of the L1L2/UAS-TNT lines of flies were lethargic andunable to participate in the walking paradigm and, of course,Ln-Gal4/UAS-TNT completely eliminates motion responses.
Therefore, several lines of evidence suggest that, for theLn-Gal4/UAS-TNT phenotype, signaling is preserved throughthe L1 pathway and quite possibly through both L1 and L2.First, using TNT to inactivate these cells has little influenceon motion responses. Second, phototaxis responses to wave-lengths that stimulate photoreceptors R1–R6 and, hence, bothL1 and L2 postsynaptically are fully intact in the Ln-Gal4/UAS-TNT flies (Figure 2). Indeed, the phototaxis responses in theseanimals are significantly stronger than for the intact controls,particularly for green light. Signaling through the lamina wouldaccount for the robust phototaxis behavior because withoutR1–R6 signaling in ninaE flies, phototaxis responses arecompromised (Figures 1F and 1G).
The opposite influence upon optomotor and phototaxisbehavior of inactivating the Ln circuit raises the question ofwhether this is a property unique to the Ln circuit. Wecompared motion and phototaxis responses in the walkingassay and found that any manipulation to L1 or L2 resulted inreduced phototaxis responses to UV. However, phototaxisresponses to green light were not significantly affected (TableS1). This is in direct contrast to the Ln circuit, which enhancesphototaxis responses, particularly for green light.
The remarkable specificity of the Ln driver for lamina circuitscoupled with the stringent behavioral phenotype—motionblindness and enhanced phototaxis—suggests that functionalsegregation of the two behaviors occurs early in the visualpathway. In classical physiological experiments, laminaneurons have been shown to function in tandem with photore-ceptors as light-level adaptive high-pass filters [23, 24].Recent electrophysiological analyses have further suggestedthat the ON-OFF transient response properties of laminaprojection neurons may underlie the remarkably high-perfor-mance discrimination of small objects embedded withina background of visual clutter by downstream target-detectinginterneurons [25]. Our results provide additional genetic and
functional evidence for complex processing within peripheralvisual circuits.
Which neurons implement these computations? TNT doesnot influence motion sensitivity in L1+L2 (Figures 3I and 3J),suggesting that this circuit does not mediate the motion-blindLn phenotype. By using a combination of selective geneticinactivation and selective rescue experiments with L1 andL2, Rister et al. concluded that other lamina neurons (L3 andL5) are neither necessary nor sufficient for motion detection[4], though both receive either direct or indirect input fromthe photoreceptors [6]. Due to the conflicting results ofL1+L2 manipulation, our experiments neither confirm norrefute any potential role of L3 and L5, which are labeled byour Ln driver. However, L4 is strongly labeled by Ln (Figures2 and S2) and is the only lamina cell that provides regularsynaptic connections between neighboring optic columns.Spatiotemporal correlation of light signals from two neigh-boring visual columns is a hallmark of elementary motiondetection. Thus, we are compelled by the hypothesis that inac-tivation of L4, in part, underlies the elimination of motionresponses in our assays.
The topology and ultrastructural organization of L4 within thelamina implicates this neuron for elementary motion computa-tions. In Drosophila, physiological and behavioral studieshave disclosed that the spatial separation of EMD inputs(Figure S4A) corresponds to that of the ommatidia lattice, indi-cating that adjacent visual columns function as paired inputarms of the EMD [26]. In addition, a classic study revealedtwo sets of primary EMDs with approximately equal strengthand oriented across the hexagonal array of the compoundeye at 230� (2X direction) and +30� (+Y direction) with respectto the equator (Figure S4B) [7]. According to SEM reconstruc-tions, there are only two cellular connections between visualcolumns in the lamina: an irregular amacrine network notinvolved in motion processing [4, 5] and an ordered L4 networkthat projects between posteroventral and posterodorsalcolumns [6]. By aligning the coordinate systems of the func-tional and anatomical studies, we found that the topology ofL4 connections precisely matches that of the required inter-connection of EMD arrays; through two sister collaterals,each L4 projects to two L2s in neighboring posteroventral(2X) and posterodorsal (+Y) columns (Figure S4C).
If L4 receives direct input from L2 in the lamina and if L4 iscritical for motion coding, why then does inactivating L2 notproduce motion blindness ([4] and Figures 3E, 3I, and 3J)?One possibility is that input to L4 from an amacrine cell [6]could be amplified under conditions in which L2 input isremoved. Feedback-dependent mechanisms have beenshown to amplify photoreceptor output upon inactivation ofpostsynaptic histamine channels [27]. The anatomical organi-zation of L4 columnar collaterals is observed within both thelamina and the medulla and is conserved across species[28–32]. Therefore, another possibility is that synaptic connec-tions to L4 within the medulla, which are presently enigmatic,may carry the requisite inputs.
Definitive characterization of the specific cell circuit thatis responsible for the remarkable behavioral phenotype ofLn-Gal4/UAS-TNT flies will require advanced histologicalreagents and electrophysiological analyses. The results pre-sented here lay the groundwork by highlighting lamina andmedulla circuits that are vital for conditioning early motionsignals. When considered in conjunction with other recentresults [4, 25, 27], our data emphasize the important role thatlamina circuits play in ultimately orchestrating complex visual
Current Biology Vol 19 No 7618
behaviors such as color vision, phototaxis, and motion-depen-dent optomotor behaviors.
Experimental Procedures
Animals and Preparation
All fly stocks were crossed into a common Canton-S background regardless
of original genetic background. ninaE17 (rh1) was kindly provided by
R. Strauss. The pGal4 enhancer trap collection was kindly provided by
U. Heberlein. Line 11-164, renamed to Ln here, has been recently described
[33]. L1-Gal4, L2-Gal4, and L1L2B-Gal4 were kindly provided by M. Heisen-
berg [4]. The L1-Gal4 and L2-Gal4 were combined to generate the L1+L2-
Gal4 line. Canton-S, tub-Gal80ts (on the second chromosome) was
provided by the Bloomington stock center. Flies were raised at room
temperature (21�–25�C) under 16:8 hr light-dark photoperiod. Crosses
were set up in bottles, and adult flies were collected every 2–3 days for
sorting. Male flies with correct genotypes were isolated and kept in bottles
for at least 2 days before testing. Seventy-five flies 8 days or older posteclo-
sion were loaded into translucent square acrylic tubes (inside dimensions:
200 3 10 3 10 mm, wall thickness 1.5 mm) and sealed at both ends with trans-
parent tape. Rat anti-elav was from the developmental studies hybridoma
bank. Anti-BSH (guinea pig) was described in Schmucker et al. [34].
LED Arena and Visual Behavior Assay
The visual hallway was composed of three rows of six snap-together 8 3 8
dot matrix LED panels controlled with a serial interface and custom software
routines written in Matlab [8]. The top of the hallway is open for imaging. Cell
phone vibrating motors (Digi-KEY) were attached to an acrylic stand sup-
porting the chamber and were activated by computer. Flies were startled
for 10 s before each experimental treatment to evoke optimal locomotor
performance. It has been previously reported that startling flies enhances
phototactic performance [35]. We found no differences in optomotor
walking performance between male and female Canton-S flies. In prelimi-
nary experiments [36], we characterized the optimal motion stimuli:
3.2 cm striped pattern wavelength drifting at 10 cm sec21 and viewed at
a distance of 1 cm. For phototaxis assays, LEDs with peak emissions of
374 nm (UV), 474 nm (blue), and 531 nm (green) were used. These emission
peaks match the absorption peaks of Rh1 (480 nm), Rh4 (375 nm), and
approximate Rh5 (435 nm) and Rh6 (508 nm). White LEDs have a broad
continuous emission range from 450 nm to 650 nm and were used to
draw animals back toward the ends of the walking hallway. Infrared reflec-
tance images of the flies were captured with a firewire camera (BASLER
A601f) equipped with 850 nm long-pass filters (Edmund Scientific). Images
were collected and processed at a frame rate of 5 Hz.
Image Analysis
Each image was collected and thresholded to a binary black and white
image. The length of the arena was divided into 40 5 mm sections, and
the total pixel intensity within each section was measured. The chamber
allowed flies to crawl on all four sides. This allows the maximum degrees
of behavioral freedom because flies can walk past one another on the floors,
walls, or ceiling of the arena. By design, flies converging upon the center of
the arena may, therefore, occlude one another from the camera view. Thus,
we are conservatively underestimating the true amplitude of the transit
probability histogram. However, we can clearly detect that flies converging
on the center of the arena have vacated the surrounding regions, and
because this is a closed system, we have an accurate measurement of
the flies’ locations. We established a baseline group transit distribution by
monitoring the 75 flies for 3 min and then finding the video frame that
showed the largest total pixel intensity due to the broadest spatial distribu-
tion of flies. This single frame served as a baseline against which to
normalize the stimulus-evoked changes in transit distribution. Thus, at
any time point, the center distribution is defined as the fraction of flies accu-
mulating within the central 30 mm of the arena minus the distribution that
would occur in this region solely by chance, or: center distribution = (sum
of nonzero pixels at center region)/(maximum of overall nonzero pixels of
the whole chamber) – baseline distribution. For the bar graphs, the mean
response is defined as the amplitude of the center transit distribution during
the last 10 s of the centrifugal test condition (for motion responses) or
central point source light-emitting diode ON (for phototaxis).
Tethered Flight, Landing, and Head-Roll Assays
Visual experiments with tethered flight were performed as previously
described [37]. Stimuli were composed of either a single vertical stripe 30�
wide or a uniform pattern of vertical stripes moving at a contrast frequency
of 12 Hz. In the landing test, tethered flies were presented with high-contrast
looming (expanding) square from the front while the dorsal view of the fly
was video recorded at 30 Hz. The image areas around the extended forelegs
were analyzed by custom software that compared the pixel intensity result-
ing from leg extension to the intensity of the thorax of the same fly in order to
control for body size variations. We then normalized the resulting time-
varying changes in local image intensity to the maximum values exhibited
by wild-type flies. In the head-roll assay, a drum-shaped LED arena
projected a rolling image of stripes around the longitudinal body axis of
a tethered fly. A video camera recorded the frontal image of the head and
digitized this view at 15 Hz. The resulting image was analyzed for the angular
deviation of the head around the body axis. By convention, clockwise rota-
tion is indicated by positive values.
Histology
Immunostaining of adult fly brains, confocal analysis, and MARCM was
performed as previously described [33]. Identification of cell types was
based on description of previous Golgi staining [38].
Gal80ts with Temperature Shift
Flies with tubulin-Gal80ts were raised at room temperature (22�). Adult
flies (75) were placed into a prewarmed bottle and kept at 32�F for 18 hr.
Afterward, flies were transferred into another bottle and kept at room
temperature to recover for 2 hr prior to experiments (all performed at
room temperature).
Supplemental Data
Supplemental Data include four figures, one table, and one movie and can
be found with this article online at http://www.current-biology.com/
supplemental/S0960-9822(09)00806-9.
Acknowledgments
We thank outstanding undergraduates J. Hu, V. Choi, and P. Bautista for
data collection and fly care. This work was supported by grants from the
Whitehall Foundation (2006-12-10) and National Science Foundation (IOS-
0718325) to M.A.F.
Received: September 23, 2008
Revised: February 19, 2009
Accepted: February 20, 2009
Published online: March 19, 2009
References
1. Meinertzhagen, I.A., and Hanson, T.E. (1993). The development of the
optic lobe. In The Development of Drosophila melanogaster, Volume II,
M. Bate and A.M. Arias, eds. (Cold Spring Harbor, NY: Cold Spring
Harbor Laboratory), pp. 1363–1491.
2. Clandinin, T.R., and Zipursky, S.L. (2002). Making connections in the fly
visual system. Neuron 35, 827–841.
3. Hassenstein, B., and Reichardt, W. (1956). Systemtheoretische analyse
der zeit-, Reihenfolgen- und vorzeichenauswertung bei der bewegung-
sperzeption des russelkafers Cholorophanus. Zeitschrift fur Naturfor-
schung B 11, 513–524.
4. Rister, J., Pauls, D., Schnell, B., Ting, C.Y., Lee, C.H., Sinakevitch, I.,
Morante, J., Strausfeld, N.J., Ito, K., and Heisenberg, M. (2007). Dissec-
tion of the peripheral motion channel in the visual system of Drosophila
melanogaster. Neuron 56, 155–170.
5. Borst, A. (2009). Drosophila’s view on insect vision. Curr. Biol. 19,
R36–R47.
6. Meinertzhagen, I.A., and O’Neil, S.D. (1991). Synaptic organization of
columnar elements in the lamina of the wild type in Drosophila mela-
nogaster. J. Comp. Neurol. 305, 232–263.
7. Buchner, E. (1976). Elementary movement detectors in an insect visual
system. Biol. Cybern. 24, 85–101.
8. Reiser, M.B., and Dickinson, M.H. (2007). A modular display system for
insect behavioral neuroscience. J. Neurosci. Methods 167, 127–139.
9. Smith, D.P., Stamnes, M.A., and Zuker, C.S. (1991). Signal transduction
in the visual-system of Drosophila. Annu. Rev. Cell Biol. 7, 161–190.
Fly Visual Circuits619
10. Strauss, R., Renner, M., and Gotz, K. (2001). Task-specific association
of photoreceptor systems and steering parameters in Drosophila.
J. Comp. Physiol. [A] 187, 617–632.
11. Britt, S.G., Feiler, R., Kirschfeld, K., and Zuker, C.S. (1993). Spectral
tuning of rhodopsin and metarhodopsin in vivo. Neuron 11, 29–39.
12. Kirschfeld, K., Franceschini, N., and Minke, B. (1977). Evidence for
a sensitizing pigment in fly photoreceptors. Nature 269, 386–390.
13. Brand, A.H., and Perrimon, N. (1993). Targeted gene expression as
a means of altering cell fates and generating dominant phenotypes.
Development 118, 401–415.
14. Neuser, K., Triphan, T., Mronz, M., Poeck, B., and Strauss, R. (2008).
Analysis of a spatial orientation memory in Drosophila. Nature 453,
1244–1247.
15. Hong, S.T., Bang, S., Hyun, S., Kang, J., Jeong, K., Paik, D., Chung, J.,
and Kim, J. (2008). cAMP signalling in mushroom bodies modulates
temperature preference behaviour in Drosophila. Nature 454, 771–775.
16. Ejima, A., Smith, B.P., Lucas, C., van der Goes van Naters, W., Miller,
C.J., Carlson, J.R., Levine, J.D., and Griffith, L.C. (2007). Generalization
of courtship learning in Drosophila is mediated by cis-vaccenyl acetate.
Curr. Biol. 17, 599–605.
17. Lee, T., and Luo, L. (1999). Mosaic analysis with a repressible cell marker
for studies of gene function in neuronal morphogenesis. Neuron 22,
451–461.
18. McGuire, S.E., Le, P.T., Osborn, A.J., Matsumoto, K., and Davis, R.L.
(2003). Spatiotemporal rescue of memory dysfunction in Drosophila.
Science 302, 1765–1768.
19. Tammero, L.F., and Dickinson, M.H. (2002). Collision avoidance and
landing responses are mediated by separate pathways in the fruit fly,
Drosophila melanogaster. J. Exp. Biol. 205, 2785–2798.
20. Yamaguchi, S., Wolf, R., Desplan, C., and Heisenberg, M. (2008). Motion
vision is independent of color in Drosophila. Proc. Natl. Acad. Sci. USA
105, 4910–4915.
21. Rister, J., and Heisenberg, M. (2006). Distinct functions of neuronal syn-
aptobrevin in developing and mature fly photoreceptors. J. Neurobiol.
66, 1271–1284.
22. Kitamoto, T. (2001). Conditional modification of behavior in Drosophila
by targeted expression of a temperature-sensitive shibire allele in
defined neurons. J. Neurobiol. 47, 81–92.
23. Laughlin, S.B., and Hardie, R.C. (1978). Common strategies for light
adaptation in the peripheral visual systems of fly and dragonfly.
J. Comp. Physiol. 128, 319–340.
24. Van Hateren, J.H. (1992). Theoretical predictions of spatiotemporal
receptive-fields of fly Lmcs and experimental validation. J. Comp.
Physiol. 171, 157–170.
25. Wiederman, S.D., Shoemaker, P.A., and O’Carroll, D.C. (2008). A model
for the detection of moving targets in visual clutter inspired by insect
physiology. PLoS ONE 3, e2784.
26. Gotz, K.G. (1964). Optomotorische Untersuchung des visuellen systems
einiger Augenmutanten der Fruchtfliege Drosophila. Kybernetik 2,
77–92.
27. Zheng, L., de Polavieja, G.G., Wolfram, V., Asyali, M.H., Hardie, R.C., and
Juusola, M. (2006). Feedback network controls photoreceptor output at
the layer of first visual synapses in Drosophila. J. Gen. Physiol. 127,
495–510.
28. Braitenberg, V., and Debbage, P. (1974). Regular net of reciprocal
synapses in visual system of fly, Musca-Domestica. J. Comp. Physiol.
90, 25–31.
29. Strausfeld, N.J., and Campos-Ortega, J.A. (1973). The L4 monopolar
neurone: A substrate for lateral interaction in the visual system of the
fly Musca domestica (L.). Brain Res. 59, 97–117.
30. Strausfeld, N.J. (1971). Organization of insect visual system (light
microscopy). 1. Projections and arrangements of neurons in lamina
ganglionaris of Diptera. Z. Zellforsch. Mikrosk. Anat. 121, 377–441.
31. Strausfeld, N.J., and Braitenberg, V. (1970). Compound eye of fly
(Musca-Domestica) - Connections between cartridges of lamina
ganglionaris. Zeitschrift Fur Vergleichende Physiologie 70, 95–104.
32. Takemura, S.Y., Lu, Z., and Meinertzhagen, I.A. (2008). Synaptic circuits
of the Drosophila optic lobe: The input terminals to the medulla.
J. Comp. Neurol. 509, 493–513.
33. Nern, A., Zhu, Y., and Zipursky, S.L. (2008). Local N-cadherin interac-
tions mediate distinct steps in the targeting of lamina neurons. Neuron
58, 34–41.
34. Schmucker, D., Clemens, J.C., Shu, H., Worby, C.A., Xiao, J., Muda, M.,
Dixon, J.E., and Zipursky, S.L. (2000). Drosophila Dscam is an axon
guidance receptor exhibiting extraordinary molecular diversity. Cell
101, 671–684.
35. Benzer, S. (1967). Behavioral mutants of Drosophila isolated by counter-
current distribution. Proc. Natl. Acad. Sci. USA 58, 1112–1119.
36. Zhu, Y., Bautista, P., Padhiar, M., Zipursky, S.L., and Frye, M. (2006).
The fly stampede: Dynamics of visually forced walking behavior in
a large group of Drosophila. Program no. 449.25/W2, Atlanta, GA:
Society for Neuroscience Online.
37. Duistermars, B.J., Reiser, M.B., Zhu, Y., and Frye, M.A. (2007). Dynamic
properties of large-field and small-field optomotor flight responses in
Drosophila. J. Comp. Physiol. A. Neuroethol. Sens. Neural Behav.
Physiol. 193, 787–799.
38. Fischbach, K.F., and Dittrich, A.P.M. (1989). The optic lobe of Drosophila
Melanogaster. 1. A golgi analysis of wild-type structure. Cell Tissue Res.
258, 441–475.