Embed Size (px)
Citation preview

Library Acquisitions: Practice & Theory, Vol. 16, pp. 3-19, 1992 Printed in the USA. All rights reserved.
0364~6408/92 $5.00 + .oO
Copyright 0 1992 Pergamon Press plc
PERIODICAL PRICES, 1989-1991
ADRIAN W. ALEXANDER
Regional Manager, Western U.S.
The Faxon Co.
15 Southwest Park
Westwood, MA 02090
This annual comparative periodical price study is the eighteenth compilation in a continu- ous series of studies published by The Faxon Company since 1974. The price reviews in this series compare periodical prices and identify price changes, patterns, and trends over the most recent three-year time period. The purpose of these analytical price studies is to provide cur- rent and historical price data for use in planning and developing library serials budgets for both domestic and non-U.S. source serialized titles.
Interpretive material contained in this article is similar to that appearing in earlier studies in this series, but some tables have been altered in this compilation. These changes are noted in the “Table Explanations and Commentary” section. The order of the tables also has been changed, and one table, which has appeared regularly in previous versions of this study, has been discontinued. That table was a comparison of multiple-year subscription rates for titles indexed in the The Reader’s Guide to Periodical Literature.
This periodical pricing study series appeared from 1974 to 1980 in Library Journal, and, from 1981 to 1990, in The Serials Librarian [l]. The price study analyzes and measures the average and weighted prices for both prepaid and bill-later titles included in the global Faxon title database, which contains bibliographic records for over 200,000 serial and periodical ti- tles. Average prices are based on all active titles in the Faxon database within a given cate- gory. Weighted prices included in this review reflect the order activities of Faxon’s 25,000+ client base in the United States and are included in order to provide comparison with the over- all average price, which may be affected by the inclusion of inordinately expensive or inex- pensive, but seldom ordered, titles. Similarly, the latest reviews in this series reflect the fact that the bulk of orders placed by Faxon increasingly are for academic and other research li- braries in the United States.
The global nature of the data sources used in this study may not always relate to the spe- cific serials ordering activity of any one library. Care should therefore be exercised in using the pricing information presented in this series to project future budget requirements for a par- ticular library. Each individual library’s title list and serials budget is designed to conform to the needs and resources of that institution. These institutional requirements will not always match the more generalized results represented in the tables included in this compilation. Fac- tors such as the ratio of domestic to non-U.S. published titles, the nature and orientation of the subject disciplines reflected in the title list, and the influence of multiple-year subscription pricing discounts are potentially influential in calculating the serials pricing climate for any specific library situation.
3

4 A. W. ALEXANDER
Average and weighted prices shown in the tables that follow reflect the publishers’ list prices and do not include additional service charges for value-added subscription management ser- vices from Faxon. Titles that have experienced ordering activity for each of the three years represented in the study are included in the compilation. Weighted price averages distribute different values to individual categories of periodicals and serials, based on the relative num- ber of Faxon orders for each of the three years covered by the study. Thus, if a specific title has no order activity in the Faxon database for a particular year, this title is not represented in the average weighted pricing information.
TABLE EXPLANATIONS AND COMMENTARY
Table I, arranged according to the initial two-letter Library of Congress classification code, compares the average and weighted price changes of 59 different categories and subcategories for the three-year period of study, Ten subject areas experienced increases in average price for 1991 of 20 percent or more over 1990 average prices. Motor Vehicles and Aeronautics had the highest increase (32.6%), followed by Law (25.4%), Commerce (25.4%), Physics (23.60’10), Manufactures (22.8%), Geography-General (21.4070), General & Civil Engineering (21.4Oro), Chemistry (20.4%), Bibliography & Library Science (20.4%), and Transportation & Commu- nications (20.3%). The category with the highest average price was Chemistry at $742.72, fol- lowed by Physics at $519.50. These were the only two categories with average prices over $500.00, but Physiology was close at $490.96.
Eight subject areas experienced increases in average price for 1991 of 20 percent or more over 1990 weighted prices, Chemical Technology showed the highest increase (37.8%), fol- lowed by Botany (27.50/o), Therapeutics & Pharmacology (24.0%), General & Civil Engineer- ing (22.3%), Law (21.4010), Chemistry (21.3%), Technology-General (21 .O%), and Physics (20.9~0). The category with the highest weighted price was Chemistry at $953.58, followed once again by Physics at $787.03, and Physiology at $581.24. No other categories had weighted prices for 1991 exceeding $500.00.
Table 2, using the same format as Table 1, presents average and weighted prices and per- centage changes arranged by country of publication and includes those countries with twenty (20) or more titles on file in the Faxon database. This table is based on country of publica- tion designations defined in the USMARC standard.
The average 1991 price of titles published in the United States was $168.54, representing a 6.1% increase over the 1990 average price of $158.78. The weighted 1991 price of U.S. titles was $167.45, which was 9.2% higher than the 1990 weighted price of $153.34.
In order to accommodate last year’s important political changes in Germany, Faxon has reassigned those titles previously designated as published in the German Democratic Repub- lic (East Germany) to the category for the Federal Republic of Germany (West Germany). An apparent result of this consolidation in 1991 has been a net decrease from 1990 in the aver- age price, from $185.23 to $180.77 (-2.4oio), since the average price for East German titles in 1990 was only $92.49. The weighted price for 1991, however, increased by 6.9% over 1990, from $424.28 to $453.62, indicating that the bulk of actual order activity in 1991 was for West German titles.
Dutch titles increased in average price in 1991 by 18.9% over the 1990 average price, from $387.74 to $461.07. The increase in weighted price for 1991 was almost double that figure, however, at 35.8%; from $524.56 in 1990 to $712.21 in 1991.
LC
AN AP B
BF BX D
DS E F G
GV t-l
HB HC HD HE HF HG HJ HM HO HV J K L
LB N P
PN
0 OA OB oc OD OE OH OK OL OP OR
R RA RC RD RK RM RT s
SB SF T
TA TJ TK TL TP TS TX 2
Periodical Prices, 1989-1991
TABLE 1A
PRICE COMPARISON BY SELECTED LIBRARY OF CONGRESS CLASSIFICATION -AVERAGE 1 -YEAR PRICE
CLASSIFICATION
Newspapers Periodicals-General Philosophy-General Psychology Denominations 8 Sects History-General 8 Old World History-Asia History-America, General History-America Geography-General Recreation Social Sciences-General Economics Economic History 8 Conditions Land, Agriculture 8 Industry Transportation 8 Communications Commerce Finance Public Finance Sociology-General Social Groups Social 8 Public Welfare: Criminology Political Science Law Education-General Theory 8 Practice of Education Fine Arts-Visual Arts Philology & Linguistics Literature History 8 Collections-Gen
Science-General Mathematics Astronomy Physics Chemistry Geology Natural History Botany Zoology Physiology Microbiology Medicine-General Public Aspects of Medicine Internal Medicine Surgery Dentistry Therapeutics. Pharmacology Nursing Agriculture-General Plant Culture Animal Culture Technology-General General 8 Civil Engineering Mechanical Engineering 8 Machinery Electrical Eng. Nuclear Eng. Motor Vehicles. Aeronautics Chemical Technology Manufactures Home Economics Bibliography 8 Library Science
NC. OF PRICED TITLES AVERAGE l-YEAR PRICE %CMM3E %CHANGE
1989 1990 1991
1463 1934 2633 552 723 861
1316 1649 1991 279 296 376 345 426 498 669 1068 1300 292 337 409 217 257 317 454 746 940 946 1113 1376 493 586 743
4762 6275 6264 166 221 266 543 628 728
1088 1325 1769 324 444 610 794 1146 1560 684 973 1391
65 103 140 132 159 194 173 250 339 321 450 560 540 675 022
1169 1412 1871 681 1036 1298 418 482 617 466 653 944
1345 1707 2135 514 679 842
4203 4895 6181 662 911 1282 106 113 129 057 927 1155 500 565 698 253 276 334 509 577 746 165 190 225 347 383 430 313 362 437 150 168 206
3147 4199 5292 354 497 710 919 1221 1442 217 300 351 169 198 241 248 323 431 141 198 236
1249 1465 1801 342 410 515 336 409 505
4042 5011 6859 449 559 752 402 410 499 564 755 1204 301 379 466 591 714 910 370 457 644 209 252 332
1111 1211 1414
1989 1990 1991 99/90 QO/Ql
153.46 154.03 146.30 63.43 75.81 78.30 50.64 49.19 48.90
101.66 104.89 105.61 27.99 30.27 29.66 72.50 74.15 75.33 64.54 70.51 76.43 45.32 43.26 41.91 30.37 35.52 35.32 63.36 63.78 77.40 35.79 37.79 45.09
151.20 176.63 200.09 123.94 144.04 155.25 158.48 152.75 159.92 129.96 160.76 191.71 131.69 149.73 180.07 131.43 170.52 213.77 329.00 367.11 373.42 128.06 180.04 206.46 106.54 110.26 109.25 69.43 63.65 68.31 88.30 102.72 106.49
104.77 108.98 118.35 113.29 132.65 166.31 62.25 63.73 66.71 65.70 65.50 67.55 66.25 67.48 73.07 46.10 48.00 49.37 48.01 49.99 51.94
321.12 333.75 393.41 Z76.89 303.70 329.20 233.42 234.76 273.51 376.49 420.14 519.50 591.41 616.78 742.72 193.61 208.22 232.51 307.50 287.80 324.65 173.24 164.84 182.40 157.55 146.42 162.60 113.19 416.44 490.96 357.43 339.51 378.92 154.82 161.28 186.23 131.67 146.15 157.44 162.66 170.37 187.93 133.79 143.60 157.37 67.43 71.87 79.06
210.45 227.87 249.22 58.36 63.82 69.18 91.39 81.98 89.27
108.21 87.97 92.35 92.33 79.62 88.86
181.66 198.19 232.21 200.64 229.23 276.27 266.17 266.66 313.98 242.35 254.78 300.40 122.79 130.15 172.56 179.88 210.23 249.26 111.11 120.87 148.48 89.19 97.72 105.69
0.4% -5.0% 19.5% 3.3% -2.9% -0.6% 3.2% 0.7% 8.1% -2.0% 2.3% 1.6% 9.3% 6.4%
-4.5% -3.2% -7.4% -0.6% 0.7% 21.4% 5.6% 19.3%
16.8% 13.3% 16.2% 7.8% -3.6% 4.7% 23.7% 19.3% 13.7% 20.3% 29.7% 25.4% 11.6% 1.7% 40.6% 14.7%
3.5% -0.9% -8.0% 7.0% 16.3% 3.7%
4.0% 8.6% 17.1% 25.4%
2.4% 4.7% -0.3% 3.1%
l.% 8.3% 4.1% 2.9% 2.4% 3.9% 3.996 17.9% 9.7% 0.4% 0.6% 16.5%
11.6% 23.6% 4.3% 20.4% 7.5% 11.7%
-6.4% 12.6% -4.6% 10.7% -7.1% 1 1 1%
0.8% 17.9% -5.3% 11.6% 4.2% 15.5%
11 .O% 7.7% 4.7% 10.3% 7.3% 9.6% 6.6% 10.0% 8.3% 9.4% 9.4% 8.4%
-1 0.3% 8.9% -18.7% 5.0% -13.8% 11.6%
9.0% 17.2% 14.2% 21.4%
0.2% 17.7% 5.1% 17.9% 6.0% 32.6%
16.9% 1.56% 8.8%. 22.8% 9.6% 6.2%
184.64 187.36 225.52 1.5% 20.4%

A. W. ALEXANDER
TABLE 1B PRICE COMPARISON BY SELECTED LIBRARY OF CONGRESS
CLASSIFICATION-WEIGHTED PRICE
LC CtAS9lFlCATlON 1989 1990 1991 89/90 so/91
AN Newspapers AP Periodicals-General
B Philosophy-General BF Psychology BX Denominations 5 Sects D Histo~~enerat & OM World
DS History-Asia E History-America, General F History-America 0 Geography-General
GV Recreation H Social Sciences-General
HB Economics HC Economic History & Conditions HO Land, Agricricufture 8 industry HE Transportation 8 Communications HF Commerce HG Finance HJ Public Finance HM Sociology-General HQ Social Groups HV Social & Public Wetfare: Criminol~y J Political Science K Law L Education-General
LB Theory & Practice of Education N Fine Arts-Visual Arts P Philology 8 Linguistics
PN Literature History & Collections-Gen
0 Science-General GA Mathematics 08 Astronomy QC Physics QD Chemistry QE Geology OH Natural History OK Botany QL Zoology QP Physiology QR Microbiology R Medicine-General
RA Public Aspects of Medicine RC Internal Medicine
RD Surgery RK Dentistry Rh4 Therapeutics. Pharmacology RT Nursing S Agriculture-General
SE Plant Culture SF Animal Culture T Technology-General
TA General 8 Civil Engineering TJ Mechanical Engineering 8 Machinery TK Electrical Eng. Nuclear Eng. TL Motor Vehicles. Aeronautics TP Chemical Technology TS Manufactures TX Home Economics z Bibliography 8 Library Science
196.50 201.76 213.47 54.93 59.42 61.93 92.66 96.17 99.65
140.86 146.59 154.77 38.77 40.71 33.94 90.51 87.05 83.98 72.63 75.59 73.50 58.49 54.69 53.09 47.25 51.51 47.30 82.68 88.22 101.76 53.59 54.39 58.48 127.27 137.19 150.39 124.68 133.20 142.55 133.47 127.17 139.85 119.69 136.62 156.09 117.17 134.46 149.66 96.05 106.72 120.46
243.39 244.47 286.05 139.30 148.93 169.16 135.49 132.50 139.06 94.65 103.16 113.66
109.45 126.33 134.83 120.32 130.97 145.20 75.71 87.42 106.17 74.04 76.75 82.15 72.46 75.08 76.24 70.11 73.52 79.02 56.28 56.70 54.90 53.45 53.86 54.17
356.68 390.32 457.41 211.98 229.19 246.74 249.39 290.21 335.74 556.62 650.98 787.03 735.39 786.38 953.56 236.96 251.62 292.58 366.19 410.64 457.14 215.51 224.11 285.73 200.02 231.74 270.81 459.55 490.06 581.24 363.49 378.81 438.75 138.08 149.45 168.94 137.70 143.57 155.91 148.53 160.45 180.76 120.39 128.32 145.06 93.56 101.15 114.75
379.77 211.10 263.72 75.67 73.06 82.51 118.10 119.93 129.73 128.46 131.31 134.53 122.34 109.74 121.24 162.06 186.20 225.33 246.74 298.96 365.54 234.22 238.77 271.44 172.87 194.56 222.36 121.95 130.62 149.58 207.54 231.42 318.99 93.97 106.89 127.22 73.65 81.80 91.07
2.7% 5.8% 8.2% 4.2% 5.9% 1.5% 4.1% 5.6% 5.0% -16.6%
-3.8% -3.5% 4.1% -2.8X -6.5% -2.9% 9.0% -8.2% 6.7% 15.3% 1.5% 7.5% 7.8% 9.6% 6.8% 7.9% -4.7% 10.0% 14.1% 15.7% 14.8% 11.3% 1 1 1 % 12.9% 0.4% 6.8% 6.9% 33.6%
-2.2% 5.0% 9.0% 10.2%
15.4% 6.6% 8.9% 10.9%
15.5% 21.4% 3.7% 7.0% 3.6% 4.2% 4.% 7.5% 0.7% -3.2% 0.8% 0.6% 9.4% 17.% 8.3% 8.5%
16.4% 15.7% 17.0% 20.9% 6.9% 21.3% 6.2% 16.3%
12.1% 11.3% 4.0% 27.5%
15.9% 16.8% 6.6% 18.6% 4.2% 15.8% 8.% 13.0% 4.3% 8.6% 8.0% 12.7% 6.6% 13.1% 8.1% 13.4%
17.4% 24.0% -3.4% 12.9% 1.5% 8.2% 2.2% 2.5%
-10.3% 10.5% 14.9% 21 .O% 21.2% 22.3% 1.9% 13.7%
12.6% 14.3% 7.1% 14.5%
11.5% 37.8% 13.7% 19.0% 10.8% 11.3%
163.74 164.36 179.21 0.4% 9.0%
WEtGKtED PRICE %Ct+u?3E KCHANGE 1

Periodical Prices, I989-1991
TABLE ZA PRICE COMPARISON BY COUNTRY OF PUBLICATION-AVERAGE
I-YEAR PRICE
S-AG U-AT E-AU E-EIE A-EW S-%1 E-W N*CN S-CL S-CK
E-CS E-DK F-UA E-GW E-F1 E-FR EGE EGR A-HK E-HU A-II A-IO E-IE A-IS E-IT rw.M A-JA F-KE A-LE E-LU A-MY N-MX E-NE U-NZ F-NR E”N0 A-PK A-CC S-PE A-PH E-PC E-PO E-RM A-SI F-SA A-KO E-UR E-SP A-CE &SW E-SZ A-CH A-TH A-7-U E-UK N-US S-VE E-YU F-RH
Argentina Australia Austria Belgium Banglad~b Brazil Buigaria Canada Chlie Colombia Costa Ri Czeehoslovekia Dsnmark
Egwt Fed. Republic German Finland France German Oem. Republic Greece Hong Kong Hungary India Indonesia Ireland Israel Italy Jamaica Japan Kenya Lebatwn Luxembourg Malaysia Mexico Netherlands New Zealand Nigeria Norway Pakistan People’s Rep. China Peru Phillipinss Poland Portugal Rom~nie Singapore Soulh Africa South Korea Soviet U&n Spain Sri Lanka Sweden Switzerland Tawain Thailand Turkey United KinSdom United States Venezuela Yugosravia Zimbabwe
No. OF PRlcEo WI.66
ieee ia00 ieet
155 154 157 782 771 647 165 168 201 437 440 447
24 22 23 157 159 160
62 65 62 3039 3144 3206
63 66 65 97 99 103 26 30 31
239 243 249 19t 162 200
29 31 32 2054 2065 2434
89 88 63 2394 2452 2471
276 342 - 49 48 53
164 170 186 17t 179 176 909 to77 1091
22 22 22 92 93 92
153 158 157 1098 1097 1130
31 31 33 1258 1287 1319
59 53 6t 24 20 21 96 89 91 56 56 63
237 231 242 1244 1238 1324
169 171 167 55 47 59
129 125 123 61 77 83
241 262 264 46 46 52 99 98 100
297 302 301 51 61 53
155 159 157 85 84 to1
239 243 246 48 62 66
636 655 892 463 483 493
25 26 29 309 313 306 780 756 761 to7 105 99 49 50 54 30 32 35
7069 7051 7522 19665 40453 42259
46 46 54 162 164 159
24 27 31
AVrnGE I-YEAR PRICE
lQ8S ieeo isei 89190 sofa 1
107.14 107.48 102.62 72.70 77.35 83.16 63.88 94.06 130.62 64.20 70.16 73.47 43.74 47.26 47.98
116.11 121.34 121.2t 31.21 43.64 47.03 $4.97 77.93 78.87 97.32 100.65 95.97 79.61 79.96 75.51 66.53 92.69 113.95 84.36 97.89 95.52
117.05 136.05 142.64 62.47 65.14 68.23
190.86 185.23 180.77 57.00 73.66 73.82
118.10 133.65 133.36 99.33 92.49 - 80.14 90.10 96.04
169.26 177.16 176.91 36.94 39.69 44.98
0.3% 6.4%
12.2% 9.3% 8.0% 4.5%
39.6% 19.9%
3.6% 0.4% 7.1%
16.0% 17.9% 4.3%
-2.9% 29.3% 13.2% -6.9% 12.4%
4.7% 19%
-6.1% a.Q%
33.1%
-4.5% 7.5%
39.1% 4.7% 1.5%
-0.1% 7.8% 12%
-4.8% -5.6% 22.9% -2.4% 3.3% 4.7%
-2.4% 0.2%
-0.2%
6.6% -0.2% 13.3%
3.8% -12.8% 40.2% 12.6% 4.1%
-4.4% 5.4%
-12.4% 6.4%
18.3% “9.3% 18.0% 16.9%
1.2% -17.3%
6.4%
50.44 47.34 49.13 88.62 69.30 77.89 65.59 37.28 122.35 67.55 74.96 64.54 78.20 90.70 94.38 35.86 37.27 35.64
195.37 199.15 209.83 59.67 62.18 71.97
311.77 226.47 243.02 93.27 108.04 127.86
136.47 141.33 tna.is 56.14 63.73 75.21
365.22 387.74 461.07 60.40 67.31 66.14 60.40 74.87 61.91 71.38 81.28 68.06 49.80 52.91 52.45 72.ft 175.42 190.29 72.50 78.01 79.61 45.67 46.09 55.21 66.31 67.63 72.20 51.13 51.66 55.06 72.29 65.62 91.50
137.78 164.70 171.37 75.31 61.25 61.36 42.19 52.71 54.69 71.66 71.12 97.59 67.1% 77.46 81.7% 29.60 66.72 70.10 76.53 64.03 63.32
206.63 221.49 268.64 62.62 94.44 102.09 60.34 59.13 61.35
139.32 133.30 142.10 211.46 256.33 277.97 147.68 158.78 168.54 117.73 121.45 120.34
82.00 84.69 103.46 49.89 51.71 58.57
11 .O% 16.0%
3.9% 1.9%
37.7% -26.7%
15.8% 3.6%
13.5% 6.2%
11.4% 24.0% 13.9%
6.2% -0.9%
136.3% 11.7% 7.6% 5.3% 21% 1.5%
18.4% 19.5%
7.9% 243% -o.e% 15.3%
125.4% 9.8% 7.2%
50.3% -2.0% -4.3% 22.2%
7.5% 3.2% 3.3% 3.6%
2.1% 14.6%
6.7% 6.1% 6.9% 4.0% 0.2% 4.1%
37.2% 5.6% 5.1%
-0.6% 21.4%
6.1% 3.6% 6.6% 7.6% 6.1%
-0.9% 22.2% 13.3%
NOTE: Countries chosen for the table have x1 or mare titles on file.

A, W. ALEXANDER
TABLE 2B PRICE COMPARISON BY COUNTRY OF PUBLICATION -
WEIGHTED PRICE
S-AG U-AT E-AU E-BE A-BG S-BL E-BU N-CN S-CL S-CK NXR E-CS E-DK F-UA E-GW E-FI E-FR E-GE ECR A-HK E-MU A-II A-10 E-IE A-IS E-IT hiWJk.4 A-JA F-KE A-LE E-LU A-MY N-MX E-NE U-N2 F-NR E-NO A-PK A-CC S-PE A-PW E-PL E-PO ERM A-Sl F-SA A-K0 E-UR E-SP A-CE E-SW E-SZ A-CH A-TH A-TU E-UK N-US S-VE E-YU F-RI-i
axRJrrww
PUBLICATION
Argentina Australia Austria Belgium Bangladesh Brazil Bulgaria Canada Chile Colombia Costa Rica Czechoslovakia Denmark
Egypt Fed. Republic German Finland France German Dem. Republil Greece Hong Kong Hungary India Indonesia Ireland Israel Italy Jamaica Japan Kenya Lebanon Luxembourg Malaysia Mexico Netherlands New Zealand Nigeria Norway Pakistan People’s Rep. China Peru Phillipines Poland Portugal Romania Singapore South Atrica South Korea Soviet Union Spain Sri Lanka Sweden Switzerland Tawain Thailand Turkey United Kingdom United States Venezuela Yugoslavia Zimbabwe
WEIGtiTED PRICE %cwuvGE %CHiMS
1989 1990 1991 89/90 90191
77.60 75.65
420.32 76.24 59.47
103.72 30.35 69.63 69.08 96.39 54.74
163.67 205.39 159.26 412.55 87.22
123.29 220.65 154.58 169.47 73.71 65.80
131.68 63.17 76.07 112.13 37.18
197.80 59.21
1145.50 129.09 69.59 76.76
562.33 104.66 74.39 114.86 43.62 93.62 68.25 32.99 76.29 47.62 98.37
135.21 38.83 53.81 64.14 90.73 25.99 131.67 414.13 63.30 71.83
242.35 228.88 131.98 77.18 52.75 40.10
83.93 83.45
449.02 86.37 69.36
115.56 44.81 83.07 61.08
100.83 56.27
230.10 240.18 201.86 424.28 113.54 144.83 216.30 229.01 215.42 88.44 65.77 98.26 80.84 88.72
127.48 38.50
209.14 109.92 392.65 148.73 65.00 80.32
524.56 117.45 97.40
142.80 47.52
164.49 70.10 33.36 72.31 64.87 127.97 168.47 42.76 58.66 63.81 97.72 29.06 145.51 385.66 81.12 49.89
232.52 285.91 153.34 95.59 58.36 50.50
77.80 88.34
522.40 84.40 68.94 128.50 46.36 76.98 57.92 79.93 49.64 197.36 257.16 130.96 453.62 115‘10 149.78
204.40 200.43 97.82 73.03 88.57
331.97 96.94 146.05 32.22
221.82 101.07 431.72 187.02 70.87
102.76 712.21 96.86 62.18 136.47 48.61
172.77 75.7% 75.29 2.7% 35.24 1.2% 83.04 -5.2% 54.67 36.2%
138.96 30.1% 254.05 23.1% 50.26 10.1% 57.12 9.0% 81.37 -0.5% 115.53 7.7% 38.96 11.8% 162.88 10.5% 518.42 -6.9% 70.64 28.2% 68.37 -30.5%
247.33 -4.1% 313.39 24.9% 187.45 16.2% 82.21 23.9% 66.55 10.6% 67.55 25.9%
8.2% 10.0% 6.6%
13.3% 16.6% 11.4% 47.8% 19.0%
-1 1.6% 4.6% 2.8%
40.6% 16.9% 26.6% 2.8%
30.2% 17.3% -2.1% 48.1% 27.1% 20.0% 0.0%
-25.4% 28.0% 16.6% 13.7% 3.6% 5.7%
85.6% -65.7% 15.2% -8.6% 4.6% -6.0% 12.2% 30.9% 24.5% 8.9%
-7.3% 5.9%
16.3% -2.3% -0.6% 11.2% 3.5% -7.3% -5.2%
-20.7% -11.8% -14.2%
7.1% -35.1%
6.% 1.4% 3.6%
-10.7% -7.0% 10.8% 11.0% -9.9%
310.7% 9.3%
14.6% -16.3%
6.1% -8.1% 10.0% 25.7% 9.0%
27.9% 35.8% -17.7% -38.2% -3.0% 2.3% 5.0% 7.4% 5.6%
14.8% -15.7%
8.6% 52.6% 17.5% -2.6% 27.5% 18.2% 34.1% 11.8% 34.4% -12.9% 37.0% 6.4% 9.6% 9.2%
-14.0% 14.0% 33.8%
NOTE: Countries chosen for the table have 20 or more titles on file.

Periodicaf Prices, 1989-1991
TABLE 3A ABSTRACT AND INDEX SERVICE PRICE CHANGE TABLE:
APRIL 1988-MARCH 1991 -NUMBER OF TITLES
9
ABSTRACT & INDEX
Applied Mechanics Reviews Applied Science 6 Technology Art Index
Biological Abstracts Biological & Agric. index Business Periodical Index Canadian Periodical Index Catholic Per. 8 Lit. Index
Chemical Abstracts Computer & Control Abstracts Current Contents-Clinical Practice Current index to Jrls. in Educ. Education Index Electrical & Electronic Abstracts Engineering Index Hospital Literature Index Humanities Index Information Service in Mech. Eng. index Chemicus Index Medicus Index to Dentat Literature Index to Legal Periodicals Library Literature Magazine index Mathematical Reviews Music Index Nursing & Allied Health Lit. Oceanic Abstracts PAlSPublic Affairs Inf. Serv. Pharmaceutical Abstracts Philosopher’s Index Physics Abstracts Pollution Abstracts Psychological Abstracts Reader’s Guide to Per. Lit. Religion Index One: Per. Science Citation Index Social Sciences Citation Index Social Sciences Index Sociological Abstracts
Noof PREPAID TITLES
Noof BILL-LATER TITLES
1989 1990 1991 1989 1990 1991
480 467 475 181 160 155 548 529 876 167 171 125 135 134 195 81 87 92
5268 5188 5066 4085 4253 4331 274 269 272 68 66 53 380 370 433 146 148 135
322 307 73 101 155 155 151 29 29 33
5277 5192 5266 2461 2511 1964 596 585 584 238 210 212 880 882 894 205 217 221 628 784 758 233 311 341 354 381 367 110 84 97 596 584 583 239 210 212
2331 2849 2838 1040 994 1064 354 353 99 115
317 316 346 97 80 75 343 808 822 82 156 191 145 144 142 58 61 51
3422 3393 3334 1827 1892 1945 486 482 176 197
361 434 438 105 127 136 221 207 258 57 65 76 442 432 435 158 172 188
1037 1198 1191 561 852 879 186 189 185 148 144 155 169 166 168 69 77 82 246 446 440 113 224 235
1182 1150 1127 478 386 405 406 398 394 198 201 205 247 249 246 101 101 106 596 584 583 239 210 212 273 371 378 115 118 125 904 886 879 315 332 333 234 233 313 48 45 39 266 266 263 75 74 72
4539 4487 4439 1545 1561 1556 1701 1711 1710 472 436 405
356 353 450 143 125 85 1070 1076 1067 489 477 472
The increase in average price in 1991 for Swiss titles was 21.4% over 1990, from $221.49 to $268.84. The weighted price for 1991 increased by 34.4% over that of 1990, from $385.66 to $518.42.
British titles experienced a 7.6% increase in average price in 1991, from $258.33 in 1990 to $277.97. The weighted price, however, increased at a rate of 24.9%, more than threefold that of the increase in average price, from $285.91 to $313.39.
Other important publishing countries that showed significant price activity were Austria, where the average price rose 39.1% in 1991 and the weighted price rose 16.3%, and Ireland,

10 A. W. ALEXANDER
TABLE 3B ABSTRACT AND INDEX SERVICE PRICE CHANGE TABLE:
APRIL 1988-MARCH 1991 -AVERAGE PREPAID PRICE
ABSTRACT 8. INDEX 1989 1990 1991 89/90 go/91
Applied Mechanics Reviews Applied Science & Technology Art Index Biological Abstracts Biological 8 Agric. Index Business Periodical Index Canadian Periodical Index Catholic Per. 8 Lit. Index
Chemical Abstracts Computer & Control Abstracts Current Contents-Clinical Practice Current Index to Jrls. in Educ. Education Index Electrical 8 Electronic Abstracts Engineering Index Hospital Literature Index Humanities Index Information Service in Mech. Eng. Index Chemicus Index Medicus Index to Dental Literature Index to Legal Periodicals Library Literature Magazine Index Mathematical Reviews Music Index Nursing & Allied Health Lit. Oceanic Abstracts PAlSPublic Affairs Inf. Serv. Pharmaceutical Abstracts Philosopher’s Index Physics Abstracts Pollution Abstracts Psychological Abstracts Reader’s Guide to Per. Lit. Religion Index One: Per. Science Citation Index Social Sciences Citation Index Social Sciences Index Sociological Abstracts
331.73 354.99 499.86 178.62 190.41 261.76
76.15 80.25 91.43 201.95 215.19 263.18 223.55 228.86 262.42 114.08 122.59 129.17
63.24 66.59 40.86 40.26 40.82
256.74 273.85 358.23 426.22 459.02 563.79 150.40 164.57 185.72
90.28 95.91 106.13 81.63 84.18 85.47
426.22 459.59 564.52 244.02 278.91 358.10
108.22 119.73 63.02 62.36 64.12
310.59 304.45 399.16 425.70 462.81 576.03 223.96 236.62 283.81
163.60 196.81 42.20 41.70 42.61 83.74 85.04 94.29 68.03 69.87 70.49
377.83 402.38 479.55 52.34 54.57 62.26 62.91 60.96 64.96
282.72 277.44 357.50 99.26 108.52 117.34
167.55 178.24 206.99 73.96 77.49 83.43
426.22 459.59 564.52 319.46 302.92 404.65 144.19 153.50 182.78
66.15 68.40 65.28 43.04 45.47 44.63
312.08 331 .a1 411.51 129.89 140.34 161.22 110.11 113.98 131.10
7.0% 6.6% 5.4% 6.6% 2.4% 7.5%
-1.5% 6.7% 7.7% 9.4% 6.2% 3.1% 7.8%
14.3%
-1 .O% -2.0%
8.7% 5.7%
40.8% 37.5% 13.9% 22.3% 14.7%
5.4% 5.3% 1 .4%
30.8% 22.8% 12.9% 10.7%
1.5%
22.8% 28.4% 10.6%
2.6% 31 .l% 24.5% 19.9% 20.3%
2.2% 10.9%
0.9% 19.2% 14.1%
6.6% 28.9%
8.1% 16.1%
7.7% 22.8% 33.6% 19.1% -4.6% -1 .8% 24.0% 14.9%
15.0%
-1.2% 1.6% 2.7% 6.5% 4.3%
-3.1% -1 .9%
9.3% 6.4% 4.8% 7.8%
-5.2% 6.5% 3.4% 5.6% 6.3% 8.0% 3.5%
102.39 108.21 122.01 5.7% 12.8%
AVERAGE PREPAID SUBSCRIPTION
PRICE PER TITLE %CHANGE % CHANGE
where the average price rose 40.2% in 1991, while the weighted price rose by an incredible 310.7%. Interestingly, the number of titles from Ireland in the Faxon database did not change significantly from 1990 to 1991. Finally, Soviet titles rose in average price by 37.2%, from $71.12 to $97.59, while the weighted price increased by 27.5%, from $63.81 to $81.37.
The highest average price in this category for 1991 was for Dutch titles ($461.07), followed by British ($277.97) and Swiss ($268.84). The highest weighted price was also for Dutch ti- tles ($712.21), followed by Austrian ($522.40) and Swiss ($518.42).

Periodical Prices, 1989-1991
TABLE 3C ABSTRACT AND INDEX SERVICE PRICE CHANGE TABLE:
APRIL 198%MARCH 1991 -WEIGHTED PRICE
WEIGHTED AVERAGE
ABSTRACT & INDEX
Applied Mechanics Reviews Applied Science & Technology Art Index Biological Abstracts Biological 8 Agric. index Business Periodical Index Canadian Periodical Index Catholic Per. & Lit. Index Chemical Abstracts Computer 8 Control Abstracts Current Contents-Clinical Practice Current Index to Jrls. in Educ. Education Index Electrical 8 Electronic Abstracts Engineering Index Hospital Literature Index Humanities Index Information Service in Mech. Eng. Index Chemicus Index Medicus Index to Dental Literature Index to Legal Periodicals Library Literature Magazine Index Mathematical Reviews Music Index Nursing 8 Allied Health Lit.
Oceanic Abstracts PAlSPublic Affairs Inf. Serv. Pharmaceutical Abstracts Philosopher’s Index Physics Abstracts Pollution Abstracts Psychological Abstracts Reader’s Guide to Per. Lit. Religion Index One: Per. Science Citation Index Social Sciences Citation Index
Social Sciences Index Sociological Abstracts
PREPAID SUBSCRIPTION PRICE PER TITLE
1969 1990 1991
390.17 408.15 532.34 156.41 171.37 201.46
64.60 69.40 77.35 240.36 260.74 303.97 210.82 220.56 251.21
96.41 100.54 111.29 54.10 56.32
54.13 44.26 33.94 320.77 350.76 426.34 526.15 606.66 729.56 126.71 137.35 156.03
93.45 93.06 100.41 75.74 75.92 79.26
526.15 606.96 729.95 262.91 262.46 348.16
97.64 109.96 57.16 56.20 56.58
253.04 254.82 326.16 475.90 516.24 532.15 236.30 254.74 294.03
229.50 267.74 49.88 47.21 46.55 94.20 93.84 101.81 65.79 67.65 68.27
369.20 416.21 474.76 67.39 67.13 62.70 70.81 65.13 74.78
285.89 273.26 301.38 95.91 99.41 105.51
147.00 158.09 178.49 78.67 89.10 88.58
526.15 608.98 729.95 258.36 269.57 319.97 137.86 145.32 161.62
65.21 66.69 65.01 54.02 55.16 51.61
299.96 327.08 384.69 110.78 116.82 129.63 102.20 108.06 121.03
% CHANGE %CH4NGE
89190 go/91
4.6% 9.6% 7.1%
8.5% 4.6% 4.3%
-18.2%
9.4% 15.7%
6.7% -0.4%
0.2% 15.7%
7.4%
1.8% 0.7% 8.5% 6.9%
-5.4% -0.4%
2.8% 12.7% -0.4% -8.0% -4.4%
3.6% 7.5%
13.3% 15.7%
4.3% 5.4%. 2.3% 2.1% 9.0% 5.5% 5.7%
30.4% 17.6% 11.5% 16.6% 13.9% 10.7%
4.1% -23.3%
22.1% 19.9% 13.6%
79% 4.4%
19.9% 23.3% 12.4O/o -2.8% 28.0%
3.1% 15.4% 16.7% -1 .4%
8.5% 0.9%
14.1% -6.6% 14.8% 10.3%
6.1% 12.9% -0.6% 19.9% 18.7% 11.2% -2.5% -6.1% 17.7% 11 .O% 12.0%
107.96 114.26 120.47 5.8% 5.4%
11
Table 3 presents average and weighted prices for prepaid periodical titles included in 40 ab- stract and index serial services. While the prices are based on prepaid titles only, the number of nonsubscription, bill-later serials titles that are indexed in the various services is included.
Four additional abstract and index services have been added to last year’s list of 36. The new additions to the table include Canadian Periodical Index, Computer & Control Abstracts, Electrical & Electronic Abstracts, and Magazine Index.
Fifteen of the services experienced average price increases for 1991 in excess of 20 percent,

12 A. W. ALEXANDER
ranging from Applied Mechanics Reviews at 40.8% to Physics Abstracts and Electrical & Elec- tronic Abstracts at 22.8%. The highest average prices also are found in this group, led by Zn- dex Chemicus at $576.03. Others in the group with average prices over $500.00 were Electrical & Electronic Abstracts and Physics Abstracts at $564.52, and Computer & Control Abstracts at $563.79. All of the services included in this group cover sources in the science and technol- ogy disciplines.
Only four services experienced weighted price increases of more than 20 percent, but a to- tal of 13 showed increases of 15 percent of more, led again by Applied Mechanics Reviews at 30.4%. Similarly, all of the services in this group cover science and technology, so the high- est weighted prices are found in this group as well. Electrical & Electronic Abstracts and Ph&- its Abstracts covered the most expensive titles, with each at $729.95, followed closely by
TABLE 4A AVERAGE SUBSCRIPTION PRICE BY TYPE OF LIBRARY:
JULY 198 1 -MARCH 1991 -AVERAGE SUBSCRIPTION PRICE
7/al-6182
7182-6183 7ta3-3184
4ta4-3185 4/85-3186 4ia6-3187 4ia7-3188 4iaa-3189 4ia9-3190 4190-3197
ACADEMIC
$73.89
78.04 82.47
86.10 92.32
104.69 117.75 7 25.87 139.75 I 58.53
SPECIAL SPECIAL MEDICAL (GOVT.) (BUSINESS)
$79.43 $104.79 $92.36
83.98 119.67 102.49 88.14 126.47 112.55
100.64 132.90 125.03 107.49 133.87 138.22 121.50 134.87 143.56 137.86 146.40 157.70 153.07 162.72 171 .O6 169.99 170.53 I 78.97 193.57 195.20 203.92
PUBLIC
$38.20 39.01 41.43
45.61 48.68 52.35 54.78 59.43 69.77 80.94
TABLE 4B AVERAGE SUBSCRIPTION PRICE BY TYPE OF LIBRARY:
JULY 1981-MARCH 1991 -ANNUAL (70 CHANGE
ACADEMIC MEDICAL SPECIAL SPECIAL (GOVT.) (BUSINESS) PUBLIC
7187 -6182 9.0% 10.2% 9.8% 5.9% 12.6%
7ia2-6183 5.6% 5.7% 14.2% 11 .O% 2.1%
7ia3-3184 5.7% 5.0% 5.7% 9.8% 6.2%
4184-3185 4.4% 14.2% 5.1% 11.1% 10.1%
4ia5-3186 7.2% 6.8% 0.7% 10.5% 6.7%
4186-3187 13.4% 13.0% 0.7% 3.9% 7.5%
4ia7-3188 12.5% 13.5% 8.5% 9.6% 4.6%
4iaa-3189 6.9% 11 .O% 11.1% 8.5% 8.5%
4ia9-3190 11 .O% 11.1% 4.8% 4.6% 17.4%
4190-3197 13.4% 13.9% 14.5% 13.9% 16.0%

Periodical Prices, 1989-1991 13
Computer & Control Abstracts at $729.58. Other services with average prices exceeding $500.00 were Applied Mechanics Reviews and Index Chemicus.
Table 4 shows the average subscription price and percent change data by type of library, covering the most recent lo-year period. Until 1990, this table had included data for school libraries (primary, junior high, and high school), but these categories were not updated last year, as the bulk of orders for these types of libraries were transferred to a Faxon subsidiary, Turner Subscriptions in New York. The school library categories have been dropped com- pletely from this year’s compilation. An additional change to this table in 1991 relates to the redefinition of the “Hospital” category to “Medical,” denoting the fact that academic medi- cal school libraries are included.
TABLE 5A PERIODICAL PRICE RANGES BY TYPE
OF LIBRARY -ACADEMIC
PERIODICAL
PRICE RANGE
PERCENT OF TOTAL
SUBSCRIPTIONS
4/i3a-3189 4189-3190 4/90-3191
$0-49.99
$50 to 99.99
$100 to 199.99
$200 to 299.99
$300 to 399.99
$400 to 499.99
$500 to 599.99 $600 to 699.99
$700 to 799.99
$800 to 899.99
$900 to 999.99
$1,000 PLUS
52.3%
23.0%
12.4%
4.0%
2.5%
1.5%
1 .O%
0.8%
0.7%
0.4%
0.3%
1.2%
48.1%
24.0%
13.7% 4.7%
2.7%
1.6% 1.1%
0.9%
0.6%
0.6%
0.4%
1.4%
44.6%
24.3%
15.0%
5.4%
2.9% I .a%
1.1%
1 .O% 0.7%
0.7%
0.6%
1.9%
$200 plus 12.3% 14.1% 16.1%
PERIODICAL
PRICE RANGE
PERCENT OF TOTAL
EXPENDITURES
4188-3189 4fa9-3t90 4/90-3191
$0-49.99
$50 to 99.99
$100 to 199.99
$200 to 299.99
$300 to 399.99
$400 to 499.99
$500 to 599.99
$600 to 699.99 $700 to 799.99
$800 to 899.99
$900 to 999.99
$1,000 PLUS
12.3%
13.9%
14.8%
8.3% 7.4%
5.5%
4.6%
4.1%
4.1%
2.7%
2.4%
i 9.8%
10.4%
13.1%
14.8%
8.8%
7.2%
5.5%
4.4%
4.4%
3.6%
3.9%
3.0% 21 .O%
8.6% 11.7% 14.2%
8.9%
6.7%
5.4%
4.0%
4.4%
3.7%
3.8%
3.8% 24.7%
$200 plus
AVERAGE PRICE
59.0%
$125.87
61.7%
$139.75
65.5%
$I 58.53
14 A. W. ALEXANDER
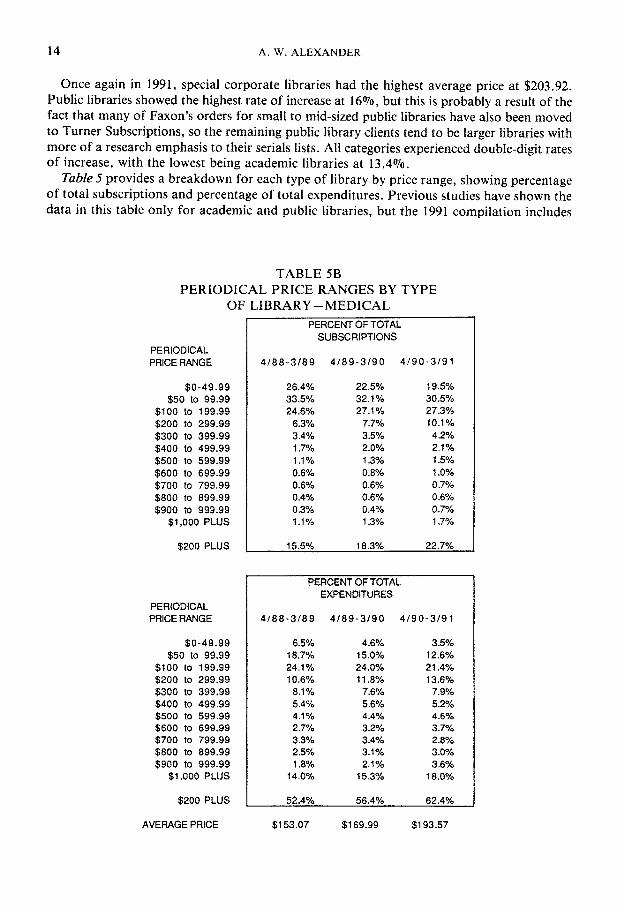
Once again in 1991, special corporate libraries had the highest average price at $203.92. Public libraries showed the highest rate of increase at 16070, but this is probably a result of the fact that many of Faxon’s orders for small to mid-sized public Iibraries have also been moved to Turner Subscriptions, so the remaining public library clients tend to be larger libraries with more of a research emphasis to their serials lists. All categories experienced double-digit rates of increase, with the lowest being academic libraries at 13.4%.
Table 5 provides a breakdown for each type of library by price range, showing percentage of total subscriptions and percentage of total expenditures. Previous studies have shown the data in this table only for academic and public libraries, but the 1991 compilation includes
TABLE 5B PERIODICAL PRICE RANGES BY TYPE
OF LIBRARY -MEDICAL
PERIODICAL
PRICE RANGE
PERCENT OF TOTAL
SUBSCRIPTIONS
4188-3189 4189-3190 4/90-3191
$0-49.99 26.4% 22.5% 19.5%
$50 to 99.33 33.5% 32.1% 30.5%
$100 to 199.99 24.6% 27.1% 27.3%
$200 to 293.99 6.3% 7.7% 10.1%
$300 to 399.9s 3.4% 3.5% 4.2%
$400 to 499.33 1.7% 2.0% 2.1%
$500 to 599.99 1.1% 1.3% 1.5% $600 to 693.93 0.6% 0.8% 1 .O%
$700 to 799.99 0.6% 0.6% 0.7%
$800 to 899.93 0.4% 0.6% 0.6%
$900 to 999.99 0.3% 0.4% 0.7%
$1,000 PLUS 1.1% 1.3% 1.7%
$200 PLUS 15.5% 18.3% 22.7%
PERIODICAL
PRICE RANGE
PERCENT OF TOTAL
EXPENDITURES
4188-3/89 4/83-3iQO 4/30-3131
$0-49.33 6.5% 4.6% 3.5%
$50 to 99.99 18.7% 15.0% 12.6%
$100 to 199.99 24.1% 24.0% 21.4%
$200 to 299.39 10.6% 11.8% 13.6%
$300 to 393.99 8.1% 7.6% 7.3%
$400 to 499.99 5.4% 5.6% 5.2%
$500 to 599.93 4.1% 4.4% 4.6%
$600 to 699.93 2.7% 3.2% 3.7%
$700 to 799.99 3.3% 3.4% 2.8% $800 to 893.99 2.5% 3.1% 3.0%
$900 to 993.99 1.8% 2.1% 3.6%
$1,000 PLUS 14.0% t 5.3% 18.0%
$200 PLUS 52.4% 56.4% 62.4%
AVERAGE PRICE $153.07 $169.99 $193.57
Periodical Prices, 1989-1991 15
TABLE 5C
PERIODICAL PRICE RANGES BY TYPE OF LIBRARY-GOVERNMENT
PERCENT OF TOTAL SUBSCRIPTIONS
PERIODICAL PRICE RANGE 4188-3189 4/a9-3190 4/90-3191
$0-49.99 $50 to 99.99
$100 to 199.99 $200 to 299.99 $300 to 399.99 $400 to 499.99 $500 to 599.99 $600 to 699.99 $700 to 799.99 $800 to 899.99 $900 to 999.99
$1,000 PLUS
43.9% 21 .O% 16.4%
6.4% 4.0% 2.2% 1.6% 1.1% 0.8% 0.6% 0.4% 1.7%
39.3% 20.6% 16.8%
7.0% 4.0% 2.4% 1.5% 1.3% 0.9% 0.7% 0.5% I .a%
39.3% 19.9% I 7.8%
7.7% 4.7% 2.5% 1.7% 1.3% 1 .O% 0.9% 0.7% 2.4%
$200 PLUS I 8.8% 20.2% 23.0%
PERIODICAL PRICE RANGE
PERCENT OF TOTAL EXPENDITURES
4iaa-3189 4189-3190 4/90-3/91
$0-49.99 $50 to 99.99
$100 to 199.99 $200 to 299.99 $300 to 399.99 $400 to 499.99 $500 to 599.99 $600 to 699.99 $700 to 799.99 $800 t0 899.99 $900 to 999.99
$1,000 PLUS
8.3% 10.0% 15.3% 10.2%
8.9% 6.3% 5.5% 4.6% 4.1% 3.4% 2.5%
21 .O%
7.6% 9.3%
14.9% i 0.8%
8.5% 6.6% 5.1% 5.3% 4.2% 3.6% 3.1%
21.1%
6.4% 7.9%
13.6% 10.3%
6.8% 6.1% 4.9% 4.5% 4.2% 4.3% 3.8%
25.0%
$200 PLUS
AVERAGE PRICE
66.4%
$162.72
68.2%
$170.53
71.9%
$193.20
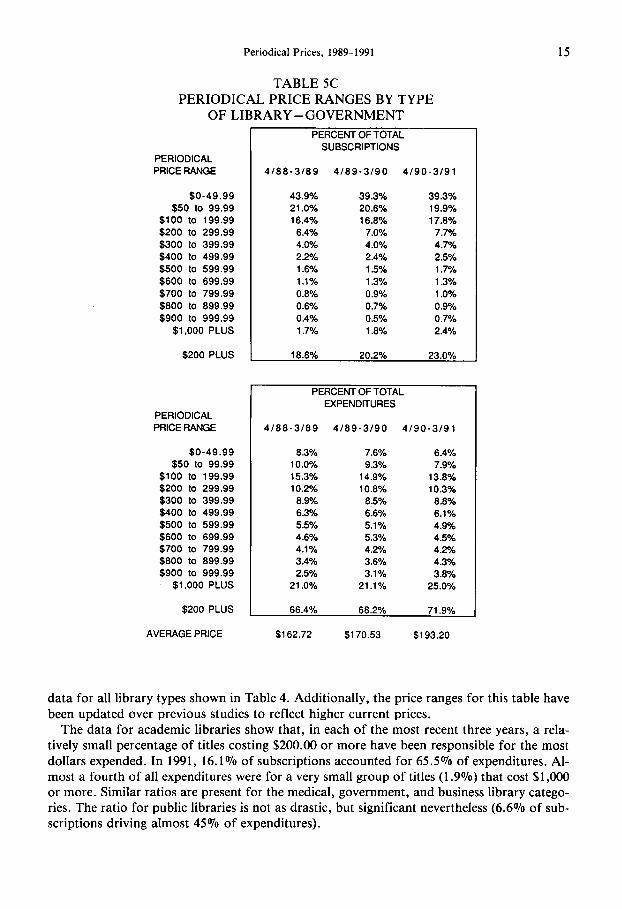
data for all library types shown in Table 4. Additionally, the price ranges for this table have been updated over previous studies to reflect higher current prices.
The data for academic libraries show that, in each of the most recent three years, a rela- tively small percentage of titles costing $200.00 or more have been responsible for the most dollars expended. In 1991, 16.1% of subscriptions accounted for 65.5% of expenditures. Al- most a fourth of all expenditures were for a very small group of titles (1.9070) that cost $1,000 or more. Similar ratios are present for the medical, government, and business library catego- ries. The ratio for public libraries is not as drastic, but significant nevertheless (6.6% of sub- scriptions driving almost 45% of expenditures).

A. W. ALEXANDER
TABLE 5D PERIODICAL PRICE RANGES BY TYPE
OF LIBRARY-BUSINESS
PERlODfCAL PRICE RANGE
$0-49.99 $50 to 99.99
$100 to 199.99 $200 to 299.99 $300 to 399.99 $400 to 499.99 $500 to 599.99 $600 to 699.99 $700 to 799.99 $600 to 899.99 $900 to 999.99
$1,000 PLUS
40.7% 38.0% 22.3% 23.0% 16.8% 17.7%
6.9% 7.4% 4.3% 4.5% 2.5% 2.5% 1.8% 1.7% 1 .O% 1.3% 0.9% 0.9% 0.6% 0.7% 0.5% 0.5% 1.8% 2.0%
36.4% 22.0% 17.4%
8.2% 4.6% 3.0% 1.0% 1.5% 1.1% 0.0% 0.6% 2.6%
$200 PLUS 20.2% 21 .d% 24.2% 1
PERIODICAL PRICE RANGE
$0-49.99 $50 to 99.99
$100 to 199.99 $200 to 299.99 $300 to 399.99 $400 to 499.99 $500 to 599.99 $600 to 699.99 $700 to 799.99 $800 to 899.99 $900 to 999.99
$1,000 PLUS
$200 PLUS
AVERAGE PRICE
PERCENT OF TOTAL ~P~~DtTURES
d/88-3189 4189-3/sO 4/90-3191
7.9% 10.0% 14.8% 10.5%
9.1% 6.8% 6.0% 4.0% 3.9% 3.0% 2,79/a
2 1.3%
7.1% 10.0% 14.9% 10.8%
9.2% 6.6% 5.3% 4.8% 3.6% 3.3% 2.7%
21.5%
6.2% 6.4%
12.9% 10.5%
8.3% 6.9% 5.1% 4.9% 4.2% 3.5% 3.2%
25.9%
67.3% 68.0% 72.5%
$171.06 $178.97 $203.92
Table 6 summarizes the average domestic and foreign title subscription rates and the aver- age weighted prices for the three years under study. Average domestic prices increased over- all by 6.1Vo in 1991, while the weighted domestic price increased by 9.2%. Foreign titles increased in average price by 21.3% over 1990, and the weighted price was 27.3% higher than the year before. Both of these figures reflect the genera1 weakness of the U.S. dollar against key foreign currencies in 1991.
Table 7 summarizes Faxon title file data used in the compiIation of the various tables in this study. Faxon’s list of orderable titles increased by 1,510, or 1.4%, in 1991. The number of

Periodical Prices, 1989-1991 17
TABLE 5E PERIODICAL PRICE RANGES BY TYPE
OF LIBRARY-PUBLIC
PERIODICAL
PRICE RANGE
$0-49.99
$50 to 99.99
$100 to 199.99
$200 to 299.99 $300 to 399.99 $400 to 499.99 $500 to 599.99 $600 to 699.99 $700 to 799.99 $800 to 899.99 $900 to 999.99
$1,000 PLUS
75.8% 14.2%
6.0% 1.6% 0.8% 0.7% 0.2% 0.2% 0.1% 0.1% 0.0% 0.2%
70.7% 16.8%
7.6% 1.9% 1.1% 0.6% 0.3% 0.3% 0.1% 0.2% 0.1% 0.4%
67.1%
17.1%
9.1%
2.6%
1.3%
0.8%
0.4%
0.3%
0.2%
0.1%
0.6%
$200 PLUS 1 4.0% 5.0% 6.6%
PERIODICAL
PRICE RANGE
$0-49.99
$50 to 99.99
$100 to 199.99
$200 to 299.99
$300 to 399.99
$400 to 499.99
$500 to 599.99
$600 to 699.99 $700 to 799.99
$800 to 899.99 $900 to 999.99
$1,000 PLUS
81 33.1% 10.4%
15.0%
7.0%
4.9%
5.3%
2.3%
2.1%
1.1%
1.4%
0.8%
8.6%
27.1%
10.5%
16.2% 7.2%
5.6%
4.3%
2.3%
2.6%
1.3%
2.1%
1.0%
11 .O%
22.4%
16.4%
16.6% 0.4%
5.9%
4.5%
2.6%
2.9%
2.1%
2.0%
1.8%
14.3%
$200 PLUS 1
AVERAGE PRICE
33.5%
$59.43
38.2%
$69.77
44.6% ]
$80.94
bill-later titles actually decreased slightly, while the net number of prepaid titles on file in- creased by 1,532.
SUMMARY
The 1991 periodical prices study marks a departure from the moderating trend indicated in studies for 1990 and 1989. While both average and weighted prices for domestic titles remained

18 A. W. ALEXANDER
TABLE 6 U.S. DOMESTIC AND FOREIGN TITLE
SUBSCRIPTION PRICE COMPARISON CHART
DOMESTIC TITLES I-YR. RATE
1989 1990 1991
NO. OF TITLES 39,665 40,453 42,259 AVERAGE PRICE $147.66 $I 58.78 $168.54 % INCREASE 9.3% 7.5% 6.1%
WEIGHTED PRICE $131.96 $153.34 $167.45 % INCREASE 8.0% 16.2% 9.2%
FOREIGN TITLES I-YR. RATE
1969 1990 1991
14,557 14,759 15.030 $143.09 $150.34 $182.09
3.3% 5.1% 21 .I%
$161.17 $259.53 $330.40 29.0% 61 .O% 27.3%
in single digits, the weakness of the dollar overseas contributed to a significant rise in prices for foreign titles-over 20 percent for both the average and weighted price. As indicated by Tables 1 and 3, science and technology titles generally represented both the biggest increases and the highest prices. All types of libraries that were examined experienced double-digit in- creases in average price.
Comments, reactions, and suggestions for changes and other recommendations for future periodical price studies in this series are invited and encouraged by the Faxon Company. De- velopment of new methodologies for analyzing serials pricing data will provide a better un- derstanding of the economic trends and forces that will affect library materials budgets in the
future.
TABLE 7 FAXON TITLE DATABASE STATISTICS
April SO/March 91
Orderable titles Bill later titles 39,755
Prepaid titles 69,449 Total orderable titles 109,204
Unorderable titles Discontinued Temporarily suspended Delayed publications Status in question Order direct Merged Reorder
Total unorderable titles
32,659
at4 555 213
17,601 44,923 23,034
119,799
Titles used for local library use
Number of titles on file: (an addition of 19.926 from April 1969 through March 1990)
176,666
405,869

Periodical Prices. 1989-1991 19
NOTE
1. Periodical price updates for 1974 through 1980 were published in the October 1 issue of Library Journal and were compiled by Frank F. Clasquin. The 1981 and 1982 studies appeared in vol. 5, no. 3 of The Serials Librarian and were compiled by Gerald R. Lowell. The 1982 update appeared in vol. 7, no. 1; the 1983 review in vol. 8, no. 2; the 1984 review in vol. 9, no. 2; the 1985 review in vol. 9, no. 4; the 1986 review in vol. 11, no. 1; the 1987 up- date in vol. 13, no. 1 of The Serials Librarian and were compiled by Rebecca T. Lenzini. The 1988 review appeared in Vol. 14, No. I of The Serials Libruriun and was compiled by Ronald Akie. The 1989 update appeared in vol. 17, nos. l/2, and the 1990 update appeared in vol. 18, nos. 314 of The Serials Librarian and were compiled by Peter R. Young.


![Journal of Basic Writing CUMULATIVE INDEX 1989-1991 Author Index … · 2012. 3. 31. · Journal of Basic Writing CUMULATIVE INDEX 1989-1991 Author Index [Title Index Follows] Beaugrande,](https://img.pdfslide.us/doc/110x75/60e75a831d393c667b4beded/journal-of-basic-writing-cumulative-index-1989-1991-author-index-2012-3-31.jpg)