Embed Size (px)
Citation preview

Physica D 48 (1991) 1-16 North-Holland
PERIODIC TO QUASIPERIODIC TRANSITION OF CHEMICAL SPIRAL ROTATION
Gordon S. SKINNER and Harry L. SWINNEY Center for Nonlinear Dynamics and the Department of Physics, The University of Texas at Austin, Austin, TX 78712 USA
Received 2 March 1990 Revised manuscript received 9 September 1990 Accepted 9 September 1990 Communicated by A.T. Winfree
We report observations of the tip motion of spiral waves in excitable Belousov-Zhabotinskii reagent. An open reactor is used to determine the time-asymptotic dynamics of the spiral tip as a function of a control parameter. We have observed a supercritical transition from simple rotation (one frequency) to compound rotation (two frequencies); the compound motion at onset closely resembles that predicted by two-species reaction-diffusion models. Measurements of the frequencies of the motion indicate that the compound rotation is quasiperiodic over the range studied; there is no evidence of frequency locking. The compound tip motion appears to result from fluctuations in the curvature of the spiral wave near its tip. We describe qualitatively the sequence of events during a single tip orbit and suggest that the refractory tail of the wave plays a dominant role in controlling the tip motion.
1. Introduction
Rotating spiral waves have long elicited the attention of researchers in a host of different fields, including biology, cardiology, chemistry, and mathematics. Perhaps the most extensively studied medium in which spirals are manifest is the Belousov-Zhabotinskii (BZ) reagent -blue waves of oxidation propagating in a thin layer of reduced (red) reagent can be broken, with each break eventually developing into a pair of spirals [l] (plate Ia). The chemical basis of the medium makes the study of these spirals simpler than that of spirals in other physical excitable media such as heart muscle 121 or social amoeba colonies [3].
1.1. Motion of the spiral tip
Two questions naturally arise concerning spiral waves in excitable media. First, what is the shape of the spiral wave? Second, is it a stable shape (invariant under rotation and time translation), and if it is not stable, how is it changing in time? That is, what are the dynamics of the spiral?
The first question has been carefully addressed experimentally [4] and theoretically [5] for the BZ reagent. A unique, invariant shape has been found in some conditions in laboratory experiments and numerical simulations. In these instances, the tip of the spiral traces a circular path that encloses a central core region. For other conditions, how- ever, the spiral does not assume a stable shape. The tip then follows a distinctly noncircular tra- jectory [6-101. Such behavior has also been ob- served in cardiac tissue [21 and in simulations of various excitable media [9, 11-191.
The term meander was coined for the noncir- cular motion by Winfree [61 before it was studied under close scrutiny; boundary effects, hydro- dynamics, and inhomogeneities all took part in producing a net motion that appeared quite irreg- ular. Jahnke, Skaggs, and Winfree [91 later ob- served that in the BZ reagent spiral meander is not an artifact due to external influences, but is evidently inherent in the chemistry used. Their chemical and numerical experiments revealed cir- cular tip orbits for some chemistries and epicycle-like orbits for others, as shown in fig. 1.
0167-2789/91/$03.50 0 1991- Elsevier Science Publishers B.V. (North-Holland)

2 G.S. Skinner and H.L. Swinney /Chemical spiral rotation
G.S. Skinner and H.L. Swinney / Chemical spiral rotation 3
(b)
0
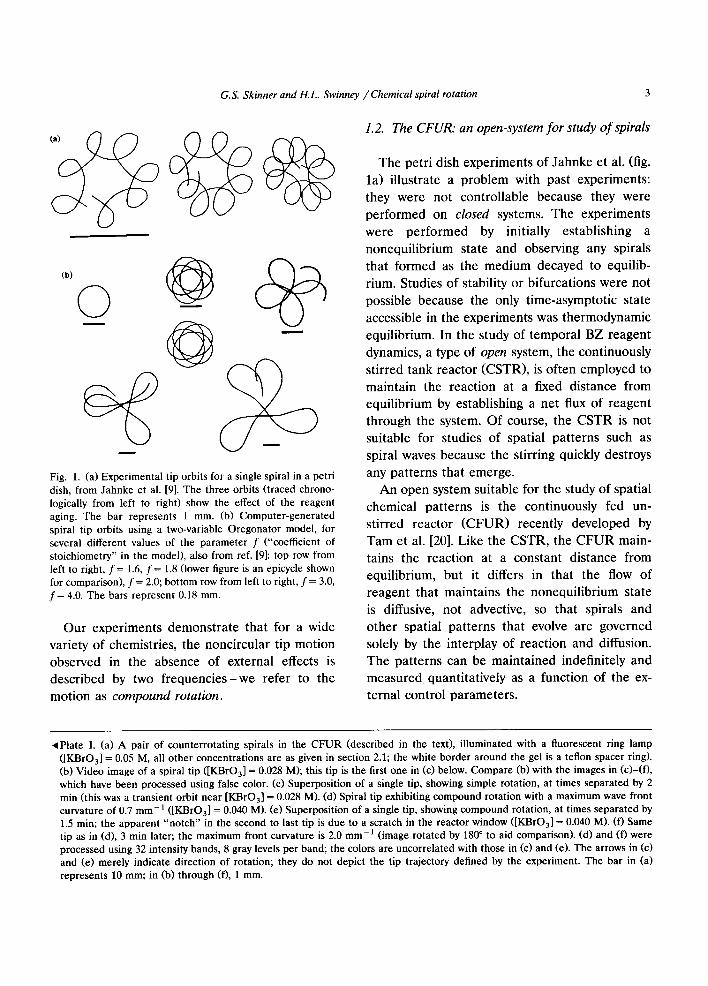
Fig. 1. (a) Experimental tip orbits for a single spiral in a petri
dish, from Jahnke et al. [9]. The three orbits (traced chrono-
logically from left to right) show the effect of the reagent
aging. The bar represents 1 mm. (b) Computer-generated
spiral tip orbits using a two-variable Oregonator model, for
several different values of the parameter f (“coefficient of
stoichiometry” in the model), also from ref. [9]: top row from
left to right, f= 1.6, f= 1.8 (lower figure is an epicycle shown
for comparison), f= 2.0; bottom row from left to right, f= 3.0,
f = 4.0. The bars represent 0.18 mm.
Our experiments demonstrate that for a wide variety of chemistries, the noncircular tip motion observed in the absence of external effects is described by two frequencies-we refer to the motion as compound rotation.
1.2, The CFUR: an open-system for study of spirals
The petri dish experiments of Jahnke et al. (fig. la) illustrate a problem with past experiments: they were not controllable because they were performed on closed systems. The experiments were performed by initially establishing a nonequilibrium state and observing any spirals that formed as the medium decayed to equilib- rium. Studies of stability or bifurcations were not possible because the only time-asymptotic state accessible in the experiments was thermodynamic equilibrium. In the study of temporal BZ reagent dynamics, a type of open system, the continuously stirred tank reactor (CSTR), is often employed to maintain the reaction at a fixed distance from equilibrium by establishing a net flux of reagent through the system. Of course, the CSTR is not suitable for studies of spatial patterns such as spiral waves because the stirring quickly destroys any patterns that emerge.
An open system suitable for the study of spatial chemical patterns is the continuously fed un- stirred reactor (CFUR) recently developed by Tam et al. [20]. Like the CSTR, the CFUR main- tains the reaction at a constant distance from equilibrium, but it differs in that the flow of reagent that maintains the nonequilibrium state is diffusive, not advective, so that spirals and other spatial patterns that evolve are governed solely by the interplay of reaction and diffusion. The patterns can be maintained indefinitely and measured quantitatively as a function of the ex- ternal control parameters.
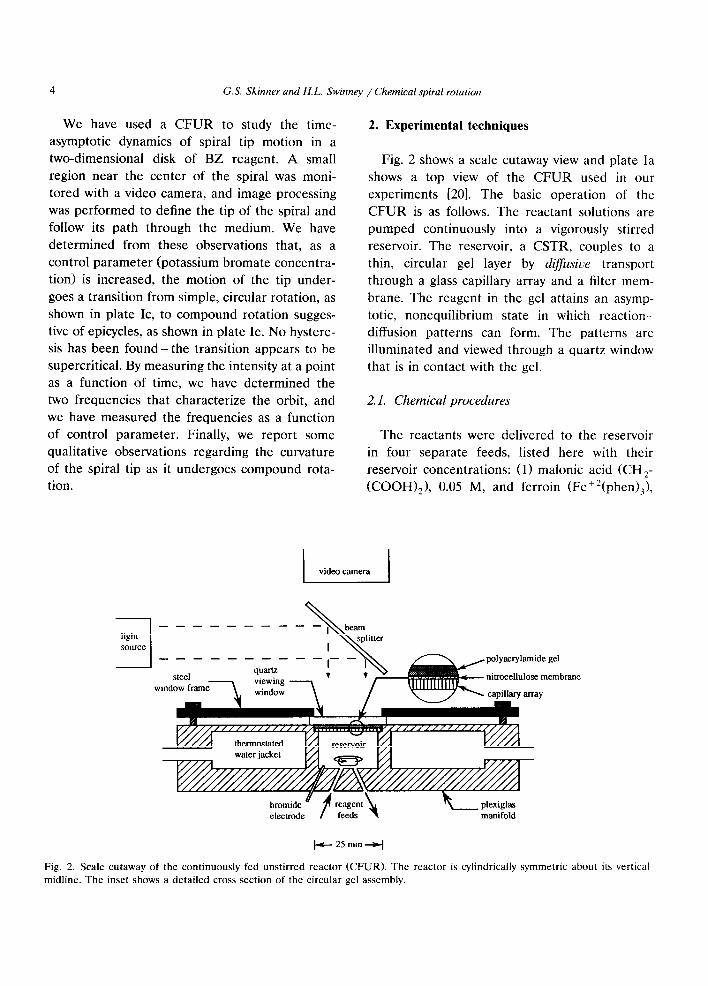
4Plate I. (a) A pair of counterrotating spirals in the CFUR (described in the text), illuminated with a fluorescent ring lamp
([KBrO,] = 0.05 M, all other concentrations are as given in section 2.1; the white border around the gel is a teflon spacer ring).
(b) Video image of a spiral tip ([KBrO,] = 0.028 M); this tip is the first one in (c) below. Compare (b) with the images in (c)-(f),
which have been processed using false color. (c) Superposition of a single tip, showing simple rotation, at times separated by 2 min (this was a transient orbit near [KFhO,] = 0.028 M). (d) Spiral tip exhibiting compound rotation with a maximum wave front
curvature of 0.7 mm ml ([KBrO,] = 0.040 M). (e) Superposition of a single tip, showing compound rotation, at times separated by 1.5 min; the apparent “notch” in the second to last tip is due to a scratch in the reactor window ([K&O,] = 0.040 M). (f) Same
tip as in (d), 3 min later; the maximum front curvature is 2.0 mm -’ (image rotated by 180” to aid comparison). (d) and (0 were processed using 32 intensity bands, 8 gray levels per band; the colors are uncorrelated with those in (c) and (e). The arrows in (c)
and (e) merely indicate direction of rotation; they do not depict the tip trajectory defined by the experiment. The bar in (a)
represents 10 mm; in (b) through (0, 1 mm.
4 G.S. Skinner and H.L. Swinney /Chemical spiral rotation
We have used a CFUR to study the time- asymptotic dynamics of spiral tip motion in a two-dimensional disk of BZ reagent. A small region near the center of the spiral was moni- tored with a video camera, and image processing was performed to define the tip of the spiral and follow its path through the medium. We have determined from these observations that, as a control parameter (potassium bromate concentra- tion) is increased, the motion of the tip under- goes a transition from simple, circular rotation, as shown in plate Ic, to compound rotation sugges- tive of epicycles, as shown in plate Ie. No hystere- sis has been found-the transition appears to be supercritical. By measuring the intensity at a point as a function of time, we have determined the two frequencies that characterize the orbit, and we have measured the frequencies as a function of control parameter. Finally, we report some qualitative observations regarding the curvature of the spiral tip as it undergoes compound rota- tion.
2. Experimental techniques
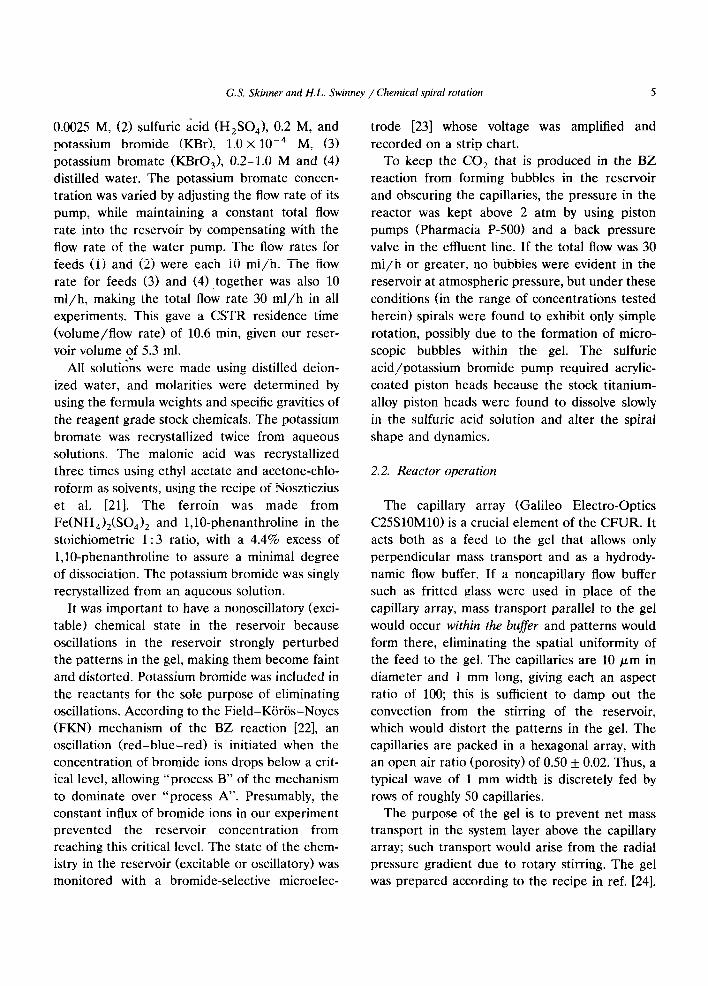
Fig. 2 shows a scale cutaway view and plate Ia shows a top view of the CFUR used in our experiments [20]. The basic operation of the CFUR is as follows. The reactant solutions are pumped continuously into a vigorously stirred reservoir. The reservoir, a CSTR, couples to a thin, circular gel layer by difisive transport through a glass capillary array and a filter mem- brane. The reagent in the gel attains an asymp- totic, nonequilibrium state in which reaction- diffusion patterns can form. The patterns are illuminated and viewed through a quartz window that is in contact with the gel.
2.1. Chemical procedures
The reactants were delivered to the reservoir in four separate feeds, listed here with their reservoir concentrations: (1) malonic acid (CH,- (COOH),), 0.05 M, and ferroin (Fe+2(phen)3),
I video camera I
Fig. 2. Scale cutaway of the continuously fed unstirred reactor (CFUR). The reactor is cylindrically symmetric about
midline. The inset shows a detailed cross section of the circular gel assembly.
polyacrylamide gel
its vertical
G.S. Skinner and H.L. Swinney /Chemical spiral rotation 5
0.0025 M, (2) sulfuric acid (H,SO,), 0.2 M, and potassium bromide (KBr), 1.0 X lop4 M, (3) potassium bromate (KBrO,), 0.2-1.0 M and (4) distilled water. The potassium bromate concen- tration was varied by adjusting the flow rate of its pump, while maintaining a constant total flow rate into the reservoir by compensating with the flow rate of the water pump. The flow rates for feeds (1) and (2) were each 10 ml/h. The flow rate for feeds (3) and (4) together was also 10 ml/h, making the total flow rate 30 ml/h in all experiments. This gave a CSTR residence time (volume/flow rate) of 10.6 min, given our reser- voir volume of 5.3 ml.
All solutions were made using distilled deion- ized water, and molarities were determined by using the formula weights and specific gravities of the reagent grade stock chemicals. The potassium bromate was recrystallized twice from aqueous solutions. The malonic acid was recrystallized three times using ethyl acetate and acetone-chlo- roform as solvents, using the recipe of Noszticzius et al. [21]. The ferroin was made from Fe(NH,),(SO,), and l,lO-phenanthroline in the stoichiometric 1 : 3 ratio, with a 4.4% excess of l,lO-phenanthroline to assure a minimal degree of dissociation. The potassium bromide was singly recrystallized from an aqueous solution.
It was important to have a nonoscillatory (exci- table) chemical state in the reservoir because oscillations in the reservoir strongly perturbed the patterns in the gel, making them become faint and distorted. Potassium bromide was included in the reactants for the sole purpose of eliminating oscillations. According to the Field-Kiiros-Noyes (FKN) mechanism of the BZ reaction [22], an oscillation (red-blue-red) is initiated when the concentration of bromide ions drops below a crit- ical level, allowing “process B” of the mechanism to dominate over “process A”. Presumably, the constant influx of bromide ions in our experiment prevented the reservoir concentration from reaching this critical level. The state of the chem- istry in the reservoir (excitable or oscillatory) was monitored with a bromide-selective microelec-
trode [23] whose voltage was amplified and recorded on a strip chart.
To keep the CO, that is produced in the BZ reaction from forming bubbles in the reservoir and obscuring the capillaries, the pressure in the reactor was kept above 2 atm by using piston pumps (Pharmacia P-500) and a back pressure valve in the effluent line. If the total flow was 30 ml/h or greater, no bubbles were evident in the reservoir at atmospheric pressure, but under these conditions (in the range of concentrations tested herein) spirals were found to exhibit only simple rotation, possibly due to the formation of micro- scopic bubbles within the gel. The sulfuric acid/potassium bromide pump required acrylic- coated piston heads because the stock titanium- alloy piston heads were found to dissolve slowly in the sulfuric acid solution and alter the spiral shape and dynamics.
2.2. Reactor operation
The capillary array (Galileo Electra-Optics C25SlOMlO) is a crucial element of the CFUR. It acts both as a feed to the gel that allows only perpendicular mass transport and as a hydrody- namic flow buffer. If a noncapillary flow buffer such as fritted glass were used in place of the capillary array, mass transport parallel to the gel would occur within the bufler and patterns would form there, eliminating the spatial uniformity of the feed to the gel. The capillaries are 10 Frn in diameter and 1 mm long, giving each an aspect ratio of 100; this is sufficient to damp out the convection from the stirring of the reservoir, which would distort the patterns in the gel. The capillaries are packed in a hexagonal array, with an open air ratio (porosity) of 0.50 f 0.02. Thus, a typical wave of 1 mm width is discretely fed by rows of roughly 50 capillaries.
The purpose of the gel is to prevent net mass transport in the system layer above the capillary array; such transport would arise from the radial pressure gradient due to rotary stirring. The gel was prepared according to the recipe in ref. [24].
6 G.S. Skinner and H.L. Swinney /Chemical spiral rotation
The lack of any obvious three-dimensional effects
(for the concentration range listed above) in a 1
mm thick gel indicated that it was sufficiently thin
for the study of two-dimensional wave propaga-
tion.
The filter membrane (Whatman cellulose ni-
trate, 0.2 pm pore size, 130 pm thick) served to
provide a white viewing background for the trans-
parent gel, contrasting sharply with the red layer
of reagent in which the waves propagate. The
blue waves have a small coefficient of extinction
and hence appear nearly transparent; they act as
narrow, curved windows through which the white
background is clearly visible. Since the capillary
array is translucent, the background for the waves
(without the membrane) would be the red reagent
in the reservoir, clearly a poor choice if distinct
waves are desired.
The reagent in the reservoir was stirred with a
6 mm diameter cross-shaped magnet at 540 rpm.
Exhaustive testing showed that the speed (in the
range 150-600 rpm) and direction of rotation of
the stirring had no effect on the spirals.
Three to five hours after starting the flow of
reactants into the reactor, the reagent in the gel
began to oscillate with a period of roughly 10
min, with a slightly higher frequency in the center
than elsewhere, leading to target-like phase waves
and eventually trigger waves. Additionally, pace-
maker sources of target patterns formed near the
gel edge where the mixing was less efficient. After
several more hours, only trigger waves were ob-
served, produced by a few dominant pacemakers
at the edge of the gel. Spiral waves were then
initiated by breaking one or more of the trigger
waves with light, as described below.
2,3. Reactor illumination and spiral manipulation
The large scale properties of the patterns that
formed in the gel (cf. plate Ia) were easily ob-
served using fluorescent ring lamps or other simi-
lar low intensity light sources. However, in order
to follow the tip motion, the width of field was
reduced to roughly 6 mm, and more intense illu-
mination was needed. Light from a 100 W mer-
cury arc lamp (Ushio USH-102D lamp, Oriel
66057 housing) was condensed into a uniform,
divergent beam that was projected onto the reac-
tor with a beamsplitter, Y-10” from normal inci-
dence. The light was first passed through a blue-
green bandpass filter (A peak = 512 nm, fwhm = 155
nm) to enhance the contrast and to remove ultra-
violet and infrared radiation, which influence
wave propagation. The intensity of the light was
varied by adjusting the amount of beam diver-
gence with a focusing lens.
Illuminating the gel with the full spectrum pro-
duced by the mercury arc lamp (by removing the
filter) at an intensity of about 40 mW/cm’ for
l-2 min acted to reduce the oxidized fronts; thus,
selectively exposing small areas resulted in bro-
ken waves. Illuminating half of a single trigger
wave, from its midst to the perimeter of the gel,
resulted in a single free wave end and hence a
single spiral. (If more than one spiral were pres-
ent, a slight spatial gradient in the feed would
cause the spirals to rotate at different rates, and
eventually the faster spiral would “unwind” the
slower and complicate its dynamics appreciably
[25].) The asymptotic spiral behavior was attained
5-10 h after initiation.
The presence of a uniform medium near the
spiral center is crucial to isolate the true tip
dynamics; hence, spirals that formed near the
perimeter of the gel were deemed unsuitable for
experimental measurements, since the feed is
nonuniform at the edge. To produce a more
central spiral, either of two methods was used.
The first technique was simply to break another
wave closer to the center and kill the peripheral
spiral with light as described above. The second
method was to push the peripheral spiral toward
the gel center by imposing a strong light gradient
on the spiral, as follows. When the spiral rotation
was simple, the size of the circle traced by the tip
was found to vary directly with the illumination
intensity, and so a spiral would drift perpendicu-
lar to any illumination gradient. Fig. 3 illustrates

G.S. Skinner and H.L. Swinney /Chemical spiral rotation I
DIRECtlO OF DRIFT
\
SHADED ILLUMINATED REGION REGION
Fig. 3. Schematic of a spiral that is being moved with a strong
light gradient, imposed by increasing the incident intensity to
6 mW/cm’ and blocking the light to part of the medium.
our application of this phenomenon. The semicir- cles that are traced by the tip in the illuminated region are larger than those in the shaded region, so the spiral moves along the shadow edge in the direction shown. Once the spiral center is at the desired location (requiring several hours), normal illumination is resumed and the chemistry is ad- justed to the desired state. The above technique is reminiscent of a procedure used by Agladze et al. [26]; they translated spiral waves by periodi- cally modulating the intensity of a spatially uni- form light source.
The intensity of the incident light for general tip tracking purposes was 1.2 mW/cm’; this in- tensity was maintained within 5% for each run. No change in the asymptotic behavior was ob- served for intensities ranging from 1 to 3 mW/cm2. However, a sudden increase of 1 mW/cm2 was found to perturb the orbital dy- namics for several hours, appearing as though the potassium bromate concentration were temporar- ily decreased by a few percent.
The reactor was illuminated at a slightly oblique angle to avoid intercepting specular window re- flections with the camera optics, which were aligned normal to the reactor to interpret the patterns as two-dimensional. Such reflections can
be eliminated by using a pair of linear polarizers aligned so as to transmit only the scattered light from the waves. However, a more powerful light source would be required to compensate for the attenuation due to the polarizers.
2.4. Image processing and data acquisition
To establish the dynamics of the spiral tip, a small region (25 mm21 enclosing the tip was mon- itored using a monochrome video camera (Dage- MT1 NC-70, with a Panasonic Newvicon tube) after being magnified with an 80 mm macro lens and autobellows assembly. The tip image from the camera appeared as in plate Ib. The analog video signal was then digitally processed by a frame grabber (Data Translation DT2851) and an auxiliary frame processor (DT2858) installed in an IBM-AT clone. Both processors have 512 lines of resolution, so with a typical width of field of 6 mm, the spatial resolution was about 12 pm per pixel. The dynamic range of intensity for magni- fied spiral tips was at best about 40 gray levels, out of a possible 256 allowed by the processor boards. This was clearly not taking advantage of the intensity resolution possible, but spatial varia- tions in the illumination ceased to be negligible if the light source was made more intense (spatial gradients of lighting induce spiral drift-see sec- tion 2.3). To improve tip definition, we used customized look-up tables with the input video signal domain divided into bands of intensity, typically 4 or 8 gray levels wide. Each of these bands is mapped by the image processor to a specific color; e.g., the first tip of the sequence plate Ic is that from plate Ib after processing. In this way a contour of some specified intensity, designated by the boundary between two colors, can be monitored. In plate Id, for example, one can define the tip of the spiral as the point of sharpest curvature on the contour designated by the red/black edge. As long as the illumination intensity could be kept constant, such a definition was maintained from image to image and from
8 G.S. Skinner and H.L. Swinney /Chemical spiral rotation
run to run. In the event of a long term intensity
fluctuation (between runs), a new contour was
selected that enclosed a region of nearly the same
width as the old contour with the original inten-
sity.
A full set of intensity bands (as in plates Id and
If) was used initially to find an intensity contour
that was well defined for the full duration of the
run; tracking the contour between the black and
the violet in plate Ie, for instance, would have
been a poor choice. We chose the contour that
enclosed the narrowest region that was well de-
fined for all locations on the orbit. In this way,
little ambiguity existed as to where the curvature
was maximum along the contour. Lower intensity
contours that enclosed wider tips inevitably had
flat spots on the end, making tip definition impre-
cise. In a large majority of the images, the ambi-
guity was less than 4 horizontal pixel widths, or
45 pm. For all of the spirals observed, the overall
size of the orbit was never smaller than 1.1 mm,
making this source of error less than 4%.
If a given run were analyzed twice using two
different contours, there would be a small differ-
ence between the effective locations of the tip in
each image, and hence the two orbits would be
slightly different, but the qualitative shape of the
orbits traced would be the same. One of the
observables used to describe the tip orbit (radius
ratio-see section 3.1) is dependent on the con-
tour chosen, so to follow this observable with
better than 5% accuracy would require a more
stable light source than the mercury arc lamp
employed here.
Another source of error in establishing the true
orbit of the tip arose from the method of illumi-
nation. Incident light that was not normal to the
plane of the gel distorted the apparent shape and
intensity of the spiral tip (due to a shadowing
effect) in a way that depends on the orientation
of the tip relative to the illumination vector; this
produced an apparent elongation of the orbit.
The effect is reduced as the amount of oblique-
ness is decreased, but even at the minimum angle
of projection that avoided intercepting specular
reflections (about 59, there was still a small
amount of distortion.
Data acquisition was begun once a spiral state
was deemed asymptotic. Composite video images
were acquired every 30 s (averaged from 5 to 10
images 0.2 s apart to reduce noise; averaging
more than 10 frames produced no noticeable
improvement) and stored on a 70 Mb hard disk.
For the concentrations studied, no additional de-
tails of the motion appeared with faster sample
rates. Each image requires 256 Kb of memory, so
an upper limit on continuous data acquisition was
about 2 h.
The steps taken to identify the tip motion in a
given run were as follows. First, a computer pro-
gram recalled an image and performed any de-
sired processing; usually a reference image of a
wave-free gel was subtracted from the initial im-
age to remove aberration due to camera optics,
and the resulting image was lowpass-filtered
(3 x 3 or 5 x 5 convolution mask) before mapping
to false color in order to remove fuzziness from
the contours. Second, a pair of cross hairs was
superposed on the image and positioned on the
tip by the operator using cursor keys on the AT,
and with a carriage return, the pixel location of
the tip was entered into memory and the next
image in the sequence was recalled. Finally, after
processing the entire sequence, the orbit traced
by the tip was revealed by converting the succes-
sive pixel coordinate pairs into physical coordi-
nates and connecting the points with straight
lines.
3. Experimental results
3.1. Comparison to an epicycle
We will describe compound spiral tip orbits by
heuristic comparisons with retrograde epicycles,
generated by superposing two opposite circular
motions having independent radii (r,, Y?) and
rotational frequencies <f,, f2), as in fig. 4. In
Cartesian coordinates, they are represented para-
G.S. Skinner and H.L. Swinney /Chemical spiral rotation 9
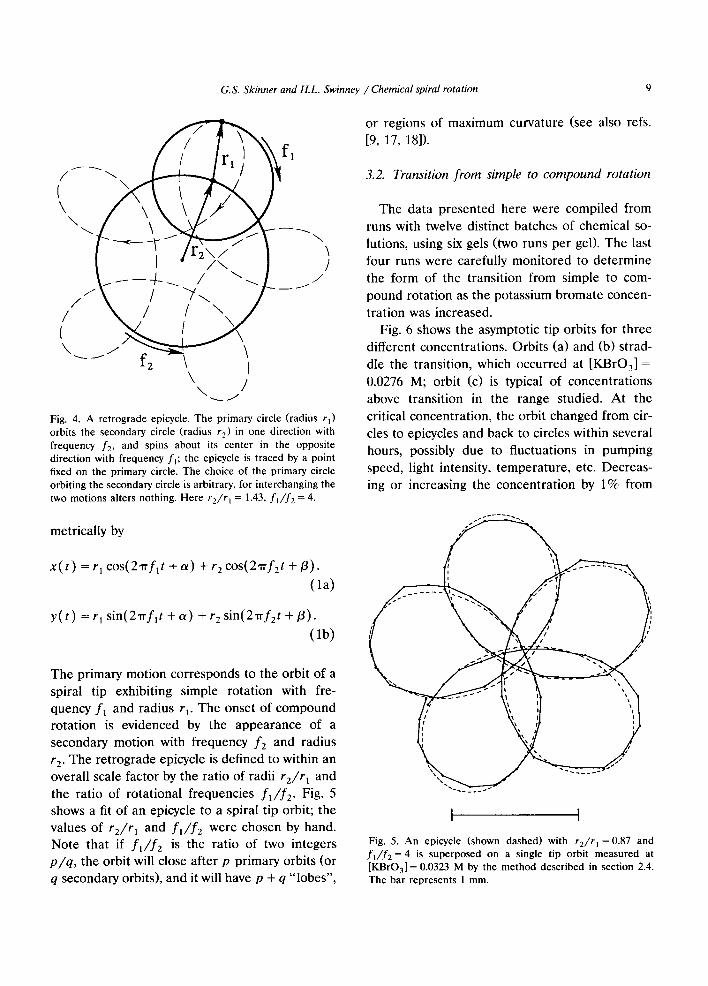
Fig. 4. A retrograde epicycle. The primary circle (radius r,) orbits the secondary circle (radius rz) in one direction with
frequency f2, and spins about its center in the opposite
direction with frequency f,; the epicycle is traced by a point
fixed on the primary circle. The choice of the primary circle
orbiting the secondary circle is arbitrary, for interchanging the
two motions alters nothing. Here r/r, = 1.43, fI/fz = 4.
metrically by
(la)
y(t) = rr sin(2nfrt + a) + r2 sin(2rf,t + p).
(lb)
The primary motion corresponds to the orbit of a spiral tip exhibiting simple rotation with fre- quency fI and radius rI. The onset of compound rotation is evidenced by the appearance of a secondary motion with frequency f2 and radius r2. The retrograde epicycle is defined to within an overall scale factor by the ratio of radii r2/r, and the ratio of rotational frequencies fl/f2. Fig. 5 shows a fit of an epicycle to a spiral tip orbit; the values of r2/r, and f,/f2 were chosen by hand. Note that if f,/f2 is the ratio of two integers p/q, the orbit will close after p primary orbits (or q secondary orbits), and it will have p + q “lobes”,
or regions of maximum curvature (see also refs.
[9, 17, 181).
3.2. Transition from simple to compound rotation
The data presented here were compiled from runs with twelve distinct batches of chemical so- lutions, using six gels (two runs per gel). The last four runs were carefully monitored to determine the form of the transition from simple to com- pound rotation as the potassium bromate concen- tration was increased.
Fig. 6 shows the asymptotic tip orbits for three different concentrations. Orbits (a) and (b) strad- dle the transition, which occurred at [KBrO,] = 0.0276 M; orbit (c) is typical of concentrations above transition in the range studied. At the critical concentration, the orbit changed from cir- cles to epicycles and back to circles within several hours, possibly due to fluctuations in speed, light intensity, temperature, etc. ing or increasing the concentration by
pumping Decreas- 1% from
I I
Fig. 5. An epicycle (shown dashed) with r2/r, = 0.87 and f,/fi = 4 is superposed on a single tip orbit measured at
[KBrO,] = 0.0323 M by the method described in section 2.4. The bar represents 1 mm.

10 G.S. Skinner and H.L. Swinney /Chemical spiral rotation
64 0.0270 @I
Fig. 6. Spiral tip orbits, obtained at the potassium bromate concentrations shown. The transition from simple to compound
rotation occurred at [KBrO,] = 0.0276 M. Orbit (a) represents 45 min, and (b) and (c) each represent 75 mitt; the sample interval
between points was 30 s. The large dots on orbits (b) and Cc) were the first points of each tracing. The bar represents 1 mm.
this critical value resulted in the states (a) or (b), respectively. These states were independent of the path taken in concentration space, i.e., the transi- tion is apparentIy supercritical. The increase in relaxation time that occurs as a supercritical tran- sition is approached was quite evident. Potassium bromate concentrations differing by 5% or more from 0.0276 M gave spirals that would decay to
(a)
their asymptotic orbits within 5 h of the last concentration change, but concentrations nearer to the critical value required substantially longer periods of time to settle. For example, orbits at 0.0273 and 0.0279 M required over 24 h to reach their asymptote. (An orbital state was deemed asymptotic if the orbits revealed in repeated tip tracings were the same to within experimental
(b)
Fig. 7. Transient orbits at the critical concentration, [KBrO,] = 0.0276 M. Transient states can last for several hours before
changing, sometimes very gradually and sometimes quite rapidly, to a different state. Other transient states observed at this concentration include circles and epicycles similar to (a) and (b) of fig. 6. The bar represents 1 mm.

G.S. Skinner and H.L. Swinney /Chemical spiral rotation II
II 11 8 I I I I I a a I I J
0.026 0.028 0.030 0.032 0.034 0.036 0.038
WBrOJ (M)
Fig. 8. The ratio r/r, as a function of the reservoir concen-
tration of potassium bromate. The measurements were ob-
tained by comparing several orbits at each concentration with
epicycles.
resolution.) Three transient orbital states typical of those observed at the critical concentration value are illustrated in fig. 7. These states were also briefly observed in the order shown when the concentration was increased to 0.0279 M or higher after stabilizing at 0.0273 M or lower.
The radius ratio, determined by comparison to epicycles, is plotted in fig. 8 as a function of the potassium bromate concentration. Errors as large as 5% may be present due to long-term variations in the light intensity, which change the effective tip location in the video image (section 2.4).
3.3. Time series construction
The average reflected light intensity from a fixed square that was small relative to the wave width was monitored in time to better elucidate the dynamics of the tip motion. For simple rota- tion, the intensity in the square is periodic in time, having a Fourier power spectrum (com- posed of a fundamental and its associated har- monics) that is independent of the spatial location of the square relative to the spiral cen-
ter. A time series and its power spectrum are shown in figs. 9a and 9b.
For compound rotation, the intensity in a square very far from the center of the spiral is also periodic in time due to the interaction of successive wave fronts. A subtly different time series results when the square is near the center (but is never encircled by the tip, i.e., every rotation of the spiral is seen by the square). A portion of a time series, taken 2 mm from the epicycle center of a spiral undergoing compound rotation with f,/f2 = 4 and its power spectrum are shown in figs. 9c and 9d.
The time series for compound rotation is a frequency-modulated version of the time series corresponding to simple rotation - the interval between successive passing fronts is not a con- stant but varies periodically. For compound rota- tion with a frequency ratio of 4, for example, the frequency of the modulation would be one fourth the frequency of the unmodulated pulses. Com- pound rotation can be thought of as a cyclic shift of the center about which simple rotation occurs; hence, if the center is moving away from the square, the spiral must rotate through an angle greater than 271. before the wave crosses the square, so the period between the (local) oscilla- tions increases. Conversely, as the center moves toward the square, the period decreases. This effect is discernable in the time series of fig. 9c; there is a periodic fluctuation in the interval between oscillations of about 5% of the average spiral period.
The existence of frequency modulation is read- ily apparent in the power spectrum of the time series. A generic narrow-band fm signal has side- bands (whose amplitude and shape are functions of the spectrum of the modulating signal) that symmetrically straddle the fundamental and har- monics of the “carrier signal”, which for our time series corresponds to the pulse train of local oscillations. These sidebands are quite evident in the power spectrum corresponding to compound rotation (fig. 9d). The modulation frequency can be extracted from the spectrum by determining

12 G.S. Skinner and H.L. Swinney /Chemical spiral rotation
1 500
400
300
200 - -I
0 moo 4cKKl 6om 8000
TIME (SEX) FREQUENCY (Hz)
Fig. 9. (a) Average intensity as a function of time inside a 3-pixel (35 km) square located 3 mm from the center of a spiral
undergoing simple rotation ([KBrO,] = 0.0270 M; sample interval, 2 s; duration of entire run, 43200 s). The intensity value for a
given sample was determined by averaging 3 video frames, 0.2 s apart, then averaging spatially over the 9 adjacent pixels in the
region selected. (b) Power spectrum of the full time series described in (a); ft is the frequency of rotation of the tip. Cc) Average
intensity as a function of time for a spiral undergoing compound rotation ([KBrO,] = 0.0281 MI with f,/fi - 4 and r2/r, ” 1; the
observation square was positioned 2 mm from the center of the epicycle. (The intensity was determined using a camera which has a
much better signal-to-noise ratio than the camera used in (a); all other parameters were as in (a).) Cd) Power spectrum of the full
time series described in (c). The carrier (f,) and sideband (ft kfi) frequencies of the compound rotation are identified.
the relative separation of each sideband from its
associated carrier harmonic; the ratio of this sep-
aration to the separation between the carrier
harmonics is the frequency ratio.
We have used the above technique to deter-
mine fr , f2, and f,/f2 as a function of [KBrO,],
as shown in fig. 10. Each data point represents a
full 12 h run, just as in fig. 9; they were not
collected in any particular order, since earlier
runs showed no path dependence. The nearness
of the frequency ratio to the integer 4 at the
transition (fig. 10~) suggests the possibility of fre-
quency locking [27]. However, frequency locking
would result in intervals of control parameter
within which the frequency ratio would remain
constant, and no such intervals were observed
within the resolution of our experiments. Beyond
the immediate neighborhood of the transition,
clear trends are evident as [KBrO,] is increased:
a linear rise in fr, a monotonic increase (slower
than linear) of f2, and a monotonic decrease of
f*/f2.

G.S. Skinner and H.L. Swinney /Chemical spiral rotation 13
1.8
1.7
1.6
1.5
1.4
1.3
5; 2 - 5 0.45
s E 0.40 -
*
!A$ 0.35 -
!z
8 0.30 - 3
(b)
0
OO
0
0
0
0
0
0
, .., . . . . . . . . (4
0 O 0
0
0 0
0
0.027 0.029 0.031 0.033 0.035 0.037 0.039
WBrOJl (M)
Fig. 10. The primary (f,) and secondary (f2) frequencies of
spiral rotation (in mHz) and their ratio (f,/f2) are plotted in
(a)-(c), respectively, as a function of potassium bromate con-
centration in the reservoir. The dashed line in (a) separates
the regions of simple and compound rotation.
3.4. Oscillations in curvature and brightness during compound rotation
A periodic fluctuation in the wave structure was observed near the tip during compound rota- tion. Note in plate Ie the marked temporal varia- tion in the wave curvature and brightness, indi- cated by the changing width of the tip enclosed in
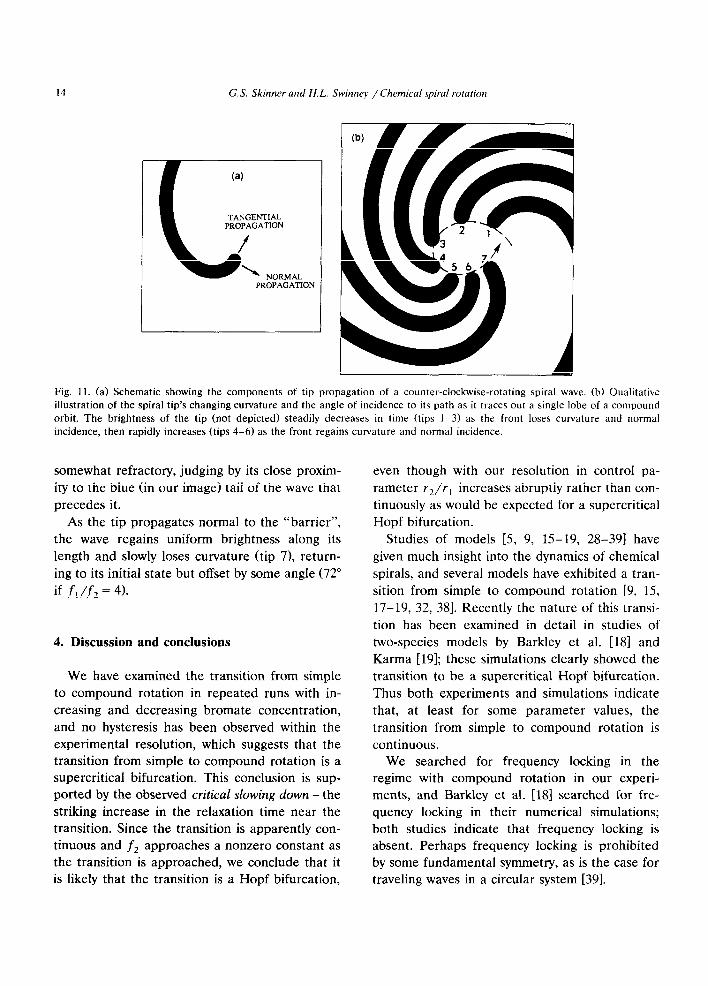
black. The brightness (blueness in true color) is related to the concentration of ferriin relative to ferroin, and the curvature to which we refer is that of the contour of maximum brightness (not that of a contour surrounding the tip). Plates Id and If illustrate clearly the varying curvature and brightness during different stages of compound rotation. We describe in the following paragraphs the observed sequence of events as a tip traces out a single lobe’of its orbit. Refer to fig. lla for our convention regarding tip motion, and fig. lib for an illustration of the sequence.
We begin with tip 1 in fig. llb. Here, the tip appears uniformly bright and propagation is mostly in the normal direction (fig. lla). Within a few minutes, the tangential component of tip motion grows to nearly the same magnitude as the normal component (tip 3). The result of this motion is a wave with lower curvature and bright- ness near its tip than elsewhere. The combination of the tangential and normal motions causes the orbit traced by the tip to curve sharply. The brightness of the tip region attains a minimum at this stage, which is near the outermost point of the epicycle lobe. Additionally, the width of the refractory tail of the wave (represented in plates Id and If by wide green and blue bands behind the front) gradually becomes narrower as one moves along the wave toward its tip, and the tip points (i.e. the direction of tangential propaga- tion) into a region that is apparently quiescent. The lack of a substantial refractory tail near the tip presumably allows the portion of the wave nearest its tip to become sharply curved (tip 5 and plate If).
Next, the tip begins to behave as though a barrier has been erected, acting to stop tangential motion by reflecting the diffusive flux and causing the tip to grow in brightness. At this stage, the innermost turn of the spiral has three distinct regions (plate If): the tip (brightest), a region of sharp curvature near the tip (dimmest), and the remainder of the wave. The width of the refrac- tory tail now decreases quite sharply near the tip, and the spiral tip points into a region that is
14 G.S. Skinner and H.L. Swinney /Chemical spiral rotation
TANGENTIAL PROPAGATION
NORMAL PROPAGATION
Fig. 11. (a) Schematic showing the components of tip propagation of a counter-clockwise-rotating spiral wave. (b) Qualitative
illustration of the spiral tip’s changing curvature and the angle of incidence to its path as it traces out a single lobe of a compound
orbit. The brightness of the tip (not depicted) steadily decreases in time (tips I-3) as the front loses curvature and normal
incidence, then rapidly increases (tips 4-6) as the front regains curvature and normal incidence.
somewhat refractory, judging by its close proxim-
ity to the blue (in our image) tail of the wave that
precedes it.
As the tip propagates normal to the “barrier”,
the wave regains uniform brightness along its
length and slowly loses curvature (tip 7), return-
ing to its initial state but offset by some angle (72”
if fr/f2 = 4).
4. Discussion and conclusions
We have examined the transition from simple
to compound rotation in repeated runs with in-
creasing and decreasing bromate concentration,
and no hysteresis has been observed within the
experimental resolution, which suggests that the
transition from simple to compound rotation is a
supercritical bifurcation. This conclusion is sup-
ported by the observed critical slowing down -the striking increase in the relaxation time near the
transition. Since the transition is apparently con-
tinuous and f2 approaches a nonzero constant as
the transition is approached, we conclude that it
is likely that the transition is a Hopf bifurcation,
even though with our resolution in control pa-
rameter r2/r, increases abruptly rather than con-
tinuously as would be expected for a supercritical
Hopf bifurcation.
Studies of models [5, 9, 15-19, 28-391 have
given much insight into the dynamics of chemical
spirals, and several models have exhibited a tran-
sition from simple to compound rotation [9, 15,
17-19, 32, 381. Recently the nature of this transi-
tion has been examined in detail in studies of
two-species models by Barkley et al. [18] and
Karma [19]; these simulations clearly showed the
transition to be a supercritical Hopf bifurcation.
Thus both experiments and simulations indicate
that, at least for some parameter values, the
transition from simple to compound rotation is
continuous.
We searched for frequency locking in the
regime with compound rotation in our experi-
ments, and Barkley et al. [18] searched for fre-
quency locking in their numerical simulations;
both studies indicate that frequency locking is
absent. Perhaps frequency locking is prohibited
by some fundamental symmetry, as is the case for
traveling waves in a circular system [39].
G.S. Skinner and H. L. Swinney / Chemical spiral rotation 15
Our observations lead us to suggest a mecha- nism for the tip instability that we hope can serve as a guide to future analyses of the spiral tip. We propose that the barrier referred to in section 3.4 is actually the refractory tail of the wave preced- ing the tip, based on the following observations. We observe that as [KBrO,] is increased, the width of refractory tail (defined by an arbitrary intensity contour) of any wave decreases (see also ref. [201X Also, in the range of simple rotation, the radius of the orbit (the tip’s “turning radius”) decreases with increasing [KBrO,]. If the ratio of the turning radius to the width of the refractory tail initially decreases as [KBrO,] is increased, at some point an instability will arise. The tip will try to trace out a small circle, but will only complete a portion of it before further tight turn- ing is impeded by its own refractory wake, making simple rotation impossible, so that compound ro- tation develops.
For higher [KBrO,], the ratio of the turning radius to the refractory tail width may increase; if the turning radius were to become sufficiently large in relation to the tail width, the instability would disappear and simple rotation would re- turn. We have observed such a reuerse transition from compound to simple rotation at [KBrO,] = 0.09 M, but unfortunately the transition was ac- companied by oscillations in the reactor reservoir, even with [KBr] as high as 0.01 M (see section 2.1).
In the work of Jahnke et al. [9], the excitability of the medium was decreased (by decreasing [H,SO,]) and a transition from simple to com- pound rotation resulted. In our experiments, the excitability was increased (by increasing [KBrO,]) to produce a transition from simple to compound rotation. Hence, it seems likely that there exists a range of excitability over which compound rota- tion is evident. This could be confirmed by fur- ther work on the reverse transition noted above.
It is important to note that all of our results were obtained from observations of the recovery species (ferriin), not of the propagator species (bromous acid). Our references to the tip “propa-
gating” are rigorously incorrect, for we can only observe the result of the propagation. Until an experimental technique can be found that moni- tors the propagator wave, we must be content with the results of numerical simulations in re- vealing its shape and motion.
Our work raises many questions that should be addressed in future studies. Is the functional form of the tip trajectory actually an epicycle? Fig. 5 suggests that there may be a small departure from epicyclic motion (given by eq. (1)); also, Barkley et al. [18] found in their simulations that the paths corresponding to compound rotations were not epicycles. What are the conditions lead- ing to a supercritical or subcritical transition from simple to compound rotation? Does compound rotation always occur over a finite range of con- trol parameter, and if so, does the instability in the tip motion arise from the mechanism sug- gested above? Our determination of tip orbit parameters presumed a superposition of uniform, circular motions, i.e., the reported values are time averages. What is the time dependence of the tip velocity? Future experiments and numeri- cal and theoretical analyses could provide an- swers to these questions.
Acknowledgements
We thank A. Arneodo, K. Lee, W.D. Mc- Cormick, Z. Noszticzius, W.Y. Tam, and A.T. Winfree for helpful discussions. This work was supported by the Department of Energy Office of Basic Energy Sciences and the Texas Advanced Research Program.
References
[l] A.T. Winfree, When Time Breaks Down (Princeton Univ. Press, Princeton, NJ, 1987) ch. 7, p. 169.
[2] M.A. Allessie, F.I.M. Bonke and F.J.G. Schopman, Circ.
Res. 33 (1973) 54; 41 (1977) 9; Clin. Res. 96 (1976) 768. [3] P.C. Newell and F.M. Ross, J. Gen. Microbial. 128 (1982)
2715.

16 G.S. Skinner and H.L. Swinney /Chemical spiral rotation
[4] S.C. Miiller, T. Plesser and B. Hess, Physica D 24 (19871
87.
[S] J.P. Keener and J.J. Tyson, Physica D 21 (19861 307:
J.P. Keener, SIAM J. Appl. Math. 46 (19861 1039.
[6] A.T. Winfree, Science 175 (19721 634.
[7] K.I. Agladze, Proc. Biological Center of Academy of
Science, Pushchino, USSR (19831.
[S] K.I. Agladze, A.V. Panfilov and A.N. Rudenko, Physica
D 29 (1988) 409.
[9] W. Jahnke, W.E. Skaggs and A.T. Winfree, J. Phys.
Chem. 93 (1989) 740.
[lo] T. Plesser, S.C. Miller and B. Hess, J. Phys. Chem. 94
(1990) 7501.
[ll] F.B. Gulko and A.A. Petrov, Biofizika 17 (1972) 261.
[12] 0. Rossler and C. Kahlert, Z. Naturforsch. 34 (1979) 565.
[I31 F.J. van Capelle and D. Durrer, Circ. Res. 47 (1980) 454.
[14] A.M. Pertsov, E.A. Ermakova and A.V. Pantilov, Physica
D 14 (19841 117. [l5] V.S. Zykov, Simulation of Wave Processes in Excitable
Media (English translation) (Manchester Univ. Press,
Manchester, 19871.
[16] J.J. Tyson and J.P. Keener, Physica D 32 (19881 327;
J.J. Tyson, K.A. Alexander. V.S. Manoranjan and J.D.
Murray, Physica D 34 (19891 193.
[17] E. Lugosi, Physica D 40 (19891 331.
[18] D. Barkley, M. Kness and L.S. Tuckerman, Phys. Rev. A
42 (1990) 2489.
[19] A. Karma, Phys. Rev. Lett. 65 (1990) 2824. [20] W.Y. Tam, W. Horsthemke, Z. Noszticzius and H.L.
Swinney, J. Chem. Phys. 88 (1988) 3395.
[21] Z. Noszticzius, W.D. McCormick and H.L. Swinney,
J. Phys. Chem. 91 (1987) 5129.
[22] R.J. Field, E. Koriis and R.M. Noyes, J. Am. Chem. Sot.
94 (1972) 8649.
[23] Z. Noszticzius, M. Wittman and P. Sterling, 4th Symp.
Ion Selective Electrodes (19841.
1241 Z. Noszticzius, W. Horsthemke, W.D. McCormick, H.L.
Swinney and W.Y. Tam, Nature 329 (19871 619.
[25] V.I. Krinsky and K.I. Agladze, Physica D 8 (1983) 50.
[26] K.I. Agladze, V.A. Davydov and A.S. Mikailov, JETP
Lett. 45 (1987) 767.
[27] V.I. Arnold, Geometrical Methods in the Theory of
Ordinary Differential Equations (Springer, Berlin, 19831,
pp. 304-307, fig. 149.
1281 V.I. Krinsky and B.A. Malomed, Physica D 9 (1983) 81;
A.S. Mikhailov and V.I. Krinsky, Physica D 9 (1983) 346.
[29] D. Walgraef, G. Dewel and P. Borckmans, J. Chem.
Phys. 78 (19831 3043.
[30] P.C. Fife, J. Stat. Phys. 39 (1985) 687.
[31] A.B. Rovinsky, J. Phys. Chem. 90 (19861 217.
[32] V.S. Zykov, Biofizika 31 (1986) 862; 32 (1987) 337.
[33] E. Meron and P. Pelct, Phys. Rev. Lett. 60 (19881 1880;
E. Meron, Phys. Rev. Lett. 63 (19891 684;
C. Elphick, E. Meron and E.A. Spiegel, SIAM J. Appl.
Math. 50 (1990) 490.
[34] D.A. Kessler and H. Levine, Physica D 29 (19891 1;
Physica D, to appear.
[35] IS. Aranson and M.I. Rabinovich, J. Phys. A 23 (1990)
299.
[36] P.B. Monk and M.G. Othmer, Proc. R. Sot. London B
240 (19901 555
[37] M.N. Chee, R. Kapral and S.G. Whittington, J. Chem.
Phys. 92 (1990) 7302, 7315.
[38] D. Barkley, A model for fast computer simulation of
waves in excitable media, in: Proceedings of the Confer-
ence on Waves and Patterns in Chemical and Biological
Media, Pushchino, USSR, 28 May-l June, 1990, to be
published in Physica D; A coupled-map lattice for simu-
lating waves in excitable media, in: Nonlinear Structures
in Physical Systems, eds. L. Lam and H.C. Morris
(Springer, Berlin, 1990) p. 192.
[39] D.A. Rand, Arch. Rat. Mech. Anal. 79 (19821 I.