Embed Size (px)
Citation preview

PERIODIC MONITORING OF MARINE ENVIRONMENT FOR MSPL OUTFALL,
BHAVNAGAR, GUJARAT
PROJECT CODE: 656041920
MADHU SILICA PRIVATE LIMITED
BHAVNAGAR, GUJARAT
INDOMER COASTAL HYDRAULICS (P) LTD. (ISO 9001: 2015 CERTIFIED, QCI - NABET & NABL)
63, GANDHI ROAD, ALWAR THIRUNAGAR, CHENNAI 600 087. Tel: + 91 44 2486 2482 to 84; M: + 91 99401 41650; Fax: + 91 44 2486 2484
Web site: www.indomer.com, E-mail:[email protected]
Monitoring Report - 4 of 4/2020-21 February 2021
INDOMER COASTAL HYDRAULICS (P) LTD.
(ISO 9001 : 2015 CERTIFIED,QCI-NABET, NABL & CDC-MoST ACCREDITED)
63, Gandhi Road, Alwar Thirunagar, Chennai 600 087.
Tel: + 91 44 2486 2482 to 84; M: + 91 99401 41650; Fax: + 91 44 2486 2484
Web site: www.indomer.com, E-mail: [email protected]
Client Madhu Silica Private Limited, Bhavnagar.
Project Title Periodic Monitoring of Marine Environment for MSPL Outfall, Bhavnagar, Gujarat for the year
2020-21.
Project Code 656041920
Abstract Madhu Silica Private Limited (MSPL) is discharging 10 MLD treated industrial effluent in
Bhavnagar Creek for which MoEFCC-CRZ clearance was obtained vide F. No. 11-6/2015-IA-III dt.
29.06.2015.
Subsequently, MSPL has been submitting the Periodic Monitoring Reports every 3 months.
Status of reports for year 2020-21
May 2020 – 1 of 4 – Due to COVID 19 sampling activities were not performed.
Aug 2020 – 2 of 4 – Sample was collected and report submitted
Nov 2020 – 3 of 4 – Due to COVID 19 sampling activities were not performed.
Feb 2021 – 4 of 4 – Present report
*Due to COVID-19 Nationwide lockdown and strict interstate travel protocols, quarterly monitoring study for the period Oct 2020 – Dec 2020 was not conducted. The task of quarterly monitoring study for Jan 2021 to Mar 2021 is taken up immediately after the interstate relaxations and this form as the 4th season Quarterly Monitoring Report for the year 2020-21.
Document type Controlled
References W.O. Email dt. 23/04/2019
Date Report Type Originator Checked by Approved by Approver's sign
29.03.21 Final Mr. J. Jaganmohan/
Dr. N. Veerapandian Mr. J. Guru Prasath Dr. P. Chandramohan
1 Project Code 656041920 Text pages 27
2 File Location \\192.168.1.200/Indomer/MSPL/Report Tables 19
Figures 5

MSPL INDOMER
Periodic Monitoring of Marine Environment for MSPL Outfall, Bhavnagar, Gujarat Page i
February 2021
CONTENT
Page
Content i
List of Tables ii
List of Figures iii
1 PROJECT DESCRIPTION 1
2 SCOPE OF MONITORING 2
3 DATA COLLECTION FOR MONITORING 3
4 RESULTS 6
4.1 Water quality 6
4.2 Sediment quality 7
4.3 Biological parameters 7
5 ENVIRONMENTAL STATUS - COMPARISON WITH PRE-PROJECT PERIOD 9
Annexure I – QCI NABET accreditation certificate
Annexure II – NABL accreditation certificate
Annexure III - NABL accreditation certificate of outsource laboratory

MSPL INDOMER
Periodic Monitoring of Marine Environment for MSPL Outfall, Bhavnagar, Gujarat Page ii
February 2021
LIST OF TABLES
Table
1 Details of sampling locations
2 Water quality parameters at Bhavnagar creek (February 2021)
3 Biochemical Oxygen Demand and Chemical Oxygen Demand at Bhavnagar creek water
(February 2021)
4 Concentration of Heavy Metals, Phenols and Total Petroleum Hydrocarbons at Bhavnagar
creek water (February 2021)
5 Sediment texture at Bhavnagar creek (February 2021)
6 Sediment quality parameters at Bhavnagar creek (February 2021)
7 Concentration of Heavy Metals, Phenols and Total Petroleum Hydrocarbons in sediments
at Bhavnagar creek (February 2021)
8 Primary productivity at Bhavnagar creek water (February 2021)
9 Phytoplankton species composition at Bhavnagar creek water (February 2021)
10 Phytoplankton numerical abundance (cells/l) at Bhavnagar creek water (February 2021)
11 Phytoplankton population at Bhavnagar creek water (February 2021)
12 Numerical abundance of zooplankton (nos./100m3)at Bhavnagar creek water (February
2021)
13 Zooplankton diversity abundance and biomass at Bhavnagar creek water (February 2021)
14 Subtidal and Intertidal benthic population at Bhavnagar creek (February 2021)
15 Bacterial population at Bhavnagar creek water (x103CFU/ml) (February 2021)
16 Bacterial population at Bhavnagar creek sediments (x 104 CFU/g) (February 2021)
17 Comparison of Water quality parameters between Pre-project period (May 2013) and
Monitoring period (February 2021)
18 Comparison of Sediment quality parameters between Pre-project period (May 2013) and
Monitoring period (February 2021)
19 Comparison of Biological parameters between Pre-project period (May 2013) and
Monitoring period (February 2021)

MSPL INDOMER
Periodic Monitoring of Marine Environment for MSPL Outfall, Bhavnagar, Gujarat Page iii
February 2021
LIST OF FIGURES
Figure
1 Location map
2 Sampling locations
3 Comparison of Water quality parameters during monitoring period (February 2019 -
February 2021)
4 Comparison of Sediment quality parameters during monitoring period (February 2019 -
February 2021)
5 Comparison of Biological parameters during monitoring period (February 2019 – February
2021)

MSPL INDOMER
Periodic Monitoring of Marine Environment for MSPL Outfall, Bhavnagar, Gujarat Page 1
February 2021
1. PROJECT DESCRIPTION
Madhu Silica Pvt. Ltd. (MSPL), Bhavnagar, is the largest manufacturer of precipitated Silica in
India and it is the 3rd largest company in the world. MSPL with its allied company Aqua gel
Chemicals Pvt. Ltd., is having seven established plants capable of manufacturing around 95000
MT of precipitated Silica per annum. It has recently established a state of art plant with capacity
of 45000 MT/Annum in Bhavnagar. The company has a large business associate network in India
and Asia, Middle East, Latin America, US & Europe. Apart from the large Indian market, the
company exports their products to more than 40 countries. The company has on its credit ISO
9001:2008, ISO 14001:2004, OHSAS 18001:2007, FAMI-QS, FDA certified and registered for each.
MSPL has planned for capacity expansion in 28 acres of land towards total installed capacity of
precipitate Silica of 95000 MT/Annum. Under this development process, MSPL has obtained
permission to discharge additional 10 MLD (417 m3/hour) treated industrial effluent in the marine
environment. It has laid a submarine pipeline with diffuser on the creek bed for discharging the
effluent.
MSPL obtained MoEFCC clearance vide F. No. 11-6/2015-IA-III dt. 29.06.2015. The post project
monitoring is being carried out for four seasons in a year to comply the conditions of MoEFCC
covering the aspects of seawater quality, seabed sediment quality and marine benthic flora &
fauna. The monitoring studies are being carried out from May 2017 i.e. since the
commencement of project on quarterly basis. The periodic monitoring reports are being
regularly submitted to the Regional Office of MoEFCC, Bhopal. This report forms as the fourth
periodic monitoring (February 2021) for the year 2020 - 2021.
Due to COVID-19 Nationwide lockdown and strict interstate travel protocols, quarterly
monitoring study for the period Oct 2020 – Dec 2020 was not conducted. The task of quarterly
monitoring study for Jan 2021 to Mar 2021 is taken up immediately after the interstate relaxations
and this forms as the 4th season Quarterly Monitoring Report for the year 2020-21.
The location map is shown in Fig. 1 and the effluent outfall location is shown in Fig. 2.
2. SCOPE OF MONITORING

MSPL INDOMER
Periodic Monitoring of Marine Environment for MSPL Outfall, Bhavnagar, Gujarat Page 2
February 2021
Periodic monitoring near the outfall location as suggested in the Post Project Monitoring Plan of
the EIA report was recommended by the MoEFCC. Accordingly, MSPL has asked Indomer Coastal
Hydraulics (P) Ltd, Chennai, to take up periodic monitoring programme. It was proposed to
conduct quarterly monitoring covering four times in a year i.e., in the months of May, August,
November and February every year during the project operational period.
Indomer Coastal Hydraulics (P) Ltd., Chennai is an ISO 9001:2015 organization, NABL and QCI -
NABET accredited organization vide NABET/EIA/1720/SA90 dt. 27.05.2019 for Sector 27: Oil & Gas
Transportation pipeline (crude and refinery/petrochemical products), passing through national
parks/ sanctuaries/ coral reefs/ ecologically sensitive areas including LNG Terminal and Sector 33:
Ports, harbours, jetties, marine terminals, breakwaters and dredging.
QCI-NABET accreditation certificate is attached as Annexure I (Certificate and Period Extension
Letter).
MSPL INDOMER
Periodic Monitoring of Marine Environment for MSPL Outfall, Bhavnagar, Gujarat Page 3
February 2021
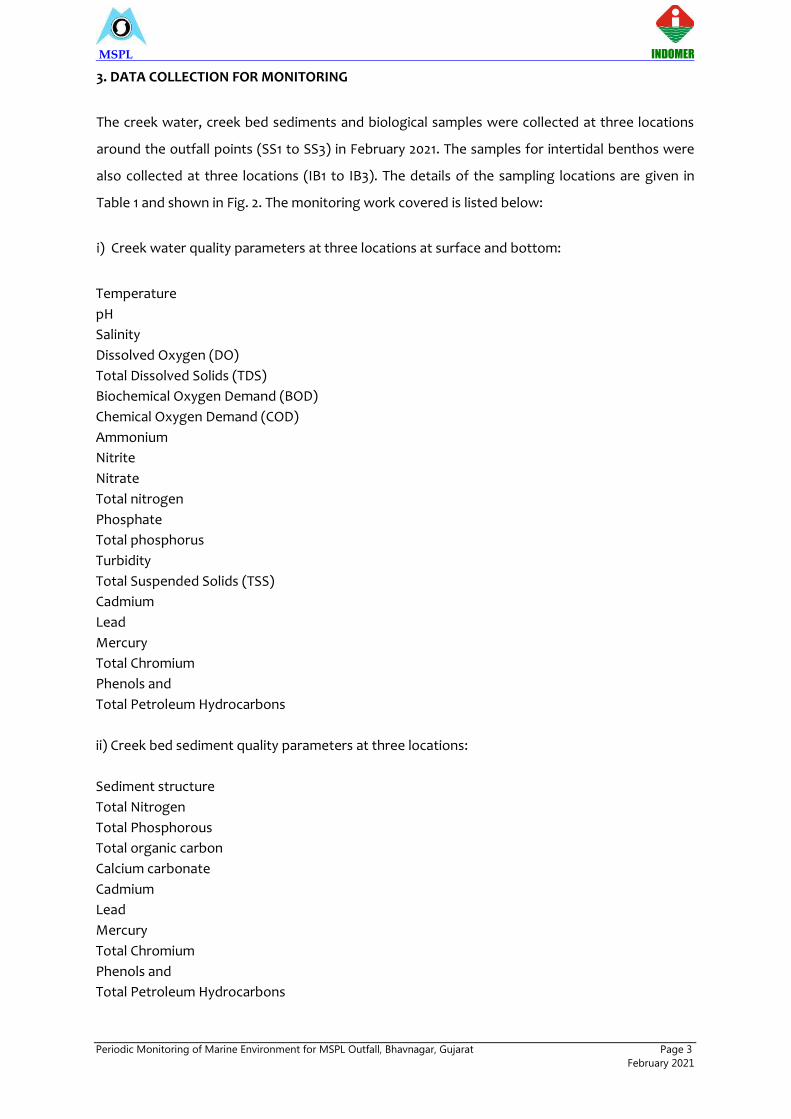
3. DATA COLLECTION FOR MONITORING
The creek water, creek bed sediments and biological samples were collected at three locations
around the outfall points (SS1 to SS3) in February 2021. The samples for intertidal benthos were
also collected at three locations (IB1 to IB3). The details of the sampling locations are given in
Table 1 and shown in Fig. 2. The monitoring work covered is listed below:
i) Creek water quality parameters at three locations at surface and bottom:
Temperature
pH
Salinity
Dissolved Oxygen (DO)
Total Dissolved Solids (TDS)
Biochemical Oxygen Demand (BOD)
Chemical Oxygen Demand (COD)
Ammonium
Nitrite
Nitrate
Total nitrogen
Phosphate
Total phosphorus
Turbidity
Total Suspended Solids (TSS)
Cadmium
Lead
Mercury
Total Chromium
Phenols and
Total Petroleum Hydrocarbons
ii) Creek bed sediment quality parameters at three locations:
Sediment structure
Total Nitrogen
Total Phosphorous
Total organic carbon
Calcium carbonate
Cadmium
Lead
Mercury
Total Chromium
Phenols and
Total Petroleum Hydrocarbons

MSPL INDOMER
Periodic Monitoring of Marine Environment for MSPL Outfall, Bhavnagar, Gujarat Page 4
February 2021
iii) Biological parameters at three locations on:
Primary Productivity
Phytoplankton, its biomass and diversity
Zooplankton, its biomass and diversity
Sub-tidal and inter-tidal macro benthos, its biomass and diversity and
Microbial population in creek water and sediment
Analysis: All the water and sediment parameters were analyzed by Indomer Coastal Hydraulics
Pvt. Ltd., which is accredited by the National Accreditation Board for Testing and Calibration
Laboratories (NABL) vide certificate no. TC – 5232/13.01.2019. NABL – QCI accreditation certificate
of Indomer is attached as Annexure II. Analysis of Total Petroleum Hydrocarbons in creek water
and sediment samples was outsourced to NABL accredited Laboratory. NABL – QCI accreditation
certificate of outsourced laboratory is attached as Annexure III.

MSPL INDOMER
Periodic Monitoring of Marine Environment for MSPL Outfall, Bhavnagar, Gujarat Page 5
February 2021
Sample Analysis Protocol: Creek water and creek bed sediment samples were analyzed as per the
IS/APHA/USEPA standard methods, details of which are given below.
Sl.No. Parameters Protocol
Water quality
1 Temperature IS 3025 (Part 9) 1984
2 pH IS 2720 (Part 11) 1983
3 Salinity IND/SOP/WQ/13
4 Dissolved Oxygen IS 3025 (Part 38) 1989
5 Total Dissolved Solids IS 3025 (Part 16) 1984
6 BOD IS 3025 (Part 44) 1993
7 COD IS 3025 (part 58) 2006
8 Turbidity IS 3025 (Part 10) 1984
9 Ammonium IS 3025 (Part 34) 1988
10 Nitrite IS 3025 (Part 34) 1988
11 Nitrate IS 3025 (Part 34) 1988
12 Phosphate IS 3025 (Part 31) 1988
13 Total Nitrogen IS 3025 (Part 34) 1988
14 Total Phosphorous IS 3025 (Part 31) 1988
15 Total Suspended Solids IS 3025 (Part 17) 1984
16 Cadmium IS 3025 (Part 2) 2014
17 Lead IS 3025 (Part 2) 2014
18 Chromium IS 3025 (Part 2) 2014
19 Mercury IND/SOP/WQ/35
20 Phenols IS 3025 (Part 43) 1992
21 Petroleum Hydrocarbons TNRCC method 1055
Sediment quality
1 Total Organic Carbon IS 2720 (Part 22) 1972
2 Total Nitrogen IS 14684 – 1999
3 Total Phosphorous IS 10158 – 1982
4 Calcium carbonate IS 2720 (Part 23) 1976
5 Cadmium USEPA 3050 B
6 Lead USEPA 3050 B
7 Chromium USEPA 3050 B
8 Mercury USEPA 3050 B
9 Phenols USEPA 8041 & 3545 A
10 Petroleum Hydrocarbons TNRCC method 1055

MSPL INDOMER
Periodic Monitoring of Marine Environment for MSPL Outfall, Bhavnagar, Gujarat Page 6
February 2021
4. RESULTS
4.1. Water quality
The estimated creek water quality parameters on temperature, pH, salinity, total dissolved solids,
dissolved oxygen, ammonium-nitrogen, nitrite-nitrogen, nitrate-nitrogen, total nitrogen,
phosphate-phosphorus, total phosphorus, total suspended solids, and turbidity are presented in
Table 2. Biochemical Oxygen Demand and Chemical Oxygen Demand are presented in Table 3.
Results of the heavy metals cadmium, lead, total chromium, mercury, phenols and total
petroleum hydrocarbons are presented in Table 4.
During the present study, creek water salinity ranged from 32.5 to 33.4 PSU. The values of salinity
were in normal range during the present sampling period. pH range was 7.88 to 7.97 and it was
found to be slightly high compared to previous study. The range of TSS (1270 to 1584 mg/l) was
found to be slightly high compared to the previous sampling August 2020. Dissolved oxygen
values varied from 5.3 to 5.6 mg/l which is small fluctuate to the earlier reported values. BOD
values were also found to be normal (<2mg/l) like earlier periods at all the three stations.
Ammonium, Nitrite, Nitrate, Total Nitrogen, Phosphate and Total Phosphorus concentration levels
show seasonal variation and however all the nutrients values are observed to be within the
normal range. Cadmium levels ranged from 1.82 to 2.2 µg/l and Chromium concentration ranged
from 2.24 to 2.48 µg/l. However, the metals were observed to be in trace level at these three
study areas. Similarly, phenols and total petroleum hydrocarbons were also found to be below
detectable levels during the present study.
Creek water values of Turbidity, TSS, DO, BOD, nutrients, heavy metals and other organic
compounds were found to be in normal range. Hence, it can be confirmed that treated effluent
has been discharging into the creek environment at appropriate time and intervals.

MSPL INDOMER
Periodic Monitoring of Marine Environment for MSPL Outfall, Bhavnagar, Gujarat Page 7
February 2021
4.2. Sediment quality
The creek bed sediment quality parameters collected at 3 locations (SB1, SB2 and SB3) are given in
Tables 5 and 6. Results of cadmium, lead, total chromium, mercury, phenols and total petroleum
hydrocarbons in sediments are presented in Table 7. Sediment texture during the present study
period was fine sand nature at all stations. Total phosphorus, calcium carbonate, total nitrogen
and total organic carbon values at all stations slightly varied compared than pre-project period
study. Total nitrogen values ranged from 16.4 to 26.4 mg/kg at the three stations. Cadmium,
mercury, lead, phenols and total petroleum hydrocarbon levels were found to be below
detectable limit at all the three stations. However, marginal difference was observed in the
chromium level, between the pre-project period and the present study (22.4 to 32.6 mg/kg).
4.3. Biological parameters
Phytoplankton and primary productivity: Phytoplankton are the primary source of food in the
marine environment. The concentration and numerical abundance of the phytoplankton indicate
the fertility of a region. The phytoplankton population depends primarily upon the nutrients
present in the creek water and the sunlight for photosynthesis. This primary production is an
important source of food for the higher organisms in the marine environment. The measured
primary production results indicate that the area is moderately productive, and the values varied
between 330 and 420 mgC/m3/day; the recorded average value is 370 mgC/m3/day (Table 8).
Various phytoplankton groups were observed, and their percentage composition and numerical
abundance are shown in Tables 9 and 10. Phytoplankton diversity fluctuated from 16 to 21 species.
Bacillariophyceae (Diatoms) formed the major group followed by Dinophyceae (Dinoflagellates)
and Cyanophyceae (blue green algae). Phytoplankton population density varied from 1450 to
2900 cells/l (Table 11). In the present study, the number of species and population density
observed were slightly high compared to previous report (Table 19).
Sediment texture was found to be predominantly silt clay nature. The levels of trace metals
mercury and lead at all three stations along with phenols and petroleum hydrocarbons in the
sediment were found to be below detectable level. Chromium values ranged from 22.4 to 32.6
mg/kg at all three stations. In general, these conditions reflect that the creek bed sediments are
normal and remain uncontaminated.

MSPL INDOMER
Periodic Monitoring of Marine Environment for MSPL Outfall, Bhavnagar, Gujarat Page 8
February 2021
Phytoplankton population mostly consists of Bacillariophyceae (63.15%), Dinophyceae (24.81%) and
Cyanophyceae (12.40%). During the study periods Skeletonema costatum and Chlorella sp. were the
most dominant species in the study area followed by Pleurosigma directum, Trichodesmium
erythraeum, Navicula henneydii and Diplopsalopsis sp.
Zooplankton: The numerical abundance of zooplankton varied from 7159 to 10034 nos./100m3
(Table 12). The highest zooplankton population was observed at SS2 and the lowest was observed
at SS1. The zooplankton biomass varied from 9.6 to 11.7 ml/100m3 (Table 13). In the present study,
zooplankton biomass and density showed marginal variation when compared to previous study
(Table 19). The most dominant zooplankton species were Acartia erythraea, Tintinnopsis sp.,
Clausocalanus minor, Euterpina acutifrons and Oikopleura sp. than the other species.
Benthos: Benthic faunal population in an environment depends on the nature of the substratum
and the organic matter content of the substratum.
Sub-tidal benthos: The numerical abundance of the benthic fauna varied from 280 to 400 nos./m2
(Table 14). The subtidal fauna population was slightly higher, when compared to previous study
period (Table 19).
Inter-tidal benthos: The intertidal faunal population is shown in Table 14. The existence of fauna
appeared to be moderate in the three (IB1 to IB3) locations. The numerical abundance of the
intertidal benthic fauna varied between 150 and 210 nos./m2 which is slightly higher than the
earlier recorded values (Table 19).
Microbiology: Bacterial counts in the water and sediment samples were analyzed and are
presented in Tables 15 and 16. In the water samples, population density varied from 0.02 to
5.19×10³ CFU/ml. In the sediment, the population density varied from 0.01 to 5.26×10⁴ CFU/g.
Bacterial population was slightly higher in sediment samples compared to the water samples. In
general, there is not much of a variation observed between the present and earlier values both in
creek water and sediment.
Primary production, phytoplankton, zooplankton, are found to be in normal values. The
sub-tidal and inter-tidal benthic population showed normal range at all three stations
during the study. Bacterial population in water and sediments also indicated normal range.

MSPL INDOMER
Periodic Monitoring of Marine Environment for MSPL Outfall, Bhavnagar, Gujarat Page 9
February 2021
5. ENVIRONMENTAL STATUS - COMPARISON WITH PRE-PROJECT PERIOD
Comparison of water quality, sediment quality and biological parameter results were carried out
between the pre-project period (May 2013) and the periodic monitoring results of February 2021
as given in Tables 17, 18 and 19. Comparison of water quality, sediment quality and biological
parameters during monitoring period (February 2019 – February 2021) are shown in Figures 3, 4
and 5 respectively.
Water Quality
It is inferred that the water quality parameters showed normal range as applicable for the creek
waters in Bhavnagar and they are comparable with the pre-project period results. The differences
are very marginal, and they are due to seasonal variation which is common for creek waters.
Sediment quality
Sediment texture was predominantly towards fine sand in nature during present study and other
chemical properties are observed to be in normal range and there is no significant change in the
creek bed sediment quality.
Biological Parameters
Primary production, Phytoplankton and Zooplankton population were showing marginal seasonal
variation but within normal range in the present observation attributing to optimum water quality
conditions. The sub-tidal and intertidal benthic population showed only marginal difference
between pre-project period and monitoring period of February 2021.
Microbiology
There are no changes observed in bacterial population, in water and sediments, among the
different sampling periods in this creek.

MSPL INDOMER
Periodic Monitoring of Marine Environment for MSPL Outfall, Bhavnagar, Gujarat Page 10
February 2021
Table 1. Details of sampling locations
Station UTM Coordinates (WGS 84) Water depth
(m)
Sampling depth*
(m) X (m) Y (m)
WATER AND SEDIMENT SAMPLING
SS1& SB1 204022 2414736 2.7 S & B
SS2& SB2 204458 2414511 2.9 S & B
SS3& SB3 204951 2414447 3.1 S & B
INTERTIDAL BENTHOS
IB1 204178 2414637 Intertidal zone
IB2 204435 2414473 Intertidal zone
IB3 204650 2414381 Intertidal zone
*S = creek surface, B = creek bottom

MSPL INDOMER
Periodic Monitoring of Marine Environment for MSPL Outfall, Bhavnagar, Gujarat Page 11
February 2021
Table 2. Water quality parameters at Bhavnagar creek (February 2021)
Station Water
depth* Temp. (°C)
Salinity
(PSU) pH
DO
(mg/l) TSS
(mg/l) Turbidity
(NTU) Ammonium
(µmol/l) Nitrite
(µmol/l) Nitrate
(µmol/l)
Total
Nitrogen
(µmol/l)
Phosphate
(µmol/l)
Total
phosphorus
(µmol/l)
SS1 S 26.6 32.5 7.94 5.6 1320 680 2.0 0.53 3.5 6.10 0.79 2.63
B 26.4 32.7 7.91 5.4 1400 760 2.2 0.91 4.1 7.25 0.94 3.26
SS2 S 26.8 32.8 7.97 5.5 1311 710 1.9 0.71 3.2 5.85 0.91 2.95
B 26.6 33.0 7.94 5.3 1584 880 2.0 0.74 3.8 6.60 0.97 3.24
SS3 S 26.9 33.1 7.96 5.4 1270 610 1.8 0.60 3.1 5.55 0.86 2.53
B 26.7 33.4 7.88 5.3 1489 760 2.0 0.76 3.3 6.10 0.91 3.35
*S = creek surface, B = creek bottom

MSPL INDOMER
Periodic Monitoring of Marine Environment for MSPL Outfall, Bhavnagar, Gujarat Page 12
February 2021
Table 3. Biochemical Oxygen Demand and Chemical Oxygen Demand at Bhavnagar creek water
(February 2021)
*S = creek surface, B = creek bottom
Table 4. Concentration of Heavy Metals, Phenols and Total Petroleum Hydrocarbons at Bhavnagar
creek water (February 2021)
*S = creek surface, B = creek bottom
Table5. Sediment Texture at Bhavnagar creek (February 2021)
Station Water depth* BOD (mg/l) COD (mg/l)
SS1 S 1.0 20.8
B 1.2 21.6
SS2 S 1.1 19.4
B 1.3 20.8
SS3 S 0.9 18.8
B 1.0 19.4
Station Water
depth*
Heavy metals (µg/l) Phenols
(mg/l)
Total Petroleum
Hydrocarbons (µg/l) Cadmium Mercury Lead Chromium
SS1 S 1.9 <1.0 <1.0 2.24 <0.001 <0.1
B 2.2 <1.0 <1.0 2.48 <0.001 <0.1
SS2 S 1.8 <1.0 <1.0 2.31 <0.001 <0.1
B 2.1 <1.0 <1.0 2.45 <0.001 <0.1
SS3 S 1.9 <1.0 <1.0 2.28 <0.001 <0.1
B 2.1 <1.0 <1.0 2.34 <0.001 <0.1
Station D50
(mm)
Sand (%) Silt & Clay (%) Description of Soil
Fine Sand
SB1 0.12 70.9 29.1 Fine Sand
SB2 0.11 63.5 36.5 Fine Sand
SB3 0.10 60.5 39.5 Fine Sand

MSPL INDOMER
Periodic Monitoring of Marine Environment for MSPL Outfall, Bhavnagar, Gujarat Page 13
February 2021
Table 6. Sediment quality parameters at Bhavnagar creek (February 2021)
Station Total Organic
Carbon (%) Total Nitrogen
(mg/kg) Total Phosphorus
(mg/kg) Calcium Carbonate
(%)
SB1 1.17 26.4 18.6 18.9
SB2 0.52 22.6 17.4 20.6
SB3 0.20 16.4 15.8 12.5
Table 7. Concentration of Heavy Metals, Phenols and Total Petroleum Hydrocarbons in Sediments at
Bhavnagar creek (February 2021)
Table 8. Primary productivity at Bhavnagar creek water (February 2021)
Station Gross Photosynthetic activity Net Photosynthetic
activity Primary production
(mgC/m3/day)
SS1 1.2 0.7 360
SS2 1.4 0.9 420
SS3 1.1 0.6 330
Average 370
Station Heavy metals (mg/kg) Phenols
(mg/kg)
Total Petroleum
Hydrocarbons (µg/kg) Cadmium Mercury Lead Chromium
SB1 <0.1 <0.1 <0.1 32.6 <0.5 <0.5
SB2 <0.1 <0.1 <0.1 28.8 <0.5 <0.5
SB3 <0.1 <0.1 <0.1 22.4 <0.5 <0.5

MSPL INDOMER
Periodic Monitoring of Marine Environment for MSPL Outfall, Bhavnagar, Gujarat Page 14
February 2021
Table 9. Phytoplankton species composition* at Bhavnagar creek water (February 2021)
Sl. No. Species Station
SS1 SS2 SS3
Class: Bacillariophyceae (Diatoms)
Order: Centrales
1 Bacteriastrum sp. - + +
2 Coscinodiscus sp. + - -
3 Coscinodiscus centralis + + -
4 Hemiaulus sp. + - +
5 Helicotheca sp. - + -
6 Odontella aurita + - +
7 Planktoniella sol - + -
8 Rhizosolenia sp. + - -
9 Skeletonema sp. + + +
10 Triceratium sp. - + +
Subtotal 6 6 5
Order: Pennales
11 Amphora sp. - + -
12 Asterionella sp. + - -
13 Guinardia striata - + +
14 Navicula sp. - - +
15 Navicula henneydii - + +
16 Nitzschia sp. + + -
17 Pleurosigma sp. + - +
18 Pleurosigma directum - + +
19 Gyrosigma sp. + - +
20 Thalassionema nitzschioides - + -
Subtotal 4 6 6
Class: Dinophyceae (Dinoflagellates)
21 Ceratium furca - + -
22 Ceratium macroceros - + -
23 Dinophysis sp. + + -
24 Diplopsalopsis sp. + + +
25 Prorocentrum micans + + _
26 Protoperidinium sp. + + +
27 Protoperidinium depressum + + +
Subtotal 5 7 3
Class: Cyanophyceae (Blue-greens)
28 Trichodesmium erythraeum + + +
29 Chlorella sp. + + -
Total 17 21 15
*Net sample

MSPL INDOMER
Periodic Monitoring of Marine Environment for MSPL Outfall, Bhavnagar, Gujarat Page 15
February 2021
Table 10. Phytoplankton numerical abundance* (cells/l) at Bhavnagar creek water (February 2021)
Sl. No. Genus / Species SS1 SS2 SS3 Total (%)
Phylum: Heterokontophyta
Class: Bacillariophyceae (Diatoms)
Order: Centrales
1 Bacteriastrum sp. 0 100 100 200 3.01
2 Coscinodiscus sp. 50 0 0 50 0.75
3 Coscinodiscus centralis 100 100 0 200 3.01
4 Hemiaulus sp. 50 0 100 150 2.26
5 Helicotheca sp. 0 200 0 200 3.01
6 Odendella aurita 50 0 100 150 2.26
7 Planktoniella sol 0 100 0 100 1.50
8 Rhizosolenia sp. 50 0 100 150 2.26
9 Skeletonema sp. 100 100 300 500 7.52
10 Triceratium sp. 0 100 100 200 3.01
Order: Pennales
11 Amphora sp. 0 200 0 200 3.01
12 Asterionella sp. 100 0 0 100 1.50
13 Guinardia striata 0 100 200 300 4.51
14 Navicula sp. 0 0 200 200 3.01
15 Navicula henneydii 0 100 200 300 4.51
16 Nitzschia sp. 50 200 0 250 3.76
17 Pleurosigma sp. 100 0 100 200 3.01
18 Pleurosigma directum 0 200 200 400 6.02
19 Gyrosigma sp. 50 0 100 150 2.26
20 Thallasionema nitzschioides 0 200 0 200 3.01
Class: Dinophyceae (Dinoflagellates)
21 Ceratium furca 0 200 0 200 3.01
22 Ceratium macroceros 0 100 0 100 1.50
23 Dinophysis sp. 100 200 0 300 4.51
24 Diplopsalopsis sp. 100 100 100 300 4.51
25 Prorocentrum micans 100 100 0 200 3.01
26 Protoperidinium sp. 100 100 0 200 3.01
27 Protoperidinium depressum 100 100 100 300 4.51
Class: Cyanophyceae (Blue greens)
28 Trichodesmium erythraeum 100 100 200 400 6.02
29 Chlorella sp. 150 200 100 450 6.77
Total 1450 2900 2300 6650 100.0
* Bottle sample

MSPL INDOMER
Periodic Monitoring of Marine Environment for MSPL Outfall, Bhavnagar, Gujarat Page 16
February 2021
Table 11. Phytoplankton population at Bhavnagar creek water (February 2021)
Station No of genera or species
(*net sample) Population (cells/l)
(*bottle sample)
SS1 17 1450
SS2 21 2900
SS3 15 2300
Table 12. Numerical abundance of zooplankton (nos./100m3) at Bhavnagar creek water (February 2021)
Sl. No. Genus / Species Station
SS1 SS2 SS3 Total %
Phylum: Protozoa
Order: Tintinnids (Ciliate groups)
1 Favella sp. 377 0 749 1126 4.24
2 Tintinnopsis sp. 1130 372 375 1877 7.07
Phylum: Mollusca
3 Gastropod larvae 377 743 0 1120 4.22
Phylum: Arthropoda
Order: Copepoda
Sub-order: Calanoida
4 Acrocalanus sp. 753 372 375 1500 5.65
5 Acartia erythraea 753 1115 749 2617 9.85
6 Clausocalanus minor 0 743 1124 1867 7.03
7 Centropages furcatus 377 0 749 1126 4.24
8 Eucalanus sp. 377 743 0 1120 4.22
9 Labidocera acuta 377 0 0 377 1.42
10 Temora turbinata 753 372 375 1500 5.65
11 Temora discaudata 0 0 375 375 1.41
12 Copepod nauplii 377 743 375 1495 5.63
Sub-order: Cyclopoida
13 Corycaeus danae 377 0 749 1126 4.24
14 Corycaeus asiaticus 0 372 375 747 2.81
15 Oncaea venusta 0 372 749 1121 4.22
Sub-order: Harpacticoida
16 Euterpina acutifrons 377 743 375 1495 5.63
17 Miracia efferata 0 372 0 372 1.40
Other Crustaceans
18 Crustacean larvae 377 743 375 1495 5.63
19 Lucifer sp. 0 743 749 1492 5.62
Phylum: Chordata
20 Fish larvae 377 743 0 1120 4.22

MSPL INDOMER
Periodic Monitoring of Marine Environment for MSPL Outfall, Bhavnagar, Gujarat Page 17
February 2021
Sl. No. Genus / Species Station
SS1 SS2 SS3 Total %
21 Oikopleura sp. 0 743 749 1492 5.62
Total 7159 10034 9367 26560 100
Table 13. Zooplankton diversity, abundance and biomass at Bhavnagar creek water (February 2021)
Station No. of genera or species Population (nos./100 m3)
Biomass (ml/100 m
3)
SS1 14 7159 9.6
SS2 16 10034 11.7
SS3 16 9367 11.2
Table 14. Sub tidal and Inter tidal benthic population at Bhavnagar creek (February 2021)
Sl. No. Groups
Sub tidal benthic
population (nos./m2)
Intertidal benthic Population
(nos./m2)
SB1 SB2 SB3 IB1 IB2 IB3
Phylum: Annelida Class: Polychaeta
1 Ancistrosyllis sp. 0 80 80 45 15 30
2 Armandia sp. 40 80 0 0 0 0
3 Cossura sp. 40 0 40 30 0 15
4 Glycera sp. 0 40 0 30 0 45
5 Perinereis sp. 80 0 40 0 30 45
6 Nereis diversicolor 0 80 40 0 30 30
7 Onuphis sp. 40 0 40 0 15 30
8 Prionospio sp. 0 40 80 15 0 15
9 Unidentified polychaetes 40 0 40 30 0 0
Phylum: Mollusca
10 Unidentified bivalves 0 40 0 0 30 0
11 Unidentified gastropods 40 40 0 0 45 0
Total 280 400 360 150 165 210
Table 15. Bacterial population at Bhavnagar creek water (x 103CFU/ml) (February 2021)
Media Type of Bacteria Stations
SS1 SS2 SS3
Nut Agar TVC 4.74 5.02 5.19
Mac Agar TC 0.41 0.44 0.45
Mac Agar FC 0.34 0.31 0.38
Mac Agar ECLO 0.17 0.24 0.24
XLD Agar SHLO 0.21 0.19 0.18
TCBS Agar VLO 0.15 0.17 0.19
TCBS Agar VPLO 0.17 0.14 0.16

MSPL INDOMER
Periodic Monitoring of Marine Environment for MSPL Outfall, Bhavnagar, Gujarat Page 18
February 2021
TCBS Agar VCLO 0.02 0.10 0.07
Table16. Bacterial population at Bhavnagar creek sediments (x 104CFU/g) (February 2021)
Media Type of Bacteria Stations
SB1 SB2 SB3
Nut Agar TVC 5.09 5.21 5.26
Mac Agar TC 0.61 0.57 0.59
Mac Agar FC 0.31 0.32 0.30
Mac Agar ECLO 0.16 0.15 0.16
XLD Agar SHLO 0.20 0.21 0.22
TCBS Agar VLO 0.19 0.13 0.18
TCBS Agar VPLO 0.17 0.16 0.15
TCBS Agar VCLO 0.01 0.02 0.05
TVC - Total Viable Counts; TC - Total Coliforms; FC- Faecal coliform; ECLO - Escherichia coli like organisms; SHLO -
Shigella like organisms; VLO - Vibrio like organisms; VPLO - Vibrio parahaemolyticus like organisms; VCLO-Vibrio
cholerae like organisms.

MSPL INDOMER
Periodic Monitoring of Marine Environment for MSPL Outfall, Bhavnagar, Gujarat Page 19
February 2021
Table17. Comparison of Water quality parameters between Pre-Project period (May 2013) and Monitoring period (February 2021)
Sl. No. Parameters Unit
Pre-project
period Monitoring period
Remarks May
2013
May
2019
August
2019
November
2019
February
2020
August
2020
February
2021
Range Range Range Range Range Range Range
1 Temperature (°C) 32-34 25.1-25.6 27.5-27.9 26.2-26.6 25.4-25.9 25.5-26.1 26.5-26.8 Seasonal variation
2 pH - 8.0-8.2 7.90-8.01 7.15-7.36 7.82-8.07 7.94-8.04 7.52-7.67 7.88-7.97 Seasonal variation
3 Salinity ppt 36-37 42.4-43.3 6.3-7.0 15.7-19.4 32.5-33.4 6.8-7.2 32.5-33.4 Seasonal variation
4 Turbidity NTU >1000 >1000 314-618 2084-2615 750-996 538-965 610-880 Seasonal variation
5 TSS mg/l 980-13052 1586-2130 1011-2295 3064-3845 1645-2241 1095-2124 1270-1584 Seasonal variation
6 DO mg/l 3.84-4.32 5.1-5.5 5.7-5.9 5.3-5.7 5.3-5.6 5.7-6.0 5.35-5.6 No significant change
7 BOD mg/l 1.44-3.20 0.8-1.1 1.1-1.3 1.2-1.5 0.8-1.1 1.2-1.4 0.9-1.3 No significant change
8 COD mg/l 37.3-52.5 18.0-25.3 27.6-36.2 32.2-38.2 21.4-23.4 23.4-25.6 18.8-21.6 Seasonal variation
9 Ammonium µmol/l 0.43-0.74 0.9-1.9 3.6-6.8 4.9-7.3 1.5-2.1 1.9-3.2 1.5-2.2 Seasonal variation
10 Nitrite µmol/l 1.56-3.47 0.6-1.2 1.3-2.1 2.9-3.5 0.4-0.8 1.4-1.8 0.53-0.91 Seasonal variation
11 Nitrate µmol/l 3.76-7.78 2.5-3.2 31.3-38 17.0-19.8 2.9-3.6 16.9-18.2 3.12-4.10 Seasonal variation
12 Total Nitrogen µmol/l 13.92-26.36 4.7-5.8 40.1-49.7 25.3-30.4 5.3-6.9 22.3-22.6 5.55-7.25 Seasonal variation
13 Phosphate µmol/l 0.38-2.77 0.3-0.7 1.1-1.8 3.2-4.1 0.94-1.30 1.73-2.17 0.79-0.97 Seasonal variation
14 Total Phosphorus µmol/l 5.23-7.22 0.6-1.1 3.2-4.6 5.3-6.9 2.80-3.24 2.16-2.63 2.53-3.35 Seasonal variation
15 Cadmium µg/l <1.0 5.6-7.2 0.71-1.17 0.99-1.32 1.8-2.6 0.65-0.73 1.8-2.2 No significant change
16 Mercury µg/l <1.0 <1.0 <1.0 <1.0 <1.0 <1.0 <1.0 No change
17 Lead µg/l <1.0 <1.0 <1.0 <1.0 <1.0 <1.0 <1.0 No change
18 Chromium µg/l 2.95-5.64 5.8-6.7 <1.0 0.80-0.92 2.2-2.9 1.1-1.3 2.24-2.48 Seasonal variation
19 Phenols mg/l <0.001 <0.001 <0.001 <0.001 <0.001 <0.001 <0.001 No change
20 Total Petroleum
Hydrocarbons µg/l <0.05 <0.1 <0.1 <0.1 <0.1 <0.1 <0.1 No change
*For May to August 2020 (1st and 2
nd quarterly monitoring season of the year 2020-21), samples not collected due to Nationwide ban on travel due to COVID-19 pandemic.

MSPL INDOMER
Periodic Monitoring of Marine Environment for MSPL Outfall, Bhavnagar, Gujarat Page 20
February 2021
Table 18. Comparison of Sediment quality parameters between Pre-Project period (May 2013) and Monitoring period (February 2021)
Sl.
No. Parameters Unit
Pre-project
period Monitoring period
Remarks May
2013
May
2019
August
2019
November
2019
February
2020
August
2020
February
2021
Range Range Range Range Range Range Range
1 Soil texture - Fine sand Fine Sand Silty clay Silty Clay Fine sand Fine Sand Fine Sand No change
2 Total
phosphorous mg/kg 0.26-0.38 16.2-19.4 7.8-8.5 16.7-23.6 16.1-17.2 4.5-8.0 15.8-18.6
Seasonal variation but within
normal range
3 Total nitrogen mg/kg 0.86-1.22 7.6-21.4 22-38.6 56.8-75.4 10.6-17.5 23.5-36.1 16.4-26.4 Seasonal variation but within
normal range
4 Total organic
carbon % 0.47-0.77 0.26-1.22 1.2-2.0 0.43-0.57 0.43-1.04 0.33-0.50 0.20-1.17
Seasonal variation but within
normal range
5 Calcium
carbonate % 5.76-7.72 5.0-11.5 18.7-20.7 6.9-10.2 6.5-8.5 15.7-18.2 12.5-20.6
Seasonal variation but within
normal range
6 Cadmium mg/kg <1.0 <0.1 <0.1 <0.1 <0.1 <0.1 <0.1 No change
7 Chromium mg/kg 30.48-35.08 37.3-40.3 42.6-48.6 45.8-51.7 32.6-38.5 38.8-42.4 22.4-32.6 Marginal change but within
normal range
8 Mercury mg/kg <1.0 <0.1 <0.1 <0.1 <0.1 <0.1 <0.1 No change
9 Lead mg/kg <1.0 <0.1 <0.1 <0.1 <0.1 <0.1 <0.1 No change
10 Phenols mg/kg <0.05 <0.5 <0.5 <0.5 <0.5 <0.5 <0.5 No change
11 Petroleum
Hydrocarbons µg/kg 2.12-3.37 <0.5 <0.5 <0.5 <0.5 <0.5 <0.5 No change
*For May to August 2020 (1st and 2
nd quarterly monitoring season of the year 2020-21), samples not collected due to Nationwide ban on travel due to COVID-19 pandemic.

MSPL INDOMER
Periodic Monitoring of Marine Environment for MSPL Outfall, Bhavnagar, Gujarat Page 21
February 2021
Table 19. Comparison of Biological parameters between Pre-Project period (May 2013) and Monitoring period (February 2021)
Sl.
No. Parameters Unit
Pre-project
period Monitoring period
Remarks May
2013
May
2019
August
2019
November
2019
February
2020
August
2020
February
2021
Phytoplankton
1 Primary
Productivity mgC/m
3/day 240-480 210-300 240-270 210-270 300-360 330-390 330-420
No significant
change
2 Species
composition nos./100m
3 12-31 16-17 20-23 17-19 16-19 23-26 16-21 Seasonal variation
3 Abundance nos./l 399-2530 1350-1600 1950-2200 1500-2050 1400-1900 1750-1850 1450-2900 No significant
change
Zooplankton
4 Biomass ml/100m3 5.14-14.85 9.6-16.7 10.5 - 11.2 9.0-13.3 8.2-15.2 8.7-10.0 9.6-11.7
No significant
change
5 Abundance nos./100m3 7368-50048 5744-6973 6237-7819 4179-6478 5534-7479 6063-7097 7159-10034 Seasonal variation
Benthos
6 Subtidal nos./m2 20-30 240-400 320-400 360-440 280-400 240-360 280-400
No significant
change
7 Intertidal nos./m2 20-40 105-150 135-180 105-135 75-120 165-195 150-210
No significant
change
Microbial count
8 Water nos. x103/ml 0.01-5.31 0.01-5.34 0.01-5.28 0.01-5.31 0.01-5.28 0.02-5.18 0.02-5.02
No significant
change
9 Sediment nos. x104/g 0.01-5.48 0.01-5.45 0.02-5.41 0.01-5.43 0.01-5.36 0.01-5.29 0.01-5.21
No significant
change
*For May to August 2020 (1st and 2
nd quarterly monitoring season of the year 2020-21), samples not collected due to Nationwide ban on travel due to COVID-19 pandemic.

MSPL INDOMER
Periodic Monitoring of Marine Environment for MSPL Outfall, Bhavnagar, Gujarat Page 22
February 2021
Water & Sediment sample collection
Plankton Sample collections
Intertidal Benthos sample collection


2414
000
mY
204000 mX 204500 mX 205000 mX
2414
500
mY
2415
000
mY
72°08'00" E
21°4
8'45
" N
72°08'15" E
21°4
8'30
" N21
°48'
15" N
72°08'30" E 72°08'45" E 72°09'00" E
SPHEROID - WGS 84
N
NE
SE
NW
SW
S
EW
FIG. 2 . SAMPLING LOCATIONS
SCALE - 1:9000
205500 mX
SS1
SS2
SS3
BHAVNAGAR CREEK
IB2
IB3
SAMPLING LOCATION204022 mX ; 2414736 mYSS1
SS2SS3
204458 mX ; 2414511 mY204951 mX ; 2414447 mY
204178 mX ; 2414637 mYIB1
IB3 204650 mX ; 2414381 mY
INTERTIDAL BENTHOS
IB2 204435 mX ; 2414473 mY
IB1
0 = 21°48'34.93" N ; Ø = 72°08'28.06" E204429 mX ; 2414505 mY
OUTFALL

Annexure I – QCI NABET accreditation certificate


Annexure II – NABL accreditation certificate

Annexure III - NABL accreditation certificate of outsource laboratory
'