Embed Size (px)
Citation preview
RADIO SCIENCE Journal of Research NBSjUSNC- URSI Vol. 680 , No. I, January 1964
Periodic Fading of VLF Signals Received Over Long Paths During Sunrise and Sunset
D. D. Crombie
Contribution From the Central Radio Propagation Laboratory, National Bureau of Standards, Boulde r Laboratories, Boulder, Colo.
Data on t he periodi c changes in am plitude and ph ase of VLF s ig na ls rece ived ove r lon g VLF paths is examin ed. It is conc luded th at t he vari ations a rc d ue to mul t imodp propagat ion in the ni ghtt ime portion of t he paL h .
1. Introduction
It has long been known th at dUTing sunrise VLF signals received over a lon g path show periodic variations in amplit ude. At sunset similar, though smaller , variations occur . Obser vations in recen t years [Pierce, 1957] of t he relative phase delay of such signals show t hat the amplitude vari,ttions are accompanied by phase v,triations.
The original explanation [Yokoyama and T n.nimura, 1933] was that dW'ing the day the ionosphere behaves like ft m etallic reflector h ftv ing ft pse ucloBrewster angle near 90° (grazing incidence), while at night it behaves like ft dielectric wi th the pse udoBrewster angle n ear 30°. During sunset or s unrise the Brewster angle changes from 30° to 90° and at some instant passes through a va lue equal to the angle of incidence of the wave. The signal level then decreases at this time because of the reduced reflection coefficient. This drop in amplitude of the received signal would then be repeated each time the sunrise (SR ) or s unset (SS) line passed each " poin t" of reflection on a multihop path. This explanation now seems unlikely to be valid since calculations [Wait and Perry, 1957] of the reflection coefficient of the ionosphere for VLF waves show that the decrease in reflection coefficient at the pse udoBrewster minimum is small.
More recently, Rieker [1963] has attempted to explain the periodic phase variations observed during sunrise and s unset at Neuchatel (Switzerland) on the 18 kc/s signals from NBA in the Canal Zone. His explanation , which is again based on a single ray geometrical optics approach, is that the five "steps" in t he sunrise phase variation are due to the SR line advancin g over each of the five reflection points of the five hop pftth. Rieker 's explanation does no t attempt to acco unt for the amplit ude minim a which accompany the phase "steps."
Explanations of the sunset and sunrise phenomen a which are based on a ray-optics model such as those mentioned above and which invoke only one ray , seem. unlikely to b e able to account correctly for the obser vations on long pat.hs for two reasons . The
707- 520- 03--3 27
fi.rst is , that as has been s110wn [Budden, 1961; ' Vait , 1962a], it is necessary to include many )',lYS in explaining VLF propagation over great distances, whereas only a few low order modes are necessary. Secondly, as hfl S been discussed by Wait [1962a], it is necessary to include corrections for diffraction when usin g ray-opt ic models on a cW' ved em·th.
It is the pW'pose oJ this paper to give an acco un t or the fading phenomena observed on t wo long VLF paths . Following this, an explanation which ,Lppears to account for most of the observations will be outlined . This explanation involves interference between the t wo lowest order modes propagating in the nigh ttime portion of the earth-ionosphere waveg uide.
2. Experimental Observations
Obser vations of the diurnal phase and ampli tude variations of the signals from several distant VLF transmitters have been made at the Boulder L aboratories of the National Bureau of Standards and at the Battelle Inst itute, Frankfur t, Germany, for more than a year. Two paths t hat are sufficiently long and correctly oriented to show well-developed sunrise and sunset fading with a fairly good signal to noise ratio are
NPM
NBA
Hawaii to Boulder, Col ' .
Canal Zone to Frankfur t, Germany
5400 Ian 19.8 kc/s
9099 km 18.0 kc/s
These two paths show effects which are representative of the effects observed on other paths which are nearly perpendicular to the S8 or SR line. Thus obser vations m ade during 1962 on these two paths will be discussed in detail.
2.1. Typical Diurnal Variations
Typical diurnal ampli tude and phase records for each of the two paths are shown in figure 1. These
l
WW1 -,u uz >-g u o _<l:
--t--I <l:
W o :::J t: -' CL :;<
~~~~~~~~~~~~~~~~~~~~<l:
WW1 -,u uz >-<l: u> o _<l:
NBA-FRANKFURT , 1 1_-: 1 __ -'1""
j....--i' - , ' ,
<l: W o :::J f-
-' CL "-_____ .L->-< :;<
~~~~~~~~~~~~~~~~~~~ <l: 14 12 10 08 22 20 18 16
HOURS UT
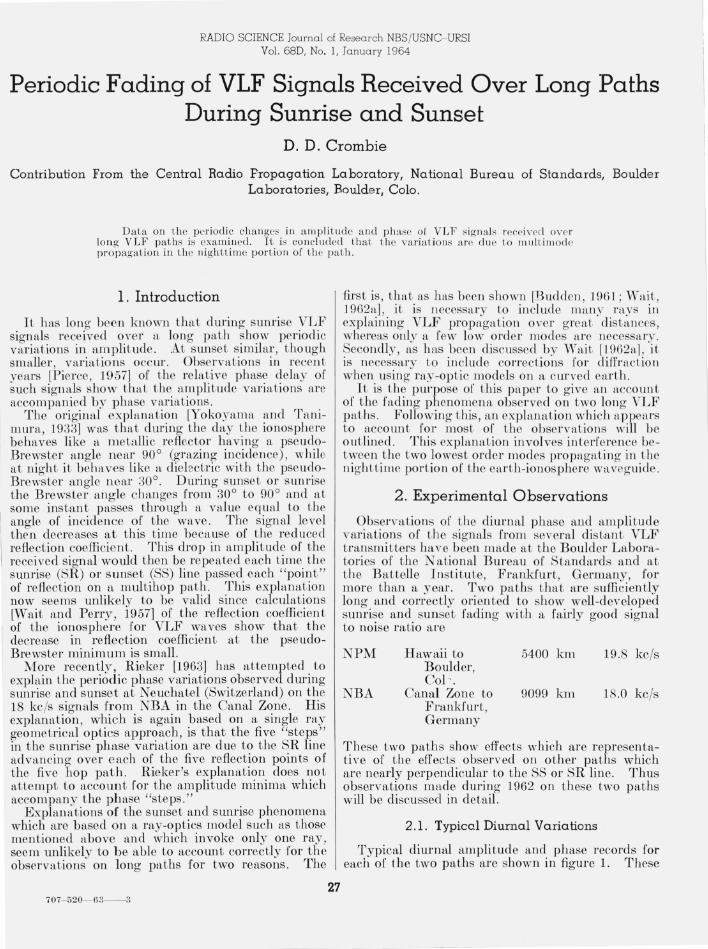
FIGU R E 1. Typical diumal phase (</» and ampli tude (A ) variations of the signals rece-ived from NP 111 at Bou lder and NBA at Frankfur t during J(muary 1962 .
have been drawn from the original recordings and some smoothing has been in troduced.
These curves are representative of those obtained at other times of the year, except for the times of occurrence of fading and its magnitude. They illustrate most of the features of interest. The first point is that the NPM signal at Boulder shows three amplitude minima during sunrise. The NBA signal at Frankfurt, however, shows evidence of five such minima. Similar but less evident changes occur during sunset. Secondly, it is clear that during suurise on both paths the amplitude minimum which occurs at the latest time is the deepest. This minimum occurs when the sunrise line is closest to the transmitter (the western end of the path) . This is also usually true at sunset on the N PM-Boulder path but is not always the case on the NBA-Frankfurt path. During the northern hemisphere summer the depth of fading at sunset is less than during the winter on both paths, and even in the case of NPMBoulder it cannot be observed during May.
Figure 1 also shows that at the times of amplitude minima the rate of change of phase becomes quite large, for both paths . This relation between amplitude and rate of change of phase appears to hold during all seasons. The same effect is shown in Rieker' s [1963] paper.
VLF transmitters frequently change their keying rate and consequently the mean amplitude of received signal varies when observed by a receiver which integrates for a p eriod of several seconds. This frequently makes it difficult to observe small variations in signal level due to propagation changes. Thus it has proved convenient to use the times of occurrence of maximum rate of change of phase to identify the times of minimum signal amplitude, since the i'ate of change of phase is not affected by changes in the keying rate.
A further important typical feature illustrated in figure 1 is that the rapid changes in phase at the
28
W :;< 12 f-
-' '" 'J, 06 a:: W > 5 04
02
NPM - SUNRISE
---..!oo. --~---~-~----"'t-__
-. ..... --~~----...",. BOULDER - SUNRISE
NPM - SUNSET _------~-.. FADING DIFFICULT ..
TO OBSERVE _----!;--~-.-r.-':-.---- . . --_-?----"\-- ------
..:.'~"'--
------oOr-----~ BOULDER - SUNSET
22L-~~-==-~~~'~~-L~-L-~~--~_--' JAN FEB MARCH APRIL MAY JUNE JULY AUG
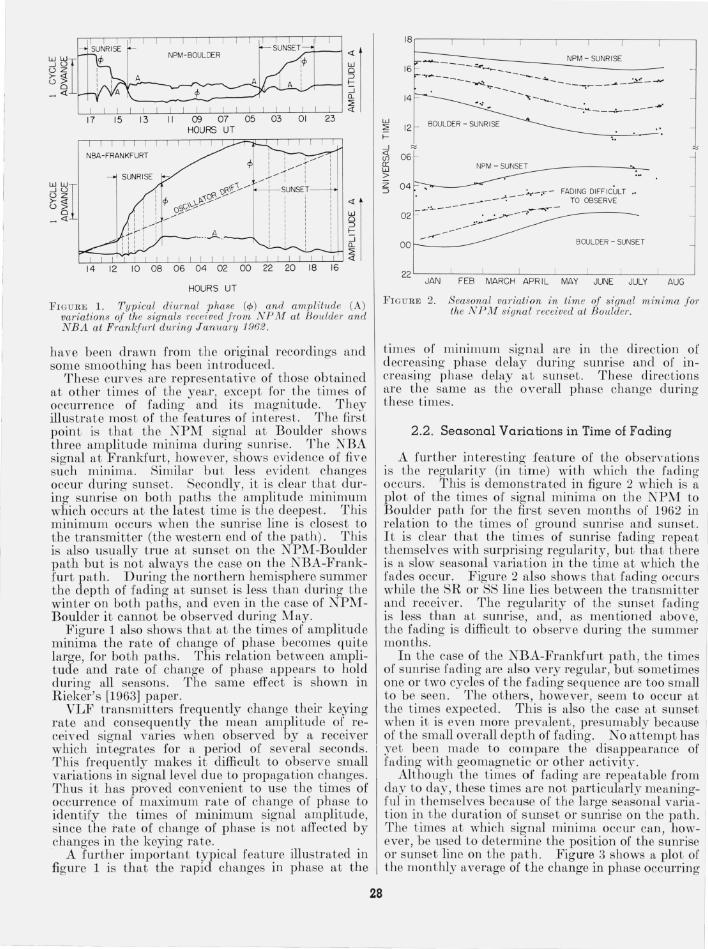
FIGURE 2. S easonal va1'iation in time of signal minima for the N P 111 signal received at Boulder.
times of minimum signal are in the direction of decreasing phase delay during sunrise and of increasing phase delay at sunset. These directions are the same as the overaU phase change during these times.
2 .2 . Seasonal Variations in Time of Fading
A further interesting feature of the observations is the regularity (in time) with which the fadin g occurs. This is demonstrated in figure 2 which is a plot of the times of signal minima on the NPM to Boulder path for the first seven months of 1962 in relation to the times of ground sunrise and sunset. It is clear that the times of sunrise fading repeat themselves with surprising regularity, but that there is a slow seasonal variation in the time at which the I
fades occur. Figure 2 also shows that fading occurs . while the SR or SS line lies between the transmitter and recei\Ter. The regularity of the sunset fading is less than at sunrise, and, as mentioned above, the fading is difficult to observe during the summer months.
In the case of the NBA-Frankfurt path , tbe times of sunrise fading are also very regular, but sometimes one or two cycles of the fading sequence are t oo small to be seen. The otbers, however, seem to occur at the times expected. This is also the case at sunset when it is even more prevalent, presumably because of the small overall depth of fading. No attempt has yet been made to compare the disappearance of fading with geomagnetic or other activity.
Although the times of fading are repeatable from day to day, these times are not particularly meaningful in themselves because of the large seasonal variation in the duration of sunset or sunrise on tbe path. The times at which signal minima occur can, however, be used to determine the position of the sunrise or sunset line on the path. Figure 3 sbows a plot of the monthly average of the change in phase occurring
I
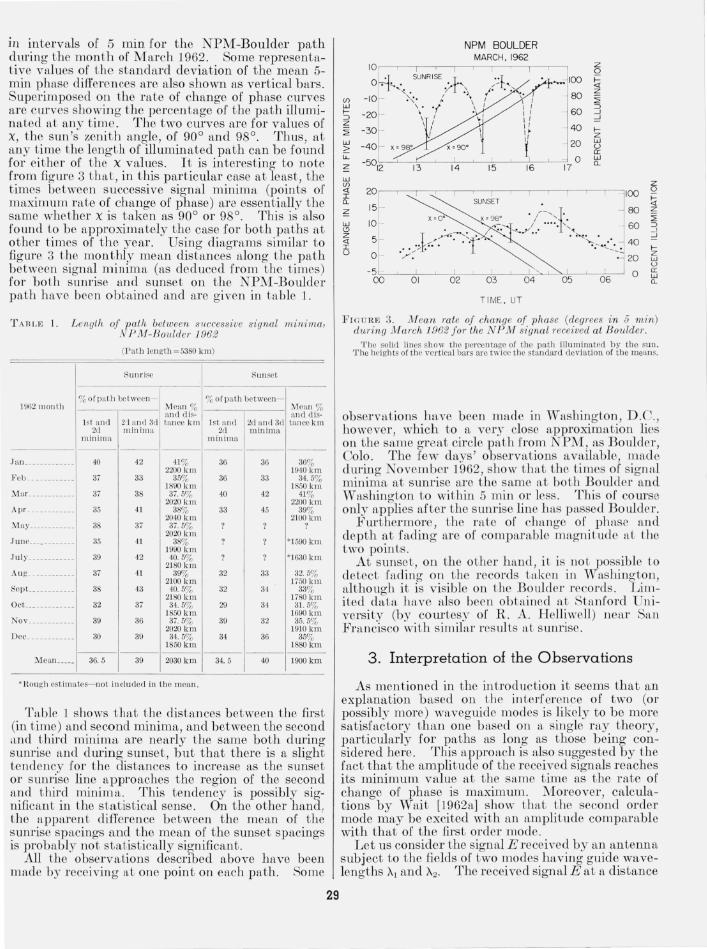
in intervals of 5 min for the NPM-Boulder path during the month of March 1962. Some representative values of the standard deviation of the mean 5-min phase differen ces are also shown as vertical bars. Superimposed on the rate of change of phase curves are curves showing the percentage of the path illuminated at any time. The two curves are for values of x, the sun's zenlth angle , of 90° and 98°. Thus, at any time the length of illuminated path can be found for either of the X values. It is interesting to note from figure 3 that, in this particular case at least, the times between successive signal minima (points of maximum rate of change of phase) are essentially the same whether X is taken as 90° or 98° This is also found to be approximately the case for both paths at other times of the year . Using diagrams similar to figure 3 the monthly mean distan ces along t he path between signal minima (as deduced from the times) for both sunrise and sunse t on the NPM-Boulder path have been obtained and are given in table l.
Ul w f-:::J z ~ w 2: LL
~ w Ul <[ I (L
~ w <.9 Z <[ I U
10
o. -10
- 20
-30 -
- 40
-5012
20
15
10
5
0
-5 00
NPM BOULDER MARCH. 1962
.. . SUNR ISE :.L, '-{ . / 1 ~ >,. : \
' ; .{ .'
01
\ I \ I
I I
02
15
SUNSET
03
TIME. UT
16
04
z Q . r ..... 100 !;t
80 ~ 60 :3
...J
40 f-Z
20 tJ o
17
05
0: W (L
06
z 100 Q
f-<[
80 z ~
60 ::J -, 40
:o! f-
20 z w u
0 0: W (L
'fA B I~E 1. Lenglh of palh belween successive signal minima, FIe UHE 3. NIean rate oj change of phase (degrees in 5 min) N P l\1-BouLde1' 1962 during N{(t1'ch 1962 for lhe N PM signal received at B ouldeL
(Path len gth =5380 km )
S UIl r ise Sun set
% of path betwccn- % of pa th between-]9(i21Ilonth lYJcan % Mean %
a nd cI is- and dis-l Si and 2'1 and 3d lan ce km 1st and 2d a nd 3d tanee km
2d min ima 2d 1niniJl1a rninill1a minima
------------J an . _______ _____ 40 42 41% 36 36 36%
2200 km 1940 km Fcb- ___________ 37 33 35% 36 33 34. 5%
1890 kill 1850km M ar ____________ 37 38 37.5% 40 42 41% 2020 kill 2200 km
Apr ____________ 35 41 38% 33 45 39% 2040 k ill 2100 kill May ____________ 38 37 37.5% ? ? ? 2020 krn
June ____________ 35 41 38% ? ? *1590 km 1990 km July __ _____ ____ _ 39 42 40.5% 2180 km
? ? *1630 km
Aug _______ ___ __ 37 41 39% 32 33 32.5% 2100 km 1750 km
Se pt ____________ 38 43 40.5% 32 34 33% 2180 kill 1780 kill OeL ______ _____ 32 37 34.5% 29 34 31. 5% 1850 kill 1690 kill Nov ____________ 39 36 37.5% 39 32 35.5% 2020km 1910 kill
Dec ___________ _ 30 39 34.5% 34 36 35% 1850 km 1880 kill
------------------Mcan _____ 36.5 39 2030 km 34.5 40 1900 km
*R Ol1 gh csti rna tcs- llo t inclu ded in the ]nean.
Table 1 shows t l1at the distances between the first (in time) and second minima, and between the second and third minima are nearly the same both during sunrise and during sunset, but that there is a slight tendency for the distances to increase as the sunset or sunrise line approaches the region of the second and third minima. This tendency is possibly significant in the statis tical sense. On the other hand. the apparent difference between the mean of the sunrise spacings and the mean of the sunset spacings is probably not statistically significant.
All the observations described above have been made by receiving at one point on each path. Some
29
The solid lines show th e pcrce ntage of the path ill u minated by the su n. 'T'he hr ights of the vertical bars arc t\vicc the standard deviaiio n of the lDea n s.
observations have been made in Washington, D.C., however , which to a very close approximation lies on the same great circle path from NP11, as Boulder, Colo . The few days' observations available, made during November 1962, show that the times or signal minima at sunrise are the same at both Boulder and Washington to within 5 min or less. This of course only applies after the sunrise line has passed Boulder.
Furthermore, the rate or change of phase and depth at fading are or comparable magnitude at Lhe two points .
At sunset, on the other hand, it is not possible to detect fading on the records taken in Washington , although it is visible on the Boulder records . Limited data have also been obtn,ined at Stanrord University (by courLesy o[ R. A. H elliwell ) ncar San Francisco with simihu res u1 ts at sunrise.
3. Interpretation of the Observations
As mentioned in the in Lroduction it seems that an explanation based on the in terference of two (or possibly more ) waveguid e modes is likely to be more satisfactory th an one based on a single ray theory, particularly for paths as lon g as those being considered here . This approach is also suggested by the fact that the amplitude of the received signals reaches its minimum value at the same t ime as the rate of change of phase is maximum . Moreover, calculations by 'Vait [1962aJ show that the second order mode may be excited with an ampli tude comparable with that of the first order mode.
Let us consider the signal E received by an a,ntenna subject to the fields of two modes having guide wavelengths Al and A2. The received signal E at a distance
d from the source can be represented by
(1)
where E[ and E2 are the amplitudes of the two modes and w is the angular frequency of the wave. The phase angle 'P is included to take account of a possible difference in phase of the excitation factors of the two modes. If it is not zero , its effect is simply to uniformly translate along the path the positions of the minima and maxima of the standing wave pfLttern: thus it will be dropped in what follows.
If E is written in the form
then it is easily shown fronl (1) that
where
The amplitude E' of the received signal is a minimum
I - d d¢ . . . f' tl W lOn e= 7r, 37r, b7r, etc., an de IS a maximum. 01'1e
Sttme values of e, in }!ccordtll1ce with the observations. Thus as d is varied poin ts of minimum amplitude occur at distances which differ by D where
(2)
since the free space wavelength A'"'-'A2 or A[. Thus knowing D, it is possible to determine experimental values for A2- A[.
Expressions can be derived for A[ and A2, the guide wavelengths of the first fLnd second order modes but the results are somewhat complicated when the spherical nature of the earth is included. Because of this , numerical values for A[ and A2 calculated by Wait [1962a] will be used. These calculations relate A, A[ or A2 to the height of the ionosphere when the earth is spherical and perfectly conducting and the ionosphere is sharply bounded but of finite conductivity. It is possible to make allowance for the effect of the earth's magnetic field and for horizontal stratification of the ionosphere [Wait, 1962a] but these corrections are small and will be omitted in this discussion.
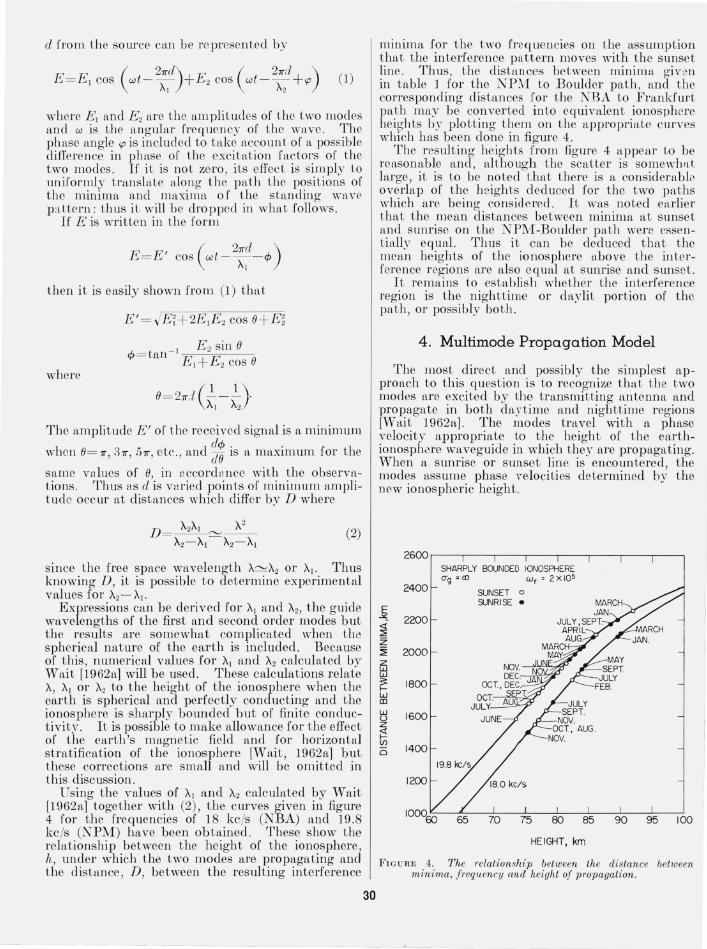
Using the values of A[ and A2 calculated by Wait [1962a] together with (2), the curves given in fig me 4 for the frequencies of 18 kc/s (NBA) and 19.8 kc/s (NPM) have been obtained. These show the relationship between the height of the ionosphere, h, under which the two modes are propagating and the distance, D , between the resulting interference
30
minima for the two frequencies on the assumption that the interference pattern moves with the sunset line . Thus , the distances between minima giv ::ln in table 1 for the NPM to Boulder path, and the corresponding distances for the NBA to Frank:furt path may be converted into equivalent ionosphere heights by plotting them on the appropriate curves which has been done in figure 4.
The resulting heights from figure 4 appear to be reasonable and, although the scatter is somewhfl.t large , it is to be noted that there is a considerable overlap of the heights deduced for the two paths which are being considered. It was noted earlier that the mean distances between minima at sunset and sunrise on the NPM-Boulder path were essentially equal. Thus it can be deduced that the mean heights of the ionosphere above the interference r egions are also equal at sunrise and sunset.
It remains to establish whether the interference region is the nighttime or daylit portion of the path, or possibly both.
4. Multimode Propagation Model
The most direct and possibly the simplest approach to this question is to recognize that the two modes are excited by the transmitting antenna and propagate in both daytime and nighttime regions [Wait 1962a]. The modes travel with a phase velocity appropriate to the height of the earthionosphere waveguide ill which they are propagating. When a sunrise or SUllset line is encountered, the modes assume phase velocities determined by the new ionospheric height.
2600 SHARPLY BOUNDED IONOSPHERE O"g = <0 wr = 2xI05
2400 SUNSET 0
SUNRISE • MARCH E JAN.
-":. 2200 JULY ,SEPT <l: ::2; APRil Z AUG.
~ 2000 MARCH
MAY Z w w 3 1800 f-W m w 1600 u z ;:! (f)
1400 0
1200
HEIGHT, km
FIGURE 4. The relationship between the distance between minima, frequency and height of propagation.
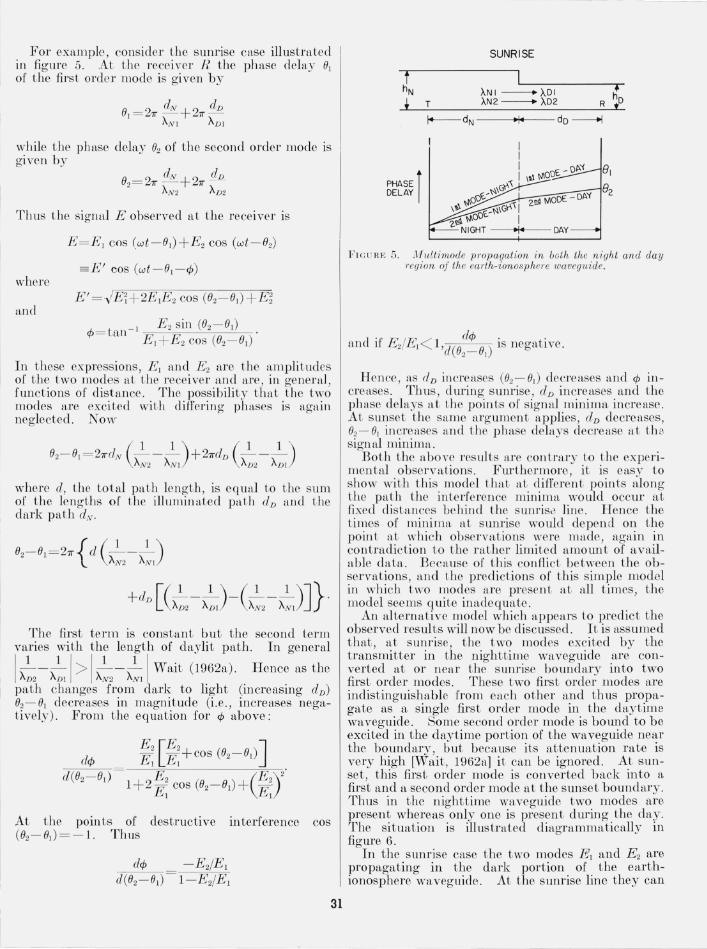
For example, consider Lhe sunrise case illustrated in figure 5. At the receiver R the phase delay 81 of the first ordeT mode is given by
while the p]wse delay 82 of the second order mode is given by
Tbus the signal E ohserved at the receiver is
where
and
E = E 1 cos (wt - 81)+ E 2 cos (wt - 82)
=E' cos (wt - 81- ¢ )
E' = .JEi+ 2E1E 2 cos (82- 81 )+E~
t - 1 E 2 sin (82- 81 ) ¢ = an
El + E 2 cos (82 - 81)
In these expressions, EI and E2 are the a,mplitudes of the two modes at the receiver and are, in generaJ, functions of distan ce. The possibility thn,t the two modes are excited with differing ph ases is again neglected. Now
where d, the total path length , is eq u~LI Lo Lhe sum of the lengths of the illuminated path dD lwd the dark path dN .
The first term is constant but the second term varies with the length of daylit path. In general
[ I 1 [ 1 1 1 [ . ~-~ > ~-, Walt (l962a). Hence as the "D2 "Dl " N2 "Nl
path changes from dark to light (increasing dD )
82-81 decreases in magnitude (i.e., increases negatively). From the equation for ¢ above:
d¢
At the poin ts of destructive interference cos (82 - 81) =- 1. Thus
d¢
31
SUNRISE
t hN ANI-ADI ; t T AN2 - AD2 R to
PHASE t DELAY I
I+--- dN -I- do -----.j
FI(: U U E 5. JII[ulti11lode p1'opagation in both the n i ght and day 1'egion of the eaTth-ionospheT8 waveguide .
Hen ce , as dD increases (82 - 8J ) decreHses and ¢ increases. Thus, durin g s unrise, dD increases and the phase delays ILt the points of signal minima increase. At sunset t he SH me Hrgumen t applies , clD decreases, 82- 81 in creases Hnd the phase dela ys decrease at the signal minima .
Both the a,bove res ults are contrary to the experimental observations. Furthermore , it is easy to show with this model that at different points along the path the interrerence minima would occur at fixed distnnces behind the sunriSe line. Hence the times of minim a ~Lt s W1l'ise would depend on the point at whi ch observations were made, again in contradiction to the rather limi ted a,mount of available data. Because of this confli ct between the observations, and Lhe predictions of this simple model in which two modes are present at all times, the model seems quite inadequate.
An alternative model which appears to predict the observed results will now be discussed. It is assumed that, at sunrise, the two modes excited by the transmitter in the nigh ttime wa veguide are converted at or near the sunrise boundary into two first order modes . These two fLrst order modes are indistinguishable from each other and thus propagate as a single first order mode in the daytime waveguide . Some second order mode is bOllild to be excited in the daytime portion of the waveguide near the boundary, but because its attenuation rate is very high [Wait, 1962a] it can be ignored. At sunset, this first order mode is converted back into a first and a second order mode at the sunset boundary. Thus in the nighttime waveguide two modes are present whereas only one is present during the day. The situation is illustrated diagrammatically in figure 6.
In the sunrise case the two modes El and E2 are propagating in the dark portion of the earthionosphere waveguide . At t he sunrise line they can
SUNRISE
f hN ANI } H'
T j AN2 - AD I .0 R
PHASEj DELAY
DAY
82r
I--dN --------i--do -----I
SUNSET
~{AN I hN T ;0 \DI- AN2 R *
I I
I G"" 815 I e~' __ DAY I " ~ __ -- 8
-,\\: 1\ _-- _NIGHT 25 \"" N\w 2 0d MODE
\l p.~ i I
~ \NCREASING ~ \NCREASING PHASE PHASE DELAY DELAY
82r- 81r AS '825-815 AS
dO INCREASES dN INCREASES
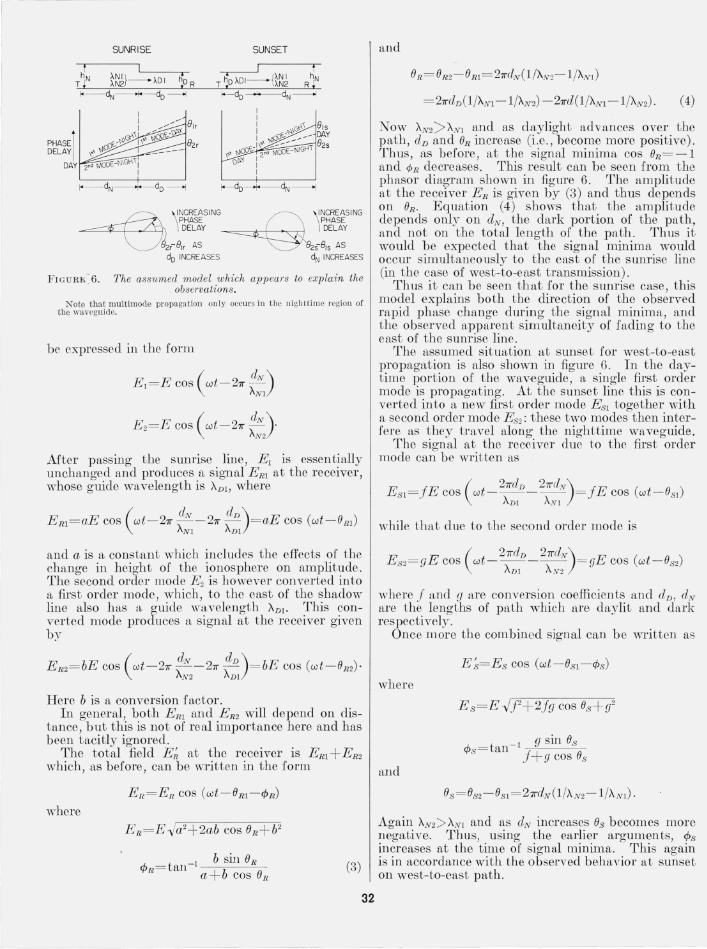
FIGURE ~ 6. The assumed model which appears to explain the observations.
N ote that multimode propagation only occurs in the nighttime region of the waveguide.
be expressed in the form
Mter passing the sunrise line, EI is essentially unchanged and produces a signal ERl at the receiver, whose guide wavelength is AD!, where
( clN clD ) E ( ) ERl= aE cos wt-27r ANI- 27r AD! = a cos wt-OR!
and a is a constant which includes the effects of the change in height of the ionosphere on amplitude. The second order mode Eo is however converted into a first order mode, which; to the east of the shadow line also has a guide wavelength AD!' This converted mode produces a signal at the receiver given by
Em= bE cos (wt-27r ~:2 -27r ~;)=bE cos (wt-Om )·
Here b is a conversion factor. In general, both Em and Em will depend on dis
tance, but this is not of real importance here and has been tacitly ignored.
The total field E~ at the receiver is Em + Em which, as before, can be written in the form
where
A. - t -I b sin OR 'f'R - an
a + b cos OR (3)
32
and
OR= ORZ- ORl = 27rclN(1 /ANZ- l /ANl )
= 27rclD (1 /ANl - l /AN2) -27rcl(1/ ANl - l /AN2) ' (4)
Now AN2> ANJ and as daylight advances over the path, clD and OR increase (i .e., become more positive). Thus, as before, at the signal minima cos OR= -l and <l>R decreases. This result can be seen from the phasor diagram shown in figure 6. The amplitude at the receiver ER is given by (3) and thus depends on OR. Equation (4) shows that the amplitude depends only on clN , the dark portion of the path, and not on the total length of the path. Thus it would be expected that the signal minima would occur simultaneously to the east of the sunrise line (in the case of west-to-east transmission).
Thus it can be seen that for the sunrise case, this model explains both the direction of the observed rapid phase change during the signal minima, and the observed apparent simultaneity of Jading to the east of the sunrise line.
The assumed situation at sunset for west-to-east propagation is also shown in figure 6. In the dayt ime portion of the 'waveguide, a single fu'st order mode is propagating. At the sunset line this is converted into a new fu'st order mode E SI together with a second order mode ES2 : these two modes then interfere as they travel along the nighttime waveguide.
The signal at the receiver due to the first order mode can be written as
E J ' ( 27rclD 27rdN) JE ( ) S1= E cos wt- -,- - -- = -I cos wt - OSI I\D! ANI
while that due to the second order mode is
where.f and g are conversion coefficients and clD , clN are the lengths of path which are daylit and dark respectively.
Once more the combined signal can be written as
where
and
t - 1 g sin Os cf>s = an
J + g cos Os
Again AN2> ANI and as dN increases Os becomes more negative. Thus, using the earlier arguments, cf>s increases at the time of signal minima. This again is in accordance with the observed behavior at sunset on west-to-east path.
Tn this par tic ular case, the interference pattern is "attached" to t he dark side of the sunset line and moves westward with it. This suggests that signal minima at differ ent points along a great circle pa th will occur at different times, in contrast to the sunrise case. It has not been possible to confirm this, because of th e lack of adequate data.
5. Discussion
In the above explanation the effect of path attenuation has been ignored. ] t is to be expected, in daytime at least, that the attenuation rate of the second order mode will be much greater than thctt for the first [Wai t 1962aj. Thus the depth of fading at sunrise should increase as the shadow line approaches the transmitter , in the two cases considered in Lhis paper. This is in agreement wi th Lhe experimenta] obsen TaLions.
At sunset, byLhe same argumenL, the fad ing sllOuld be deepest when the shadow line is closest to the receiver. The observations do not confirm this deduction, particularly for the NBA-Frankfurt path. This is possibly because or changes in the angle between Lhe pc"th d irecLion and the sunset line, or because mode co mrersion does not take place enLirely at the sunse L line. These points require fur t her investiga tion. N elrerLheless, Lbe Washington, D.C., ObSeIvf"Lions on N P11 how tha t the sun set depth of fading is less Lhan aL Boulder at the Sc,,111 e time, a resul t to be expected if the interferin g modes occllr along the nightti me por tion of the pa th and itre attenuated.
E stimates of Lhe ionospheric heights or t be region in which mul timode propagation occurs hfwe been given in figure 4. 1 t WitS earlier mentioned that there is no significant difference between the heights determined from the sunrise itnd su nset yitriittions. This is in accordance wi tll th e exphwation de\Teloped above, which shows thitt tbe heighLs should be the same, and are th e heights of the nighttime ionosphere. It must be remembered however , that what is actually determined is the difference in guide witvelengths of the two modes. These are then used to deduce the effective height of the ionosphere, using mode theory. In this paper, the effect of stratification of the ionosphere a nd effects due to the magnetic field have not been considered. If these are included, deduced heights of the ionosphere under nighttime conditions could be slightly different from those shown in figure 4.
The deductio ns in this paper are based on obser vat ions made on two long west-to-east paths. However, some data obtained in Hawaii on the signitls from N.BA have also been examined, but not in detail. This path is es entially east to west; thus at sunrise, propagation is from dayligh t in to darkn ess, while at sunset the rever se holds. If this is kept in mind, the results of the preliminary examination of the data do no t conHict with the deductions made in this paper.
A major question is the mechanism which converts the two modes excited by the transmitter in the nighttim e waveguide into a single mode in the day-
time portion of the waveguide and subsequently converLs this single mode back into t wo modes at 01' near the sunset lin e. Wctit [1962b], has mad e a preliminary analysis of this problem and find Lhat mode conversion at a gently tapered transition is very small . L ater work [Wait 1963b] however, indicaLes that conversion may be significant for more rapid transitions . It is in teresting to note that the dep Lh of fading at sunrise is mu ch greater than at sunset. This is presumably because the in terfering second order mode is direc tly excited by the transmitter, when it is in the nighLLime portion of the path . However , since the second order mode is conver ted into one of first order Olrel' a very shor t distance and with consider able effi ciency, one might expect the converse to be true at sunset. Becitll se of the smaller dep th of fading aL sunse L, thi s is Itppftl'ell t ly not the cllse. Thus, Lhere is f" difl'erence between the mode conversion effi cicncie. at sunrise Itnd sun set which is possibly reh"tecl to Lhe fact that t he heigll t Lnmsition is shH,rper aL sunrise (becl1Use of pbotodetacinnent) till),]) at sun seL. J t is clear Lhat furLh er work n~eds to be don e on the whole problem of mode con \"erSlOn .
6 . Conclusions
One year 's ob en raLiolls of the periodic ntriations of the phase and alllplitude which occur on the VLF signals from NBA and KPM observed aL Fmnkrurt and Bould er ha\re bee ll exitlnin ed. Th e llhtjor features of the fading are
1. The fading is much more pronoun ced at sunrise Lhan at sunset.
2. The sunrise obseryaLions show five amplitude minima on the NBA-Frankfurt path and three on the NPM-Boulder path.
3. Th e rate of cbitnge of phase is a maximum at the ti mes when th e signal is a minimum, very approximately.
4. The direction of Lhe rapid phase changes at the signal minima is in the sitl1le direction as the prevail ing p lmse change; i. e., a decrease in phase delay at sunrise and an increase aL sunset.
5. At sunrise the depth of fading increases as the sunrise line itpproaches the t ransmiLter.
6. Limi ted obser vations at two points alon g the same great circle path from t he transmitter indicate that fading occurs simul taneously and is of constant dep th on the d itylight side of the sunrise line.
7. At sunset, the depth of fading is smaller at the eastern end of the path.
8. Interpretation of the fad ing as modal interference leads to the conclusion th at the ionospheric heights where the interference occurs are the same at sunrise itnd itt sunset. It is later found that these heigh ts are nighttime heights.
9. There is some e\Tidence which suggests that the depth of fading is dependent on the angle between the great circle path and the sunset (or sunrise line).
The first eight of these experimental resul ts can b e explained if it is recognized that a t sunrise the transmitter (which is in darkness) excites a first and a
33
second order mode. Because of the difference in the phase velocity of these modes, an interference pattern is produced. At the sunrise line, it is suggested that the two modes are converted into one of first order whose amplitude is proportional to the sum of the two modes on the dark side of the sunrise line. At sunset the first order mode in the daytime portion of the earth-ionosphere wa\'eguide is assumed to be converted into a first and a second order mode which propagate in the nighttime portion of the guide, and again produce an interference pattern. As the sunrise or sunset line moves along the path , the interference patterns cause the periodic amplitude and phase variation which are observed experimentally.
The main problem with this explanation is in the details of the mode conversion at the shadow line. Although recent work by Wait [1963bl suggests that higher order modes will be produced at a discontinuity in the height of the earth-ionosphere waveguide, further work is required to account for the obseI'\' ed magnitude of the mode conversion factors.
The writer expresses his appreciation to Anabeth Murphy 1'01. ' completin~ the onerous task of scaling the experimental records, and to Allen H . Brady for
34
de\Tising computer methods of reducing the scaled data. The Frankfurt observations were made by the Battelle Institute. This work was supported in part by the Ad\Tanced Research Projects Agency.
7 . References
Budden, K. G. (1961) , The waveguide mode theory of wave propagation (Prentice-Hall, Inc., New York, N.Y.).
Pierce, J. A. (1957), Intercontinental freq uency comparisons by VLF radio transmission, Proc. IRE <i5, No.6, 794.
Rieker, J. (Mar.- Apr. 1963), Sunset and sunrise in the ionosphere: effects on the propagation of longwa ves, J. Res. NBS 67D (Radio Prop .), No.2 , 119- 138.
Wait, ,j. R. , and 1. B. Perry (1957), Calculations of ionospheric reflection coefficients at very low frequen cies, J. Geophys Re~. 62, No.1, 43.
Wait, J. R. (1962a) , Electromagnetic waves in stratified media (Pergamon Press, 1 tel., Oxford).
Wait, J. R. (July- Aug. 1962b), An analysis of VLF mode propagation for a variable ionosphere height, J. Res. NBS 66D (Radio Prop. ), No . 4, 453- 461.
Wait, J . R. (Jan. 1, 1963a), A note on diurnal phase changes of VLF IVa ves for long paths, J . Geophys Res. 68, 338- 340.
Wait , J . R. (1963b), VLF propagation in the earth-ionosphere waveguide of nonuniform width, The Ionosphere (Institute of Physics and the Physical Society, London) . p . 446.
Yokoyama, E. , and I. Tanimura (1933), Some long distance transmission phenomena of low frequency waves, Proc. IRE 21, No.2, 263.
(Paper 68Dl- 313)


![Propagation of VLF waves under disturbed conditions · VLF propagation over short distances [Bracewell et al., 1951], and ... It will be shown in the present paper how use of this](https://img.pdfslide.us/doc/110x75/5cccf5d788c993de558d5992/propagation-of-vlf-waves-under-disturbed-conditions-vlf-propagation-over-short.jpg)