Embed Size (px)
Citation preview

Pergamon
PII: S0045-6535(97)00130-6
Chemosphere, Vol. 35, No. 4, pp. 879-893, 1997 Published by Elsevier Science Ltd
Printed in Great Britain 0045-6535/97 $17.00+0.00
CHEMICAL AND MUTAGENIC ANALYSIS OF VOLATILE ORGANIC COMPOUNDS
IN RALEIGH AIR SAMPLES AT THREE DIFFERENT ELEVATIONS BEFORE,
DURING, AND AFTER HURRICANE GORDON
Fred Stratton de Pollok ta, Viney P. Aneja ~,
Thomas J. Hughes 3, and Larry D. Claxton 3~
1Dept. Marine, Earth and Atmospheric Science, North Carolina State University, Raleigh, NC 27695
2Present Address: Route #1,257 Marshall Lane, Charleston, MO 63834
3Environmental Carcinogenesis Division, U.S. Environmental Protection Agency,
MD-68, Research Triangle Park, North Carolina 27711
(Received in USA 17 February 1997; accepted 12 March 1997)
ABSTRACT
Volatile organic compounds (VOCs) were collected and measured at a television tower 10 km
southeast of downtown Raleigh, North Carolina at three different levels (Surface, <lm; Mid, 240
m; and Top, 433 m) during the summer and fall of 1994. The combined presence of ozone,
arenes, and nitrogen oxides (NO~) suggested possible nitration of arenes during atmospheric
mixing. Air samples, therefore, were collected using XAD-filled canisters at each level on the
tower prior to, during, and after Hurricane Gordon. Collected air samples were Soxhlet extracted
and analyzed with the Salmonella typhimurium microsuspension mutagenieity assay using strains
YG1021 and YG1026 which are sensitive to nitrarenes. Significant mutagenieity was observed
only in the Top and Mid level samples for the post-hurricane, normal weather air samples.
Surface samples were not mutagenic, which suggests the long-range transport of these mutagenic
nitrarenes. Published by Elsevier Science Ltd
Key Words: Salmonella, mutagenicity, volatile organic compounds, ambient air monitoring,
meteorology, Hurricane
4Send reprint requests to LDC 879
880
I N T R O D U C ~ O N
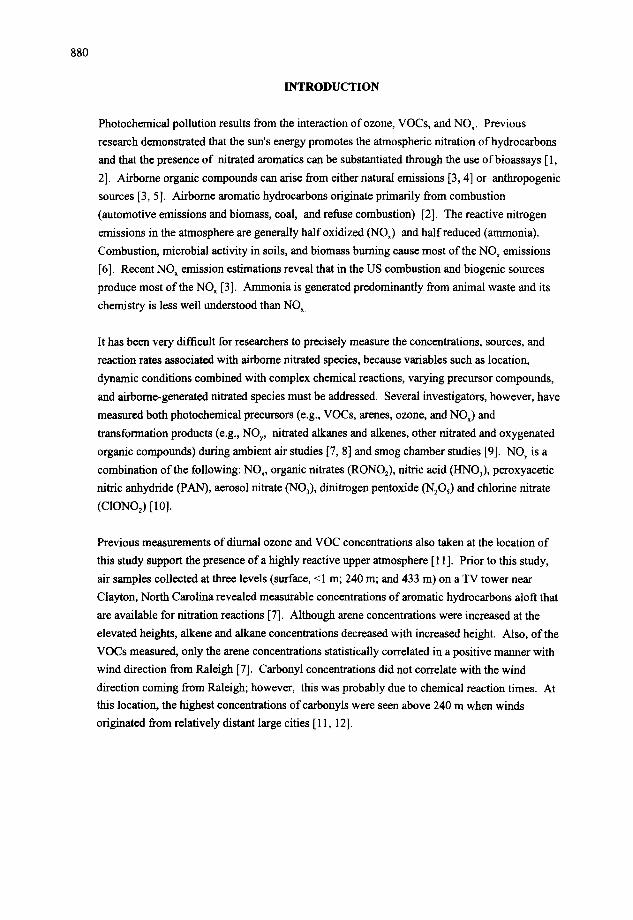
Photochemical pollution results from the interaction of ozone, VOCs, and NO~. Previous
research demonstrated that the sun's energy promotes the atmospheric nitration of hydrocarbons
and that the presence of nitrated aromatics can be substantiated through the use of bioassays [ 1,
2]. Airbome organic compounds can arise from either natural emissions [3, 4] or anthropogenic
sources [3, 5]. Airborne aromatic hydrocarbons originate primarily from combustion
(automotive emissions and biomass, coal, and refuse combustion) [2]. The reactive nitrogen
emissions in the atmosphere are generally half oxidized CNOx) and half reduced (ammonia).
Combustion, microbial activity in soils, and biomass burning cause most of the NO x emissions
[6]. Recent NO x emission estimations reveal that in the US combustion and biogenic sources
produce most of the NO x [3]. Ammonia is generated predominantly from animal waste and its
chemistry is less well understood than NO~
It has been very difficult for researchers to precisely measure the concentrations, sources, and
reaction rates associated with airborne nitrated species, because variables such as location,
dynamic conditions combined with complex chemical reactions, varying precursor compounds,
and airborne-generated nitrated species must be addressed. Several investigators, however, have
measured both photochemical precursors (e.g., VOCs, arenes, ozone, and NOx) and
transformation products (e.g., NOy, nitrated alkanes and alkenes, other nitrated and oxygenated
organic compounds) during ambient air studies [7, 8] and smog chamber studies [9]. NOy is a
combination of the following: NOx, organic nitrates (RONO2), nitric acid (HNO3), peroxyacetic
nitric anhydride (PAN), aerosol nitrate CNO~), dinitrogen pentoxide (N2Os) and chlorine nitrate
(ClON09 [10].
Previous measurements of diurnal ozone and VOC concentrations also taken at the location of
this study support the presence of a highly reactive upper atmosphere [11]. Prior to this study,
air samples collected at three levels (surface, <1 m; 240 m; and 433 m) on a TV tower near
Clayton, North Carolina revealed measurable concentrations of aromatic hydrocarbons aloft that
are available for nitration reactions [7]. Although arene concentrations were increased at the
elevated heights, alkene and alkane concentrations decreased with increased height. Also, of the
VOCs measured, only the arene concentrations statistically correlated in a positive manner with
wind direction from Raleigh [7]. Carbonyl concentrations did not correlate with the wind
direction coming from Raleigh; however, this was probably due to chemical reaction times. At
this location, the highest concentrations ofcarbonyls were seen above 240 m when winds
originated from relatively distant large cities [11, 12].

More surface friction occurs when substances are transported over land than when they are
tranported over water. This surface friction over land produces diffusion, shear turbulence, and
deposition of VOCs (especially the heavier nitrated VOCs like nitrated PAHs) and particles on
surfaces (e.g., plant leaf surfaces) [13, 14]. Because the lower molecular weight VOCs are more
buoyant, they remain aloft for relatively long periods. Concurrently in the upper air boundaries,
the jet stream and upper air pressure fluctuations transport pollutants horizontally thus leading to
long range transport [ 15]. As turbulent buoyancy lifts anthropogenic emissions like arenes,
atmospheric nitration and long range horizontal transport of the pollutant and its atmospheric
transformation products occurs.
881
Bacterial assays have proven useful in demonstrating the presence of mutagenic nitrated arenes
in complex mixtures [2]. Analytical methods such as GC and the GC-MS can speciate but cannot
differentiate alkyl nitrates from nitrogenated VOCs; and neither method, on its own, can discern
which species are hazardous. The most frequently used genotoxicity test for complex
environmental mixtures is the Salmonella/microsome test [16] which has been used for a variety
of ambient air studies [17, 18, 19]. The presence ofnitroarenes in atmospherically transformed
air was first shown by Claxton and Huisingh [20] who found that nitroreductase-deficient strains
ofS. typhimurium produced less mutagenicity when testing the combustion emissions. Most
ambient air samples from the US that have been bioassayed have been mutagenic [2].
Nitrogenated arenes, many of which are mutagenic, can be collected with XAD [21] and
removed from the XAD (for analysis and bioassay) by solid-liquid-vapor extraction. Salmonella
typhimurium strains YGI021 and YG0126 provide increased sensitivity for these types of
mutagenic nitroaromatic compounds. Watanabe et ai. [22] found the S. typhimurium YG1021
strain to have 275 fold increase in response over TA98 for 2,6-dinitrotoluene (2,6-DNT) on a
revertant per microgram basis. The strains YG1021 and YG1026 have increased nitrofurazone-
reductase enzyme activity which enables increased sensitivity for nitroaromatic compounds.
In ambient air monitoring studies, therefore, detection of samples with direct-acting mutagenicity
using YG1021 and YG1026 and elevated concentrations of arenes (as detected by the GC
analysis) supports the concept that nitrated arenes are present. If the samples are
mutagenic only with $9 activation, this would argue against the presence ofnitroarenes. A
finding that the air samples from the higher elevations are more mutagenic than lower levels
would support the idea of nitrification of arenes during long range transport.

882
The hypothesis of this work was that photochemical processes drive the atmospheric nitration of
VOCs, which generates biologically active species in the atmosphere. It was speculated that
some of the nitrated VOCs would be mutagenic and would have half-lives that would allow long-
range transport in the atmosphere. Because the Salmonella mutagenicity assay can measure
mutagenic arenes in ambient air samples, samples collected at three levels were bioassayed using
the strains of Watanabe, et al. [22]. The ozone concentrations [23], and VOCs [7, 24], and NO x
levels [25] are reported elsewhere, and much of this information is contained in detail in the
thesis by Stratton de Pollok [26].
EXPERIMENTAL METHODS
Sampling: Ambient air samples were collected on a 610 m TV tower located about 15 km
southeast of Raleigh. Volatile and semi-volatile organic matter sampling with XAD began
November 15, 1994 prior to Tropical Storm Gordon (Table 1). XAD canisters then were
exchanged as Hurricane Gordon approached the North Carolina coast. The second sampling
period was from November 18-23, 1994, during Hurricane Gordon. The sample was again
exchanged for the third and final sampling period (November 23-30, 1994). Samples were
collected at three levels: Surface (<1 m); Mid, 240 m; and Top, 433 m. Samples for bioassay
were collected with high volume Gillian pumps through 1/4 inch stainless steel tubing positioned
six feet away from the tower. Ambient air flowed at 15 L/minute through XAD-2 (Supelco,
Bellefonte, PA) filled canisters to collect volatile and semi-volatile organic matter. The
procedure of Williams et al. [27] was used to clean the XAD canisters and XAD resin. PM10
sampling heads and pre-filters were installed upstream from the XAD canisters to remove
particulate matter. A blank reference control XAD-2 filled canister accompanied the three
exposed canisters during each sampling period. Following sample collection, canister samples
were kept in a cooler on ice and then stored briefly at -40°C until analysis.
Gravimetrie and TCO Analysis: Following sample collection, the XAD resin of each canister
was Soxhlet extracted individually for 24 hours with 1 liter of dichloromethane per XAD resin
sample volume by the method of Williams, et al., [27]. XAD resin samples were Kudema-
Danish concentrated for 40 hours to isolate the semi-volatile and non-volatile VOCs. Non-
volatile VOCs (boiling point (BP) >300 °C) were gravimetrically analyzed. Semi-volatile
VOCs (BP = 100-300°C) were also analyzed for total chromatographable organics (TCO). The
remaining samples were each diluted in DMSO, and the dichloromethane was evaporated trader
nitrogen before the bioassays were conducted.
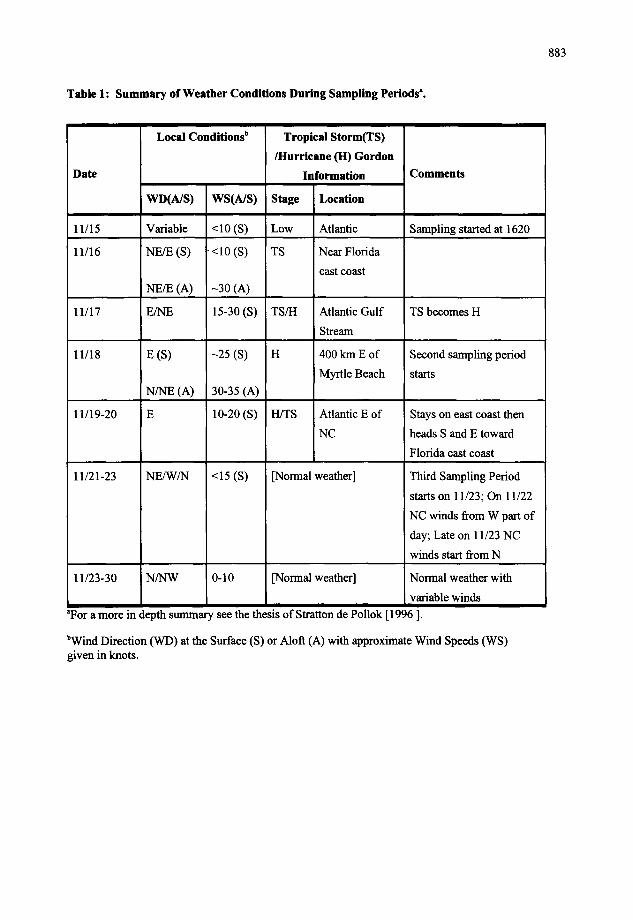
Table 1: Summary of Weather Conditions During Sampling Periods'.
Date
Local Conditions b Tropical Storm(TS)
/Hurricane (H) Gordon
Information
WD(A/S) WS(A/S) Stage Location
11/15 Variable <10 (S) Low
11/16 NE/E (S) "<10 (S) TS
NE/E (A) -30 (a)
11/17 E/NE 15-30 (S) TS/H
11/18 E (S) -25 (S) H
N/NE (A) 30-35 (A)
11/19-20 E 10-20 (S) H/TS
Comments
Atlantic Sampling started at 1620
Near Florida
east coast
Atlantic Gulf
Stream
TS becomes H
400 km E of Second sampling period
Myrtle Beach starts
Atlantic E of Stays on east coast then
NC heads S and E toward
Florida east coast
11/21-23 NE/W/N <15 (S) [Normal weather] Third Sampling Period
starts on 11/23; On 11/22
NC winds from W part of
day; Late on 11/23 NC
winds start from N
11/23-30 N/NW 0-10 [Normal weather] Normal weather with
variable winds
"For a more in depth summary see the thesis of Stratton de PoUok [1996 ].
bWind Direction (WD) at the Surface (S) or Aloft (A) with approximate Wind Speeds (WS) given in knots.
883

884
Mutagenicity Bioassays: Mutagenic response was measured using a Salmonella typhimurium
microsuspension assay. The procedures ofKado et al. [28, 29] were used; except that, instead of
continuous shaking, shaking was done only before and after the 90 minute preincubation.
Samples were bioassayed both with and without 8% $9 (Aroclor 1254-induced rat liver
homogenate [Organon Teknika Corp., Durham, NC]). The tester strains used were YG 1021 and
YG1026 [30] kindly supplied by Dr. Watanabe. Initial microsuspension assays used five doses
of extracted ambient air at 5, 10, 15, 20, and 25 lag (in a 5 ~ti volume) to obtain a dose-response
curve. This was changed to a logarithmic dose-response curve after several assays due to limited
sample size. Spontaneous and positive controls were used as follows: 0.5 lag/plate of sodium
azide (SA), 0.3 lag/plate of2-nitrofluorene (2NF), 0.25 gg/plate of 2-anthramine (2AN), 1.0
lag/plate of benzo(a)pyrene (BaP), and 0.25 ~tg/plate of 4-methyl-3-nitrophenol (4M3NP). After
72 hours of incubation at 37°C, the revertant colonies were counted and slope values (mutagenic
activity in revertants/lag of organics) were generated by the model of Bemstein et al. [31] with
the Gene Tox manager [32].
RESULTS
Meterology and Chemistry: Table 1 summarizes key aspects of the weather patterns during the
three sampling periods. A detailed analysis of the meterological conditions is contained in the
thesis by Stratton de Pollok [26]. During the first two sampling periods, the winds originated
primarily from the northeast and east. Prior to the arrival of Hurricane Gordon, the winds were
relatively calm (<10 knots); however, as the hurricane approached North Carolina the wind
speeds increased. During the third sampling period, normal weather conditions existed and air
flow came primarily from the north and northwest. A previous study [7] found that when the
wind direction was from Raleigh, there was a correlatable increase in arenes. The correlation
between wind direction and arene concentration was better than the correlations between wind
direction and either alkanes or alkenes, [7].
Following the extraction of air samples, the gravimetric and TCO analysis (Table 2) was
surprising because the amount of mass collected was not proportional to the length of the
collection period. The first sampling period was the shortest, yet it yielded the most mass.
During the approach of Hurricane Gordon, 12.76 mg of higher molecular weight compounds
(BP>300) and 37.00 mg of more volatile components were collected. This amount was nearly
four times the amount collected for the final week long period.

Bioassays: Preliminary screening by the standard Salmonella plate incorporation assay (results
not presented) indicated that some of the samples were mutagenic but that the amount of sample
available was too limited for complete testing using this protocol. A mierosuspension bioassay,
therefore, was used.
885
Table 2: Gravametric (GRAV) and Total Chromatographical Organics (TCO) Analysis of
XAD Collected Ambient Air Samples
Analysis
GRAV
TCO
Boiling
Point
I I I I I I l i l l l IIII
>300°C
<300°C
Sampllag
Level
SampllngDates (November 1994)
15-18" 18-23 b 23-30 c I I I III IIII I I
Top
I I I I I
12.76 3.48
5.44 8.88
5.54 3.46
3.78 3.32
37.0 2.0
6.5 0.6
1.1 1.1
1.6 0.7
'1 I
3.66
Mid 3.66
Surface 5.36
Blank 4.94
Top 0,3
Mid 1.4
Surface 1.8
Blank <0.1
'As Hurricane Gordon approached the North Carolina coast.
bAs Hurricane Gordon moved away from the North Carolina coast.
°During normal seasonal weather conditions.
When the air samples were collected, the meteorological effects of Hurricane Gordon on the air
samples were not anticipated. Table 3 summarizes the results of mutagenicity testing, and Figure
1 illustrates the mutagenie response for the most responsive tester strain (YG1026). The
mutagenicity values presented in Table 3 and Figure 1 are based on the Bernstein et al. [31]
statistical analysis method using the GeneTox Management Software [32].

886
The sample for 11/15-18/1994 was collected as Hurricane Gordon approached North Carolina.
For YG1026 with and without $9, all 11/15-18/1994 samples were not mutagenic. For YG1021
without $9, all samples appear to be non-mutagenic; al though for one sample (Surface), a single
plate gave a response outside the normal spontaneous range. For YG1021 with $9, all samples
were not mutagenic.
Table 3: Salmonella typhimurium m u t a g e n i c i t y ( r e v e r t a n t s / u g ) o f a m b i e n t a ir sa mp le s .
Tower Sample YG1021 YG1021 YGI026
Without $9 With $9 Without $9
November 15-18 Sampling Period':
YGI026
With $9
Top Negative Negative Negative ° Negative °
Mid Negative Negative Negative Negative
Surface ( 2 . 0 ) a Negative Negative Negative
Blank Negative Negative Negative Negative
November 18-23 Sampling Periodb:
Top Negative Negative Negative 0.7 ?°
Mid Negative Negative Negative Negative
Surface Negative Negative 1,2 ? 0.9 ?
Blank Negative Negative Negative 1.0 ?
Novel aber 23-30 Sampling Perlod~:
Top 1.2 Negative 1.7 5.3
Mid Negative Negative 3.9 3.0
Surface
Blank
Negative
Negative
Negative Negative
Negative Negative
Negative
Negative 'As Hurricane Gordon approached the North Carolina coast.
has Hurricane Gordon moved away from the North Carolina coast
eDuring normal seasonal weather conditions
aOnly one dose gave a significant response; therefore, biological significance is uncertain.
c? = borderline response, see text for discussion.
The surface-level samples collected 11 / 18-23/1994 (during and immediate ly after Hurricane
Gordon 's approach toward North Carolina) showed some indication o f mutagenici ty with

887
A. Gravimetr ic and TCO Analys is
4O 7 . ~ 3 5
30
~10 ~ 5 0 ~m " g BP" m~W" limPF" "dmBl" ~ " ~ " " ~ "
TIG MIG SIG BIG T/r M/T S/T B/T L o c a t i o n I A n a l y s i s
• Period 1 • Period 2 [ ] Period 3
B. Salmonella Mutagenicity YG1026 Nonaotivetod (N) e n d A c t i v a t e d (A)
6
5
n=3 ~2 :E
1
0 i I I I I I I I
TIN MIN SIN BIN TIA MIA SIA B/A L o c a t i o n / $9 A c t i v a t i o n
[ ] Period 3 • Period 2 • Period 1
Figure 1. Comparison of gravimetric and TCO analysis with Salmonella typhimurium YG1026 mutagenicity for three sampling periods at three elevations.
Period 1 = November 15-18; Period 2 = November 18-23; Period 3 = November 23-30
For display purposes, the order of periods is reversed in the two graphs.
Locations (Elevations): T = Top (433 m); M = Mid (240 m); S = Surface; B = Blank
Analysis: G = Gravimetric; T = TCO; $9 Action: N = Without $9; A = With $9.
YG1026 with and without $9; however, the results were borderline and for the $9 condition gave
results similar to the blank. The top level sample also gave a borderline response when using
strain YG1026 with $9. The results were consisdered borderline when a dose-responsive result

888
that approached a two-fold increase over the spontaneous values occurred but the results were
not statistically significant. The borderline results are noted with a question mark in Table 3.
The mid-level and top-level samples were slightly toxic to the bacteria at the highest doses. For
strain YG 1021 both with and without $9, none of the 11/18-23/1994 samples were mutagenic.
Some of the tower samples collected 11/23-30/1994 (during more normal weather conditions)
were clearly mutagenic. Samples were considered clearly mutagenic i fa definable dose response
was seen, more than a two-fold increase over spontaneous values was seen at one or more doses,
statistical evaluation indicated significance (95% level of confidence), and the response was
repeatable in an independent trial. Using strain YG1021 without $9, the top level showed some
mutagenicity. All other samples were non-mutagenic for YG1021 both with and without
activation. The YG1021 results were similar to those for 11/18-23/1994. The most significant
mutagenicity was observed using YGI026 for air samples collected during this period not
affected by a hurricane or tropical storm. The top and mid level samples were mutagenic both
with and without $9 activation. The blank and surface samples were not mutagenic.
DISCUSSION
The hurricane conditions provided surprisingly unique conditions for the XAD sampling of non-
particulate organic material in this ambient air study. Both the gravimetric analysis and bioassay
results were comprehended after realizing the meteorological importance of this hurricane. After
Tropical Storm Gordon moved over Florida, the warmth of the Gulf Stream increased its strength
to hurricane force. During the first sampling period (11/15-18/1994), as is typical with pre-
hurricane conditions, there was a huge pull of dry polluted air away from the continent and an
analogous pull of clean moist marine air from the sea surface into the continent as seen
historically [33]. A dry cusp seen on the south side clouds of the hurricane near the east coast
confirmed that the dry air was pulled out from the continent [26]. The high pressure region in
the North increased the clean inland sea breeze in North Carolina. Mass analysis of the collected
tower air samples showed that the high winds transported VOCs, but the VOCs initially
transported by Hurricane Gordon were not particularly mutagenic. These upper air samples for
the first period (November 15-18, 1994) would not be expected to be mutagenic because the
arenes had little opportunity for nitration because the air mass spent little time over land.
Atmospheric nitrogen fixation occurs primarily over land because ammonia and NO x emissions

are primarily anthropogenic or agricultural [2]. Only the surface level sample during this time
period produced any indication of a mutagenic response for YG1021 (Table 3). Because
YG1021 detects primarily compounds that cause frameshift mutations (e.g., PAHs,
nitroaromatics, etc.), local anthropogenic sources may account for this activity. Although the
rural location around the tower provided few anthropogenic emission sources, motor vehicles
around the tower would have produced some PAH emissions.
The clean sea air aloft resulting from Hurricane Gordon continued into the second sampling
period and limited the production ofmutagens in the upper level samples (Table 3). Clean sea
air most likely would not be nitrated but still could be oxidized by the upper oxidative
atmosphere. For the sample collected during the second sampling period (November 18-23) as
Hurricane Gordon traveled south, the mid level had twice as much mass as the other levels
(Table 2). This increase in mid level mass probably was caused by the settling of arenes as the
storm's disturbance left the North Carolina area. Many of the GC measurements [26] found the
mid level having higher arene concentrations than either the top or surface levels. The
mutagenicity of the top level with YG1021 when tested with $9 was questionably positive. All
results with strain YG1026 were either non-mutagenic (negative) or gave borderline mutagenic
(positive) results. When $9 was added to the bioassay, the blank for November 18-23, 1994 also
gave a questionable mutagenic response with strain YG1026 (Table 3). Because all the blank
canisters were never exposed to air outside the laboratory, preparation of the XAD, break-down
by-products, or the chemical extraction procedure could be the source of this blank's
contamination. All of the other blanks were clearly non-mutagenic.
The most mutagenic samples were obtained during the third period (November 23-30) that began
several days after Hurricane Gordon had made land fall and turned into a tropical depression.
Even though the final sampling period was the longest period, relatively small amounts of mass
were recovered; however, these samples were the most mutagenic at the top and mid levels
(Figure 1). Because this sampling period occurred during relatively normal weather patterns,
expected atmospheric chemistry most likely occurred. Buoyant turbulence lifts the
anthropogenic arenes and other emitted VOCs aloft where they could be oxidized by the
photolytic decomposition of ozone in the production of free radicals. Turbulent eddies then
would carry these oxidized arenes and other VOCs near the surface where they would combine
with NO X emissions to undergo nitrogen fixation. According to Pitts et al. [17], the collection of
VOCs on the surface of water droplets combined with collection of HNO3 along with the low pH
of water droplets activates nitrogen fixation of VOCs. This nitrogen fixation reaction is
generally so violent that no VOCs remain intact except for arenes that retain their aromatic
889

890
structure. In general, PAHs are so large that they attach to particles and are deposited more
quickly than arenes [2,4]. Therefore, we postulate that arenes which are not degraded during
atmospheric chemical nitration and do not undergo surface deposition are found aloft where they
undergo long-range transport and nitration. As a result of their stability and dispersion, arenes
would have higher concentrations at 240 m aloft when wind directions are from locations with
significant anthropogenic sources. Nitrogenated arenes not only would retain their aromatic
structure but many would be mutagenic. This explanation would be consistent with the GC
measurement of high arene concentrations at mid and top levels (measured the previous two
summers at this location [7, 26]) and the presence of direct-acting mutagens.
CONCLUSIONS
The mutagenicity results of this study support atmospheric nitrogen fixation of VOCs. In
combination with previous studies done at this site using GC measurements and the observation
of the frequent dispersion of anthropogenic pollutants from major cities, this study also supports
the long-range transport of nitrogenated, mutagenic pollutants. Once buoyant turbulence lifts
VOCs aloft to enable atmospheric oxidation, turbulence then brings these oxidized VOCs near
the surface to mix with NO x emissions. The resulting nitrogen fixation of atmospherically stable
arenes would account for the mutagenic response seen at both the top and mid levels under
normal meteorological conditions.
ACKNOWLEDGMENTS
The authors would like to thank Doctors Robert Smart, S. Raman, H. Hassan, G.F. Watson,
A.J. Riordan, and P. Arya at North Carolina State University for advice and council during this
project. We gratefully acknowledge the North Carolina Department of Environment, Health, and
Natural Resources under contract J-4004 for the use of the tower for sampling. Thanks also to G.
Murray, T. Manuszak, B. Graves, and E. Hubbard for assistance with sampling at the tower.
Special thanks go to Sarah Warren, Peggy Mathis, Lance Brooks, Brent Eischen, and Carolyn
Fowler of the Environmental Carcinogenesis Division, U.S. EPA for their assistance. Thanks
also to Dr. T. Ma, Dr. E. S. George, and Debra Walsh for their comments on the manuscript. This
manuscript has been reviewed by the National Health and Environmental Effects Research
Laboratory, U.S. EPA and approved for publication. Approval does not signify that the contents
necessarily reflect the views and policies of the Agency nor does mention of trade names or
commercial products constitute endorsement or recommendation for use.

891
REFERENCES
2.
3.
4.
5.
6.
7.
8.
9.
10.
11.
12.
13.
J.N. Pitts Jr., Formation and fate of gaseous and particulate mutagens and carcinogens in
real and simulated atmospheres, Environ. Health Perspec., 47, 115-140 (1983).
T. E. Graedel, D.T. Hawkins and L. D. Claxton, Atmospheric Chemical Compounds:
Sources, Occurrence, and Bioassay, Academic Press, Inc., Orlando, FL (1986).
National Research Council, Rethinking the Ozone Problem in Urban and Regional Air
Pollution, p. 261-267. National Academy Press, Washington, DC (1994).
J.H. Seinfeld, Atmospheric Chemistry and Physics of Air Pollution, p. 19. John Wiley &
Sons., New York, NY (1986).
P. Warneck, Chemistry of the NaturalAtmosphere, p. 237. Academic Press, Inc., San
Diego, CA (1988).
J.J. Yeager and M. Levi, II, Empirical model of global soil-biogenic NOx emissions,
Journal of Geophysical Research 100, 11447-11464 (1995).
J.H. Lawrimore, M. Das, and V.P. Aneja, Vertical sampling and analysis ofnonmethane
hydrocarbons for ozone control in urban North Carolina, Journal of Geophysical
Research 100, 22785-22793 (1995).
R. E. Atlas, S. M. Schauffier, J. T. Merrill, C. J. Hahn, B. Ridley, J. Walega, J.
Greenberg, L. Heidt, and R. Zimmerman, Alkyl nitrate and selected halocarbon
measurements at Mauna Loa Observatory, Hawaii, Journal of Geophysical Research 97,
10, 331-348 (1992).
R. Atkinson, W.P.L. Carter, K. R. Darnali, A.M. Winer, and J. N. Pitts, Jr., A smog
chamber and modeling study of the gas phase NOx-air photooxidation of toluene and the
cresols, International J. Chem. Kinetics 12, 779-836 (1980).
J.M. Roberts and R.W. Fajer, UV absorption cross sections of organic nitrates of
potential atmospheric importance and estimation of atmospheric lifetimes, Environ. Sci.
Technol. 23, 945-951 (1989).
V.P. Aneja, J.H. Lawrimore, M. Das, F. Stratton, B.R. Hopkins, T.P. Murray, W.G.
Lonneman, and G.C. Murray, Vertical distributions of carbonyls in urban North Carolina.
In Measurement of Toxic and Related Air Pollutants: Proceedings of the 1994 U.S.
EPA/A & WMA International Symposium, p. 470-474, AWMA, Pittsburgh, PA (1994).
J.H. Lawrimore, Measurement and analysis of the vertical distribution and emissions of
nonmethane hydrocarbons in urban North Carolina for ozone control, M.S. Thesis, North
Carolina State University, Raleigh, North Carolina (1994).
D. Helmig, J. Muller, and W. Klein, Volatile organic substances in a forest atmosphere,
Chemosphere 19, 1399-1412 (1989).

892
14. C.N. Hewitt and M.B. Rashed, The deposition of selected pollutants adjacent to a major
rural highway, Atmosph. Environ. 25A, 979-983 (1991).
15. J.R Holton, An Introduction to Dynamic Meteorology., p. 142-145, Academic Press, Inc.,
San Diego, CA (1992).
16. D.M. Maron and B.N. Ames, Revised methods for the Salmonella mutagenicity test,
Mutation Res. 113, 173-215 (1983).
17. J.N. Pitts, Jr., B. Zielinska, J.A. Sweetman, R. Atkinson and A.M. Winer, Reactions of
adsorbed pyrene and perylene with gaseous N20 s under simulated atmospheric
conditions, Atmos. Environ. 19, 911-915 (1985).
18. D. Bell, G. Rives, R. Kamens, J. Perry, D. Saucy and L. Claxton, Mutagenic
transformations of dilute wood smoke and peat smoke under simulated atmospheric
conditions: An outdoor chamber study. 1)1 Polynuclear Aromatic Hydrocarbons:
Mechanisms, Methods and Metabolism (Edited by M. Cooke and A. J. Dennis ) p. 155-
171, Battelle Press, Columbus, OH (1984).
l 9. R. Kamens, D. Isbell, A. Dietrich, J. Perry, R. Goodman, L. Claxton, and S. Tejada,
Mutagenic transformations of dilute wood smoke systems in the presence of ozone and
nitrogen dioxide. Analysis of selected high-pressure liquid chromatography fractions
from wood smoke particle extracts, Environ. &~t. Technol. 19, 63-69 (1985).
20. L.D. Claxton and J.L. Huisingh, Comparative mutagenic activity of organics from
combustion sources. In Pulmonao, Toxicolog3' of Respirable Particles. CONF-791002
(Edited by C.L. Sanders, F.T. Cross, G.E. Dagle, and J.A. Mahaffey), Department of
Energy, Washington, DC (1980).
21. D.A. Bell, R.M. Kamens, L.D. Claxton and J. Lewtas, Photoreaction of wood smoke
particles: Destruction and creation of mutagens in sunlight, Proceedings of the 79th
Annual Meeting of the Air Pollution Control Association, Paper 86-77.4 (1986).
22. M. Watanabe, M. Ishidate Jr. and T. Nohmi, A sensitive method for detection of
mutagenic nitroarenes: Construction of nitroreductase-overproducing derivatives of
Salmonella typhimurium strains TA98 and TA100, Mutation Res. 216, 211-220 (1989).
23. G.C. Murray, T.L. Manuszek, R.S. Graves, and M.J. Gobel, Auburn tower ozone study
1993. In Measurement of Toxic and Related Air Pollutants: Proceedings of the 1994
U.S. EPA/A& WMA International Symposium, pp 464-469, AWMA, Pittsburgh, PA
(1994).
24. M. Das and V.P. Aneja, Vertical distribution of volatile organic compounds and ozone
over North Carolina, Journal of Geophysical Research, submitted.
25. T.C. Moore, Vertical Distribution of Oxides of Nitrogen in the Semi-Urban Planetary
Boundary Layer: Fixing Ratios, Transport, and Sources, M.S. Thesis, North Carolina
State University, Raleigh, North Carolina p. 194 (1995).

26. F. Stratton de Pollok, Mutagenic and Gas Chromatography Analysis of Raleigh Volatile
Organic Compounds in Air Samples at Three Different Elevations Before, During, and
After Hurricane Gordon, M.S. Thesis, North Carolina State University, Raleigh, North
Carolina p. 284 (1996).
27. R. Williams, T. Pasley, S. Warren, R. Zweidinger, R. Watts, A. Stead, and L. Claxton,
Selection of a suitable extraction method for mutagenic activity from woodsmoke-
impacted air particles, Internat. J. Environ. Anal Chem, 34, 137-154 (1988).
28. N.Y. Kado, D. Langley and E. Eisenstadt, A simple modification of the Salmonella
liquid-incubation assay, Mutation Res. 121, 25-32 (1983).
29. N.Y. Kado, C. Manson, E. Eisenstadt, and D.P.H. Hsieh, The kinetics ofmutagen
excretion in the urine of cigarette smokers, Mutation. Res. 157, 227-233 (1985).
30. M. Watanabe, T. Nohmi and M. Ishidate Jr., New tester strains of Salmonella
typhimurium highly sensitive to mutagenic nitroarenes, Biochem. Biophys. Res. Commun.
147, 974-979 (1987).
31. L. Bernstein, J. Kaldor, J. McCann, and M. C. Pike, An empirical approach to the
statistical analysis of mutagenesis data from the Salmonella test, Mutation Res. 97, 267-
281 (1982).
32. L.D. Claxton, J. Creason, J. A. Nader, W. Poteat, and J. D. Orr, GeneTox manager for
bacterial mutagenicity assays: a personal computer and minicomputer system, Mutation
Res. 342, 87-94 (1995).
33. S.D. Godzelman, The Science and Wonders of the Atmosphere, p. 323, John Wiley &
Sons, New York, NY (1980).
893