Embed Size (px)
Citation preview
International Journal of Architecture, Engineering and ConstructionVol.1, No. 2, June 2012, pp. 84-95
Performance Evaluation and Energy Saving Potential of
Windcatcher Natural Ventilation Systems in China
Zhe Ji, Yuehong Su∗, Naghman Khan
Institute of Sustainable Energy Technology, Department of Architecture and Built Environment,
University of Nottingham, Nottingham NG7 2RD, United Kingdom
Abstract: Windcatcher as an architectural element is a passive cooling design to improve indoor thermalcomfort without energy consumption. The performance and energy saving potential of using a windcatchersystem in China are evaluated through EnergyPlus simulation of an office building installed with commercialwindcatchers. The simulation results for the climate condition in Beijing indicate that the peak indoor tem-perature can be reduced by more than 2◦C with the help of windcatchers, for approximately 50% of occupiedhours it can meet the basic ventilation requirement and 28% of occupied hours can reach the purge demand.Moreover, 17% of cooling load can be reduced. The performance of windcatchers can be largely enhanced ifthey are used along with top-hung windows to create cross ventilation. Further investigations are carried outfor various climate regions to evaluate the feasibility of windcatcher applications in China. It is found thataccording to the accumulative hours of meeting ventilation requirement, Harbin is the most suitable city forwindcatcher applications and then Shanghai and Kunming. But, Kunming appears the best city in terms ofpercentage saving in cooling load, followed by Harbin and Urumqi. However, from the economic perspective,Beijing looks the most cost effective city for windcatcher applications due to faster payback period, followed byGuangzhou and Chongqing.
Keywords: Windcatcher, ventilation, energy saving potential, EnergyPlus, simulation
DOI: 10.7492/IJAEC.2012.010
1 INTRODUCTION
Natural ventilation takes advantages of natural force ofwind pressure and stack effect caused by temperaturedifference, to move fresh air through buildings. It isconsidered that proper natural ventilation is a key fac-tor for any building because it plays a significant rolein supplying adequate fresh air as well as maintainingthermal comfort for the occupants without consumingnon-renewable energy.Performance of natural ventilation may be enhanced
by certain novel strategies, such as applying a wind-catcher, which is a traditional device still being used inmodern buildings to induce natural ventilation (Elzaid-abi 2008). The windcatcher is similar to the traditionalwind tower in terms of their functions and mainly usedin Middle East and other arid climate regions to con-quer the severe conditions (Mohsen 2011). Owing to itsnatural ventilation capacity, the windcatcher becomes
more and more popular all over the world especially inmild and temperate climates where free cooling canalso be utilized to combat overheating in buildings.As a development of natural ventilation technology,the modern windcatcher has improved considerably inmany aspects.As is presented by Monodraught (2011), the common
structure of a windcatcher is cubic, with louvers placedat the external entrance. This weatherproof construc-tion is able to prevent the interior of building from rain,snow and other adverse weather conditions. Four quad-rants are set inside using thin diagonal dividers to makethe windcatcher openings either windward to induce aflow of fresh air into the building or leeward to exhaustair according to the wind direction and the pressuredistribution around the structure. It is worthwhile tomention that the airflow through a windcatcher is con-trolled by a volume control damper and egg crate grillat ceiling level, which can be operated both manually
*Corresponding author. Email: [email protected]
84
Ji et al./International Journal of Architecture, Engineering and Construction 1 (2012) 84-95
and automatically based on temperature or CO2 level.The damper will be closed in cold months to protectthe interior of a building from ingress of cold air andescape of warm room air to avoid wastage of energy.Moreover, as is presented by Building Research Estab-lishment (BRE), a windcatcher system performs betterat attenuating noise compared to open windows. In ad-dition, combined with 25mm of acoustic lining used onquadrants, the total noise transmission can be reducedby 26dB as claimed by Monodraught (2011).A number of researchers and engineers have carried
out performance evaluation of windcatchers and muchvaluable results are available. Elmualim (2006a) as-sessed the performance of a commercial 500 mm2 wind-catcher with the height of 1m in terms of four meth-ods, including wind tunnel experiment, ComputationalFluid Dynamics (CFD) technology as well as explicitand AIDA (Air Infiltration Development Algorithm)implicit model (a single zone iterative calculation pro-cedure written in QBasic language using envelope flowtheory). After that, a similar study was carried outonly using CFD technology by Li and Mak (2007).Some general conclusions are obtained in these tworesearch papers, although various methods and wind-catcher types are used respectively. It can be concludedthat a windcatcher’s performance is highly sensitiveto wind speed. The linear relationship between windspeed and airflow rate was demonstrated. The airflowrate increased with the wind speed, but the airflow ratedid not always decrease with the wind incident anglechanging from 0◦ to 45◦.A more detailed study aiming to assess the effect of
damper was conducted again by Elmualim (2006b) us-ing wind tunnel and CFD software. The results indi-cated that both the supply airflow and extract airflowthrough windcatcher can be controlled by damper andegg crate grille. Further research, completed by Hughesand Abdul Ghani (2009) using CFD code showed anoptimum operating range between 45◦ and 55◦.Elmualim (2006b) also investigated the influence of a
heat source by placing a 3kW heater in the test room.The results indicated that the heat source enabled theflow rate to be increased especially at lower wind speed.This could only be explained by the domination ofstack effect over wind pressure. Jones and Kirby (2009)conducted a further research to investigate the interac-tion between stack effect and wind as driving force forthe windcatcher. A critical wind speed of around 2m/swas found, below which stack effect would dominatethe performance.Apart from these, Khan et al. (2011) pointed out
that the windcatcher system has been widely used as“free air-conditioning” in the UK, most especially inschools. Researchers had found that they were able tocomply with building regulations in terms of meetingventilation requirement and combating overheating insummer. Their report concerning a school in the UKusing TAS, a commercial Thermal Analysis Simula-
tion software developed by Environmental Design Solu-tions Limited (EDSL), presented that the windcatcheronly can pass the requirement in Building Bulletin 101(BB101): Ventilation of School Buildings by satisfying2/3 tests. The results by Jones et al. (2008) indicatedthat the windcatcher is helpful to cool the classroomby 1.5◦C and the peak indoor temperature is approxi-mately 3◦C lower than the peak external temperature.Another test of windcatcher performance in a counciloffice in Kings Hill, UK was conducted by Kirk (2002).It was found that the indoor temperature was cooledby up to 4◦C through night cooling and utilizing thethermal mass of the building. Recently, Huynh (2010)pointed out that good performance of windcatcher wasalso obtained in Sydney for maintaining indoor ther-mal comfort and providing adequate fresh airflow forventilation.The windcatcher system has been widely used in
the UK and is rapidly expanding overseas in differentbuilding types including schools, offices, sports halls,hospitals as well as retail stores. However, the appli-cation of windcatcher in China has just started. Thispaper, with the help of EnergyPlus software, will in-vestigate the performance of windcatcher in terms ofmitigating overheating, providing ventilation as wellas saving energy for different climate regions in China.The previous work provides this study with sufficienttheoretical basis and strategy solutions.
2 METHODOLOGY
2.1 Modelling Windcatcher in EnergyPlus
OpenStudio as a plug-in software to EnergyPlus wasused to create the geometry model of a windcatcher.Figure 1 shows the dimensions of the windcatcher usedin this study.
Figure 1. Windcatcher model in OpenStudio
In order to simulate the windcatcher system in En-ergyPlus, it is necessary to consider each quadrant ofthe windcatcher as a separate thermal zone, thus thereare four thermal zones to represent a windcatcher unit.Each side of the unit has an opening area to allow
85
Ji et al./International Journal of Architecture, Engineering and Construction 1 (2012) 84-95
airflow through the windcatcher unit and these open-ing areas were characterized as a window using “Air-flowNetwork: MultiZone: Component: DetailedOpen-ing” in EnergyPlus. To model the effect of externallouvers (1000mm×35mm) on airflow rate, the effectiveopening area was determined by modulating openingfactor which is the ratio of effective opening area towindow area. According to the work by Elmualim(2006a), the opening factor of 0.44 was used. The in-ternal openings of the windcatcher provide an accessto allow airflow entering the room and were describedusing “AirflowNetwork: MultiZone: Component: Hori-zontalOpening” in Energyplus according to Zhai et al.(2011).
The Airflow Network model contained in Energy-Plus provides an ability to simulate multizone airflowsdriven by wind. Simulation of a windcatcher is mainlycontrolled by three inputs, i.e., “Ventilation ControlMode”, “Ventilation Control Zone Temperature Set-point Schedule” and “Venting Availability Schedule”in “AirflowNetwork: MultiZone: Zone”. Combinationof the first two inputs provides an analogous auto-matic control of the windcatcher openings accordingto the room and outdoor temperatures. In this study,the temperature setpoint was chosen as 20◦C. Thismeans that the windcatcher will allow natural ventila-tion when the room temperature is higher than boththe outdoor temperature and 20◦C when venting is al-lowed as defined by the “Venting Availability Schedule”.
2.2 Determine the Discharge Coefficient
Karava et al. (2004) pointed out that the orifice equa-tion below, which came from Bernoulli’s equation forsteady incompressible flow, is the most widely usedmethod to predict airflow through an opening.
Q = ACd
√2∆P
ρ(1)
where Q is the airflow rate (m3/s); A is the area ofopening (m2); ∆P is the pressure difference across theopening (Pa); ρ is the air density (kg/m3); and Cd isthe discharge coefficient. As shown in Eq. (1), themeasured values of the airflow rate and the pressuredifference can be used to determine the discharge co-efficient. A method of investigating pressure loss andairflow rate has been reported by Khan et al. (2011).The individual discharge coefficient of each componentsuch as the external louvers and the volume controldamper should be combined to determine the total dis-charge coefficient of the windcatcher unit. A nominaltotal discharge coefficient was found as 0.4 (Khan et al.2011) and this value was assigned to the four externalopenings of the windcatcher unit while the dischargecoefficient of 1 was used for its bottom openings be-cause 0.4 is already the discharge coefficient for thewhole unit.
2.3 Validation
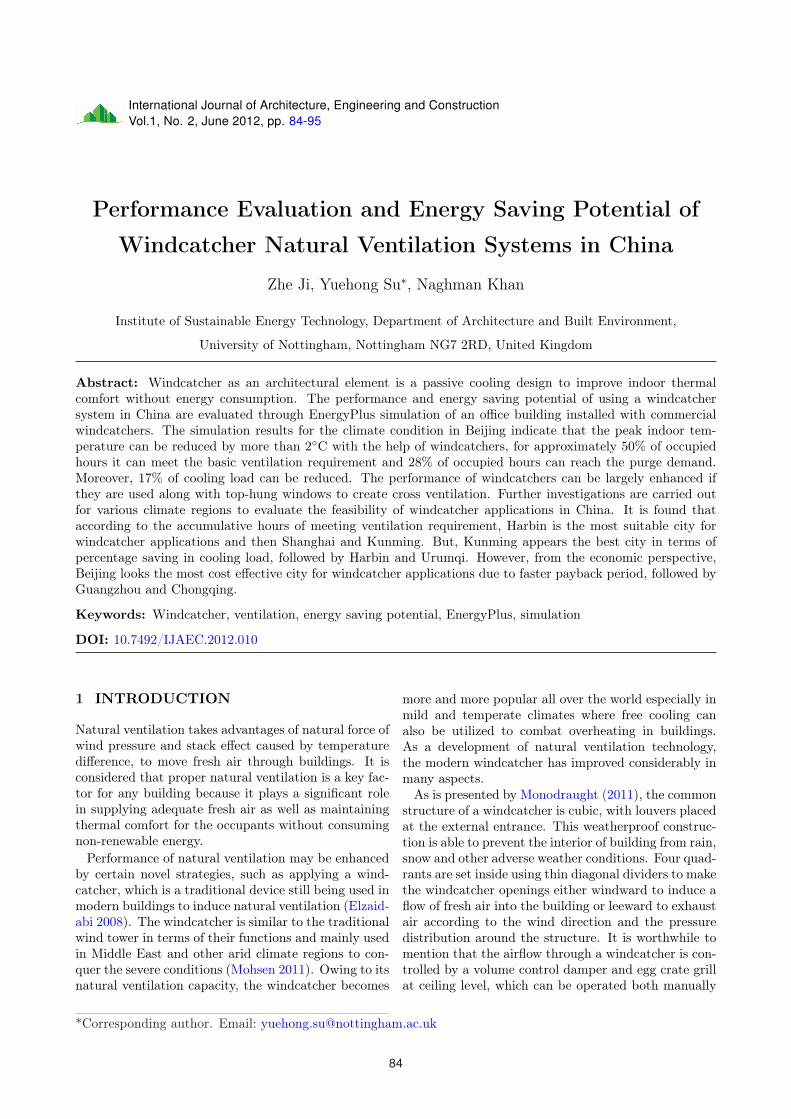
Before applying the windcatcher natural ventilationsystem (WNVS) to a real building and performingfull simulations in specified climate conditions, it is ofgreat importance to run test simulations first to checkwhether the model is able to reflect the property of areal windcatcher unit. The results of airflow rates at0◦ wind direction were validated against the publisheddata by Elmualim (2006a). For the purpose of com-parison, the literature data were modulated accordingto the values of the discharge coefficient and openingarea as shown in Eq. (1).As is shown in Figure 2, both the entering airflow
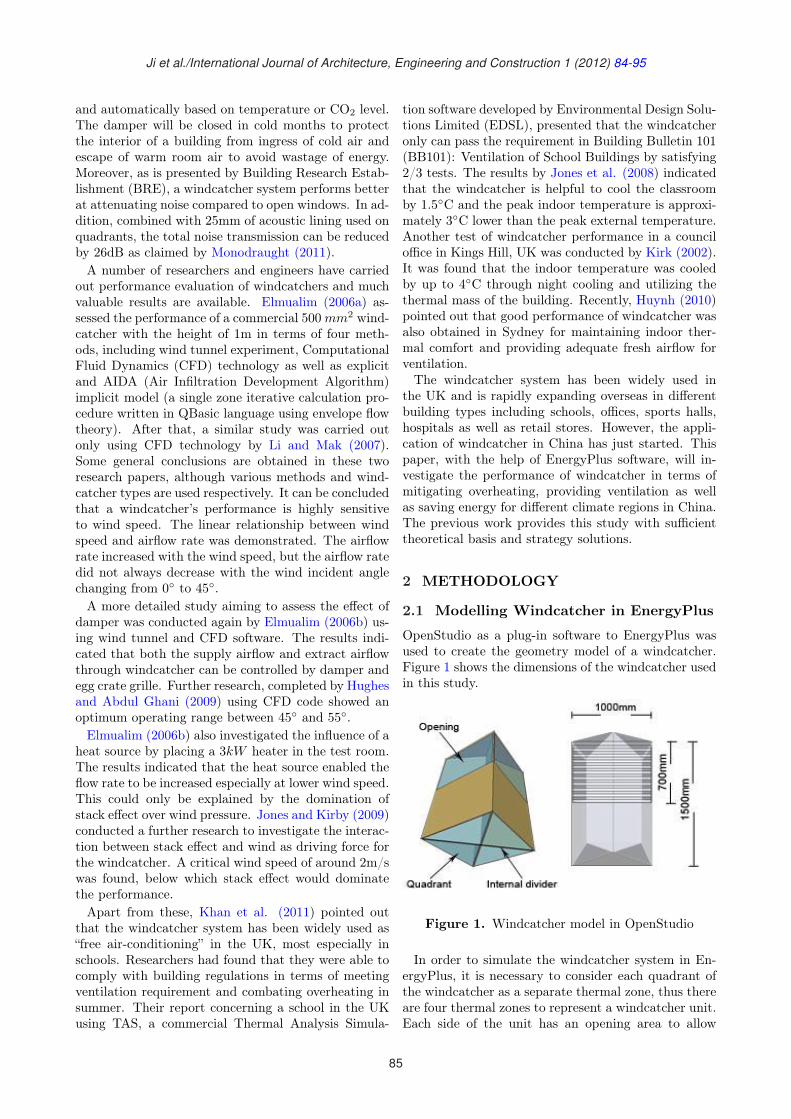
rate and extract airflow rate increase with wind speed.Also, it is clear that the entering flow rate is basicallyequal to extract flow rate, which suggests that flowrate conservation is maintained. The variation trend ofairflow rate generally agrees with the literature data.This indicates that the results of test simulations aregenerally consistent with the previous research. Fur-thermore, Figure 3 illustrates the variation of airflowrate under different discharge coefficients. Obviously,higher discharge coefficient produces higher airflow ratedue to the less friction and resistance to flow and viceversa. In short, the results in Figure 3 indicate thatthe value of airflow rate is sensitive to the discharge
Figure 2. Variation of airflow rate with wind speed
Figure 3. Sensitivity of discharge coefficient
86
Ji et al./International Journal of Architecture, Engineering and Construction 1 (2012) 84-95
coefficient in the model, particularly at higher windspeed. If there was a 10% error in the measured dis-charge coefficient, a similar value of percentage errorcould be contained in the simulated airflow rate.
3 EVALUATION OF WINDCATCHERPERFORMANCE IN BEIJING
3.1 Simulation of an Office Building withInstalled Windcatchers
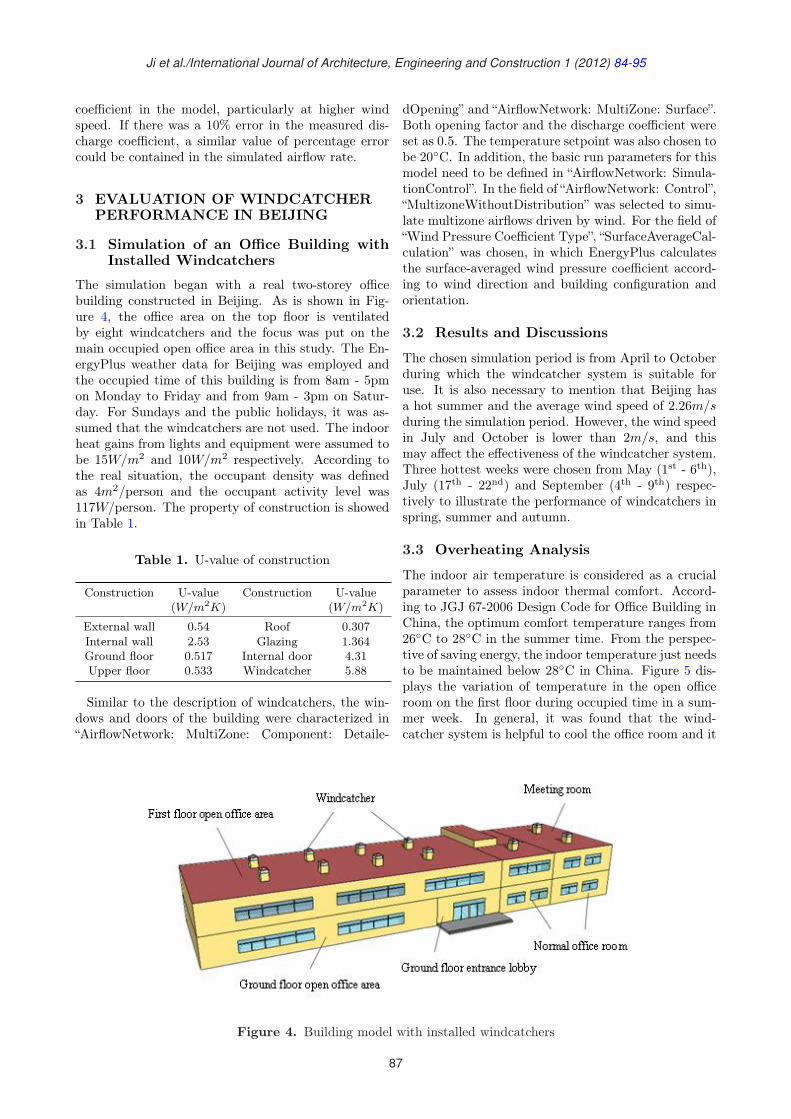
The simulation began with a real two-storey officebuilding constructed in Beijing. As is shown in Fig-ure 4, the office area on the top floor is ventilatedby eight windcatchers and the focus was put on themain occupied open office area in this study. The En-ergyPlus weather data for Beijing was employed andthe occupied time of this building is from 8am - 5pmon Monday to Friday and from 9am - 3pm on Satur-day. For Sundays and the public holidays, it was as-sumed that the windcatchers are not used. The indoorheat gains from lights and equipment were assumed tobe 15W/m2 and 10W/m2 respectively. According tothe real situation, the occupant density was definedas 4m2/person and the occupant activity level was117W/person. The property of construction is showedin Table 1.
Table 1. U-value of construction
Construction U-value Construction U-value(W/m2K) (W/m2K)
External wall 0.54 Roof 0.307Internal wall 2.53 Glazing 1.364Ground floor 0.517 Internal door 4.31Upper floor 0.533 Windcatcher 5.88
Similar to the description of windcatchers, the win-dows and doors of the building were characterized in“AirflowNetwork: MultiZone: Component: Detaile-
dOpening” and “AirflowNetwork: MultiZone: Surface”.Both opening factor and the discharge coefficient wereset as 0.5. The temperature setpoint was also chosen tobe 20◦C. In addition, the basic run parameters for thismodel need to be defined in “AirflowNetwork: Simula-tionControl”. In the field of “AirflowNetwork: Control”,“MultizoneWithoutDistribution” was selected to simu-late multizone airflows driven by wind. For the field of“Wind Pressure Coefficient Type”, “SurfaceAverageCal-culation” was chosen, in which EnergyPlus calculatesthe surface-averaged wind pressure coefficient accord-ing to wind direction and building configuration andorientation.
3.2 Results and Discussions
The chosen simulation period is from April to Octoberduring which the windcatcher system is suitable foruse. It is also necessary to mention that Beijing hasa hot summer and the average wind speed of 2.26m/sduring the simulation period. However, the wind speedin July and October is lower than 2m/s, and thismay affect the effectiveness of the windcatcher system.Three hottest weeks were chosen from May (1st - 6th),July (17th - 22nd) and September (4th - 9th) respec-tively to illustrate the performance of windcatchers inspring, summer and autumn.
3.3 Overheating Analysis
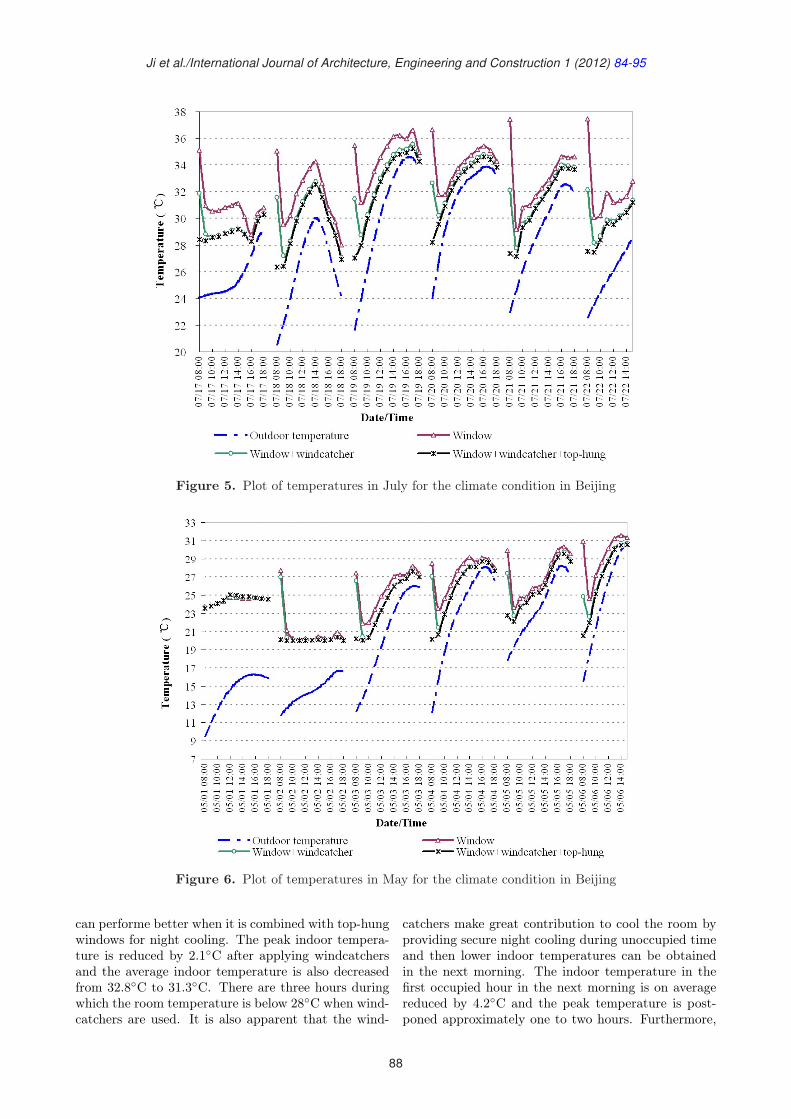
The indoor air temperature is considered as a crucialparameter to assess indoor thermal comfort. Accord-ing to JGJ 67-2006 Design Code for Office Building inChina, the optimum comfort temperature ranges from26◦C to 28◦C in the summer time. From the perspec-tive of saving energy, the indoor temperature just needsto be maintained below 28◦C in China. Figure 5 dis-plays the variation of temperature in the open officeroom on the first floor during occupied time in a sum-mer week. In general, it was found that the wind-catcher system is helpful to cool the office room and it
Figure 4. Building model with installed windcatchers
87
Ji et al./International Journal of Architecture, Engineering and Construction 1 (2012) 84-95
Figure 5. Plot of temperatures in July for the climate condition in Beijing
Figure 6. Plot of temperatures in May for the climate condition in Beijing
can performe better when it is combined with top-hungwindows for night cooling. The peak indoor tempera-ture is reduced by 2.1◦C after applying windcatchersand the average indoor temperature is also decreasedfrom 32.8◦C to 31.3◦C. There are three hours duringwhich the room temperature is below 28◦C when wind-catchers are used. It is also apparent that the wind-
catchers make great contribution to cool the room byproviding secure night cooling during unoccupied timeand then lower indoor temperatures can be obtainedin the next morning. The indoor temperature in thefirst occupied hour in the next morning is on averagereduced by 4.2◦C and the peak temperature is post-poned approximately one to two hours. Furthermore,
88
Ji et al./International Journal of Architecture, Engineering and Construction 1 (2012) 84-95
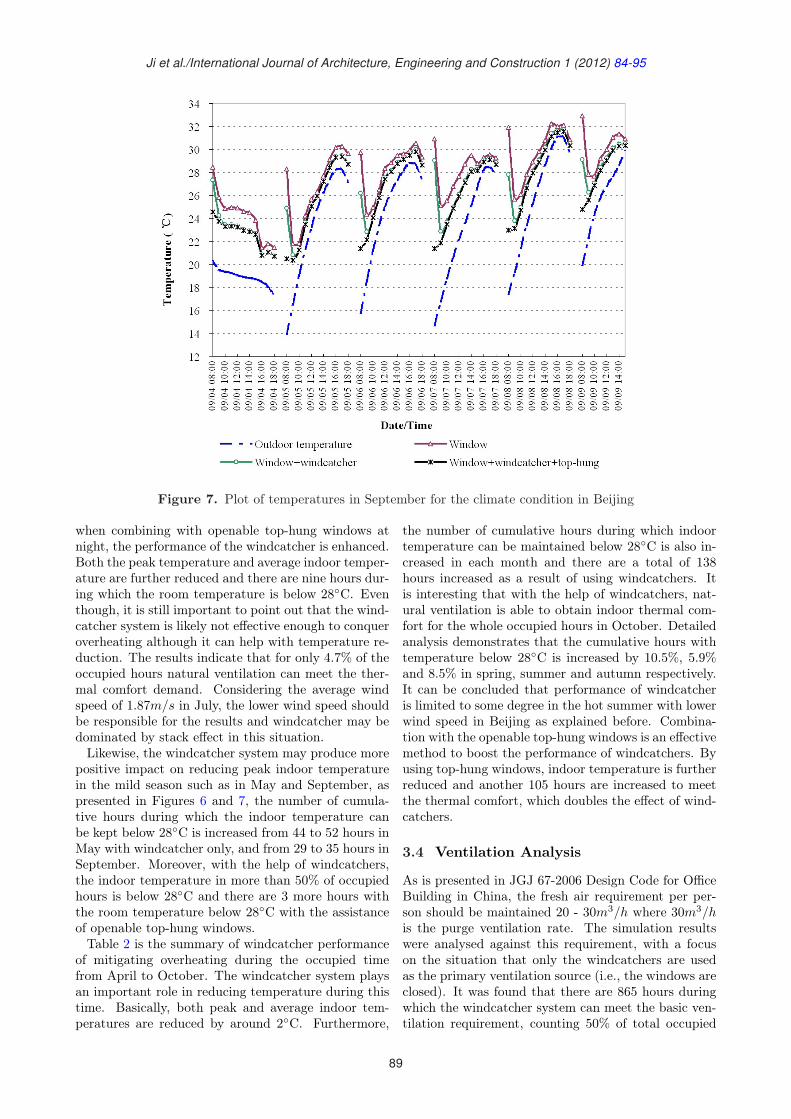
Figure 7. Plot of temperatures in September for the climate condition in Beijing
when combining with openable top-hung windows atnight, the performance of the windcatcher is enhanced.Both the peak temperature and average indoor temper-ature are further reduced and there are nine hours dur-ing which the room temperature is below 28◦C. Eventhough, it is still important to point out that the wind-catcher system is likely not effective enough to conqueroverheating although it can help with temperature re-duction. The results indicate that for only 4.7% of theoccupied hours natural ventilation can meet the ther-mal comfort demand. Considering the average windspeed of 1.87m/s in July, the lower wind speed shouldbe responsible for the results and windcatcher may bedominated by stack effect in this situation.Likewise, the windcatcher system may produce more
positive impact on reducing peak indoor temperaturein the mild season such as in May and September, aspresented in Figures 6 and 7, the number of cumula-tive hours during which the indoor temperature canbe kept below 28◦C is increased from 44 to 52 hours inMay with windcatcher only, and from 29 to 35 hours inSeptember. Moreover, with the help of windcatchers,the indoor temperature in more than 50% of occupiedhours is below 28◦C and there are 3 more hours withthe room temperature below 28◦C with the assistanceof openable top-hung windows.Table 2 is the summary of windcatcher performance
of mitigating overheating during the occupied timefrom April to October. The windcatcher system playsan important role in reducing temperature during thistime. Basically, both peak and average indoor tem-peratures are reduced by around 2◦C. Furthermore,
the number of cumulative hours during which indoortemperature can be maintained below 28◦C is also in-creased in each month and there are a total of 138hours increased as a result of using windcatchers. Itis interesting that with the help of windcatchers, nat-ural ventilation is able to obtain indoor thermal com-fort for the whole occupied hours in October. Detailedanalysis demonstrates that the cumulative hours withtemperature below 28◦C is increased by 10.5%, 5.9%and 8.5% in spring, summer and autumn respectively.It can be concluded that performance of windcatcheris limited to some degree in the hot summer with lowerwind speed in Beijing as explained before. Combina-tion with the openable top-hung windows is an effectivemethod to boost the performance of windcatchers. Byusing top-hung windows, indoor temperature is furtherreduced and another 105 hours are increased to meetthe thermal comfort, which doubles the effect of wind-catchers.
3.4 Ventilation Analysis
As is presented in JGJ 67-2006 Design Code for OfficeBuilding in China, the fresh air requirement per per-son should be maintained 20 - 30m3/h where 30m3/his the purge ventilation rate. The simulation resultswere analysed against this requirement, with a focuson the situation that only the windcatchers are usedas the primary ventilation source (i.e., the windows areclosed). It was found that there are 865 hours duringwhich the windcatcher system can meet the basic ven-tilation requirement, counting 50% of total occupied
89
Ji et al./International Journal of Architecture, Engineering and Construction 1 (2012) 84-95
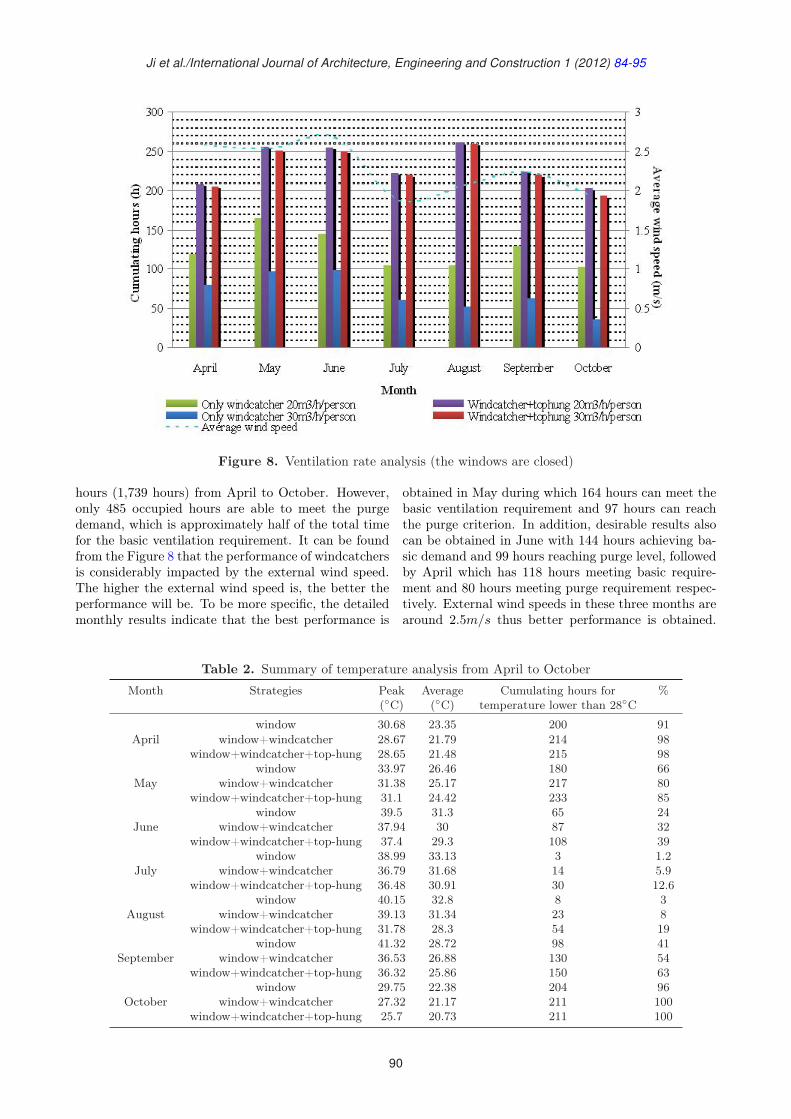
Figure 8. Ventilation rate analysis (the windows are closed)
hours (1,739 hours) from April to October. However,only 485 occupied hours are able to meet the purgedemand, which is approximately half of the total timefor the basic ventilation requirement. It can be foundfrom the Figure 8 that the performance of windcatchersis considerably impacted by the external wind speed.The higher the external wind speed is, the better theperformance will be. To be more specific, the detailedmonthly results indicate that the best performance is
obtained in May during which 164 hours can meet thebasic ventilation requirement and 97 hours can reachthe purge criterion. In addition, desirable results alsocan be obtained in June with 144 hours achieving ba-sic demand and 99 hours reaching purge level, followedby April which has 118 hours meeting basic require-ment and 80 hours meeting purge requirement respec-tively. External wind speeds in these three months arearound 2.5m/s thus better performance is obtained.
Table 2. Summary of temperature analysis from April to October
Month Strategies Peak Average Cumulating hours for %(◦C) (◦C) temperature lower than 28◦C
window 30.68 23.35 200 91April window+windcatcher 28.67 21.79 214 98
window+windcatcher+top-hung 28.65 21.48 215 98window 33.97 26.46 180 66
May window+windcatcher 31.38 25.17 217 80window+windcatcher+top-hung 31.1 24.42 233 85
window 39.5 31.3 65 24June window+windcatcher 37.94 30 87 32
window+windcatcher+top-hung 37.4 29.3 108 39window 38.99 33.13 3 1.2
July window+windcatcher 36.79 31.68 14 5.9window+windcatcher+top-hung 36.48 30.91 30 12.6
window 40.15 32.8 8 3August window+windcatcher 39.13 31.34 23 8
window+windcatcher+top-hung 31.78 28.3 54 19window 41.32 28.72 98 41
September window+windcatcher 36.53 26.88 130 54window+windcatcher+top-hung 36.32 25.86 150 63
window 29.75 22.38 204 96October window+windcatcher 27.32 21.17 211 100
window+windcatcher+top-hung 25.7 20.73 211 100
90
Ji et al./International Journal of Architecture, Engineering and Construction 1 (2012) 84-95
Table 3. External wind speed distribution from April to October
Wind speed(m/s) v < 1 1 ≤ v < 2 2 ≤ v < 3 3 ≤ v < 4 4 ≤ v < 5 5 ≤ v < 6 v ≥ 6
Cumulating hours(h) 182 335 596 372 150 55 69
On the contrary, the worst situation occurs in Octo-ber and July because average external wind speed arelower than 2m/s.Further research was carried out to investigate the
relationship between external wind speed and ventila-tion requirement. The findings indicate that the purgeventilation criterion as well as basic ventilation require-ment can be achieved when wind speeds are around3m/s and 2m/s respectively. Table 3 presents the ex-ternal wind speed distribution during simulation pe-riod. It is easy to calculate that there are only 646hours with wind speed over 3m/s, counting 37% of to-tal occupied time. By considering the effect of winddirection, it is acceptable that only 28% of occupiedtime is able to maintain the purge ventilation rate dur-ing the simulation period. Similarly, due to 1,242 hourswith wind speed higher than 2m/s, more cumulatinghours are obtained to meet basic ventilation require-ment.Use of openable top-hung windows in combination
with windcatchers can produce cross ventilation, en-hancing the performance of windcatchers. Accordingto the simulation results shown in Figure 8, the cu-mulative hours which are able to achieve the purgeventilation demand is significantly increased from 485to 1,594, which makes approximately 92% of occupiedtime meet the criterion. Also, there is only a small
difference in the accumulative hours between the basicventilation requirement and the purge demand. Theseresults support the previous findings that openable top-hung window makes crucial contribution to boostingwindcatcher performance. With using top-hung win-dows, a healthier indoor air quality can be maintainedin almost all occupied time.
3.5 Energy Consumption Analysis
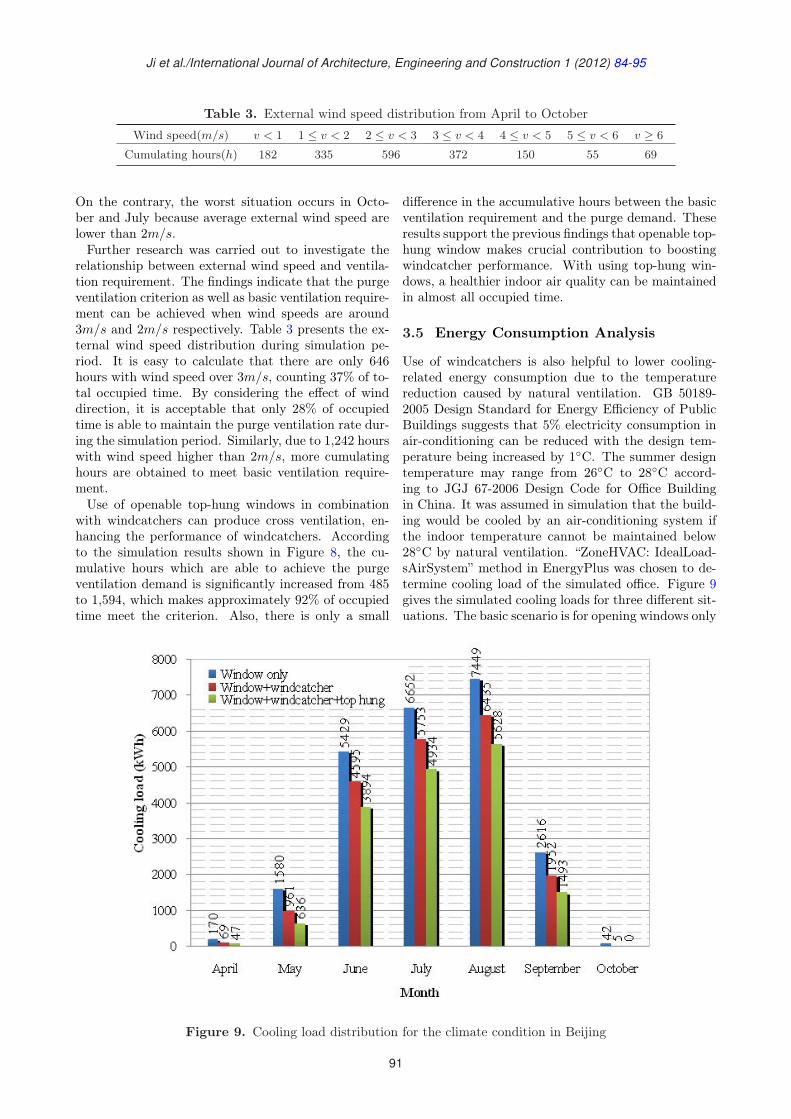
Use of windcatchers is also helpful to lower cooling-related energy consumption due to the temperaturereduction caused by natural ventilation. GB 50189-2005 Design Standard for Energy Efficiency of PublicBuildings suggests that 5% electricity consumption inair-conditioning can be reduced with the design tem-perature being increased by 1◦C. The summer designtemperature may range from 26◦C to 28◦C accord-ing to JGJ 67-2006 Design Code for Office Buildingin China. It was assumed in simulation that the build-ing would be cooled by an air-conditioning system ifthe indoor temperature cannot be maintained below28◦C by natural ventilation. “ZoneHVAC: IdealLoad-sAirSystem” method in EnergyPlus was chosen to de-termine cooling load of the simulated office. Figure 9gives the simulated cooling loads for three different sit-uations. The basic scenario is for opening windows only
Figure 9. Cooling load distribution for the climate condition in Beijing
91
Ji et al./International Journal of Architecture, Engineering and Construction 1 (2012) 84-95
Table 4. Climate data of selected cities
Category Beijing Shanghai Chongqing Guangzhou Kunming Harbin Urumqi
Average wind speed (m/s) 2.63 3.45 1.79 1.67 2.79 4.42 2.73Average temperature in summer (◦C) 25 28 28 29 21 24 23Average temperature in spring (◦C) 17 19 20 25 19 12 14Average temperature in autumn (◦C) 17 22 21 27 18 11 12
Table 5. Ventilation performance of selected cities
Cumulating hours (total 1739) Cumulating hours (total 1739) AverageCity for 30 m3/h/person for 20 m3/h/person wind speed
windcatcher only windcatcher+top-hung windcatcher only windcatcher+top-hung (m/s)
Beijing 485 1,594 865 1,624 2.26Shanghai 954 1,637 1,314 1,678 3.45Chongqing 220 1,578 662 1,575 1.79Guangzhou 183 1,587 425 1,609 1.67Kunming 695 1,585 1,109 1,614 2.79Harbin 1,220 1,667 1,497 1,711 4.42Urumqi 409 1,585 1,087 1,682 2.73
during the occupied hours. In the second scenario, thewindcatchers were used all day to improve natural ven-tilation. The third scenario is to use top-hung windowsto assist windcatchers at night. It was found that thetotal cooling load could be reduced from 23,939kWhto 19,772kWh after using windcatchers and furtherto 16,632kWh when top-hung windows are also used.Thus 17% cooling load is saved when using windcatch-ers and this effect is approximately doubled by alsousing top-hung windows at night. With use of wind-catchers and top-hung windows at night, the thermalmass of the building fabrics is cooled using cooler out-door air. This means that in the next morning, thebuilding fabric can absorb more heat gains and conse-quently contribute to reducing indoor temperature andcooling load as well.
4 EVALUATION OF WINDCATCHERPERFORMANCE IN OTHERCLIMATE REGIONS IN CHINA
Owing to the vast territory, climate is quite distinc-tive in different regions of China which may lead tovery different performances of windcatchers. In orderto evaluate the effect of windcatcher system in differentclimate conditions, the simulated office building was as-sumed to be settled in other six cities (Harbin, Urumqi,Shanghai, Chongqing, Kunming and Guangzhou) withtypical climate conditions. Table 4 lists the generalweather data in these cities.As is shown in Table 4, Harbin has the highest wind
speed of about 4.42m/s, followed by Shanghai with3.45m/s. On the contrary, wind speed in Chongqingand Guangzhou are both lower than 2m/s. Kunmingand Urumqi have similar wind speeds around 2.7m/s.
Shanghai, Chongqing and Guangzhou also have hotsummer compared with the other three cities wherethe average summer temperature is below 25◦C. Thereis no obvious temperature change through all year inKunming and the average temperature is around 20◦C.In addition, according to EnergyPlus weather data,Kunming has the largest diurnal temperature swingbetween daytime and night.
4.1 Ventilation Analysis
Simulation results of ventilation rate in seven cities in-cluding Beijing are presented in Table 5. The wind-catcher system performs more efficient in Harbin, Kun-ming and Shanghai compared with other cities. Amongthis, Harbin obtains up to 1,220 cumulating hours dur-ing which purge ventilation demand is met, followedby Shanghai which has 954 hours and Kunming with695 hours. On the contrary, the worst situation oc-curs in Guangzhou where only 183 hours are able tomeet the demand. As discussed above, a windcatcheris highly sensitive to wind speed. In other words,its performance is predominantly influenced by windspeed. Therefore , it is reasonable to obtain betterperformance in Harbin, Shanghai and Kunming dueto the higher wind speed in these cities, especially inHarbin. It is also worth mentioning that because of thelower wind speed in Guangzhou, the windcatcher per-formance is dominated by stack effect which is drivenby temperature differences. However, due to the hotweather, the indoor and outdoor temperature differ-ence in Guangzhou is narrow, therefore stack effect isrestrained and the windcatcher system does not play asignificant role as expected. Moreover, there are fourcities, i.e., Harbin, Shanghai, Kunming, and Urumqi,which can achieve the basic ventilation requirement for
92
Ji et al./International Journal of Architecture, Engineering and Construction 1 (2012) 84-95
Table 6. Energy saving performance of selected cities
Cooling load (kWh)
City window only window+windcatcher decreased by window+windcatcher+top-hung decreased by
Beijing 23,939 19,772 17% 16,632 31%Shanghai 23,566 20,542 13% 18,304 22%Chongqing 31,727 27,099 15% 23,811 25%Guangzhou 44,138 40,425 8% 36,277 18%Kunming 7,105 2,590 64% 1,530 78%Harbin 7,580 4,919 35% 4,019 47%Urumqi 13,916 9,951 28% 8,162 41%
more than 1,000 hours. Among this, approximately86% of total occupied hours (1,739 hours) in Harbincan achieve the basic ventilation requirement. Further-more, results presented in the table also support theconclusion that top-hung window are an efficient wayto boost the performance of a windcatcher to obtainadequate ventilation rate.
4.2 Energy Saving Analysis
Table 6 shows the cooling load of the simulated of-fice in the selected cities. A remarkable percentagedecrease in the cooling load is obtained in Kunming,Harbin and Urumqi after using windcatchers. Approx-imately 78%, 47% and 41% of cooling load is saved re-spectively when windcatchers together with top-hungwindows are used. First, it is reasonable to gain thisresult in Kunming due to its moderate climate as wellas larger diurnal temperature difference between day-time and night. During the daytime, the windcatchersystem provides cool airflow to the office, and at nightfresh air with lower temperature is ventilated to pre-cool the office so that the cooling load could be reduced.For Harbin where wind speed and air temperature arehigher than in Kunming, the windcatcher system doesnot perform as well as in Kunming in terms of reducingcooling load, although it can achieve higher ventilationrates. On the contrary, unsatisfactory performance ofwindcatchers is found for Guangzhou, Chongqing andShanghai. Among this, Guangzhou is proved againto have the worst situation for windcatcher applica-tions. As mentioned above, the windcatcher perfor-mance is restrained in Guangzhou and Chongqin dueto the lower wind speed and higher air temperature.Therefore it is reasonable that approximately only 8%and 15% cooling energy can be reduced respectively.Although the windcatcher system makes great contri-bution to provide adequate ventilation rates, warmerfresh airflow is not helpful to cool indoor spaces, andthus less than 15% cooling energy is saved in Shanghai.Similarly, there is no doubt that top-hung windows alsosignificantly enhance the effect of windcatchers for re-ducing cooling load.However, it is essential to evaluate the suitability of
windcatchers by considering both the percentage and
total energy savings and ventilation requirement aswell. In terms of percentage energy saving, it can beconcluded that Kunming, Harbin and Urumqi are themost suitable cities for windcatcher applications, com-pared to the other cities. But, due to the outstandingperformance of providing adequate ventilation and thedesirable total energy saving, windcatchers appear alsosuitable for other cities, particularly when top-hungwindows are also used.
5 ECONOMIC ANALYSIS
As is discussed in the previous section, the windcatchersystem can make a great contribution to saving energydue to cutting down the hours of using air-conditioningin summer. Therefore, from the economic perspec-tive, it is also helpful to save the running cost of air-conditioning systems in the building. Table 7 displaysdifferent prices of electricity used in office buildings inthe selected cities according to the different level ofdevelopment.On the basis of energy saving analysis, a simple eco-
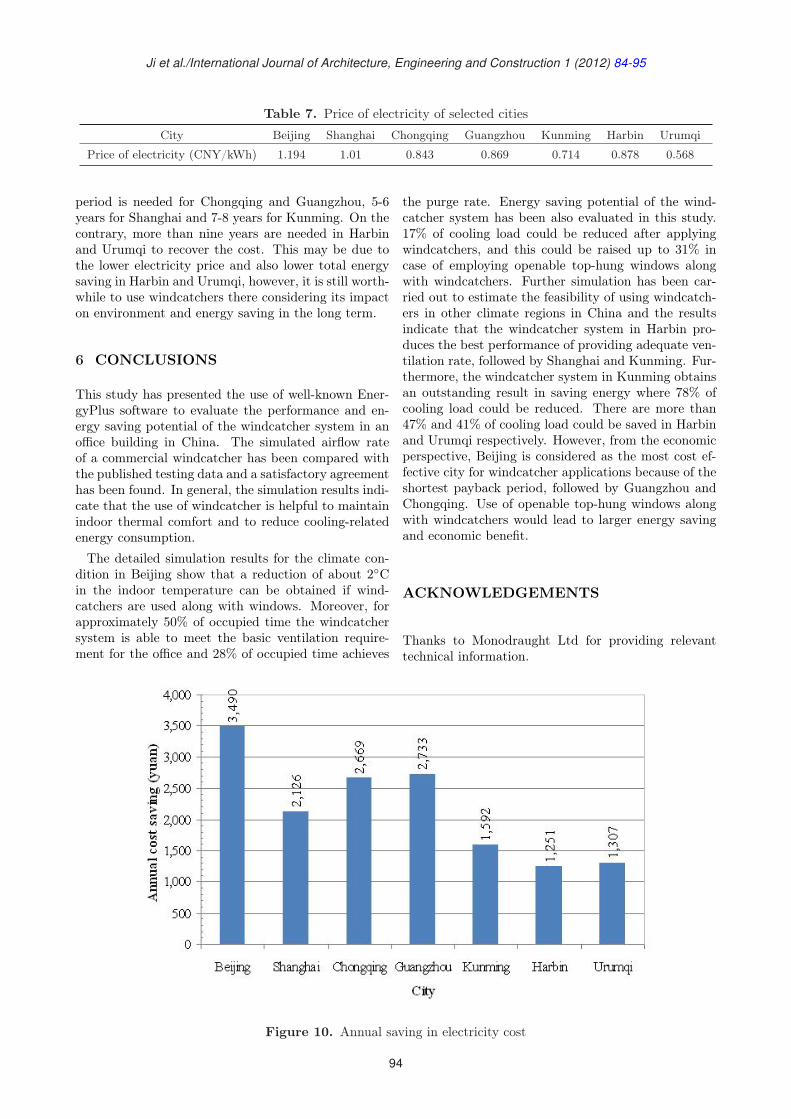
nomic analysis was also conducted to investigate theeconomical benefit of windcatcher applications. TheCOP (coefficient of performance) of air-conditioningwas assumed to be 2.5. Dividing the annual energysaving values in Table 6 by 2.5 gave the reductionin electricity consumption, which was then multipliedby the electricity price to give the reduction in run-ning cost. From Figure 10, it is apparent that up to3,490 CNY (Chinese yuan) could be saved in the an-nual electricity cost in Beijing if the windcatcher sys-tem together with top-hung windows was employed,followed by Chongqing and Guangzhou where around2,700 CNY could be saved per annum. Moreover, ap-proximately 2,126 CNY is reduced in Shanghai, how-ever, only around 1,300 CNY could be saved in Harbinand Urumqi. Assuming that the cost of one wind-catcher is 1,500 CNY, thus the overall cost of eightwindcatchers on the simulated office building will be12,000 CNY. Therefore, the cost of the windcatchersystem will be recovered in 3-4 years in Beijing, mak-ing it the most economically suitable city for wind-catcher applications. Moreover, 4-5 years of payback
93
Ji et al./International Journal of Architecture, Engineering and Construction 1 (2012) 84-95
Table 7. Price of electricity of selected cities
City Beijing Shanghai Chongqing Guangzhou Kunming Harbin Urumqi
Price of electricity (CNY/kWh) 1.194 1.01 0.843 0.869 0.714 0.878 0.568
period is needed for Chongqing and Guangzhou, 5-6years for Shanghai and 7-8 years for Kunming. On thecontrary, more than nine years are needed in Harbinand Urumqi to recover the cost. This may be due tothe lower electricity price and also lower total energysaving in Harbin and Urumqi, however, it is still worth-while to use windcatchers there considering its impacton environment and energy saving in the long term.
6 CONCLUSIONS
This study has presented the use of well-known Ener-gyPlus software to evaluate the performance and en-ergy saving potential of the windcatcher system in anoffice building in China. The simulated airflow rateof a commercial windcatcher has been compared withthe published testing data and a satisfactory agreementhas been found. In general, the simulation results indi-cate that the use of windcatcher is helpful to maintainindoor thermal comfort and to reduce cooling-relatedenergy consumption.The detailed simulation results for the climate con-
dition in Beijing show that a reduction of about 2◦Cin the indoor temperature can be obtained if wind-catchers are used along with windows. Moreover, forapproximately 50% of occupied time the windcatchersystem is able to meet the basic ventilation require-ment for the office and 28% of occupied time achieves
the purge rate. Energy saving potential of the wind-catcher system has been also evaluated in this study.17% of cooling load could be reduced after applyingwindcatchers, and this could be raised up to 31% incase of employing openable top-hung windows alongwith windcatchers. Further simulation has been car-ried out to estimate the feasibility of using windcatch-ers in other climate regions in China and the resultsindicate that the windcatcher system in Harbin pro-duces the best performance of providing adequate ven-tilation rate, followed by Shanghai and Kunming. Fur-thermore, the windcatcher system in Kunming obtainsan outstanding result in saving energy where 78% ofcooling load could be reduced. There are more than47% and 41% of cooling load could be saved in Harbinand Urumqi respectively. However, from the economicperspective, Beijing is considered as the most cost ef-fective city for windcatcher applications because of theshortest payback period, followed by Guangzhou andChongqing. Use of openable top-hung windows alongwith windcatchers would lead to larger energy savingand economic benefit.
ACKNOWLEDGEMENTS
Thanks to Monodraught Ltd for providing relevanttechnical information.
Figure 10. Annual saving in electricity cost
94
Ji et al./International Journal of Architecture, Engineering and Construction 1 (2012) 84-95
REFERENCES
Elmualim, A. A. (2006a). “Dynamic modelling of awind catcher/tower turret for natural ventilation.”Building Services Engineering Research and Technol-ogy, 27(3), 165–182.
Elmualim, A. A. (2006b). “Effect of damper and heatsource on wind catcher natural ventilation perfor-mance.” Energy and Buildings, 38(8), 939–948.
Elzaidabi, A. A. M. (2008). “Low energy, wind catcherassisted indirect - evaporative cooling system forbuilding applications.” Ph.D. thesis, University ofNottingham, Nottingham, United Kingdom.
Hughes, B. R. and Abdul Ghani, S. A. A. (2009). “Anumerical investigation into the effect of windventdampers on operating conditions.” Building and En-vironment, 44(2), 237–248.
Huynh, P. (2010). “A report on the windcatcher.” Re-port No. NSW 2042, For VIM Sustainability PtyLtd., Newtown.
Jones, B. M. and Kirby, R. (2009). “Quantifying theperformance of a top - down natural ventilationwindcatcherTM.” Building and Environment, 44(9),1925–1934.
Jones, B. M., Kirby, R., Kolokotroni, M., and Payne,T. (2008). “Air quality measured in a classroomserved by roof mounted natural ventilation wind-catchers.” Proceedings of the 2008 Conference for theEngineering Doctorate in Environmental Technology,Brunel University, West London, UK.
Karava, P., T., S., and Athienitis, A. K. (2004). “Nat-
ural ventilation openings - a discussion of dischargecoefficients.” Building for the Future: The 16th CIBWorld Building Congres, In-house publishing, Rot-terdam, Netherlands.
Khan, N., Su, Y., Hopper, N., and Riffat, S. (2011).“Evaluation of natural ventilation and cooling sys-tems using dynamic simulation methods.” Interna-tional Journal of Ventilation, 10(2), 133–146.
Kirk, S. D. (2002). “Wind driven top-down naturalventilation and heat gain removal for nondomesticbuildings - ground and first floor temperature pro-files recorded in relation to external air temperaturefrom the 20/07/02 to 14/08/02 at the tonbridge andmalling council offices.” Kings Hill. Proceedings ofthe 2002 Conference for the Engineering Doctoratein Environmental Technology, West London, UK.
Li, L. and Mak, C. M. (2007). “The assessment of theperformance of a windcatcher system using compu-tational fluid dynamics.” Building and Environment,42(3), 1135–1141.
Mohsen, R. (2011). New Method in Modern Architec-ture by Employing Natural Elements with HelpingTechnology. University Technology Malaysia, JohorBahru, Malaysia.
Monodraught (2011). Windcatcher, Innova-tive Natural Ventilation Systems. available atwww.monodraught.com.
Zhai, Z. Q., Johnson, M. H., and Krarti, M. (2011).“Assessment of natural and hybrid ventilation modelsin whole-building energy simulations.” Energy andBuildings, 43(9), 2251–2261.
95


![Airflow Documentation · MySQL operators and hook, support as an Airflow backend pass-word pip install airflow[password] Password Authentication for users postgres pip install airflow[postgres]](https://img.pdfslide.us/doc/110x75/5ff523def0f2ad29d07b25b5/airiow-documentation-mysql-operators-and-hook-support-as-an-airiow-backend.jpg)