Embed Size (px)
Citation preview
International Journal of Computer Science & Information Technology (IJCSIT) Vol 6, No 2, April 2014
DOI:10.5121/ijcsit.2014.6201 1
Performance Variations in Profiling Mysql Server
on the Xen Platform: Is It Xen or Mysql?
Ashish Tapdiya and Yuan Xue
Department of Electrical Engineering and Computer Science, Vanderbilt University ABSTRACT Reliability of a performance model is quintessential to the robust resource management of applications on the cloud platform. Existing studies show that the contention for shared I/O induces temporal performance variations in a guest VM and heterogeneity in the underlying hardware leads to relative performance difference between guest VMs of the same abstract type. In this work, we demonstrate that a guest VM exhibits significant performance variations across repeated runs in spite of contention free hosting of a single guest VM on a physical machine. Also, notable performance difference between guest VMs created equal on physical machines of a homogeneous cluster is noticed. Systematic examination of the components involved in the request processing identifies disk I/O as the source of variations. Further investigation establishes that the root cause of the variations is linked with how MySQL manages the storage of tables and indexes on the guest VM's disk file system. The observed variations in performance raise the challenge of creating a consistent and repeatable profile. To this end, we present and evaluate a black box approach based on database population from a snapshot to reduce the perceived performance variations. The experimental results show that the profile created for a database populated using a snapshot can be used for performance modeling up to 80% CPU utilization. We validate our findings on the Amazon EC2 cloud platform. I. INTRODUCTION Cloud computing has emerged as a new paradigm for large scale distributed computing driven by virtualization technology. Virtualization enables consolidation of multiple virtual machines (VMs) on a single physical server to maximize the server utilization. For example, Amazon EC2 [1] cloud platform leverages Xen virtualization [2] to share the resources of a physical server among the hosted VMs. Infrastructure as a Service (IaaS) cloud platforms provide customers with on demand resources in the form of VMs. Service providers harness the cloud platform and lease VMs to host services. Service providers' profit is contingent on the efficient management of both, the service level agreement (SLA) and the resource rental cost. In order to manage the SLA, service providers rely on the resource management mechanisms. At the center of a resource management mechanism, lies a performance model. A model predicts the system performance by taking a set of input parameters that capture the expected workload, as well as the allocated resource. SLA is specified in accordance with the performance predicted by the model. Therefore, performance model has a direct bearing on the SLA management. Performance profiling is an established method for building the performance model, since purely analytical model is prohibitively complex for this environment. Performance models can be classified into two categories: black box and white box. Black box modeling technique harness profiling to construct models utilizing statistical regression [3],[4]. Whereas, white box modeling technique utilizes profiling to derive the analytical model parameters [5],[6],[7]. The performance model established through profiling is then utilized to perform resource management [3],[5].
International Journal of Computer Science & Information Technology (IJCSIT) Vol 6, No 2, April 2014
2
Consistency and repeatability of the profiled results is quintessential to the utility of the constructed performance model. Previous studies [8],[9],[10],[11],[12],[13] have reported performance variations on the Amazon EC2 cloud platform. Contention for the shared I/O resource between guest VMs hosted on the same physical machine is the primary reason for the temporal performance variations observed in a VM [8],[10],[12]. The temporal performance variations in a VM can render the profile created during one time interval to be useless in another. In recent works [9],[12] authors have reported that VMs of the same abstract type can exhibit relative performance differences. Authors have attributed the difference in performance to the placement of VMs and the heterogeneity in the underlying hardware in evolving data centers like Amazon EC2. Performance variations across VMs of the same abstract type, can lead to creation of unreliable profiles. Through this study, we want to answer the following questions: 1) Does a guest VM exhibit performance variations across repeated runs when we eliminate the contention for the shared I/O resource by hosting a single guest VM on a physical machine? 2) Do guest VMs of the same abstract type exhibit relative performance difference when each guest VM is hosted on a separate physical machine in a cluster with homogeneous hardware? 3) If variations do exist then, which I/O subsystem and software component is responsible for the variations? In this work, we seek to answer the above mentioned questions by profiling the TPC-W benchmark [14]database with the MySQL server [15] on the Xen platform. We choose MySQL since it is the world's most popular open source database server that powers the data stores of large scale web applications like Facebook, Twitter, Wikipedia etc. [16]. Twitter's distributed storage framework that stores 250 million tweets a day is built on top of MySQL [17]. We observe significant performance variations across repeated runs of an experiment in a guest VM. Also, notable performance difference between guest VMs created equal on physical machines of a homogeneous cluster is perceived. This compels us to rethink before directly using the profiled relationships for performance modeling. Further investigation indicates that the disk I/O is responsible for the variations. However, it is not the Xen disk I/O subsystem, rather the MySQL storage engine which is responsible for the observed performance variations. We understand that the root cause of the variations is linked with how MySQL manages the storage of tables and indexes on the guest VM's disk file system. Our contributions are as follows: 1) We present performance variations observed on Xen Platform. 2) We identify MySQL database storage management as the source for the variations. 3) We present the performance impact of populating a database from the snapshot. 4) We introduce a CPU utilization based guideline for consistent performance profiling. 5) We validate our findings on a commercial cloud platform through experiments on Amazon EC2. The rest of this paper is structured as follows. We describe our experiment methodology in section II. In section III, we present our observations related to the complex read statement performance. We describe our experiments performed on the Amazon EC2 cloud platform in section IV, In section V, we evaluate the performance of simple read statement. We discuss our performance observations related to the write statement in section VI. We discuss related work in section VII and conclude in section VIII. II. EXPERIMENT METHODOLOGY We perform experiments in two environments: laboratory test bed and the Amazon EC2 cloud platform. Our laboratory test bed represents a controlled execution environment which allows us to do fine grained resource allocation. We utilize the laboratory test bed to perform extensive experiments and present the performance observations in sections III, V and VI. We utilize Amazon EC2 to perform experiments on a large cluster and validate our findings on a commercial
International Journal of Computer Science & Information Technology (IJCSIT) Vol 6, No 2, April 2014
3
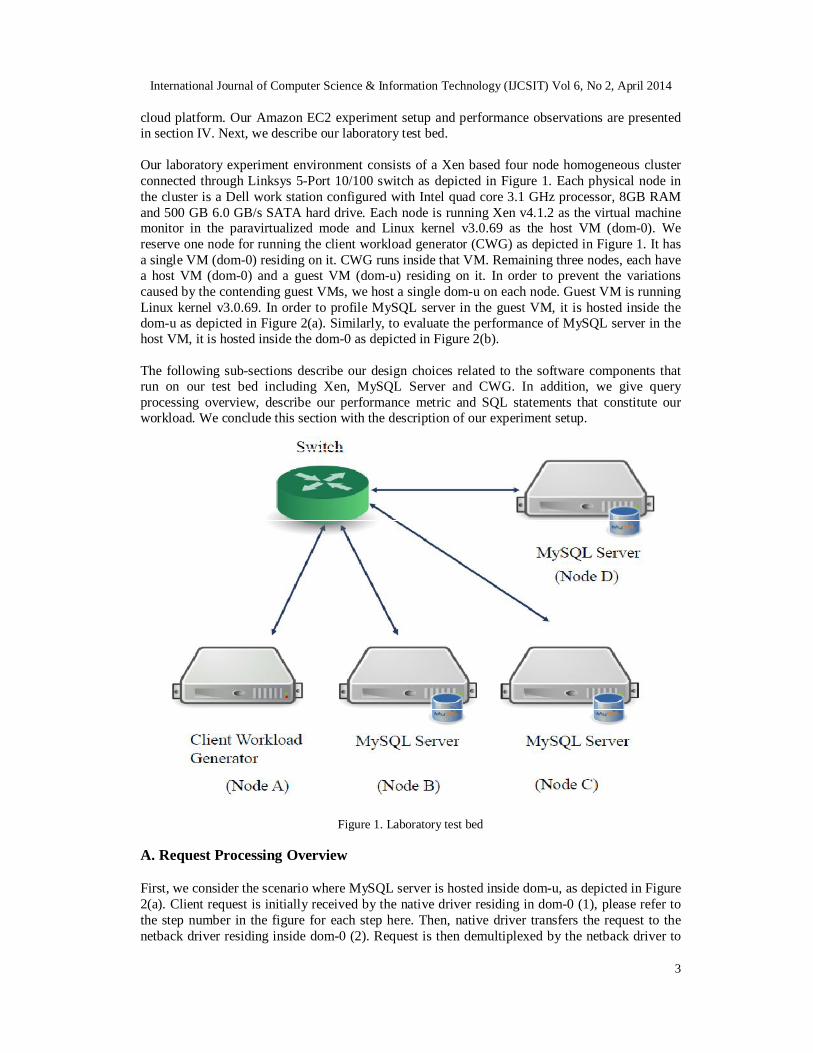
cloud platform. Our Amazon EC2 experiment setup and performance observations are presented in section IV. Next, we describe our laboratory test bed. Our laboratory experiment environment consists of a Xen based four node homogeneous cluster connected through Linksys 5-Port 10/100 switch as depicted in Figure 1. Each physical node in the cluster is a Dell work station configured with Intel quad core 3.1 GHz processor, 8GB RAM and 500 GB 6.0 GB/s SATA hard drive. Each node is running Xen v4.1.2 as the virtual machine monitor in the paravirtualized mode and Linux kernel v3.0.69 as the host VM (dom-0). We reserve one node for running the client workload generator (CWG) as depicted in Figure 1. It has a single VM (dom-0) residing on it. CWG runs inside that VM. Remaining three nodes, each have a host VM (dom-0) and a guest VM (dom-u) residing on it. In order to prevent the variations caused by the contending guest VMs, we host a single dom-u on each node. Guest VM is running Linux kernel v3.0.69. In order to profile MySQL server in the guest VM, it is hosted inside the dom-u as depicted in Figure 2(a). Similarly, to evaluate the performance of MySQL server in the host VM, it is hosted inside the dom-0 as depicted in Figure 2(b). The following sub-sections describe our design choices related to the software components that run on our test bed including Xen, MySQL Server and CWG. In addition, we give query processing overview, describe our performance metric and SQL statements that constitute our workload. We conclude this section with the description of our experiment setup.
Figure 1. Laboratory test bed
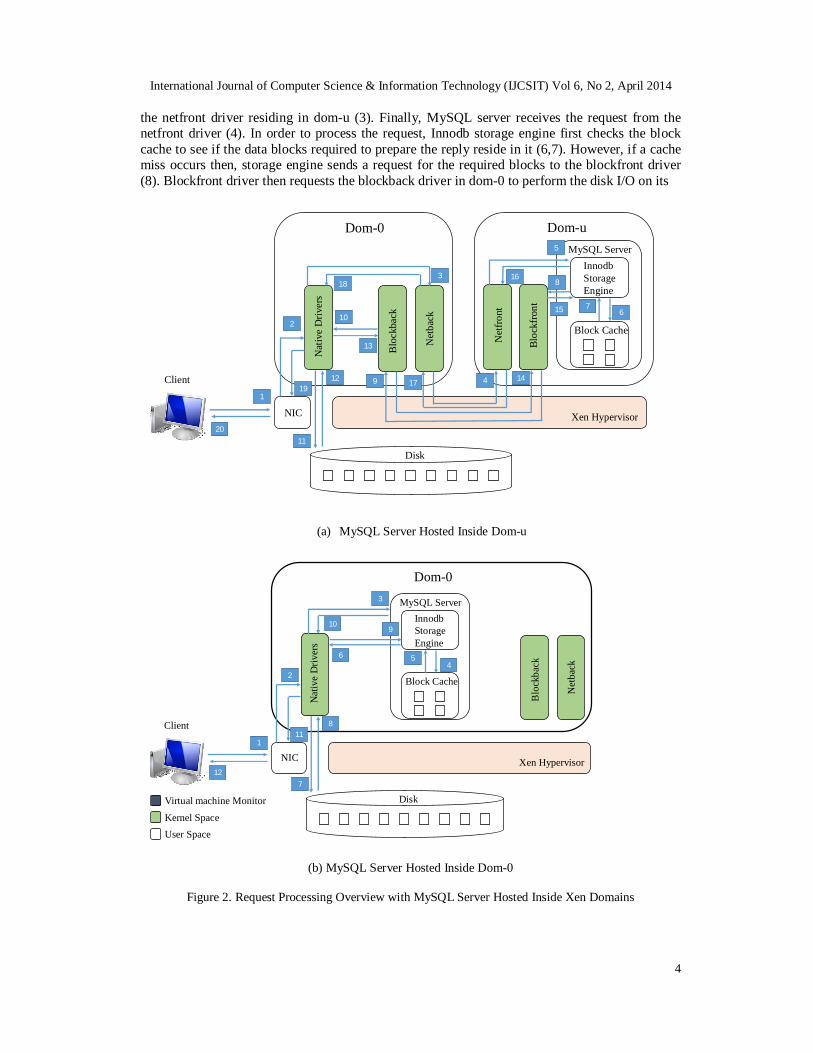
A. Request Processing Overview First, we consider the scenario where MySQL server is hosted inside dom-u, as depicted in Figure 2(a). Client request is initially received by the native driver residing in dom-0 (1), please refer to the step number in the figure for each step here. Then, native driver transfers the request to the netback driver residing inside dom-0 (2). Request is then demultiplexed by the netback driver to
International Journal of Computer Science & Information Technology (IJCSIT) Vol 6, No 2, April 2014
4
the netfront driver residing in dom-u (3). Finally, MySQL server receives the request from the netfront driver (4). In order to process the request, Innodb storage engine first checks the block cache to see if the data blocks required to prepare the reply reside in it (6,7). However, if a cache miss occurs then, storage engine sends a request for the required blocks to the blockfront driver (8). Blockfront driver then requests the blockback driver in dom-0 to perform the disk I/O on its
Nat
ive
Driv
ers
Net
back
Net
front
Blo
ckba
ck
Bloc
kfro
nt
Xen HypervisorNIC
Disk
Block Cache
InnodbStorage Engine
MySQL Server
Dom-0 Dom-u
Client1
2
3
4
5
67
8
9
10
11
12
13
14
15
16
17
18
19
20
(a) MySQL Server Hosted Inside Dom-u
Nat
ive
Driv
ers
Net
back
Blo
ckba
ck
Xen HypervisorNIC
Disk
Dom-0
Client1
2Block Cache
InnodbStorage Engine
MySQL Server
7
3
456
8
910
11
12
Kernel SpaceUser Space
Virtual machine Monitor
(b) MySQL Server Hosted Inside Dom-0
Figure 2. Request Processing Overview with MySQL Server Hosted Inside Xen Domains
International Journal of Computer Science & Information Technology (IJCSIT) Vol 6, No 2, April 2014
5
behalf (9). Blockback driver forwards the request to the native driver (10). Native driver reads the blocks from the disk (11,12) and send them to the blockback driver (13). Blockback driver demultiplexes blocks to the blockfront driver in dom-u (14). Finally, storage engine receives the data blocks from the blockfront driver (15). Once a reply is prepared then, it is sent to the netfront driver (16) which in turn forwards it to netback driver in dom-0 (17). Netback driver forwards the reply to the native driver (18) from where it is finally received by the client (20). Next, we consider the scenario where MySQL server is hosted inside dom-0, as depicted in Figure 2(b). Native driver in dom-0 receives the client request (2) and forwards it directly to the MySQL server (3). Innodb storage engine then checks the cache for the required data blocks (4,5). If a cache miss occurs then, storage engine directly requests the native driver to read the disk data blocks (6). Once a reply is prepared, MySQL server sends the reply to the native driver (10) from where it is delivered to the client (12). B. Database Server Specifics We use MySQL v5.1 as the database server with innodb storage engine. MySQL server is configured with the max_connections parameter set to 2000 and the query_cache_size parameter set to 0 for all experiments. max_connections parameter defines the maximum number of permitted simultaneous client connections. max_connections parameter value is increased so as to stress the server and evaluate performance at higher request rates. query_cache_size parameter defines the amount of memory allocated to store the query results. Query cache is turned off as we are interested in understanding the performance impact of innodb specific buffer pool cache. Innodb buffer pool is a block level cache for caching data and indexes in memory. innodb_buffer_pool_size (γ) parameter defines the size of the block cache. γ is an input parameter to our profiling model. Database is populated utilizing the population script provided with the TPC-W benchmark [14]. Population script mimics the behavior where users modify the database state by issuing INSERT statements. We modify the script to use the innodb storage engine. Database size (S) can be modulated by varying two parameters in the script: NUM_EBS and NUM_ITEMS. To perform experiments with the default database size (Sdefault), we populate database with NUM_EBS set to 100 and NUM_ITEMS set to 10000. C. Xen Hypervisor and Virtual Machine Configuration We have installed Xen v4.1.2 in the paravirtualized mode with standard netback/netfront and blockback/blockfront devices as the networking and storage systems respectively. Both dom-0 and dom-u run Ubuntu with Linux kernel v3.0.69. Logical volume manager (LVM) is the industry standard for creating dom-u file system due to its flexible management [18]. Hence, we create LVM backed dom-u file system. Specifically, we create a single physical partition and assign it to a logical volume group. Then, we create a single logical volume for dom-u inside that volume group. We profile the database performance by hosting the MySQL server inside both dom-0 and dom-u. To profile the MySQL server inside a dom-u residing on a physical node, we allocate one virtual CPU (vcpu) to the dom-u and pin it down on a physical CPU (pcpu). Also, we allocate one vcpu to the dom-0 residing on the same physical node and pin it down on a pcpu. This results in a symmetric vcpu and pcpu allocation across both dom-0 and dom-u. Similarly, in order to profile the MySQL server inside a dom-0, we destroy the dom-u residing on a physical node and host only dom-0. Again, we allocate one vcpu to the dom-0 and pin it down on a pcpu.
International Journal of Computer Science & Information Technology (IJCSIT) Vol 6, No 2, April 2014
6
D. Client Workload Generator Workload generator emulates the client behavior by invoking SQL statement requests at the MySQL server. Workload (λ) is generated through an open model where each new request is invoked independent of any previous requests. The open workload generator model is characterized by request arrival into the system according to some arrival process. Recently, authors in [3],[7] have utilized poisson process [19] to model the open workload generator. Hence, we adopt the same model and choose poisson as the arrival process where request inter arrival times are exponentially distributed.
Table I. Notations
τ Mean response time τse Standard error of τ λ Workload γ Innodb_buffer_pool_size S Database size
Sdefault Default database size with, NUM_EBS=100 & NUM_ITEMS=10000
dom-0 Host VM dom-u Guest VM
θ CPU utilization θmean Mean CPU utilization
µ Mean network delay µse Standard error of µ d Experiment duration
Set to 180 seconds
E. Benchmark SQL Statements We utilize the TPC-W benchmark to identify the benchmark SQL statements. TPC-W is a transactional web benchmark modeled after e-commerce web applications. We analyze the application tier servlets to extract all SQL statements that can be invoked at the database tier. Extracted SQL statements can be classified into two categories: read and write. Based on the query execution plan obtained through EXPLAIN statement [20], read statements can be further classified into two query types: simple and complex. 1. Simple Query: A simple query utilizes indexes to prepare the final result set. We evaluate the
performance of all extracted simple queries and observe that all queries exhibit similar performance trend. Also, difference between the query response times is negligible. Hence, we select and describe a representative simple query. Specifically, query is a SELECT statement that filters records from the Customer table based on the specified unique user name (customer.i_uname =?). Filtered Customer table is then inner joined with the Address and Country tables. Please refer to the TPC-W documentation [14] for the description of table schemas. Query syntax is presented in Figure 3.
SELECT* FROM customer, address, country WHERE customer.c_addr_ID= address.addr_id AND address.addr_co_id= country.co_id AND customer.c_uname=?
Figure 3. Simple Query
International Journal of Computer Science & Information Technology (IJCSIT) Vol 6, No 2, April 2014
7
2. Complex Query: In addition to the use of indexes, a complex query may involve operations like creation of internal temporary table, sorting etc. Depending on the size of temporary table and data set to be sorted, disk file system may be used to prepare the final result set. We evaluate the performance of all extracted complex queries and observe significant performance variations. The magnitude of variation is different across queries; however, the performance trend is similar. Next, we select and describe a representative complex query. Specifically, query is a SELECT statement that filters records from the Item table based on the specified subject (item.i_subject = ?). Filtered Item table is then inner joined with the Author table followed by the sorting operation on a specified columnitem.i_pub_date. Final result set is then limited to a maximum of 50 records. Query syntax is presented in Figure 4.
SELECTi_id, i_title, a_fname, a_lname FROMitem, author WHEREitem.i_a_id = author.a_id AND item.i_subject =? ORDERBYitem.i_pub_date DESCitem.i_title
Figure 4. Complex Query
Any realistic workload will have a mix of both simple and complex queries. Now, magnitude of response time for a complex query is significantly larger than that of a simple query. Therefore, complex queries represent the heavy hitters and variance in their performance can lead to the violation of SLA negotiated response time. Hence, we choose the complex query presented in Figure 4 as the benchmark read statement. In section V, we evaluate performance of the simple query presented in Figure 3. We evaluate the performance of all extracted write statements and observe that all statements exhibit similar performance trend. Hence, we select an INSERT as a representative benchmark write statement. Specifically, statement is anINSERT into table order_line. Statement syntax is presented in Figure 5.
INSERT IGNORE INTO order_line (ol_id, ol_o_id, ol_i_id, ol_qty, ol_discount, ol_comments)
Figure 5. Write Statement
F. Performance Metric We subject MySQL server to the requests generated by the CWG. For each generated request, we record its response time. Mean response time (τ) for all the requests generated during a time interval represents our performance metric. Let k requests are generated during a time duration of d seconds and ri denotes the response time for the ith request. Then, τfor an experiment with duration dis,
휏 =∑ 푟푘
G. Experiment Setup We design experiments by varying parameters both intrinsic and extrinsic to the MySQL server. Intrinsic parameter includes γ and extrinsic parameter includes λ. Hence, each individual experiment is represented as a set of two parameter values (γ, λ). For each parameter setting, we
International Journal of Computer Science & Information Technology (IJCSIT) Vol 6, No 2, April 2014
8
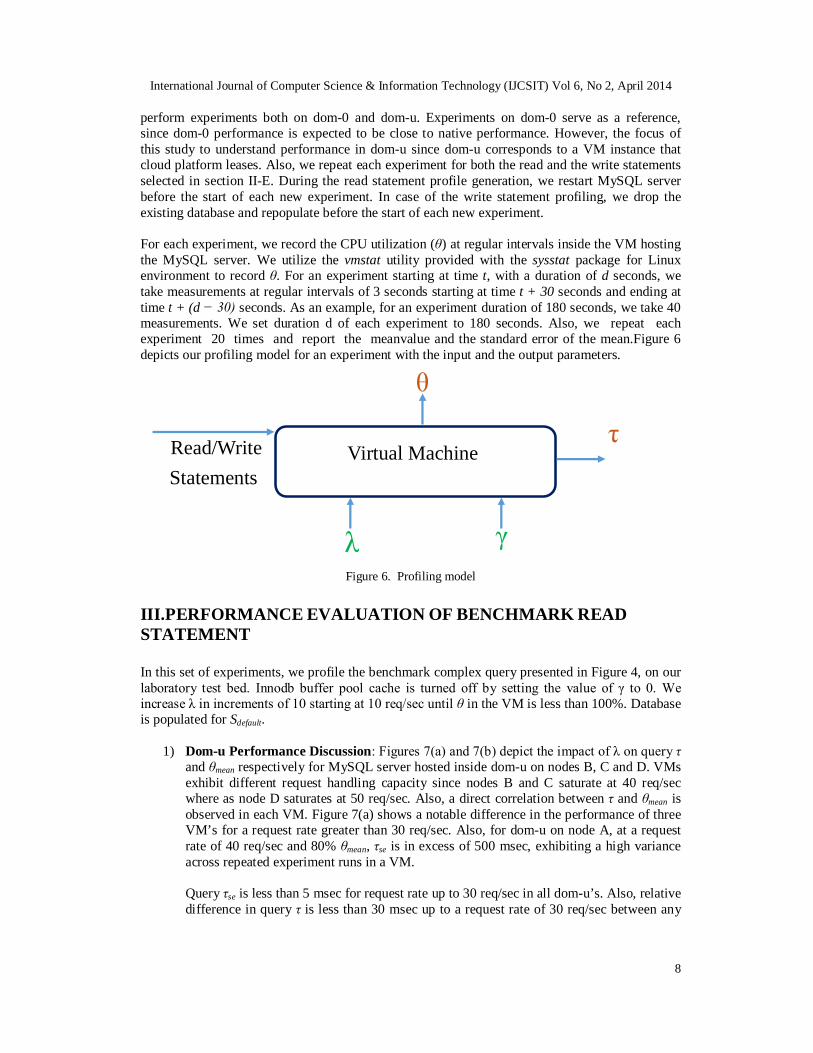
perform experiments both on dom-0 and dom-u. Experiments on dom-0 serve as a reference, since dom-0 performance is expected to be close to native performance. However, the focus of this study to understand performance in dom-u since dom-u corresponds to a VM instance that cloud platform leases. Also, we repeat each experiment for both the read and the write statements selected in section II-E. During the read statement profile generation, we restart MySQL server before the start of each new experiment. In case of the write statement profiling, we drop the existing database and repopulate before the start of each new experiment. For each experiment, we record the CPU utilization (θ) at regular intervals inside the VM hosting the MySQL server. We utilize the vmstat utility provided with the sysstat package for Linux environment to record θ. For an experiment starting at time t, with a duration of d seconds, we take measurements at regular intervals of 3 seconds starting at time t + 30 seconds and ending at time t + (d − 30) seconds. As an example, for an experiment duration of 180 seconds, we take 40 measurements. We set duration d of each experiment to 180 seconds. Also, we repeat each experiment 20 times and report the meanvalue and the standard error of the mean.Figure 6 depicts our profiling model for an experiment with the input and the output parameters.
Figure 6. Profiling model III.PERFORMANCE EVALUATION OF BENCHMARK READ STATEMENT In this set of experiments, we profile the benchmark complex query presented in Figure 4, on our laboratory test bed. Innodb buffer pool cache is turned off by setting the value of γ to 0. We increase λ in increments of 10 starting at 10 req/sec until θ in the VM is less than 100%. Database is populated for Sdefault.
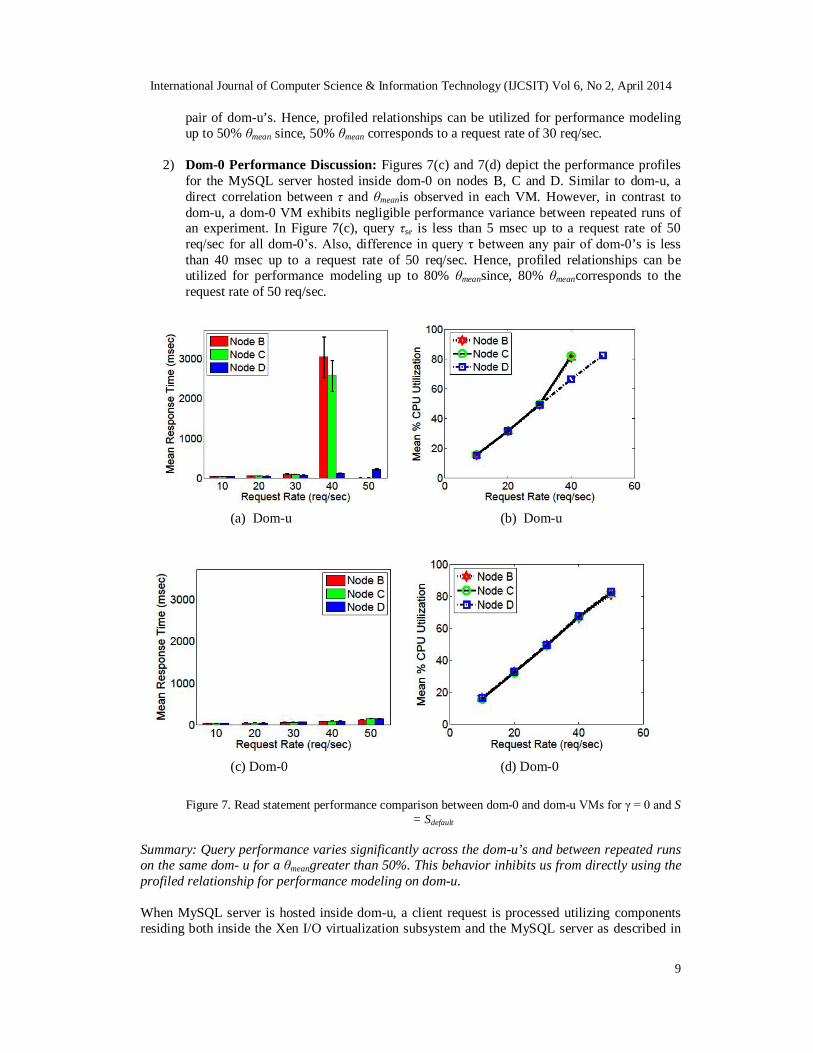
1) Dom-u Performance Discussion: Figures 7(a) and 7(b) depict the impact of λ on query τ and θmean respectively for MySQL server hosted inside dom-u on nodes B, C and D. VMs exhibit different request handling capacity since nodes B and C saturate at 40 req/sec where as node D saturates at 50 req/sec. Also, a direct correlation between τ and θmean is observed in each VM. Figure 7(a) shows a notable difference in the performance of three VM’s for a request rate greater than 30 req/sec. Also, for dom-u on node A, at a request rate of 40 req/sec and 80% θmean, τse is in excess of 500 msec, exhibiting a high variance across repeated experiment runs in a VM. Query τse is less than 5 msec for request rate up to 30 req/sec in all dom-u’s. Also, relative difference in query τ is less than 30 msec up to a request rate of 30 req/sec between any
Read/Write Statements
Virtual Machine
λ γ
τ
θ
International Journal of Computer Science & Information Technology (IJCSIT) Vol 6, No 2, April 2014
9
pair of dom-u’s. Hence, profiled relationships can be utilized for performance modeling up to 50% θmean since, 50% θmean corresponds to a request rate of 30 req/sec.
2) Dom-0 Performance Discussion: Figures 7(c) and 7(d) depict the performance profiles for the MySQL server hosted inside dom-0 on nodes B, C and D. Similar to dom-u, a direct correlation between τ and θmeanis observed in each VM. However, in contrast to dom-u, a dom-0 VM exhibits negligible performance variance between repeated runs of an experiment. In Figure 7(c), query τse is less than 5 msec up to a request rate of 50 req/sec for all dom-0’s. Also, difference in query τ between any pair of dom-0’s is less than 40 msec up to a request rate of 50 req/sec. Hence, profiled relationships can be utilized for performance modeling up to 80% θmeansince, 80% θmeancorresponds to the request rate of 50 req/sec.
(a) Dom-u (b) Dom-u
(c) Dom-0 (d) Dom-0
Figure 7. Read statement performance comparison between dom-0 and dom-u VMs for γ = 0 and S
= Sdefault
Summary: Query performance varies significantly across the dom-u’s and between repeated runs on the same dom- u for a θmeangreater than 50%. This behavior inhibits us from directly using the profiled relationship for performance modeling on dom-u. When MySQL server is hosted inside dom-u, a client request is processed utilizing components residing both inside the Xen I/O virtualization subsystem and the MySQL server as described in
International Journal of Computer Science & Information Technology (IJCSIT) Vol 6, No 2, April 2014
10
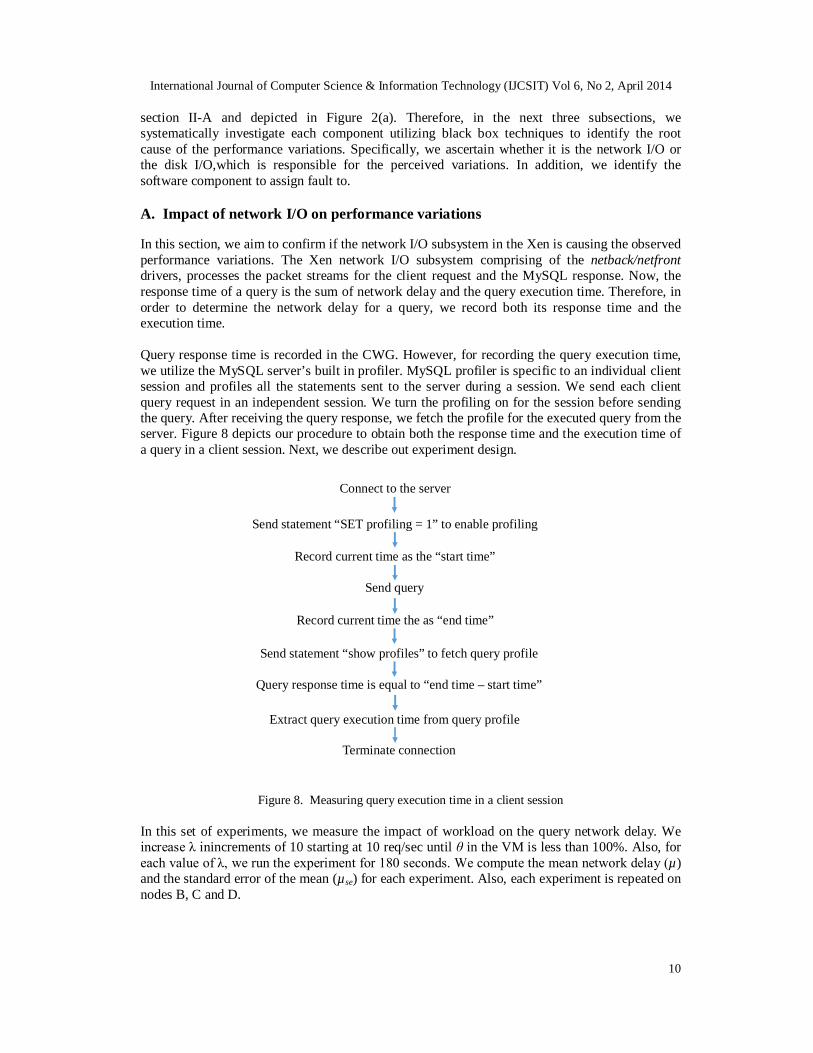
section II-A and depicted in Figure 2(a). Therefore, in the next three subsections, we systematically investigate each component utilizing black box techniques to identify the root cause of the performance variations. Specifically, we ascertain whether it is the network I/O or the disk I/O,which is responsible for the perceived variations. In addition, we identify the software component to assign fault to. A. Impact of network I/O on performance variations In this section, we aim to confirm if the network I/O subsystem in the Xen is causing the observed performance variations. The Xen network I/O subsystem comprising of the netback/netfront drivers, processes the packet streams for the client request and the MySQL response. Now, the response time of a query is the sum of network delay and the query execution time. Therefore, in order to determine the network delay for a query, we record both its response time and the execution time. Query response time is recorded in the CWG. However, for recording the query execution time, we utilize the MySQL server’s built in profiler. MySQL profiler is specific to an individual client session and profiles all the statements sent to the server during a session. We send each client query request in an independent session. We turn the profiling on for the session before sending the query. After receiving the query response, we fetch the profile for the executed query from the server. Figure 8 depicts our procedure to obtain both the response time and the execution time of a query in a client session. Next, we describe out experiment design.
Connect to the server
Send statement “SET profiling = 1” to enable profiling
Record current time as the “start time”
Send query
Record current time the as “end time”
Query response time is equal to “end time – start time”
Send statement “show profiles” to fetch query profile
Extract query execution time from query profile
Terminate connection
Figure 8. Measuring query execution time in a client session
In this set of experiments, we measure the impact of workload on the query network delay. We increase λ inincrements of 10 starting at 10 req/sec until θ in the VM is less than 100%. Also, for each value of λ, we run the experiment for 180 seconds. We compute the mean network delay (µ) and the standard error of the mean (µse) for each experiment. Also, each experiment is repeated on nodes B, C and D.
International Journal of Computer Science & Information Technology (IJCSIT) Vol 6, No 2, April 2014
11
Table II presents the summary of experiment results. Queryµ increases minimally with the increase in λ. Also, µse is inconsequential for all experiments. In addition, Query µ is negligible in comparison with the query τ for all values of λ. Also, since, the time spent by a query in the netback/netfront drivers is always bounded by the network delay. Therefore, we conclude that the Xen network I/O subsystem is not responsible for the observed variations. Summary: Insignificant values of µ and µse suggest that the netback/netfront drivers are not inducing the perceived variations. B. Impact of disk I/O on performance variations
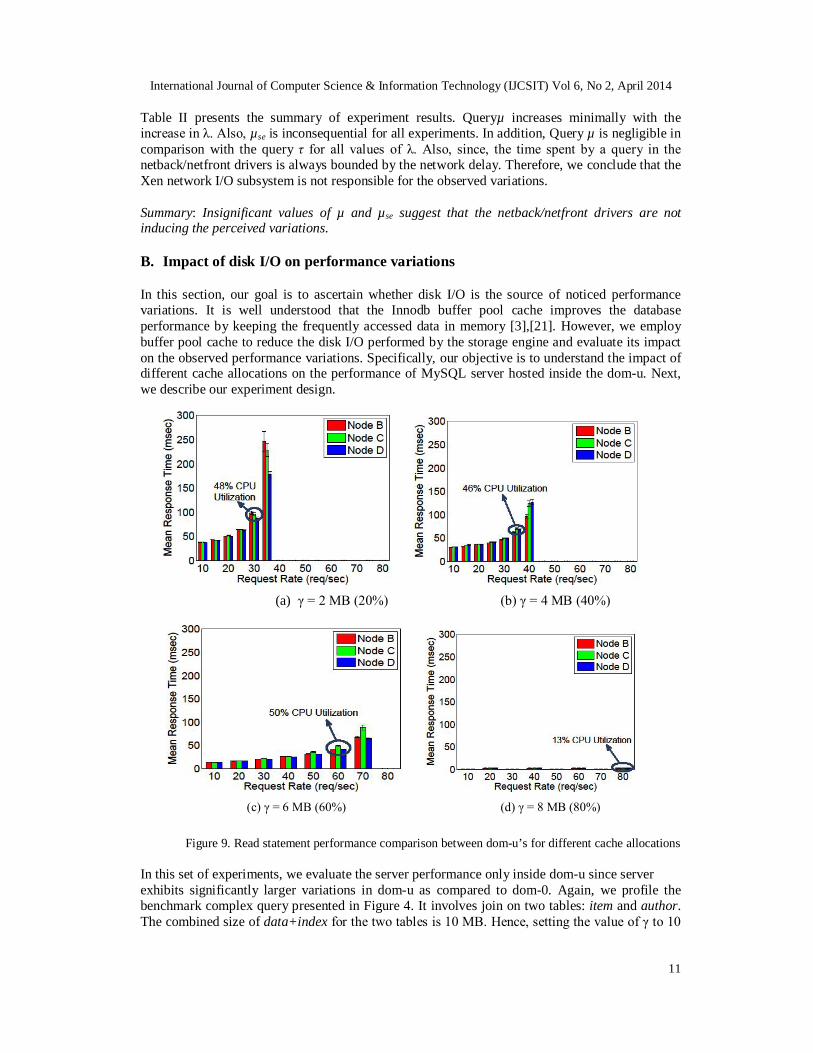
In this section, our goal is to ascertain whether disk I/O is the source of noticed performance variations. It is well understood that the Innodb buffer pool cache improves the database performance by keeping the frequently accessed data in memory [3],[21]. However, we employ buffer pool cache to reduce the disk I/O performed by the storage engine and evaluate its impact on the observed performance variations. Specifically, our objective is to understand the impact of different cache allocations on the performance of MySQL server hosted inside the dom-u. Next, we describe our experiment design.
(a) γ = 2 MB (20%) (b) γ = 4 MB (40%)
(c) γ = 6 MB (60%) (d) γ = 8 MB (80%)
Figure 9. Read statement performance comparison between dom-u’s for different cache allocations
In this set of experiments, we evaluate the server performance only inside dom-u since server exhibits significantly larger variations in dom-u as compared to dom-0. Again, we profile the benchmark complex query presented in Figure 4. It involves join on two tables: item and author. The combined size of data+index for the two tables is 10 MB. Hence, setting the value of γ to 10
International Journal of Computer Science & Information Technology (IJCSIT) Vol 6, No 2, April 2014
12
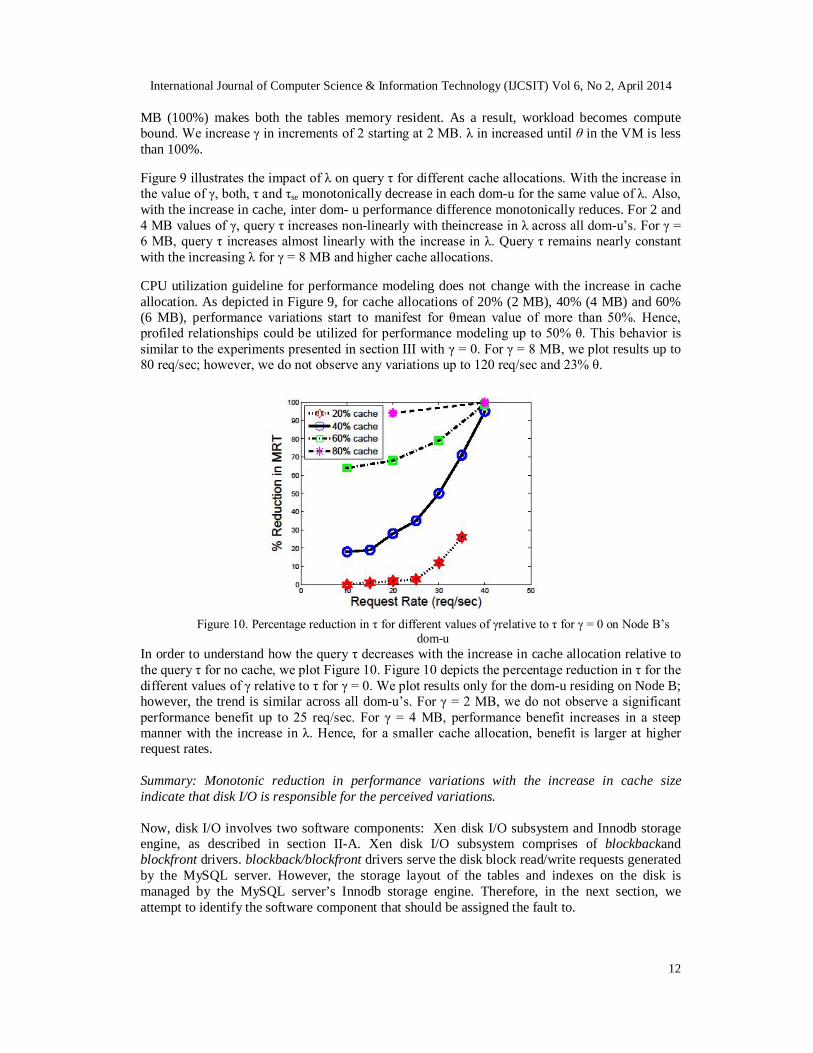
MB (100%) makes both the tables memory resident. As a result, workload becomes compute bound. We increase γ in increments of 2 starting at 2 MB. λ in increased until θ in the VM is less than 100%. Figure 9 illustrates the impact of λ on query τ for different cache allocations. With the increase in the value of γ, both, τ and τse monotonically decrease in each dom-u for the same value of λ. Also, with the increase in cache, inter dom- u performance difference monotonically reduces. For 2 and 4 MB values of γ, query τ increases non-linearly with theincrease in λ across all dom-u’s. For γ = 6 MB, query τ increases almost linearly with the increase in λ. Query τ remains nearly constant with the increasing λ for γ = 8 MB and higher cache allocations. CPU utilization guideline for performance modeling does not change with the increase in cache allocation. As depicted in Figure 9, for cache allocations of 20% (2 MB), 40% (4 MB) and 60% (6 MB), performance variations start to manifest for θmean value of more than 50%. Hence, profiled relationships could be utilized for performance modeling up to 50% θ. This behavior is similar to the experiments presented in section III with γ = 0. For γ = 8 MB, we plot results up to 80 req/sec; however, we do not observe any variations up to 120 req/sec and 23% θ.
Figure 10. Percentage reduction in τ for different values of γrelative to τ for γ = 0 on Node B’s
dom-u In order to understand how the query τ decreases with the increase in cache allocation relative to the query τ for no cache, we plot Figure 10. Figure 10 depicts the percentage reduction in τ for the different values of γ relative to τ for γ = 0. We plot results only for the dom-u residing on Node B; however, the trend is similar across all dom-u’s. For γ = 2 MB, we do not observe a significant performance benefit up to 25 req/sec. For γ = 4 MB, performance benefit increases in a steep manner with the increase in λ. Hence, for a smaller cache allocation, benefit is larger at higher request rates. Summary: Monotonic reduction in performance variations with the increase in cache size indicate that disk I/O is responsible for the perceived variations. Now, disk I/O involves two software components: Xen disk I/O subsystem and Innodb storage engine, as described in section II-A. Xen disk I/O subsystem comprises of blockbackand blockfront drivers. blockback/blockfront drivers serve the disk block read/write requests generated by the MySQL server. However, the storage layout of the tables and indexes on the disk is managed by the MySQL server’s Innodb storage engine. Therefore, in the next section, we attempt to identify the software component that should be assigned the fault to.
International Journal of Computer Science & Information Technology (IJCSIT) Vol 6, No 2, April 2014
13
Table II. Query µand µsewith dom-u inside Nodes B, C and D
λ
Node B Node C Node D Number of
requests generated
µ
µse
Number of requests
generated
µ
µse
Number of requests
generated
µ
µse
10 1755 1.48 0.01 1837 1.47 0.01 1857 1.43 0.01 20 3613 1.47 0.07 3513 1.46 0.007 3655 1.56 0.02 30 5488 1.51 0.01 5509 1.54 0.01 5481 1.55 0.01 40 7133 2.05 0.05 7175 1.61 0.03 7341 1.81 0.02 50 3.68 0.07
C. Impact of database population from snapshot on performance variations
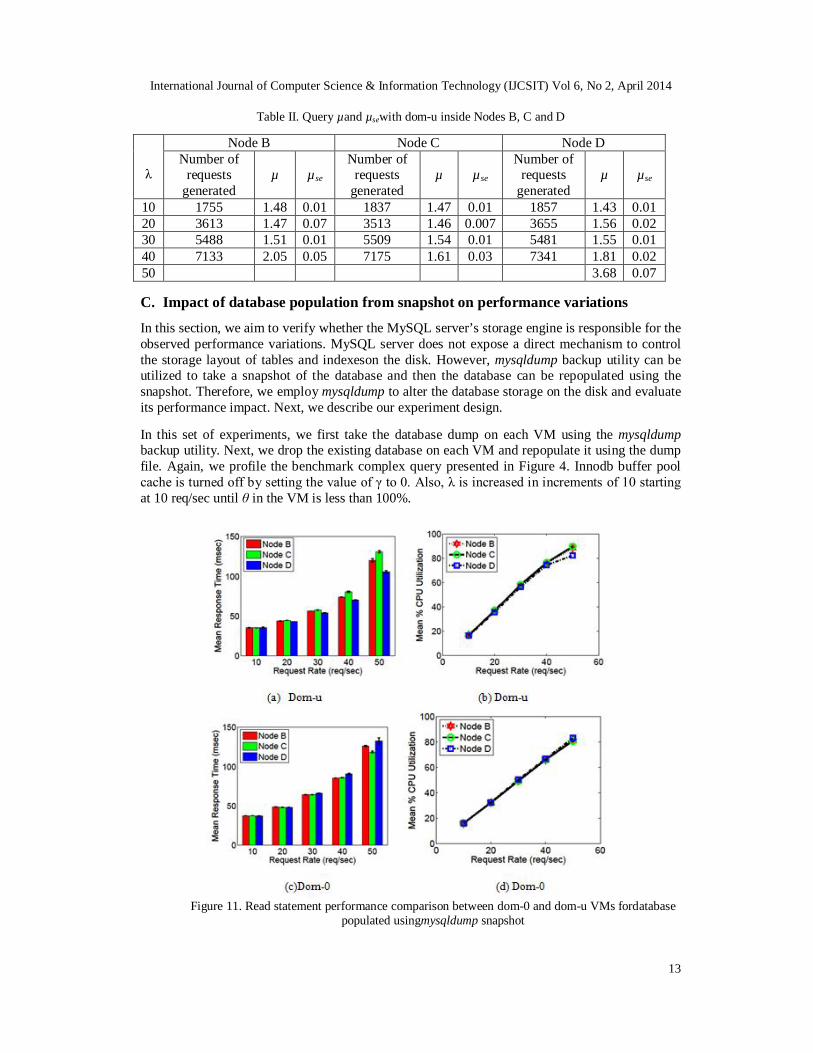
In this section, we aim to verify whether the MySQL server’s storage engine is responsible for the observed performance variations. MySQL server does not expose a direct mechanism to control the storage layout of tables and indexeson the disk. However, mysqldump backup utility can be utilized to take a snapshot of the database and then the database can be repopulated using the snapshot. Therefore, we employ mysqldump to alter the database storage on the disk and evaluate its performance impact. Next, we describe our experiment design. In this set of experiments, we first take the database dump on each VM using the mysqldump backup utility. Next, we drop the existing database on each VM and repopulate it using the dump file. Again, we profile the benchmark complex query presented in Figure 4. Innodb buffer pool cache is turned off by setting the value of γ to 0. Also, λ is increased in increments of 10 starting at 10 req/sec until θ in the VM is less than 100%.
Figure 11. Read statement performance comparison between dom-0 and dom-u VMs fordatabase populated usingmysqldump snapshot
International Journal of Computer Science & Information Technology (IJCSIT) Vol 6, No 2, April 2014
14
As depicted in Figures 11(a) and 11(c), query τ difference between any two VMs is less than 20 msec for λ up to 50 req/sec. Also, query τse across repeated runs on any VM is less than 3 msec up to 80% θmean. Hence, relationship profiled on one VM could be utilized for performance modeling on any other VM up to 80% θ. Also, it can be noticed from Figures 7 and 11, that query τ in a VM is smaller for a snapshot populated database than the script populated database for the same λ. Populating the database from a snapshot increases the request handling capacity of the MySQL server hosted inside a dom-u. As a consequence, service providers can manage the SLA with a smaller cluster size. This results in reduced rental cost and increased profit margins for the service provider. However, as a downside, database remains offline during the repopulation phase. Also, as the size of database grows, repopulation time also increases. Summary: Database population from a snapshot significantly reduces variance in performance both across dom-u’s and between repeated runs on a dom-u. Hence, we conclude that the root cause of variations is linked with how MySQL manages the storage of tables and indexes on the guest VM’s disk file system
(a) Script Populated Database (b) Script Populated Database
(c)Snapshot Populated Database (d) Snapshot Populated Database
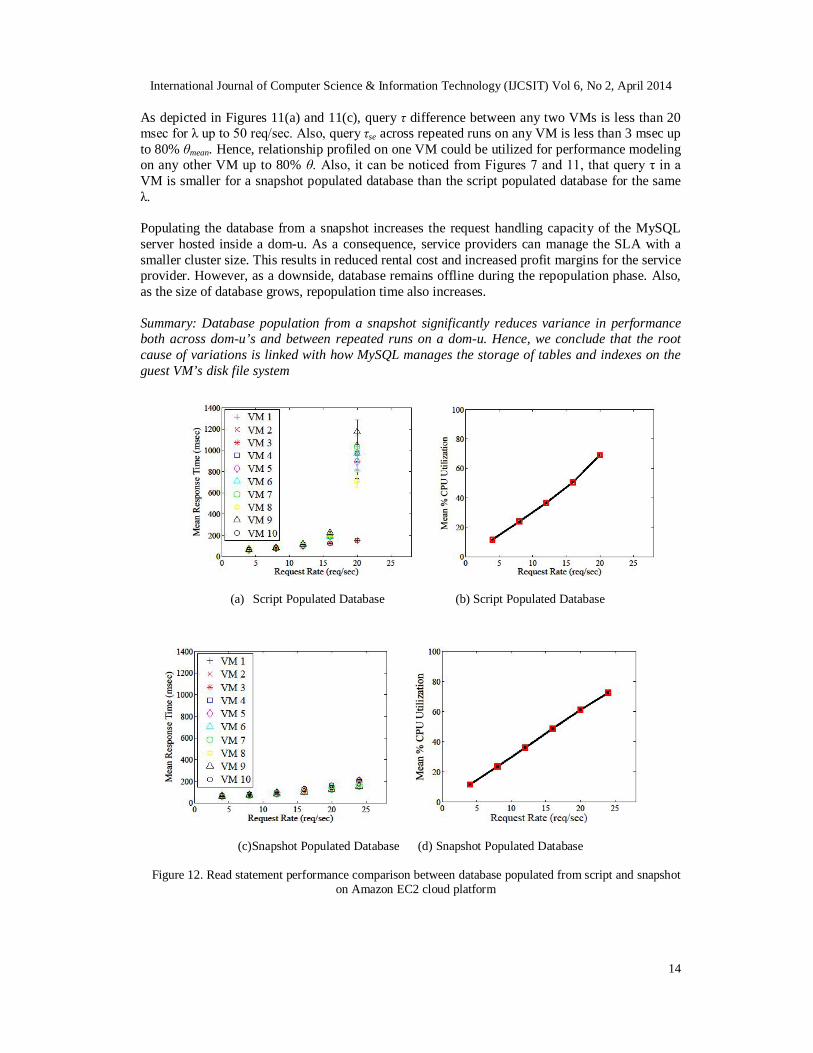
Figure 12. Read statement performance comparison between database populated from script and snapshot on Amazon EC2 cloud platform
International Journal of Computer Science & Information Technology (IJCSIT) Vol 6, No 2, April 2014
15
IV.AMAZON EC2 EXPERIMENTS We performed experiments on Amazon EC2 to validate our findings on a commercial cloud platform. Specifically, we leased 20 guest VMs from the us-east-1b availability zone in the US-East region. 10 VMs are m1.medium instances and the remaining 10 are m1.small instances. We boot the VMs with Ubuntu 11.10 Amazon Machine Image (AMI). Each VM has an 8 GB standard Elastic Block Store (EBS) volume attached to it. We harness the m1.medium VMs to host the MySQL server since anm1.medium VM has a greater request handlingcapacity than a m1.small VM. This behavior aids in generating a representative query profile. CWG runs inside the m1.small VMs. In this study, we profile the benchmark complex query presented in Figure 4. Innodb buffer pool cache is turned off by setting the value of γ to 0. Also, we increase λ in increments of 4 starting at 4 req/sec until θ in the VM is less than 100%. A. Database population from the script
In this set of experiments, database is populated using the population script for Sdefault. As depicted in Figure 12(a), for λ higher than 12 req/sec, τ of VMs 2 and 10 differs significantly from the rest of the VMs. Also, for a request rate of 20 req/sec, query exhibits a τse of 173 msec in VM 5. Figure 12(b) presents the mean and the standard error of θmean for all the VMs. Similar to the experiments in section III, query performance varies significantly, both across the guest VMs and between repeated runs on the same guest VM. B. Database population from the snapshot
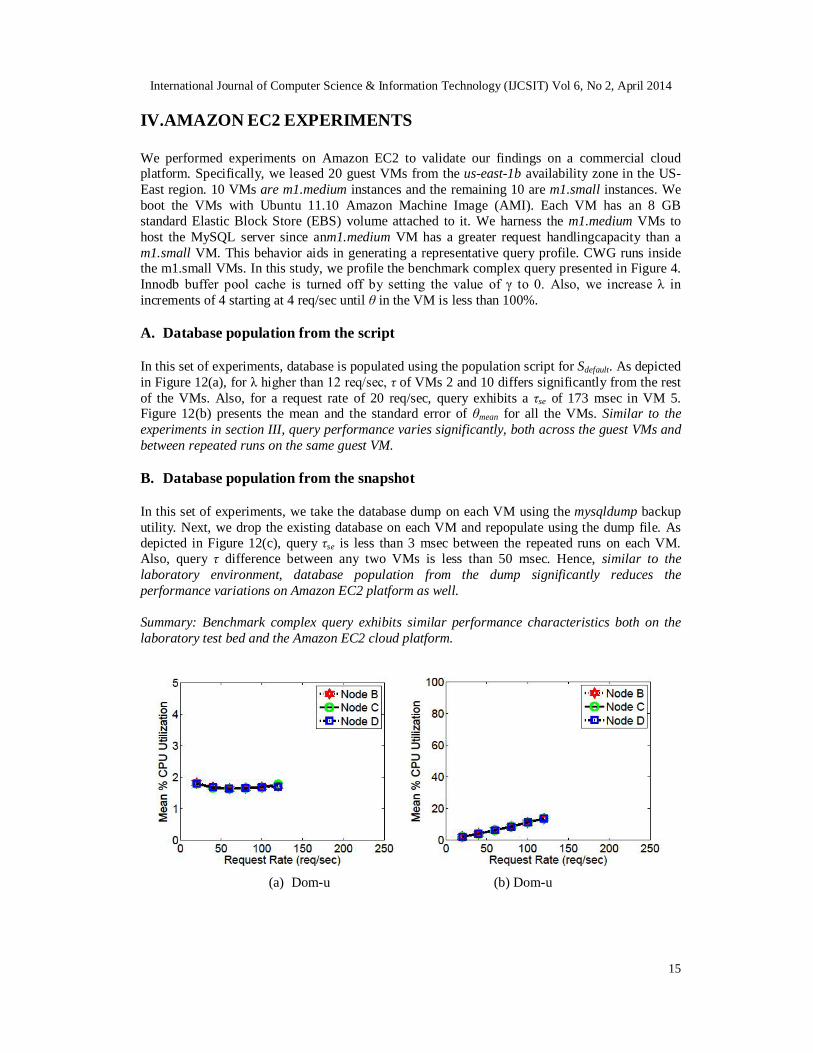
In this set of experiments, we take the database dump on each VM using the mysqldump backup utility. Next, we drop the existing database on each VM and repopulate using the dump file. As depicted in Figure 12(c), query τse is less than 3 msec between the repeated runs on each VM. Also, query τ difference between any two VMs is less than 50 msec. Hence, similar to the laboratory environment, database population from the dump significantly reduces the performance variations on Amazon EC2 platform as well. Summary: Benchmark complex query exhibits similar performance characteristics both on the laboratory test bed and the Amazon EC2 cloud platform.
(a) Dom-u (b) Dom-u
International Journal of Computer Science & Information Technology (IJCSIT) Vol 6, No 2, April 2014
16
(c) Dom-0 (d) Dom-0
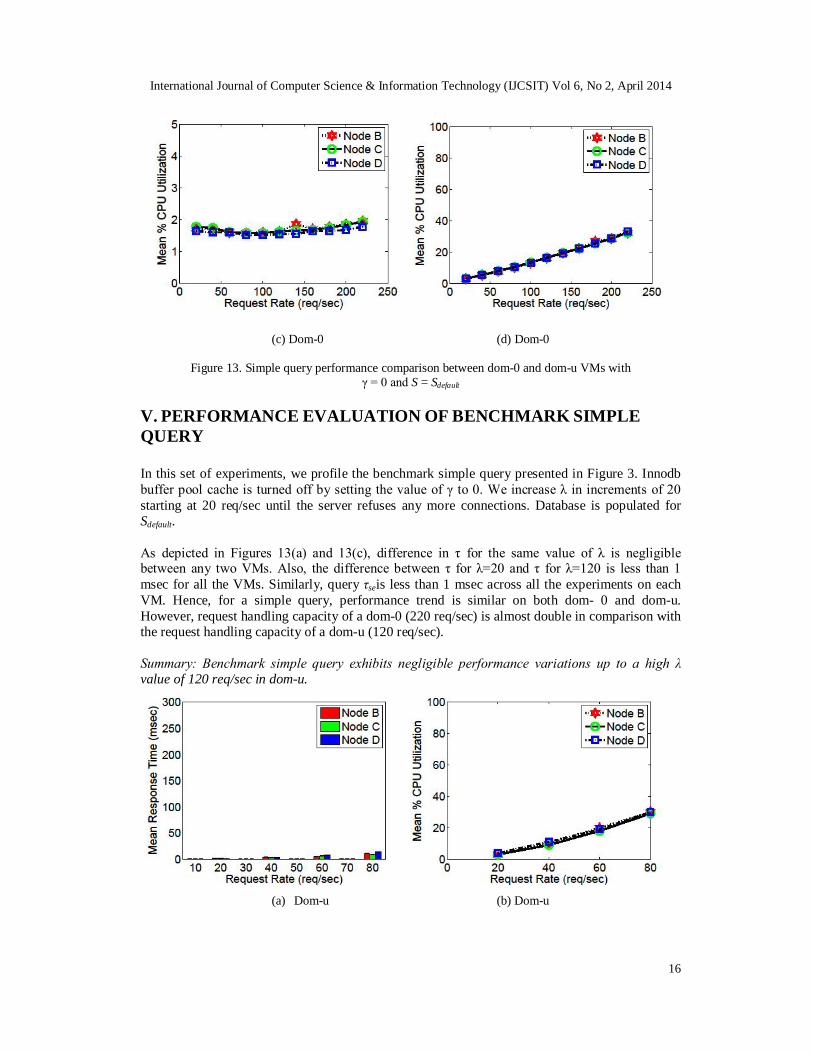
Figure 13. Simple query performance comparison between dom-0 and dom-u VMs with γ = 0 and S = Sdefault
V. PERFORMANCE EVALUATION OF BENCHMARK SIMPLE QUERY In this set of experiments, we profile the benchmark simple query presented in Figure 3. Innodb buffer pool cache is turned off by setting the value of γ to 0. We increase λ in increments of 20 starting at 20 req/sec until the server refuses any more connections. Database is populated for Sdefault. As depicted in Figures 13(a) and 13(c), difference in τ for the same value of λ is negligible between any two VMs. Also, the difference between τ for λ=20 and τ for λ=120 is less than 1 msec for all the VMs. Similarly, query τseis less than 1 msec across all the experiments on each VM. Hence, for a simple query, performance trend is similar on both dom- 0 and dom-u. However, request handling capacity of a dom-0 (220 req/sec) is almost double in comparison with the request handling capacity of a dom-u (120 req/sec). Summary: Benchmark simple query exhibits negligible performance variations up to a high λ value of 120 req/sec in dom-u.
(a) Dom-u (b) Dom-u
International Journal of Computer Science & Information Technology (IJCSIT) Vol 6, No 2, April 2014
17
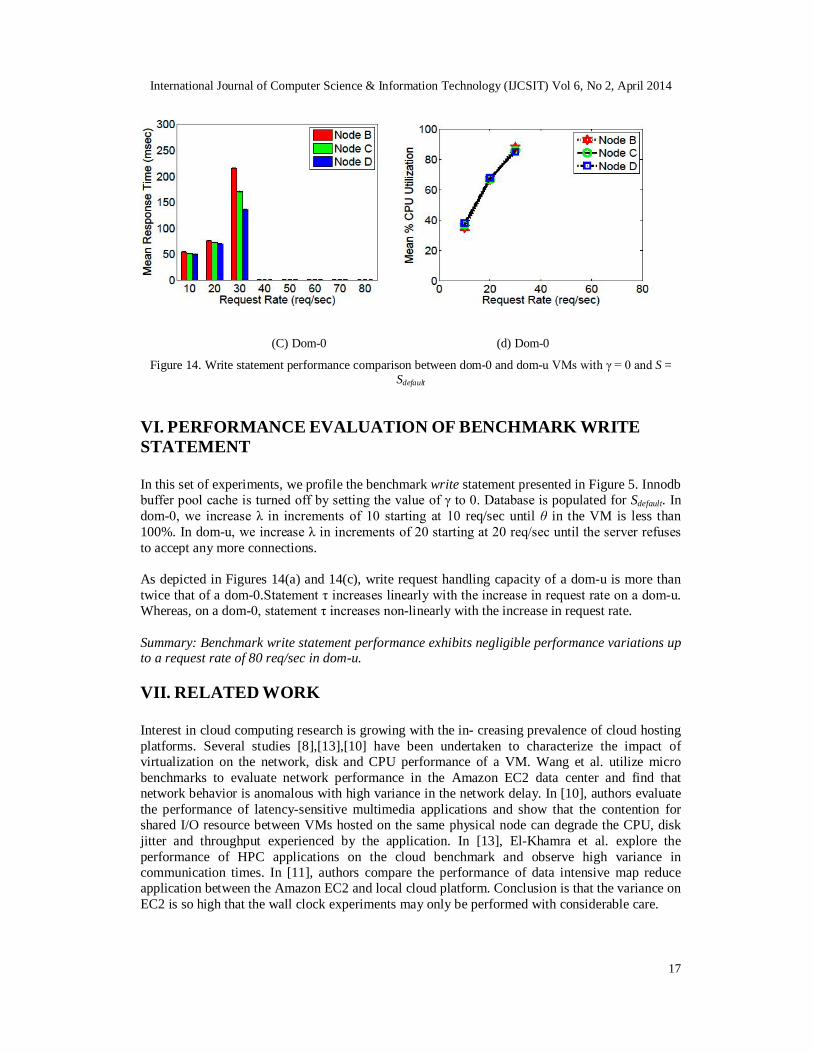
(C) Dom-0 (d) Dom-0
Figure 14. Write statement performance comparison between dom-0 and dom-u VMs with γ = 0 and S = Sdefault
VI. PERFORMANCE EVALUATION OF BENCHMARK WRITE STATEMENT In this set of experiments, we profile the benchmark write statement presented in Figure 5. Innodb buffer pool cache is turned off by setting the value of γ to 0. Database is populated for Sdefault. In dom-0, we increase λ in increments of 10 starting at 10 req/sec until θ in the VM is less than 100%. In dom-u, we increase λ in increments of 20 starting at 20 req/sec until the server refuses to accept any more connections. As depicted in Figures 14(a) and 14(c), write request handling capacity of a dom-u is more than twice that of a dom-0.Statement τ increases linearly with the increase in request rate on a dom-u. Whereas, on a dom-0, statement τ increases non-linearly with the increase in request rate. Summary: Benchmark write statement performance exhibits negligible performance variations up to a request rate of 80 req/sec in dom-u. VII. RELATED WORK Interest in cloud computing research is growing with the in- creasing prevalence of cloud hosting platforms. Several studies [8],[13],[10] have been undertaken to characterize the impact of virtualization on the network, disk and CPU performance of a VM. Wang et al. utilize micro benchmarks to evaluate network performance in the Amazon EC2 data center and find that network behavior is anomalous with high variance in the network delay. In [10], authors evaluate the performance of latency-sensitive multimedia applications and show that the contention for shared I/O resource between VMs hosted on the same physical node can degrade the CPU, disk jitter and throughput experienced by the application. In [13], El-Khamra et al. explore the performance of HPC applications on the cloud benchmark and observe high variance in communication times. In [11], authors compare the performance of data intensive map reduce application between the Amazon EC2 and local cloud platform. Conclusion is that the variance on EC2 is so high that the wall clock experiments may only be performed with considerable care.
International Journal of Computer Science & Information Technology (IJCSIT) Vol 6, No 2, April 2014
18
In [12],[9], authors have reported performance difference between VMs of the same abstract type in data centers like Amazon EC2. Authors have credited the difference in performance to the placement of VMs and the heterogeneous hardware in evolving data centers like Amazon EC2. VIII. CONCLUSION AND FUTURE WORK In this work, we demonstrate novel performance variations across repeated runs of a dom-u and between dom-u’s created equal on homogeneous hardware. We systematically investigate and identify disk I/O as the origin of variations. In addition, we show that it is not the Xen disk I/O subsystem, rather the MySQL storage engine which is responsible for the observed performance variations. Also, we present and evaluate a black box approach to reduce variations based on the mysqldump backup utility. Experimental results show that database population from a snapshot reduces perceived variations significantly and increases request handling capacity of a dom-u. Hence, mysqldump utility can be exploited to improve the performance of a guest VM on the cloud platform. However, as a downside, database remains offline during the repopulation phase. We also evaluate the impact of different cache allocations on the database performance. In future, we would like to examine the MySQL server code base to identify and overcome the root cause of observed variations. REFERENCES [1] “Amazon elastic compute cloud (amazon ec2).” [Online]. Available: http://aws.amazon.com/ec2/ [2] P. Barham, B. Dragovic, K. Fraser, S. Hand, T. Harris, A. Ho, R. Neuge- bauer, I. Pratt, and A.
Warfield, “Xen and the art of virtualization,” in SOSP ’03. [3] P. Xiong, Y. Chi, S. Zhu, H. J. Moon, C. Pu, and H. Hacigumus, “Intelligent management of
virtualized resources for database systems in cloud environment,” in ICDE ’11. [4] P. Padala, K. G. Shin, X. Zhu, M. Uysal, Z. Wang, S. Singhal,Merchant, and K. Salem,
“Adaptive control of virtualized resources in utility computing environments,” in EuroSys ’07. [5] B. Urgaonkar and A. Chandra, “Dynamic provisioning of multi-tier internet applications,” in ICAC
’05. [6] B. Urgaonkar, G. Pacifici, P. Shenoy, M. Spreitzer, and A. Tantawi, “An analytical model for multi-
tier internet services and its applications,” SIGMETRICS Perform. Eval. Rev. [7] Y. Chen, S. Iyer, D. Milojicic, and A. Sahai, “A systematic and practical approach to generating
policies from service level objectives,” in IM’09. [8] G. Wang and T. S. E. Ng, “The impact of virtualization on network performance of amazon ec2
datacenter,” in INFOCOM’10. [9] B. Farley, A. Juels, V. Varadarajan, T. Ristenpart, K. D. Bowers, and M. M. Swift, “More for your
money: exploiting performance heterogeneity in public clouds,” in SoCC ’12. [10] S. K. Barker and P. Shenoy, “Empirical evaluation of latency-sensitive application performance in the
cloud,” in MMSys ’10. [11] J. Schad, J. Dittrich, and J.-A. Quiane´-Ruiz, “Runtime measurements in the cloud: observing,
analyzing, and reducing variance,” Proc. VLDB Endow. [12] M. S. Rehman and M. F. Sakr, “Initial findings for provisioning variation in cloud computing,” in
CLOUDCOM ’10. [13] Y. El-Khamra, H. Kim, S. Jha, and M. Parashar, “Exploring the performance fluctuations of hpc
workloads on clouds,” in CLOUDCOM ’10. [14] “Transaction processing performance council. tpc-w benchmark.” [Online]. Available:
http://www.tpc.org/tpcw/ [15] “Mysql, the worlds most popular open source database.” [Online]. Available:
http://www.mysql.com/ [16] “Mysql: From wikipedia, the free encyclopedia.” [Online].
Available:https://en.wikipedia.org/wiki/MySQL

International Journal of Computer Science & Information Technology (IJCSIT) Vol 6, No 2, April 2014
19
[17] “How twitter stores 250 million tweets a day using mysql.” [Online]. Available: http://highscalability.com/blog/2011/12/19/how- twitter-stores-250-million-tweets-a-day-using-mysql.html
[18] P. Chaganti, Xen Virtualization: A fast and practical guide to supporting multiple operating systems with the Xen hypervisor. Packt Publishing, 2007.
[19] “Poisson process.” [Online]. Available: http://en.wikipedia.org/wiki/Poisson process [20] “Mysql: Explain syntax.” [Online]. Available: http://dev.mysql.com/doc/refman/5.0/en/explain.html [21] “Mysql: The innodb buffer pool.” [Online]. Available:
http://dev.mysql.com/doc/refman/5.5/en/innodb-buffer-pool.html